Embed Size (px)
Citation preview

OXFORD CAMBRIDGE AND RSA EXAMINATIONS
General Certificate of Secondary Education
GEOGRAPHY SPECIFICATION A 1986/1PAPER 1 FOUNDATION TIER
Monday 5 JUNE 2006 Morning 2 hours
Candidates answer on the question paper.Additional materials:
Resource Booklet (1986/1086/1,2/RB) – inserted
TIME 2 hours
INSTRUCTIONS TO CANDIDATES
Write your name, Centre number and candidate number in the boxes above.
Answer all questions.
Write your answers in the spaces provided on the question paper.
INFORMATION FOR CANDIDATES
The number of marks is given in brackets [ ] at the end of each question or part question.
You will be awarded marks for the quality of written communication.
The total number of marks for this paper is 80.
Additional answer space is available on the lined pages 19 and20 at the back of the book. Answers on these pages must beclearly numbered.
The following initials are used throughout this paper:
EU – European Union
LEDC – Less Economically Developed Country
MEDC – More Economically Developed Country.
This question paper consists of 18 printed pages, 2 lined pages and 1 Resource Booklet.
SP (DR/DR) T06849/4© OCR 2006 [100/0941/3] Registered Charity Number: 1066969 [Turn over
CandidateCentre Number NumberCandidate Name
FOR EXAMINER’S USE
Question 1
Question 2
Question 3
Question 4
Sub-Total
QWC
TOTAL
2
1986/1 Jun06
UNIT 1 PEOPLE AND THE PHYSICAL WORLD
1 (a) Study Fig. 1a.
Mid-Atlantic Ridge
Fig. 1a
(i) Name the volcanic island located furthest away from the Mid-Atlantic Ridge.
]1[........................................................
(ii) Describe the distribution of the other volcanic islands shown on the map.
............................................................................................................................... ...
..............................................................................................................................[1]
(iii) Explain why there are no active volcanoes in the U.K.
............................................................................................................................... ...
..............................................................................................................................[1]
ForExaminer’s
Use
A map has been removed due to third party copyright restrictions
Details:
A map showing the location of the Mid-Atlantic Ridge

3
1986/1 Jun06 [Turn over
(b) Study Fig. 1b.
Volcanoes in Iceland
Fig. 1b
Use Fig. 1b to explain why there are major volcanoes in Iceland. You may include alabelled diagram.
............................................................................................................................... ...........
............................................................................................................................... ...........
............................................................................................................................... ...........
............................................................................................................................... ...........
............................................................................................................................... ...........
............................................................................................................................... ...........
............................................................................................................................... ...........
............................................................................................................................... ...........
[4]
ForExaminer’s
Use
A diagram has been removed due to third party copyright restrictions
Details:
A diagram showing a cross section of a volcano in Iceland

4
1986/1 Jun06
(c) Study the table below which shows information about two volcanoes.
Suggest three reasons for the difference in the number of people who had to leave theirhomes.
1 .......................................................................................................................................
..........................................................................................................................................
2 .......................................................................................................................................
..........................................................................................................................................
3 .......................................................................................................................................
......................................................................................................................................[3]
(d) For a named volcano you have studied, describe the effects of an eruption.
Name of volcano: ..........................................................
Effects: .............................................................................................................................
..........................................................................................................................................
..........................................................................................................................................
..........................................................................................................................................
..........................................................................................................................................
..........................................................................................................................................
..........................................................................................................................................
..........................................................................................................................................
..........................................................................................................................................
......................................................................................................................................[5]
Year oferuption
2002 LEDC 400000Mount
Nyiragongo
DemocraticRepublic of
Congo, Africa
2002 MEDC 300MountEtna
Italy,Europe
Name ofvolcano
Location Level ofdevelopment
Number ofpeople who had to leave their homes
ForExaminer’s
Use

5
1986/1 Jun06 [Turn over
(e) What are the benefits of living near volcanoes?
..........................................................................................................................................
..........................................................................................................................................
..........................................................................................................................................
..........................................................................................................................................
..........................................................................................................................................
..........................................................................................................................................
..........................................................................................................................................
......................................................................................................................................[4]
[Total: 19]
ForExaminer’s
Use

6
1986/1 Jun06
UNIT 2 PEOPLE AND PLACES TO LIVE
2 (a) Study Fig. 2a, opposite.
(i) Complete the table below by writing the names of these three countries in thecorrect positions.
China Mexico Vietnam
Top five countries where migrants came from to live in the USA in 2000.
[2]
(ii) Use the information in Fig. 2a to give an example of each of the following:
An LEDC from which over 10,000 people migrated to the USA in 2000
........................................................
An MEDC from which over 10,000 people migrated to the USA in 2000
........................................................ [1]
(iii) Look again at Fig. 2a. Describe two features of the pattern of migration to the USA in 2000.
1 ...............................................................................................................................
..................................................................................................................................
2 ...............................................................................................................................
..............................................................................................................................[2]
1.
2.
3.
4.
Philippines
India
5.
Most migrants
Least migrants
ForExaminer’s
Use

7
1986/1 Jun06 [Turn over
Map
of n
umbe
r of m
igra
nts
to th
e U
SA fr
om s
elec
ted
coun
trie
s in
200
0
Fig.
2a
A map has been removed due to third party copyright restrictions.
Details:
A map showing imigration to the USA from surrounding countries.

8
1986/1 Jun06
(iv) Many people who have migrated to MEDCs, such as the USA, still end up with apoor quality of life. Suggest two reasons for this.
1 ...............................................................................................................................
............................................................................................................................... ...
2 ...............................................................................................................................
..............................................................................................................................[2]
(b) Suggest the bene�ts and disadvantages for MEDCs of large numbers of peoplemigrating to them from other countries.
Bene�ts to the country .....................................................................................................
............................................................................................................................... ...........
............................................................................................................................... ...........
............................................................................................................................... ...........
Problems for the country ..................................................................................................
............................................................................................................................... ...........
............................................................................................................................... ...........
............................................................................................................................... .......[4]
(c) Study Fig. 2b.
Rural to urban migration
Fig. 2b
(i) What is ‘rural to urban migration’?
............................................................................................................................... ...
..............................................................................................................................[1]
ForExaminer’s
Use
An image has been removed due to third party copyright restrictions
Details:
An image showing people being pushed away from ‘the country’by a hand and pulled towards ‘the city’ by a magnet

9
1986/1 Jun06 [Turn over
(ii) Pull and push factors can be used to explain rural to urban migration. What ismeant by ‘pull and push factors’?
Pull factors ................................................................................................................
..................................................................................................................................
Push factors .............................................................................................................
..............................................................................................................................[2]
(iii) Name a city which you have studied in an LEDC. Explain why many people havemoved there from surrounding rural areas.
Name of LEDC city ........................................................
Reasons for movement ............................................................................................
..................................................................................................................................
..................................................................................................................................
..................................................................................................................................
..................................................................................................................................
..................................................................................................................................
..................................................................................................................................
..................................................................................................................................
..............................................................................................................................[5]
[Total: 19]
ForExaminer’s
Use

10
1986/1 Jun06
UNIT 3 PEOPLE AND THEIR NEEDS
3 (a) Study Fig. 3a.
Employment structure of six countries.
Fig. 3a
(i) Complete the bar for Mexico using the following figures:
Primary 30%Secondary 20%Tertiary 50% [2]
(ii) Use Fig. 3a to name:
the country where the largest percentage works in the primary sector
........................................................
the country where the same percentage is employed in the primary sector as in thetertiary sector.
........................................................ [2]
100
90
80
70
60
50
40
30
20
10
0
% of totalworkforce
Kenya
Bangla
desh
Egypt
Mex
ico
Japa
n
U.S.A
.
Key:
tertiary
secondary
primary
ForExaminer’s
Use

11
1986/1 Jun06 [Turn over
(iii) Suggest two reasons why a large percentage of the workforce are in the tertiarysector in MEDCs such as Japan.
1 ...............................................................................................................................
..................................................................................................................................
2 ...............................................................................................................................
..............................................................................................................................[2]
(b) Study Photographs C and D in the Resource Booklet.
(i) Describe two differences between the factory buildings shown in photographs Cand D.
1 ...............................................................................................................................
..................................................................................................................................
2 ...............................................................................................................................
..............................................................................................................................[2]
(ii) In which employment sector would the following people work? Circle the correctanswer for each of the three statements.
The workers in the quarries providing raw materials to be used in the factory inPhotograph C.
PRIMARY SECONDARY TERTIARY
The driver of the lorries shown in Photograph D.
PRIMARY SECONDARY TERTIARY
The people working on the production line in both factories shown in thephotographs.
PRIMARY SECONDARY TERTIARY [2]
ForExaminer’s
Use
12
1986/1 Jun06
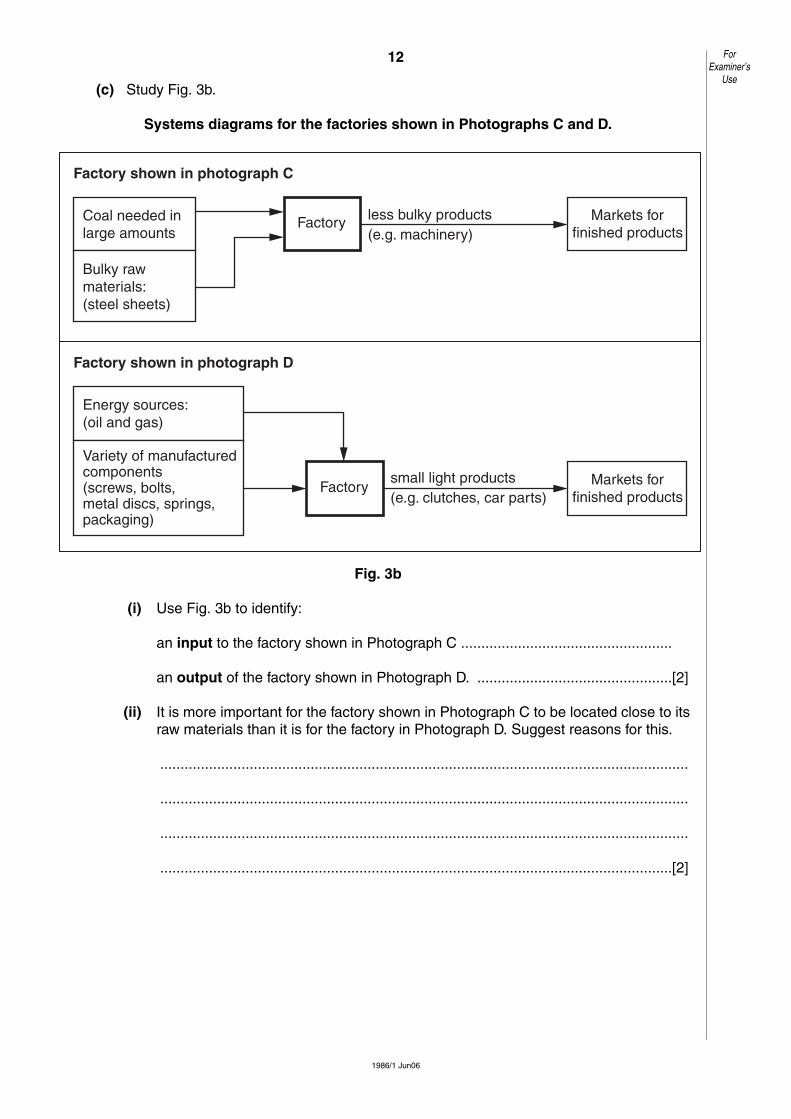
(c) Study Fig. 3b.
Systems diagrams for the factories shown in Photographs C and D.
Fig. 3b
(i) Use Fig. 3b to identify:
an input to the factory shown in Photograph C ....................................................
an output of the factory shown in Photograph D. ................................................[2]
(ii) It is more important for the factory shown in Photograph C to be located close to itsraw materials than it is for the factory in Photograph D. Suggest reasons for this.
..................................................................................................................................
..................................................................................................................................
..................................................................................................................................
..............................................................................................................................[2]
ForExaminer’s
Use
Coal needed inlarge amounts
Bulky rawmaterials:(steel sheets)
Factory Markets forfinished products
less bulky products(e.g. machinery)
Factory shown in photograph C
Energy sources:(oil and gas)
Variety of manufacturedcomponents(screws, bolts,metal discs, springs,packaging)
Factory Markets forfinished products
small light products(e.g. clutches, car parts)
Factory shown in photograph D

13
1986/1 Jun06 [Turn over
(d) In many parts of the UK distribution industries are now important.
Name and locate an example of a distribution industry which you have studied in theUK.Explain why the distribution industry is located there.
Name of distribution industry ........................................................
Location ........................................................
Reasons why the industry is located there.
..........................................................................................................................................
..........................................................................................................................................
..........................................................................................................................................
..........................................................................................................................................
..........................................................................................................................................
..........................................................................................................................................
..........................................................................................................................................
..........................................................................................................................................
......................................................................................................................................[5]
[Total: 19]
ForExaminer’s
Use

14
1986/1 Jun06
UNIT 4 PEOPLE AND THE ENVIRONMENT
4 (a) Study Fig. 4a.
Diagram of pH scale
Fig. 4a
Use the information in Fig. 4a to complete the following statement. Circle the correctanswer.
Acid rain is rainwater which has a pH value of
]1[11 9 7 5
(b) Study Fig. 4b
Fig. 4b
(i) In the box provided on Fig. 4b, label one chemical which comes from power]1[.selcihev ro snoitats
0 1 2 3 4 5 6 7 8 9 10 11 12 13 14pH values
vinegar
natural rainwater
distilled water
Increas ing acidity
ForExaminer’s
Use
A diagram has been removed due to third party copyright restrictions
Details:
A diagram showing how acid rain is formed from cars and power stations

15
1986/1 Jun06 [Turn over
(ii) How is acid rain caused?
..................................................................................................................................
..................................................................................................................................
..................................................................................................................................
..................................................................................................................................
..................................................................................................................................
..............................................................................................................................[3]
ForExaminer’s
Use

16
1986/1 Jun06
(c) Study Fig. 4c.
Sulphur depositions in selected countries of Europe(sulphur is a main deposit of acid rain)
Fig. 4c
ForExaminer’s
Use
A map has been removed due to third party copyright restrictions.
Details:
A map showing sulphur depositions in selected countries of Europe.

17
1986/1 Jun06 [Turn over
(i) Use the figures below to complete the enlarged pie chart for Finland.
[1]
(ii) Which country has the largest percentage of sulphur which comes from othercountries?
.................................................... [1]
(iii) Suggest two reasons why so much of the sulphur deposited in Sweden comesfrom other countries.
1 ...............................................................................................................................
..................................................................................................................................
2 ...............................................................................................................................
..............................................................................................................................[2]
(iv) What are the effects of acid rain in a country such as Sweden?
..................................................................................................................................
..................................................................................................................................
..................................................................................................................................
..................................................................................................................................
..................................................................................................................................
..............................................................................................................................[3]
(v) Give two ways to reduce the problems caused by acid rain.
1 ...............................................................................................................................
..................................................................................................................................
2 ...............................................................................................................................
..............................................................................................................................[2]
Percentage of sulphur produced in Finland
Percentage of sulphur which comes from other countries
25%
75%
ForExaminer’s
Use

18
1986/1 Jun06
(d) Another major environmental problem is global warming. Describe the likely effects ofglobal warming on named areas which you have studied.
..........................................................................................................................................
..........................................................................................................................................
..........................................................................................................................................
..........................................................................................................................................
..........................................................................................................................................
..........................................................................................................................................
..........................................................................................................................................
..........................................................................................................................................
..........................................................................................................................................
......................................................................................................................................[5]
[Total: 19]
ForExaminer’s
Use

19
1986/1 Jun06
If you use these lined pages to complete an answer to any question, the question number MUSTbe clearly shown.
.........................................................................................................................................................
.........................................................................................................................................................
.........................................................................................................................................................
.........................................................................................................................................................
.........................................................................................................................................................
.........................................................................................................................................................
.........................................................................................................................................................
.........................................................................................................................................................
.........................................................................................................................................................
.........................................................................................................................................................
.........................................................................................................................................................
.........................................................................................................................................................
.........................................................................................................................................................
.........................................................................................................................................................
.........................................................................................................................................................
.........................................................................................................................................................
.........................................................................................................................................................
.........................................................................................................................................................
.........................................................................................................................................................
.........................................................................................................................................................
.........................................................................................................................................................
.........................................................................................................................................................
.........................................................................................................................................................
.........................................................................................................................................................
.........................................................................................................................................................
.........................................................................................................................................................
.........................................................................................................................................................
ForExaminer’s
Use

20
1986/1 Jun06
.........................................................................................................................................................
.........................................................................................................................................................
.........................................................................................................................................................
.........................................................................................................................................................
.........................................................................................................................................................
.........................................................................................................................................................
.........................................................................................................................................................
.........................................................................................................................................................
.........................................................................................................................................................
.........................................................................................................................................................
.........................................................................................................................................................
.........................................................................................................................................................
.........................................................................................................................................................
.........................................................................................................................................................
.........................................................................................................................................................
.........................................................................................................................................................
.........................................................................................................................................................
.........................................................................................................................................................
.........................................................................................................................................................
.........................................................................................................................................................
.........................................................................................................................................................
.........................................................................................................................................................
.........................................................................................................................................................
.........................................................................................................................................................
ForExaminer’s
Use
Permission to reproduce items where third-party owned material protected by copyright is included has been sought and cleared where possible. Every reasonablee�ort has been made by the publisher (OCR) to trace copyright holders, but if any items requiring clearance have unwittingly been included, the publisher will bepleased to make amends at the earliest possible opportunity.
OCR is part of the Cambridge Assessment Group. Cambridge Assessment is the brand name of University of Cambridge Local ExaminationsSyndicate (UCLES), which is itself a department of the University of Cambridge.