Embed Size (px)
Citation preview

This document consists of 11 printed pages, 1 blank page and an insert.
SPA (DR) S83310/3© UCLES 2005 [Turn over
UNIVERSITY OF CAMBRIDGE INTERNATIONAL EXAMINATIONSInternational General Certificate of Secondary Education
GEOGRAPHY 0460/01
Paper 1May/June 2005
1 hour 45 minutesAdditional Materials: Answer Booklet/Paper;
Ruler
READ THESE INSTRUCTIONS FIRST
If you have been given an Answer Booklet, follow the instructions on the front cover of the Booklet.Write your Centre number, candidate number and name on all the work you hand in.Write in dark blue or black pen on both sides of the paper.You may use a soft pencil for any diagrams, graphs or rough working.Do not use staples, paper clips, highlighters, glue or correction fluid.
Answer three questions.At the end of the examination, fasten all your work securely together.The number of marks is given in brackets [ ] at the end of each question or part question.Sketch maps and diagrams should be drawn whenever they serve to illustrate an answer.The insert contains Photograph A for Question 3 and Photograph B for Question 4.
PMT

2
0460/01/M/J05
1 (a) Study Fig. 1, a map of the world which shows areas of high and low population density.
Fig. 1
(i) What is the type of natural environment in the area labelled X? [1]
(ii) Choose either area Y or Z. Write down the letter of the area which you have chosen andgive two reasons why the population density is low in that area. [2]
(iii) Describe the distribution of the areas of high population density (over 100 people persquare kilometre). [3]
© UCLES 2005
Low (less than one person per km2)
High (over 100 people per km2)
Tropic ofCancer
Tropic ofCapricorn
Equator
ArcticCircleZ
YX
PMT

3
0460/01/M/J05 [Turn over
(b) Study Fig. 2 which shows how two types of migration change as a country developseconomically.
Fig. 2
(i) Briefly describe the changes which take place in each type of migration as a countrydevelops. [3]
(ii) Choose one type of migration shown by Fig. 2. Write down the type of migration whichyou have chosen and explain why the amount of migration changes with economicdevelopment. [4]
(iii) Describe the positive and negative effects which the migration of large numbers ofpeople may have on the area to which they move. [5]
(c) The migration of people can be explained in terms of the pull and push factors whichinfluenced their decision to migrate.
Examples of types of migration include:
international and internal migration,forced and voluntary migration,permanent and seasonal migration.
Choose any example of migration and name the areas between which people moved. Explainwhy many people made the decision to migrate. You should refer both to pull and to pushfactors. [7]
High
LowLow High
Economic development
Amountof
migration
INTERNATIONAL MIGRATION
High
LowLow High
Economic development
Amountof
migration
RURAL TO URBAN MIGRATION
© UCLES 2005
PMT
4
0460/01/M/J05
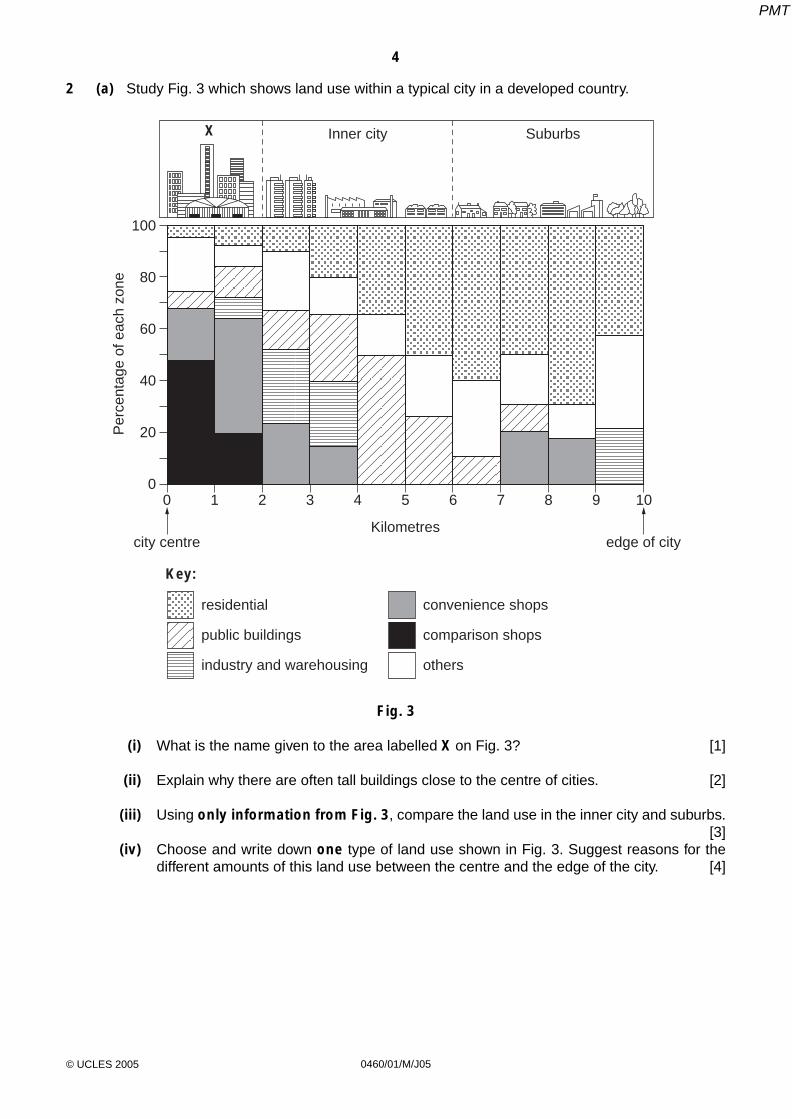
2 (a) Study Fig. 3 which shows land use within a typical city in a developed country.
Fig. 3
(i) What is the name given to the area labelled X on Fig. 3? [1]
(ii) Explain why there are often tall buildings close to the centre of cities. [2]
(iii) Using only information from Fig. 3, compare the land use in the inner city and suburbs. [3]
(iv) Choose and write down one type of land use shown in Fig. 3. Suggest reasons for thedifferent amounts of this land use between the centre and the edge of the city. [4]
100
80
60
40
20
00 1 2 3 4 5
Kilometres
6 7 8 9 10
X Inner city Suburbs
city centre edge of city
Per
cent
age
of e
ach
zone
residential
public buildings
industry and warehousing
convenience shops
comparison shops
others
Key:
© UCLES 2005
PMT

5
0460/01/M/J05 [Turn over
(b) Study Fig. 4, a model showing the variation in quality of life in cities in developed anddeveloping countries.
Fig. 4
(i) Briefly describe what the model shows about the variations in quality of life in cities indeveloping and developed countries. [3]
(ii) How accurate do you think this model is? Explain your answer by referring to cities inboth developed and developing countries. [5]
(c) In all large urban areas there have been changes in land use in recent years.
These include the development of:
road networks,residential areas,industrial areas,leisure and shopping facilities.
For a named urban area, identify a recent change in land use.Describe the advantages and disadvantages of this development for people who live in theurban area which you have named. [7]
city centre edge of city
Qualityof life
high
low
Developed
Developing
© UCLES 2005
PMT

6
0460/01/M/J05
3 (a) Study Photograph A (Insert), which shows a glacier.
(i) In what type of environment was this photograph taken? [1]
(ii) Use evidence from the photograph to explain why glaciers form in such environments.[2]
(iii) Describe the main features of the glacier shown by the photograph. [3]
(iv) Describe the natural processes by which a glacier, such as the one shown in PhotographA, is likely to shape the landscape. [4]
(b) Study Fig. 5 which shows a landscape which has been shaped by glaciation.
Fig. 5
(i) Identify the landforms labelled X, Y and Z on Fig. 5. [3]
(ii) Choose one of the landforms which you have identified in (i) and explain how it has beenformed. You may use labelled diagrams in your answer. [5]
(c) People live and work in areas such as those shown by Fig. 5, which have been glaciated.
Describe the advantages and the difficulties for people who live in glaciated upland areas.You may refer to examples which you have studied. [7]
X
Y
Z
© UCLES 2005
PMT

7
0460/01/M/J05 [Turn over
4 (a) Study Photograph B (Insert).
(i) In what type of climatic region was this photograph taken? [1]
(ii) Suggest two reasons for the absence of vegetation in the area shown by thephotograph. [2]
(iii) Describe the main features of the landscape in the area shown by the photograph. [3]
(iv) Explain how natural processes shape the landscape in this type of climatic region. [4]
(b) Study Fig. 6 which shows the climate at three locations in Africa.
Fig. 6
(i) Describe three differences between the climates of Abidjan and Ouagadougou. [3]
(ii) Explain why desert areas, such as In Salah, are hot and dry. You may use labelleddiagrams or sketch maps in your answer. [5]
(c) Many parts of the area shown in Fig. 6 are at risk from desertification. This can be defined as‘the spread of desert-like conditions into semi-arid regions’. It can be caused by:
climatic change such as global warming,poor farming practices,the removal of natural vegetation.
Describe the problems experienced by people living in areas at risk from desertification.You may refer to examples which you have studied. [7]
N
S A H A R A D E S E R TS A H A R A D E S E R T
T H E S A H E L
S A H A R A D E S E R T
T H E S A H E L
0 1000
km
desert
Key:
areas at risk from desertification
In SalahTemp (°C) Rain (mm)
15
20
25
30
35
10
0
20
30
40
50
40
J F M A M J J A S O N DMonth
AbidjanTemp (°C) Rain (mm)
15
20
25
100
0
200
300
400
500
30
J F M A M J J A S O N DMonth
OuagadougouTemp (°C) Rain (mm)
20
15
25
30
100
0
200
300
400
500
35
J F M A M J J A S O N DMonth
© UCLES 2005
PMT

8
0460/01/M/J05
5 (a) Study Fig. 7 which shows information about different farming systems.
Fig. 7
(i) Give one example of an extensive farming system which is shown on Fig. 7. [1]
(ii) What is meant by the terms:
A subsistence farming,
B commercial farming? [2]
(iii) Identify the following types of farming A, B and C. You should use only the farmingsystems named in the boxes in Fig. 7.
A The growing of fruits, vegetables and salad crops on small scale intensive farms.
B A system of monoculture in tropical areas, using large areas of land.
C The farmer moves every few years to another plot to grow crops such as manioc andcassava. [3]
(iv) Describe the differences between intensive and extensive farming. [4]
Extensive Intensive
DairyingDairying
NomadicNomadicherdingherding
ShiftingShiftingcultivationcultivation
RanchingRanching CommercialCommerciallivestocklivestock
CommercialCommercialmixedmixed
SubsistenceSubsistencecropscrops
MarketMarketgardeninggardening
PlantationsPlantations
Dairying
Nomadicherding
Shiftingcultivation
Ranching Commerciallivestock
Commercialmixed
CommercialCommercialgrainsgrains
Commercialgrains
Subsistencecrops
Marketgardening
Plantations
Profits per hectare increase
Average yields per hectare increase
Number of workers per hectare increases
Area of land used increases
© UCLES 2005
PMT

9
0460/01/M/J05 [Turn over
(b) Study Fig. 8 which shows land use around a village in the Gambia.
Fig. 8
(i) Describe the pattern of land use around the village shown in Fig. 8. [3]
(ii) Suggest reasons for the land use pattern around the village shown in Fig. 8. [5]
(c) There is large scale famine in some developing countries.
This may be they result of:
physical factors,economic factors,political factors.
Explain why there are food shortages in some parts of the world.You may refer to examples which you have studied. [7]
250m250m
500m500m
1000m1000m
1500m1500m
250m
500m
1000m
1500m
village
savanna(grass & trees)
vegetables & millet(food crops)
groundnuts (cash crop)
fallow
roads
Key:
© UCLES 2005
PMT

10
0460/01/M/J05
6 (a) Study Fig. 9 which shows how water is used in different countries.
Fig. 9
(i) What is meant by domestic use of water? [1]
(ii) Name the countries listed on Fig. 9 which use the largest proportion of water for:
A industry,
B agriculture. [2]
(iii) Use the information in Fig. 9 to compare the use of water in developed and developingcountries. [3]
(iv) Suggest reasons for the variation in the use of water between developed and developingcountries. [4]
0 20 40 60 80 100percentage use of water
USA
Canada
Finland
Panama
India
China
Developedcountries
Developingcountries
domestic
industry
electricity
agriculture
Key:
© UCLES 2005
PMT

11
0460/01/M/J05
(b) Study Fig. 10 which shows areas of the world which have more water than they need (asurplus) and those where there is a shortage.
Fig. 10
(i) Describe the distribution of areas where there is a shortage of water. [3]
(ii) Suggest reasons why some areas have a shortage of water whereas others have asurplus. [5]
(c) Water resources need careful management.
The following methods can be used to obtain a reliable supply of water:
large scale dam building,desalination plants,boreholes/wells,cloud seeding.
Describe the advantages and disadvantages of one of these methods.You may refer to an example which you have studied. [7]
Key:
surplus
shortage
© UCLES 2005
PMT

12
0460/01/M/J05
BLANK PAGE
© UCLES 2005
Copyright Acknowledgements:
Fig. 6, Question 4. © S. Catlin; Outset Geography; Copymasters Bk. 2; Oliver & Boyd; 1988.Fig. 10, Question 6. © Brian Knapp, Simon Ross, Duncan McCrae: The Challenge of the Natural Environment (Advanced Geographies S.); Longman; 1989.Photograph A. S. Sibley © UCLES.Photograph B. S. Sibley © UCLES.
Permission to reproduce items where third-party owned material protected by copyright is included has been sought and cleared where possible. Everyreasonable effort has been made by the publisher (UCLES) to trace copyright holders, but if any items requiring clearance have unwittingly been included, thepublisher will be pleased to make amends at the earliest possible opportunity.
University of Cambridge International Examinations is part of the University of Cambridge Local Examinations Syndicate (UCLES), which is itself a department ofthe University of Cambridge.
PMT