Embed Size (px)
Citation preview

| 79 |
| 62/1 |
RECE
NZIRA
NI ČL
ANKI
| PEE
R-RE
VIEW
ED AR
TICLE
S
VG 2
01
8
GEODETSKI VESTNIK | letn. / Vol. 62 | št. / No. 1 |
ABSTRACT IZVLEČEK
KLJUČNE BESEDE KEY WORDS
SI | E
N
ABSTRACT IZVLEČEK
gravity, density, topographic masses, terrain, terrain correction, Serbia
težnost, gostota, topografske mase, terenski popravek, Srbija
UDK: 528.2:528.221(497.11) Klasifikacija prispevka po COBISS.SI: 1.01
Prispelo: 10. 10. 2017Sprejeto: 25. 1. 2018
DOI: 10.15292/geodetski-vestnik.2018.01.79-97SCIENTIFIC ARTICLEReceived: 10. 10. 2017Accepted: 25. 1. 2018
Oleg R. Odalović, Sanja M. Grekulović, Miroslav Starcević , Dobrica Nikolić,Miljana S. Todorović Drakul, Danilo Joksimović
RAČUNANJE TERENSKEGA POPRAVKA NA PODLAGI DIGITALNEGA MODELA
GOSTOTE TOPOGRAfSKIH MAS
TERRAIN CORRECTION COMPUTATIONS USING DIGITAL DENSITY MODEL Of TOPOGRAPHIC MASSES
This paper presents the determination of terrain correction by the means of the Digital Density Model (DDM) of topographic masses (Earth’s crust mass above the geoid) for the territory of Serbia. The DDM is determined using the Digital Terrain Model (DTM) with the resolution of 30 m, basic geological map of Serbia, and a set of hypotheses on the density of the Earth’s crust masses. The assumption that the general lithosphere density over the territory of Serbia ranges between 2200 kg/m3 and 2800 kg/m3 was adopted. Terrain correction is determined at 5765 points, with relatively uniform distribution over the territory of Serbia. The calculations had also included comparing the values obtained therein to the terrain corrections obtained when accepting the hypothesis of constant lithosphere density of 2670 kg/m3. Results of comparison highlight that the differences of terrain correction values ranging from –1.31 mGal to 0.73 mGal, along with 98 % of differences falling within the range of ±0.2 mGal.
V članku predstavljamo postopek računanja terenskega popravka za območje Srbije na temelju tako imenovanega digitalnega modela gostote DMG (angl. Digital Density Model) topografskih mas, to je mas Zemljine skorje nad ploskvijo geoida. DMG je bil določen na podlagi digitalnega modela reliefa (DMR) ločljivosti 30 x 30 metrov in osnovne geološke karte Srbije, ob tem pa smo upoštevali domneve o gostoti mas Zemljine skorje na obravnavanem območju. Predpostavljali smo, da je gostota litosferskih mas na območju Srbije med 2200 kg/m3 in 2800 kg/m3. Terenski popravek smo izračunali v 5765 točkah, ki so enakomerno razporejene po območju Srbije. V raziskavi smo tudi primerjali tako pridobljene rezultate s popravki modela terena, ko smo predpostavili, da je gostota litosfere na študijskem območju enaka in znaša 2670 kg/m3. Rezultati primerjalne analize so pokazali, da se terenski popravki razlikujejo od –1,31 mGal do 0,73 mGal, pri čemer pa je 98 % izračunanih razlik v intervalu ±0,2 mGal.
Oleg R. Odalović, Sanja M. Grekulović, Miroslav Starcević, Dobrica Nikolić, Miljana S. Todorović Drakul, Danilo Joksimović | RAČUNANJE TERENSKEGA POPRAVKA NA PODLAGI DIGITALNEGA MODE-LA GOSTOTE TOPOGRAFSKIH MAS | TERRAIN CORRECTION COMPUTATIONS USING DIGITAL DENSITY MODEL OF TOPOGRAPHIC MASSES | 79-97 |
GV_2018_1_Strokovni-del.indd 79 9.4.2018 16:06:04

| 80 || 80 || 80 |
| 62/1 | GEODETSKI VESTNIK
RECE
NZIRA
NI ČL
ANKI
| PEE
R-RE
VIEW
ED AR
TICLE
SSI
| EN
1 inTroduCTion
In geodetic research, the gravitational effects of topographic masses need to be considered when resolving the Geodetic Boundary Value Problem, i.e. when determining geoid or quasigeoid. Detailed problem description and review of numerous published papers covering years of research on this topic was given in Tziavos and Sideris (2013). The gravitational effects of topographic masses are dominant at the level of short wavelength characteristics of the gravitatioÄgrennal signal spectrum, i.e. it is directly account-able for determining geoid or quasigeoid at the centimetre accuracy level. Thus far, geoid or quasigeoid had been determined in Serbia twice. Both solutions were presented in detail in Odalović (2008) and Ägren et al. (2011). Both determinations above use remove–restore procedure (Forsberg, 1993), treat-ing the gravitational effect of topographic masses by the means of the Residual Terrain Model (RTM) (Forsberg and Tscherning, 1981), with formal and final calculation being performed by directly applying the expression for the gravitational effect of right rectangular prisms (Nagy et al., 2000), along with a set of approximate expressions as shown in Li (1993). Both geophysical and geodetic treatments of the gravitational effect of topographic masses often assume average lithosphere mass density value of 2670 kg/m3, due to unknown distribution of densities. Both determinations of geoid/quasi-geoid above use this particular value, assuming lithosphere masses are equal as per densities. Tziavos and Featherstone (2000) and Olugbenga (2000) in their own researches for the district of West Australia and the territory of Canada, respectively, showed that using more realistic lithosphere density distribution may signifi-cantly improve the gravitational effect of topographic masses modelling. In both researches, authors use some relatively simple density model of the upper part of lithosphere in order to include the effects of density anomalies in good modelling procedures. In many of other papers dedicated to the effect of density anomalies authors starts their treatment of density anomalies by creating of a digital model of the density distribution or Surface Density Maps (SDM), according to already existing geological maps and some additional information on the density of lithosphere. For example, one of such an SDM was shown in Tenzer et al. (2011) where their creation was performed on the basis of the geological maps and huge number of wet density values. The SDM was created in a regular grid with resolution of 1 x 1 arc minutes. Within this research, there was no any kind of modelling of densities between the surface of the Earth down to the geoid itself. Another example of SDM is shown in Huang et al. (2001) where 2D geological map of Canada was used for creating of SDM for the area of the Canadian Rocky Mountains. SDM was created in the form of regular grid with resolution of 30 x 60 arc seconds. The distribution of the densities down to the geoid was treated only lateral on the basis of the surface densities. The use of the SDM in geoid determination was also showed in Kühtreiber (1998). In this paper, author used SDM to adopt density value by using RTM reduction (Forsberg and Tscherning, 1981) with the aid of (modified) well known TC-program (Forsberg, 1984). As in the last two cases, for the densities of masses down to the geoid, surface density value was adopted.
Over the territory of Serbia, density of masses of physical Earth’s surface is in the range from 2200 kg/m3 to 2800 kg/m3, that significantly deviates from the average value of lithosphere mass density. In the northern parts of Serbia, covering 30% of the total territory of Serbia, mass densities are nearly homogeneous at 2200 kg/m3, while the mass densities at the southern part reach the value of 2800 kg/m3 (Dimitrijević et al., 1970). This paper presents the first results of the research regarding the effect of different lithosphere densities on the value of terrain correction for the territory of Serbia, according to
Oleg R. Odalović, Sanja M. Grekulović, Miroslav Starcević, Dobrica Nikolić, Miljana S. Todorović Drakul, Danilo Joksimović | RAČUNANJE TERENSKEGA POPRAVKA NA PODLAGI DIGITALNEGA MODE-LA GOSTOTE TOPOGRAFSKIH MAS | TERRAIN CORRECTION COMPUTATIONS USING DIGITAL DENSITY MODEL OF TOPOGRAPHIC MASSES | 79-97 |
GV_2018_1_Strokovni-del.indd 80 9.4.2018 16:06:04

| 81 || 81 || 81 |
GEODETSKI VESTNIK | 62/1 |
RECE
NZIRA
NI ČL
ANKI
| PEE
R-RE
VIEW
ED AR
TICLE
SSI
| EN
the newly created DTM and DDM. We created DDM also from the existing geological maps by creat-ing SDM, using some additional hypothesis about the upper layer of the lithosphere in order to provide more realistic density anomalies from the physical surface of the Earth down to the geoid surfaces.
2 MaTHeMaTiCal baCkGround
Terrain correction is the part of the topographic masses gravity effect that is inappropriately considered (or left out completely) under the procedure of Bouguer reduction of the gravity, i.e. while determining the value of gravity on the geoid, based on the values of measuring results on the Earth’s physical surface (Heiskanen and Moritz, 1967). Bouguer reduction starts by determining the gravity effect of the Bouguer plate in a point P which is located at the physical surface of the Earth (Figure 1):
δgB = 2πGρH0, (1)
where G is the universal gravitational constant, ρ is the mean mass density of the Earth’s crust and H0
and is the orthometric height of the point (Heiskanen and Moritz, 1967).
Figure 1: Representation of the Bouguer plate.
After calculating corrections for the free air,
o
FA og
g HH
δ∂
=∂
(2)
and atmospheric correction (Torge, 1989)
δgA[ms−2] = 8.74 − 9.9 ⋅10−4H[m]+3.56 ⋅10−8H2
[m] (3)
the value of the gravity on the geoid can be calculated as:
g' = gmes − δgB + δgA + δgFA (4)
where ∂g/∂Ho is vertical gravity gradient and gmes is measured gravity value at the point P. It is obvious that the non-existing masses were taken into consideration (Figure 1, masses marked m−) while proceeding with the Bouguer’s plate effect evaluation and that the gravitational mass effect positioned above Bouguer’s plate was not taken into consideration (Figure 1: masses designated m+). The total of gravitational mass effect m− and m+ is designated as terrain correction (Forsberg and Tscherning, 1997):
c = δgm− + δgm+ (5)
Oleg R. Odalović, Sanja M. Grekulović, Miroslav Starcević, Dobrica Nikolić, Miljana S. Todorović Drakul, Danilo Joksimović | RAČUNANJE TERENSKEGA POPRAVKA NA PODLAGI DIGITALNEGA MODE-LA GOSTOTE TOPOGRAFSKIH MAS | TERRAIN CORRECTION COMPUTATIONS USING DIGITAL DENSITY MODEL OF TOPOGRAPHIC MASSES | 79-97 |
GV_2018_1_Strokovni-del.indd 81 9.4.2018 16:06:04

| 82 || 82 || 82 |
| 62/1 | GEODETSKI VESTNIK
RECE
NZIRA
NI ČL
ANKI
| PEE
R-RE
VIEW
ED AR
TICLE
SSI
| EN
and it can be calculated using the expression:
( )( )
( ) ( ) ( )
,
2 2 23, ,
o
oP
z H x y oP
z H P P P
z Hc G x y z dxdydz
x x y y z zρ
=∞ ∞
−∞ −∞ =
−=
− + − + −∫ ∫ ∫ (6)
The final value of gravity on the geoid is obtained by adding the terrain correction to the value defined by the expression (4):
gB = g' + c. (7)
The gravity anomaly value determined in this manner is used to establish Bouguer’s anomalies on the geoid, as it is presented in several researches, e.g. (Hackney and Featherstone, 2003):
∆gB = gB − γ0 (8)
where γ0 is the value of normal gravity at an adopted reference ellipsoid (Moritz, 1984). The equation (1) together with a representation of Bouguer plate showed in Figure 1 is just one way to represent the gravity effect of topographic mass. A lot of different approach is possible. For example, in Vaniček et al. (2001), topography mass was treated just like in this paper, as a Bouguer plate, but in addition as a Bouguer shell. The approach of the spherical Bouguer shell is also applied in the research presented in Kuhn et al. (2009) for a huge number of gravity points all over Australia. Another way for calculation of topography effects throughout Bouguer concept is to derive spherical Bouguer shell from the Earth’s topography harmonic expansion as it is shown in Balmino et al. (2012). In all mentioned papers ad-vantages and disadvantages of different approaches were presented, but we decided to use the Bouguer plate as a simpler approach which is not computationally too demanding.
The terrain correction determined by the expression (5) is also a part of the anomaly defined by equation:
∆gH = gmes − γ0 + δgFA + c + δgA (9)
which is obtained by using the Helmert reduction. Anomalies defined by (9) are the basic values for determining the gravimetric geoid under the remove –restore method. The Bouguer anomaly is not used for the purposes of geoid determination, due to the exceptionally high effects on the geoid undulations known as indirect effect (Heiskanen and Moritz, 1967). The indirect effect is, furthermore, the conse-quence of removing or pushing out the topographic masses, causing the change of gravity potential, i.e. the variation of the geoid undulation values (NR) and for that reason, it needs to be additionally modelled within the remove–restore method (Forsberg and Tscherning, 1997):
N = NR + E. (10)
The indirect effect value IE may be determined from (Ägren et al., 2009):
32
0
2 2,
3
oo PP
HGIE H
Rπ ργ
= − +
(11)
where R is the mean Earth radius, the first term in the expression (11) pertains to the Bouguer’s plate effect and the second term to the terrain correction effect (Moritz, 1980). The indirect effect has strictly local
Oleg R. Odalović, Sanja M. Grekulović, Miroslav Starcević, Dobrica Nikolić, Miljana S. Todorović Drakul, Danilo Joksimović | RAČUNANJE TERENSKEGA POPRAVKA NA PODLAGI DIGITALNEGA MODE-LA GOSTOTE TOPOGRAFSKIH MAS | TERRAIN CORRECTION COMPUTATIONS USING DIGITAL DENSITY MODEL OF TOPOGRAPHIC MASSES | 79-97 |
GV_2018_1_Strokovni-del.indd 82 9.4.2018 16:06:04

| 83 || 83 || 83 |
GEODETSKI VESTNIK | 62/1 |
RECE
NZIRA
NI ČL
ANKI
| PEE
R-RE
VIEW
ED AR
TICLE
SSI
| EN
character and is directly proportional to the height of the point where the effect is being evaluated, as well as to the density of topographic masses around the evaluation point (Sjöberg and Nahavandchi, 1999).
3 Terrain CorreCTion praCTiCal evaluaTion
The integral defined by the expression (6) is commonly calculated today by the means of digital terrain model (DTM), which divides the topographic masses into right rectangular prisms (Figure 2), where the symbol for infinity in (6) is replaced by the distance of D = 167 km, and for the densities of Earth’s crust masses the mean value of 2670 kg/m3 is being adopted; thus the integral (6) being transformed into the following expression (Forsberg and Tscherning, 1997):
( ) ( ) ( )
( ),
2 2 23
o
oP
z H x y oP
D z H P P P
z Hc G dxdydz
x x y y z zρ
=
=
−=
− + − + −∫∫ ∫ , (12)
where x, y, and z are the coordinates of the running point, and xP, yP, and zP are coordinates of the evaluation point.
The procedure of the evaluation involves determining gravity effect of each prism that is positioned at the distance less than 167 km from the evaluation point P, taking into consideration the effect of the Earth’s curvature, and finally, summing the effects of all prisms.
Figure 2: Representation of topographic masses by prisms.
The expressions used for determining the gravity effect of a single prism, i.e. the potential and its first partial derivatives are given respectively by the following expressions (Figure 3) (Nagy et al., 2000):
( ) ( ) ( )
22
2
11
1
22 2
ln ln ln
arctan arctan arctan2 2 2
zyxx y z
V G xy z r xz y r yz x r
yz y xyx xz zxr yr zr
ρ= + + + + + −
− − −, (13)
( ) ( )2
22
11
1
ln ln arctanzyx
z x y z
xyVV G x y r y x r z
z zrρ∂
= − = − + + + −∂
(14)
( ) ( )2
22
11
1
ln ln arctanzyx
x x y z
yzVV G y z r z y r x
x xrρ∂
= − = − + + + −∂
(15)
( ) ( )2
22
11
1
ln ln arctanzyx
y x y z
V zxV G z x r x z r y
y yrρ∂
= − = − + + + −∂
(16)
Oleg R. Odalović, Sanja M. Grekulović, Miroslav Starcević, Dobrica Nikolić, Miljana S. Todorović Drakul, Danilo Joksimović | RAČUNANJE TERENSKEGA POPRAVKA NA PODLAGI DIGITALNEGA MODE-LA GOSTOTE TOPOGRAFSKIH MAS | TERRAIN CORRECTION COMPUTATIONS USING DIGITAL DENSITY MODEL OF TOPOGRAPHIC MASSES | 79-97 |
GV_2018_1_Strokovni-del.indd 83 9.4.2018 16:06:04

| 84 || 84 || 84 |
| 62/1 | GEODETSKI VESTNIK
RECE
NZIRA
NI ČL
ANKI
| PEE
R-RE
VIEW
ED AR
TICLE
SSI
| EN
where
2 2 2r x y z= + + . (17)
For all the prisms that are located at the distance greater than dc = 15 km (Nowell, 1999; Hinze et al., 2005) from the point P, the effect of the Earth’s curvature can be exactly taken into consideration using the transformation (Makhloof, 2007) (Figure 4):
( )
*
*
*
, , ,x x
y y
zz
V VV V
VV
ϕ λ ϕ λ
′ ′= ⋅
R , (18)
where
( ) ( ) ( )
( ) ( )( ) ( ) ( )
1 1 2 2 2 2 1 1 1 2 2 2 2 1 1 2 2 2 2 1 1
1 2 2 2 2 2 2 2 2 1 2 2 2 2
1 1 2 2 2 2 1 1 1 2 2 2 2 1 1 2 2 2 2 1 1
s s c c s s c c s c s s c s c c c s s c cs s c c s s s c c c s c c s
c s c c s s s c c c s s c c c c c s s s s
′ ′ ′ ′ ′ ′ ′ ′ ′ ′ + + − − − + + ′ ′ ′ ′ ′ ′ ′ ′= + + − + ′ ′ ′ ′ ′ ′ ′ ′ ′ ′− + + − + + +
R , (19)
with
1 2 1 2
1 2 1 2
sin , sin , cos , cos ,sin , sin , cos , cos
s s c cs s c c
ϕ λ ϕ λϕ λ ϕ λ
= = = =′ ′ ′ ′ ′ ′ ′ ′= = = =
. (20)
By summing the effects of all prisms, the value of terrain correction is finally evaluated by:
1 2*
i j
n n
P z zi j
c V V= +∑ ∑ , (21)
where n1 is the number of prisms that are at the distance d < dc, and n2 is the number of prisms that are at the distance d ≥ dc.
Figure 3: Right rectangular prism. Figure 4: Transformation between coordinate systems.
Table 1 shows the gravity effect of one prism with a square base of 30 m and the height of 500 m at the different horizontal distances from the prisms centre of mass. The table indicates that the effect of different densities of individual prisms for a point at the prism itself has the value of several tenths of mGal, and the
Oleg R. Odalović, Sanja M. Grekulović, Miroslav Starcević, Dobrica Nikolić, Miljana S. Todorović Drakul, Danilo Joksimović | RAČUNANJE TERENSKEGA POPRAVKA NA PODLAGI DIGITALNEGA MODE-LA GOSTOTE TOPOGRAFSKIH MAS | TERRAIN CORRECTION COMPUTATIONS USING DIGITAL DENSITY MODEL OF TOPOGRAPHIC MASSES | 79-97 |
GV_2018_1_Strokovni-del.indd 84 9.4.2018 16:06:05

| 85 || 85 || 85 |
GEODETSKI VESTNIK | 62/1 |
RECE
NZIRA
NI ČL
ANKI
| PEE
R-RE
VIEW
ED AR
TICLE
SSI
| EN
effect of the same prism to the point at the horizontal distance of only 100 m from the centre of mass of the prism is of the order of several hundreds of mGal. Whatever the case may be, it can be stipulated that the summary effect of large numbers of prisms with various densities on evaluating terrain correction is not negligible in general. To estimate the effect of adopting the hypothesis of equal topographic mass densities in summing up a large number of prisms by using (21), we have treated the terrain correction using expres-sion (6), and used the DDM to determine the density that appears as variable in (6). For the purposes of the researches, the DDM was created as the set of right rectangular prisms that are covering the area shown in Figure 5 using the following: the DTM of Serbia, with the resolution of 30 m in both directions; the Geological Map of Yugoslavia, scale 1 : 500,000, and the SRTM model (USGS, 2005), with the resolution of 3 arc second in both directions, which was used for topographic masses outside the territory of Serbia.
Table 1: Gravity effect of a single prism with dimensions of 30 m x 30 m x 500 m, depending on the density of the prism and
on horizontal distance from the prisms centre of mass (units: mGal).
Density
2670 kg/m3 Effect on gravityThe difference compared to the effect of density
of 2670 kg/m3
Distances [m] Distances [m]
0 100 0 100
2200 1.53 0.12 –0.33 –0.03
2300 1.60 0.12 –0.26 –0.02
2400 1.67 0.13 –0.19 –0.01
2500 1.73 0.13 –0.12 –0.01
2600 1.80 0.14 –0.05 0.00
2670 1.85 0.14 0.00 0.00
2700 1.87 0.14 0.02 0.00
2800 1.94 0.15 0.09 0.01
Figure 6: Division of topographic masses into prisms using the DTM.
Figure 7: Division of right rectangular prisms per height to the smaller prisms.Figure 5: Topographic masses that were divided into prisms.
Oleg R. Odalović, Sanja M. Grekulović, Miroslav Starcević, Dobrica Nikolić, Miljana S. Todorović Drakul, Danilo Joksimović | RAČUNANJE TERENSKEGA POPRAVKA NA PODLAGI DIGITALNEGA MODE-LA GOSTOTE TOPOGRAFSKIH MAS | TERRAIN CORRECTION COMPUTATIONS USING DIGITAL DENSITY MODEL OF TOPOGRAPHIC MASSES | 79-97 |
GV_2018_1_Strokovni-del.indd 85 9.4.2018 16:06:05

| 86 || 86 || 86 |
| 62/1 | GEODETSKI VESTNIK
RECE
NZIRA
NI ČL
ANKI
| PEE
R-RE
VIEW
ED AR
TICLE
SSI
| EN
The set of DDM prisms was obtained as follows: the topographic masses were divided into right rectangular prisms with equal bases using the DTM (Figure 6); the prisms obtained in this manner were additionally divided per their heights into the maximum of 3 segments, i.e. 3 smaller prisms (Figure 7) and using data from the geological map and adopting a series of hypothesis for the Earth’s crust masses.
4 CreaTion oF THe dTM
The DTM is created from the digitized data of the contour lines from the maps of scale 1 : 25,000, being one out of series projects of the Military Geographic Institute of Serbia (MGI). In 2004, the MGI handed over the data to the Department of Geodesy and Geoinformatics at the Faculty of Civil Engineering, University of Belgrade, in the point scatter format, for the purposes of scientific research. The DTM with resolution of 30 m x 30 m in both directions was created using those data, and was used in the procedure of a high resolution geoid determination in the territory of the Re-public of Serbia (Odalović, 2008) (Figure 8). The coordinates of the grid point relate to the Cartesian coordinates in UTM projection. The DTM height values were determined using an interpolation procedure, i.e. by applying the method of squared inversion distance, from the points scatter coor-dinates in the direct vicinity of a point for which the height is being determined (Odalović, 2008). Comparison of derived DTM with the data of about 80000 geodetic network points indicates that the accuracy of the model is better than 10 m (Odalović, 2005). Using such DTM, we consider that the topographic masses are divided into prisms with bases of 30 m in both directions. As for topographic masses (Figure 8), the relief of Serbia is characterized by different formations: starting with flatlands, with heights of approximately 90 m in the parts north of the Sava and Danube Rivers, followed by moderately mountainous terrain in the central and eastern part of Serbia with heights ranging from 200 m to 1000 m, and high mountainous terrain at the southwest with heights from 1000 m and exceeding 2000 m.
Complex relief is the consequence of complex geological structure. Flatlands part in the north of Serbia was formed during the period after the Pannonian Sea had dried out, due to the tectonic ter-rain uplifting in the area during the period of the last 15 million of years. The mountain range in the east Serbia is a part of the Carpathian–Balkan volcanic complex and the igneous rocks are dominant in that part. The southwest part of Serbia is designated by high mountain ranges, the part of the Di-naric complex (Robertson et al., 1994). This shape of relief was formed by constant uplifting due to the African plate pressure on the southern Europe in the northeast direction. The sedimentary rocks (limestone and dolomite) are prevailing in this part of the terrain, often suffering deviations under the powerful tectonic pressure, and became metamorphic rocks. The Danube River enters Serbia at a three-state boundary: Hungarian, Croatian and Serbian; and exits Serbia in the east, at the border with Romania, and flows into the Black Sea afterwards. The length Danube River through Serbia is 588 km, with 137.6 km shared with Croatia and 299.4 km with Romania. The topography along the Danube in Serbia varies from plains to hilly regions and wild canyons. The most beautiful part of its basin is Đerdap gorge, where the Danube is the widest (Golubac: 6000 m) and the narrowest (Gorges: 150 m wide and 90 m deep).
Oleg R. Odalović, Sanja M. Grekulović, Miroslav Starcević, Dobrica Nikolić, Miljana S. Todorović Drakul, Danilo Joksimović | RAČUNANJE TERENSKEGA POPRAVKA NA PODLAGI DIGITALNEGA MODE-LA GOSTOTE TOPOGRAFSKIH MAS | TERRAIN CORRECTION COMPUTATIONS USING DIGITAL DENSITY MODEL OF TOPOGRAPHIC MASSES | 79-97 |
GV_2018_1_Strokovni-del.indd 86 9.4.2018 16:06:05

| 87 || 87 || 87 |
GEODETSKI VESTNIK | 62/1 |
RECE
NZIRA
NI ČL
ANKI
| PEE
R-RE
VIEW
ED AR
TICLE
SSI
| EN
1. Mixed European & Adriatic affinities;
2. Serbo-Macedonian Masiff;
3. Transylvanian, South Apuseni and Eastern Var-dar; 4. Oceanic ophiolites Sava;
5. Adria thrust sheets Jadar-Kopaonik; 6. Car-patho-Balkanides;
7. Dinaric, Western Vardar, Mirdita; 8. Adria thrust sheets Drina-Ivanjica-Pelagonides.
(Major Tectonic Units: Schmid, et al., 2008)
Figure 8: Topographic masses over the territory of Serbia with major tectonic units.
5 CreaTion oF THe ddM
Each prism that was defined by the means of DTM was additionally divided along the height into the maximum of 3 prisms (Figure 7, example of prism division A, B, C); based on its position, height, and data from the geological map of Serbia as well as the series of adopted hypothesis. Overview of geological map (Figure 9) instantly indicates that there are several blocks that can be noted as separate geological units (it needs to be noted that the different geological units do not necessarily represent units with different densities because there are geologically different rocks with the same or similar densities). In the geological sense, four major units can be designated over the territory of Serbia. In the far north of Serbia there is a big depression, flat terrain with heights of about 90 m, with surface rocks of small density ranging from 2200 kg/m3 to 2300 kg/m3, newly created in a geological sense (Dimitrijević et al., 1970). These are the remnants of the former Pannonian Sea. In the southern part of the territory of Serbia, significant differences of surface densities can be noticed, which indicate a very heterogeneous geological structure. Three dominant units may be distinguished yet. In the eastern part of the terri-tory, the volcanic rocks prevail, being the part of the Carpathian-Balkan volcanic complex that stretches from Romania (Transylvania), over the eastern Serbia and the entire Bulgaria, ending at the Black Sea. This geological unit is composed mostly of volcanic rocks with densities that range from 2500 kg/m3 to 2650 kg/m3 (Dimitrijević et al., 1970). In the central part of the territory, there are the oldest rocks from the Paleozoic age that belong to the old Rhodope mass stretching from Greece, over Macedonia, and ending at the Danube in Serbia. The density of this geological unit is greater, and ranges from 2650 kg/m3 to 2800 kg/m3 (Dimitrijević et al., 1970). In the western part of the territory of Serbia,
Oleg R. Odalović, Sanja M. Grekulović, Miroslav Starcević, Dobrica Nikolić, Miljana S. Todorović Drakul, Danilo Joksimović | RAČUNANJE TERENSKEGA POPRAVKA NA PODLAGI DIGITALNEGA MODE-LA GOSTOTE TOPOGRAFSKIH MAS | TERRAIN CORRECTION COMPUTATIONS USING DIGITAL DENSITY MODEL OF TOPOGRAPHIC MASSES | 79-97 |
GV_2018_1_Strokovni-del.indd 87 9.4.2018 16:06:05

| 88 || 88 || 88 |
| 62/1 | GEODETSKI VESTNIK
RECE
NZIRA
NI ČL
ANKI
| PEE
R-RE
VIEW
ED AR
TICLE
SSI
| EN
Dinarides rocky complex is dominant, stretching from Slovenia, over Bosnia and Herzegovina, and Serbia, and ends in the western Macedonia. Those complex rocks vary in structure, from very old ones (Paleozoic), over medium age ones (Mesozoic) and younger volcanic rocks, with granites and andezites being representative. In this part, the densities vary widely, from younger sediments with a density of 2300 kg/m3 to very old crystal shale with density up to 2800 kg/m3 (Bilibajkić et al., 1979). However, the Mesozoic sediments with density from 2550 kg/m3 to 2650 kg/m3 are prevailing (Dimitrijević et al., 1970). The characteristic property of this area is that it contains rocks that suffered major transforma-tions during the geological history (metamorphism), being very complex in tectonic sense. According to everything above, it is stipulated that the densities of topographic masses range between 2200 kg/m3
and 2800 kg/m3, with the water density value Danube, Sava and the other rivers in Serbia being 1000 kg/m3, followed by creating the SDM (Figure 10) (Grekulović, 2014). For the depth of the rivers their average depths in territory of Serbia were adopted. For example, the depth of Danube 15 m was adopted according to data from the Republic Hydrometrological Service of Serbia (http://www.hidmet.gov.rs/). For the vertical division of prisms from the physical Earth surface down to the geoid, the topographic masses are shown as the function of orthometric height and surface density of prism, pursuant to the quantified model shown in Table 2 in detail. Quantified model of determining the heights of pylons with determined density was obtained from the available geological data, data from drill sites, as well as from geophysical logging data. For example, a prism with an orthometric height over 100 m and surface density (ρ1) that corresponds to its position less or equal to 2200 kg/m3 is divided into 3 prisms. The first part of the prism has the height equal to 10% of the total prism height and its density equals to the surface density. The second part prism has the height equal to 50% of the total prism height and the density (ρ2) is determined by the expression:
ρ2 = (ρ1 + 2800kg ⋅ m−3) / 2. (22)
Figure 9: Geological map of Serbia (Federal Geological Figure 10: SDM (white surfaces indicate the density of 1000 Institute, 1970). kg/m3 – Danube and Sava Rivers).
Oleg R. Odalović, Sanja M. Grekulović, Miroslav Starcević, Dobrica Nikolić, Miljana S. Todorović Drakul, Danilo Joksimović | RAČUNANJE TERENSKEGA POPRAVKA NA PODLAGI DIGITALNEGA MODE-LA GOSTOTE TOPOGRAFSKIH MAS | TERRAIN CORRECTION COMPUTATIONS USING DIGITAL DENSITY MODEL OF TOPOGRAPHIC MASSES | 79-97 |
GV_2018_1_Strokovni-del.indd 88 9.4.2018 16:06:06

| 89 || 89 || 89 |
GEODETSKI VESTNIK | 62/1 |
RECE
NZIRA
NI ČL
ANKI
| PEE
R-RE
VIEW
ED AR
TICLE
SSI
| EN
In the case of three prisms in pillar, the expression (22) is adopted by the next assumptions:
– Density increases up with depth, – First layer with density ρ1 is relatively thin, adopted 10% of total pillar height, according to geo-
logical data; – Third layer on the bottom has a maximum density of 2800 kg/m3 as a 50% part of the pillar height; – Layer in the middle has a density that is average of first layer densityρ1 and bottom densities of
2800 kg/m3. – Anyway, by these hypotheses, density distribution will be much closer to real geological settings
than average density of 2670 kg/m3.
Table 2: Determination of number, density, and height of each pillar.
Number of prism parts H (m)Surface density
ρ1
[kg·m-3]
Pillar
Density of prism parts [kg·m-3]
Height of prism parts [percentage]
2 ≤ 100 2200 22002300
3070
2 ≤ 100 2201–2300 ρ1
24003070
1 ≤ 100 > 2300 ρ1 100
3 > 100 ≤ 2200 ρ1
ρ2
2800
105040
3 2210–2300 ρ1
ρ2
2800
204040
3 2310–2400 ρ1
ρ2
2800
105040
3 2410–2500 ρ1
ρ2
2800
204040
3 2510–2600 ρ1
ρ2
2800
304030
3 2610–2700 ρ1
ρ2
2800
304030
2 > 2700 ρ1
28005050
The third part of height accounts for the remaining 40% of the total prism height with the density of 2800 kg/m3. This case corresponds to prism division marked with a C in figure 7. In the case where the prism height is less or equal to 100 m and the corresponding surface density is greater than 2300 kg/m3, the prism is not being divided; it is included in the DDM as a single prism (marked with A in Figure 7). In the third potential case, a prism is divided into two parts if its height is less or equal to 100 m, and the surface density is equal to 2200 kg/m3 or ranges from 2201 kg/m3 to 2300 kg/m3 (Figure 7: marked with a B). Percent-
Oleg R. Odalović, Sanja M. Grekulović, Miroslav Starcević, Dobrica Nikolić, Miljana S. Todorović Drakul, Danilo Joksimović | RAČUNANJE TERENSKEGA POPRAVKA NA PODLAGI DIGITALNEGA MODE-LA GOSTOTE TOPOGRAFSKIH MAS | TERRAIN CORRECTION COMPUTATIONS USING DIGITAL DENSITY MODEL OF TOPOGRAPHIC MASSES | 79-97 |
GV_2018_1_Strokovni-del.indd 89 9.4.2018 16:06:06

| 90 || 90 || 90 |
| 62/1 | GEODETSKI VESTNIK
RECE
NZIRA
NI ČL
ANKI
| PEE
R-RE
VIEW
ED AR
TICLE
SSI
| EN
ages that determine ratios of prism height are determined from experience and geophysical data on the relations of separate geological units gauges over a given territory, being predominant over the study area. For example, the established fact is that in the territory of Serbia, the gauge of younger sediments (Tertiary and Quaternary) is relatively low, compared to the older rocks, thus this layer accounts for no more than 30% of the total pillar height. Similarly, the rocks from the Mesozoic era, mostly limestone rocks, gener-ally have the greatest gauge in the entire rocks complex gauge, thus this part the height percentage mostly accounts for approximately 70%. For topographic masses out of Serbia territory, prisms were not divided by the height and their average density was taken into account. Over 800,000,000 prisms were created in this manner, and archived in a total of 129,600 data files; including the prism number, its bottom left and upper right point coordinates (Figure 3, points 1 and 2) and the prism density for each individual prism.
6 CalCulaTion oF Terrain CorreCTion
Two data sets were determined using the DTM and the DDM created and applying expressions (12) and (6): set c2670 - terrain correction with constant mass density of 2670 kg/m3 and set c - terrain correction with density defined by the DDM. In determination of all data sets, masses at calculation points and up to the distance of 167 km above were considered. For the masses in close proximity to the computation points, at the distance up to 20 km, the DDM created was used. For all other masses, located at the distance of 20 km and up to 167 km, a coarse digital model with the resolution of 450 m in both direction was used, particu-larly aiming at saving the time needed for the calculation. A coarse model was created from the DDM in the following way: a) Each block of the DDM consisted of 15 x 15 points (225 points in total) were treated as one point of coarse DDM, b) The coordinates of the central points of each block were used as coordinates of the points of coarse DDM, c) For each block average height of 225 points were calculated and adopted as the heights of coarse DDM (heights used is these calculations were heights of most upper prisms, or, on the other words, prisms which upper base is near to the physical surface of the Earth), d) And for the density of prisms average value of 2670 kg/m3 were adopted. The sets were determined in the total of 5765 points that were relatively uniformly distributed over the territory of Serbia (Figure 11). Calculating of terrain cor-rection to the certain distance has always included some of truncation effects (Mikuška et al., 2006), but for the territory of the Serbia effect of the distant mass over 167 km in this research was not considered.
Points where the terrain correction was evaluated were a part of the Serbia gravimetric survey subset (Odalović et al., 2012), and geodetic coordinates for each point in the GRS80 system were known, together with the orthometric heights. Apart from relatively uniform distribution, points were also selected in such manner that their heights determined using classical geodetic methods do not exceed the difference of 1 m from their respective heights from the DTM. Special software was developed at the Institute of Geodesy and Geoinformatics, Faculty of Civil Engineering, University of Belgrade, for the purposes of practical calculations of c2670 or c, which calculates these sets of all 5765 points in approximately 6 hours, using 8 threads Intel i7 CPU, with 16 GB RAM. Statistical evaluation of the results, along with the differences
DTC = c − c2670, (23)
are shown in Table 3.
Oleg R. Odalović, Sanja M. Grekulović, Miroslav Starcević, Dobrica Nikolić, Miljana S. Todorović Drakul, Danilo Joksimović | RAČUNANJE TERENSKEGA POPRAVKA NA PODLAGI DIGITALNEGA MODE-LA GOSTOTE TOPOGRAFSKIH MAS | TERRAIN CORRECTION COMPUTATIONS USING DIGITAL DENSITY MODEL OF TOPOGRAPHIC MASSES | 79-97 |
GV_2018_1_Strokovni-del.indd 90 9.4.2018 16:06:06

| 91 || 91 || 91 |
GEODETSKI VESTNIK | 62/1 |
RECE
NZIRA
NI ČL
ANKI
| PEE
R-RE
VIEW
ED AR
TICLE
SSI
| EN
Figure 11: Spatial distribution of points where the terrain correction is determined.
Table 3: Basic statistical data sets for c, c2670 and DTC (units: mGal).
Parameter Minimum Maximum Mean Standard deviation
c –0.01 37.68 1.97 2.69
c2670 –0.01 37.68 1.98 2.69
DTC = c − c2670 –1.31 0.73 –0.10 0.07
7 disCussions
7. 1 Terrain corrections determined with a constant value of density
The aforementioned results about terrain correction, determined with constant density value, are graphically shown in the figure 12. From the figure is obvious that minimal values of terrain correc-tion were achieved in the northern part of Serbia, which is almost flat area. In the same area, there are few values of terrain correction with negative sign due to the Earth curvatures. In Figure 12, these points are located in the areas delineated by dashed line. From the scattered graph of terrain correction plotted against to the evaluation point heights, showed in the Figure 13 together with their regression line, it can be seen that there exists a relatively strong correlation of the terrain correction with terrain heights. In general, terrain correction values increases from the north (flat area) to the south (area with rough topography mass).
Oleg R. Odalović, Sanja M. Grekulović, Miroslav Starcević, Dobrica Nikolić, Miljana S. Todorović Drakul, Danilo Joksimović | RAČUNANJE TERENSKEGA POPRAVKA NA PODLAGI DIGITALNEGA MODE-LA GOSTOTE TOPOGRAFSKIH MAS | TERRAIN CORRECTION COMPUTATIONS USING DIGITAL DENSITY MODEL OF TOPOGRAPHIC MASSES | 79-97 |
GV_2018_1_Strokovni-del.indd 91 9.4.2018 16:06:06

| 92 || 92 || 92 |
| 62/1 | GEODETSKI VESTNIK
RECE
NZIRA
NI ČL
ANKI
| PEE
R-RE
VIEW
ED AR
TICLE
SSI
| EN
Figure 12: The general representation of the terrain Figure 13: Terrain corrections plotted against heights of the correction surface over the territory of Serbia evaluation points (red line: regression line of the (equidistance 2 mGal). terrain correction as a function of height of the evaluation points).
The maximum value of the terrain correction for selected dataset was 37.68 mGal, but in Serbia the maximum detected value is reached at the point located on Rtanj mountain 41.93 mGal (Figure 12, the centre of the black circle); according to the histogram of terrain corrections, showed at the Figure 14, we can say that this kind of values are unique in Serbia. This high value of terrain correction of the Rtanj mountain is because of its characteristic pyramidal shape.
Figure 14: Histogram of c2670.
Oleg R. Odalović, Sanja M. Grekulović, Miroslav Starcević, Dobrica Nikolić, Miljana S. Todorović Drakul, Danilo Joksimović | RAČUNANJE TERENSKEGA POPRAVKA NA PODLAGI DIGITALNEGA MODE-LA GOSTOTE TOPOGRAFSKIH MAS | TERRAIN CORRECTION COMPUTATIONS USING DIGITAL DENSITY MODEL OF TOPOGRAPHIC MASSES | 79-97 |
GV_2018_1_Strokovni-del.indd 92 9.4.2018 16:06:06

| 93 || 93 || 93 |
GEODETSKI VESTNIK | 62/1 |
RECE
NZIRA
NI ČL
ANKI
| PEE
R-RE
VIEW
ED AR
TICLE
SSI
| EN
7.2 Terrain corrections determined by using ddM
The data showed in the Table 3 indicate the following: both sets of terrain correction, determined with constant values topographic masses and by using DDM, have almost the same statistical values. The spatial distribution of minimal, maximal and also negative values is same in both data sets, but there are still meaningful differences between those two sets. The graphical representation of these differences is shown in the Figure 15.
Significant differences occur in the northern and central part of Serbia (Figure 15, areas marked by red circles 1 and 2). In these areas, the values reach –1.31 mGal and up to 0.73 mGal. In Figure 16, two of many possible profiles of these areas are shown. There is a total of 110 points within this range, i.e. 2% of the total number of points. Fruška Gora mountain covers a minor part of Vojvodina, consisting of older, higher density rocks. Compared to the broader surrounding area, which is flat and consists of younger, lower density rocks, due to the major differences in density, this mountain causes the differ-ence of –1.31 above (Figure 15, red circle 1). In the area of circle 2, where the difference is 0.73 mGal, Kopaonik range is notable, with the height exceeding 2000 m. This mountain complex, mostly consists of volcanic rocks, while the surrounding area with the height of about 1000 m to 1500 m contains rocks with diverse structure and prevailing higher densities rocky matter. It is worth to say that there is not any correlation of differences DTC with heights of its valuation points (Figure 17).
Figure 15: The general shape of the differences DTC Figure 16: The profiles along the area with maximal value (equidistance 0.1 mGal). of the DTC.
Oleg R. Odalović, Sanja M. Grekulović, Miroslav Starcević, Dobrica Nikolić, Miljana S. Todorović Drakul, Danilo Joksimović | RAČUNANJE TERENSKEGA POPRAVKA NA PODLAGI DIGITALNEGA MODE-LA GOSTOTE TOPOGRAFSKIH MAS | TERRAIN CORRECTION COMPUTATIONS USING DIGITAL DENSITY MODEL OF TOPOGRAPHIC MASSES | 79-97 |
GV_2018_1_Strokovni-del.indd 93 9.4.2018 16:06:07

| 94 || 94 || 94 |
| 62/1 | GEODETSKI VESTNIK
RECE
NZIRA
NI ČL
ANKI
| PEE
R-RE
VIEW
ED AR
TICLE
SSI
| EN
Figure 17: DTC plotted against the heights of their Figure 18: Histogram of terrain correction differences DTC. evaluation points.
Histogram of differences in Figure 18 shows that 93% of differences are in the 0.1 mGal range, and as much as 98% being in the 0.2 mGal range.
7.3 Effects of the DTC to the geoid undulation and the indirect effect
The differences ranging from –1.31 mGal to 0.73 mGal will change the geoid undulation values at the level of a few millimetres, which can be easily concluded from the expression (Heiskanen and Moritz, 1967):
0
0,P P
sN DTCδ
γ= (24)
where s0 is the distance that defines immediate surroundings of the evaluation point, γ0 is the value of nor-mal gravity on the ellipsoid and DTCp is the differences calculated by (23). For example, for DTCp = -1.31 mGal, s0 = 5 km and γ0 ≈ 9.8 the value of δNp = –7mm is obtained, and for DTCp = 0.73 mGal undulation will be changed for δNp = 4 mm. For an average difference value DTCp = 0.10 mGal, the value of δNp is less than 1 mm. From the expression (11), the value of indirect effect in the territory of Serbia changes in the 2 cm range, when applying DDM for its evaluation instead of the constant topographic mass density value. Geoid undulations over the territory of Serbia range from 40 m to 47 m (Odalović, 2008) and considering the quality of the data available and the accuracy of the determined geoid undulations at the level of 5 cm (Odalović, 2005), we can conclude that the changes of the indirect effect are not significant, at the moment.
7.4 Effects of the DTC to the gravity measurement in the local areas
Regarding to gravity investigations in applied geophysics, terrain corrections have a great role, especially in details with small grid data spaced and that are performed in rugged topography. Calculation of topography effect by using of average density of 2670 kg/m3 is commonly applied. However, if we use digital density model (DDM) with different densities of terrain, it is possible to get much better results that are closer to the real situation in the field. In practical use, Bouguer gravity maps are often prepared by contour interval of 0.1 mGal, in some special cases even 0.05 mGal. For this purpose, terrain correc-tions must be calculated very carefully and DDM in this case has a great role. Beside of all mentioned, the values of terrain correction are directly in relation to the geometry of topographic mass in the vicinity of evaluation points. To confirm this hypothesis, a test model of gravity investigation is prepared in the
Oleg R. Odalović, Sanja M. Grekulović, Miroslav Starcević, Dobrica Nikolić, Miljana S. Todorović Drakul, Danilo Joksimović | RAČUNANJE TERENSKEGA POPRAVKA NA PODLAGI DIGITALNEGA MODE-LA GOSTOTE TOPOGRAFSKIH MAS | TERRAIN CORRECTION COMPUTATIONS USING DIGITAL DENSITY MODEL OF TOPOGRAPHIC MASSES | 79-97 |
GV_2018_1_Strokovni-del.indd 94 9.4.2018 16:06:07
| 95 || 95 || 95 |
GEODETSKI VESTNIK | 62/1 |
RECE
NZIRA
NI ČL
ANKI
| PEE
R-RE
VIEW
ED AR
TICLE
SSI
| EN
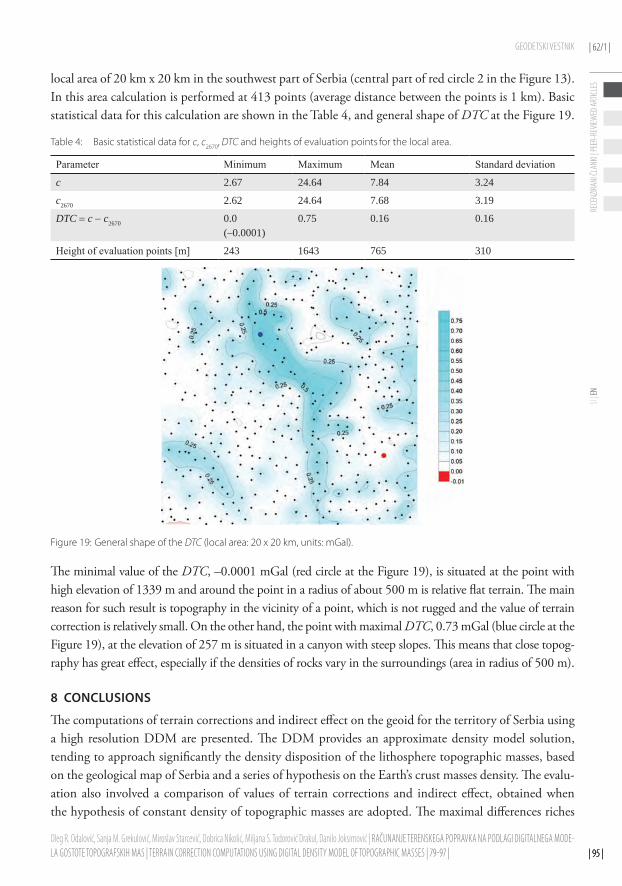
local area of 20 km x 20 km in the southwest part of Serbia (central part of red circle 2 in the Figure 13). In this area calculation is performed at 413 points (average distance between the points is 1 km). Basic statistical data for this calculation are shown in the Table 4, and general shape of DTC at the Figure 19.
Table 4: Basic statistical data for c, c2670, DTC and heights of evaluation points for the local area.
Parameter Minimum Maximum Mean Standard deviation
c 2.67 24.64 7.84 3.24
c2670 2.62 24.64 7.68 3.19
DTC = c − c2670 0.0(–0.0001)
0.75 0.16 0.16
Height of evaluation points [m] 243 1643 765 310
Figure 19: General shape of the DTC (local area: 20 x 20 km, units: mGal).
The minimal value of the DTC, –0.0001 mGal (red circle at the Figure 19), is situated at the point with high elevation of 1339 m and around the point in a radius of about 500 m is relative flat terrain. The main reason for such result is topography in the vicinity of a point, which is not rugged and the value of terrain correction is relatively small. On the other hand, the point with maximal DTC, 0.73 mGal (blue circle at the Figure 19), at the elevation of 257 m is situated in a canyon with steep slopes. This means that close topog-raphy has great effect, especially if the densities of rocks vary in the surroundings (area in radius of 500 m).
8 ConClusions
The computations of terrain corrections and indirect effect on the geoid for the territory of Serbia using a high resolution DDM are presented. The DDM provides an approximate density model solution, tending to approach significantly the density disposition of the lithosphere topographic masses, based on the geological map of Serbia and a series of hypothesis on the Earth’s crust masses density. The evalu-ation also involved a comparison of values of terrain corrections and indirect effect, obtained when the hypothesis of constant density of topographic masses are adopted. The maximal differences riches
Oleg R. Odalović, Sanja M. Grekulović, Miroslav Starcević, Dobrica Nikolić, Miljana S. Todorović Drakul, Danilo Joksimović | RAČUNANJE TERENSKEGA POPRAVKA NA PODLAGI DIGITALNEGA MODE-LA GOSTOTE TOPOGRAFSKIH MAS | TERRAIN CORRECTION COMPUTATIONS USING DIGITAL DENSITY MODEL OF TOPOGRAPHIC MASSES | 79-97 |
GV_2018_1_Strokovni-del.indd 95 9.4.2018 16:06:07
| 96 || 96 || 96 |
| 62/1 | GEODETSKI VESTNIK
RECE
NZIRA
NI ČL
ANKI
| PEE
R-RE
VIEW
ED AR
TICLE
SSI
| EN
values from –1.31 mGal up to 0.73 mGal, along with 98 % of differences falling within the range of ±0.2 mGal. The value of indirect effect, due to applied DDM, will change the geoid undulations at the range from 1 cm to 2 cm. In determining the geoid at the territory of Serbia, it is obvious that these effects are not particularly significant, however, in the areas with distinct topographic masses, the afore-mentioned effects reach the value of a few decimetres, as shown in (Huang, 2002; Olugbenga, 2000). As for the future activities, a set of additional modelling is planned, particularly focusing on additional data acquisition regarding lithosphere and further software development. The additional information on lithosphere would contribute to the DDM improvement, and further software development would decrease the time needed to determine the gravitational effect of upper lithosphere.
acknowledgments
Support for this research was provided by the Ministry of Education, Science and Technological Devel-opment of the Republic of Serbia (Project No. TR36020).
literature and references:Ägren, J., Djalović, S., Škrnjug, J. (2011). Plan for the Future Determination of a National
Geoid Model for Serbia. Techbical report. Belgrade: Republic Geodetic Authority.
Ägren, J., Sjöberg, L. E., Kiamehr, R. (2009). The new gravimetric quasigeoid model KTH08 over Sweden. Journal of Applied Geodesy, 3 (3), 143–153. DOI: https://doi.org/10.1515/JAG.2009.015
Balmino, G., Vales, N., Bonvalot, S., Briais, A. (2012). Spherical harmonic modelling to ultra-high degree of Bouguer and isostatic anomalies. Journal of Geodesy, 86 (7), 499–520. DOI: http://dx.doi.org/10.1007/s00190-011-0533-4
Bilibajkić, P., Mladenović, M., Mujagić, S., Rimac, I. (1979). Explanation for the Gravity map of SFR Yugoslavia, Bouguer Anomalies, 1:500000. Zagreb: Enterprise for Applied Geophysics “Geofizika” Zagreb, and Belgrade: Institute for Geological and Geophysical Research.
Dimitrijević, M., Karamata, S., Sikösek, B., Veselinović, D. (1970). Geological map of Yugoslavia 1:500000 and explanation. Technical report. Belgrade: Institute for Geological and Mining Exploration.
Federal Geological Institute (1970). Geological Map of Yugoslavia 1:500000 and Explanation. Belgrade: Institute for Geological and Mining Exploration.
Forsberg, R. (1993). Modelling the fine-structure of the geoid: Methods, data requirements and some results. Surveys in Geophysics, 14 (4), 403–418. DOI: http://dx.doi.org/10.1007/BF00690568
Forsberg, R., Tscherning, C. C. (1981). The use of height data in gravity field approximation by collocation. Journal of Geophysical Research Solid Earth, 86 (B9), 7843–7854. DOI: http://dx.doi.org/10.1029/JB086iB09p07843
Forsberg, R. (1984) A study of terrain corrections, density anomalies and geophysical inversion methods in gravity field modelling. Reports of the department of geodesy science and survey, 355. Ohio State University.
Forsberg, R., Tscherning C. C. (1997). Topographic effects in gravity field modelling for BVP. In: Sansó F. (Ed.), Rummel R. (Ed.), Geodetic Boundary Value Problems in View of the One Centimeter Geoid (pp. 239–272). Springer, Berlin. DOI: http://dx.doi.org/10.1007/BFb0011707
Grekulović, S. (2014). Modeling of the earth crust density in solving the boundary value problems of the gravity potential. Doctoral dissertation. Belgrade: University of Belgrade, Faculty of Civil Engineering.
Hackney, R. I., Featherstone, W. E. (2003). Geodetic versus geophysical perspectives of the ’gravity anomaly’. Geophysical Journal International, 154 (1), 35–43. DOI: https://doi.org/10.1046/j.1365-246X.2003.01941.x
Heiskanen, W., Moritz, H. (1967). Physical Geodesy. San Francisco: W.H. Freeman and Co.
Hinze, W. J., Aiken, C., Brozena, J., Coakley, B., Dater, D., Flanagan, G., Forsberg, R., Hildenbr, T., Keller, Y., Kellogg, J. N., Kucks, R., Li, X., Mainville, A., Pilkington, M., Plouff, D., Ravat, D., Roman, D., Urrutiafucugauchi, J., Webring, M., Winester, D. (2005). New standards for reducing gravity data: The North American gravity database. Geophysics, 70 (4), 325–332. DOI: https://doi.org/10.1190/1.1988183
Huang, J. (2002). Computational methods for the discrete downward continuation of the earth gravity and effects of lateral topographical mass density variation on gravity and the geoid. Ph.D. thesis. New Brunswick: University of New Brunswick, Department of Geodesy and Geomatics Engineering.
Huang, J., Vaníček, P., Pagiatakis, S. D., Brink, W. (2001). Effect of topographical density on geoid in the Canadian Rocky Mountains. Journal of Geodesy, 74 (11–12), 805–815. DOI: http://dx.doi.org/10.1007/s001900000145
Kuhn, M., Featherstone W. E., Kirby, J. F. (2009). Complete spherical Bouguer gravity anomalies over Australia. Australian Journal of Earth Sciences, 56 (2), 213–223. DOI: http://dx.doi.org/10.1080/08120090802547041
Kühtreiber, N. (1998). Precise geoid determination using a density variation model. Physics and Chemistry of the Earth, 23 (1), 59–63. DOI: http://dx.doi.org/10.1016/S0079-1946(97)00242-5
Li, Y. (1993). Optimized spectral geoid determination. Master’s thesis. Calgary: University of Calgary, Department of Geomatics Engineering.
Makhloof, A. (2007). The use of topographic-isostatic mass information in geodetic
Oleg R. Odalović, Sanja M. Grekulović, Miroslav Starcević, Dobrica Nikolić, Miljana S. Todorović Drakul, Danilo Joksimović | RAČUNANJE TERENSKEGA POPRAVKA NA PODLAGI DIGITALNEGA MODE-LA GOSTOTE TOPOGRAFSKIH MAS | TERRAIN CORRECTION COMPUTATIONS USING DIGITAL DENSITY MODEL OF TOPOGRAPHIC MASSES | 79-97 |
GV_2018_1_Strokovni-del.indd 96 9.4.2018 16:06:07

| 97 || 97 || 97 |
GEODETSKI VESTNIK | 62/1 |
RECE
NZIRA
NI ČL
ANKI
| PEE
R-RE
VIEW
ED AR
TICLE
SSI
| EN
applications. Ph.D. thesis. Bonn: Universität Bonn, Institut für Geodäsie und Geoinformation.
Mikuška, J., Pašteka, R., Marušiak, I. (2006). Estimation of distant relief effect in gravimetry. Geophysics, 71 (6), J59–J69. DOI: http://dx.doi.org/10.1190/1.2338333
Moritz, H. (1980). Advanced Physical Geodesy. Karlsruhe: Herbert Wichmann Verlag.
Moritz, H. (1984). Geodetic reference system 1980. Bulletin géodésique, 58 (3), 388–398. DOI: http://dx.doi.org/10.1007/BF02519014
Nagy, D., Papp, G., Benedek, J. (2000). The gravitational potential and its derivatives for the prism. Journal of Geodesy, 74 (7), 552–560. DOI http://dx.doi.org/10.1007/s001900000116
Nowell, D. (1999). Gravity terrain corrections an overview. Journal of Applied Geophysics, 42 (2), 117–134. DOI: https://doi.org/10.1016/S0926-9851(99)00028-2
Odalović, O. (2005). Methodology of geoid determination of high resolution and centimeter accuracy in Serbia. Doctoral Dissertation. Belgrade: University of Belgrade, Faculty of Civil Engineering.
Odalović, O. (2008). Preliminary geoid for Serbia. Technical report. Belgrade: Republic Geodetic Authority.
Odalović, O. Starčević, M., Grekulović, S., Burazer, M., Aleksić, I. (2012). The establishment of a new gravity reference frame for Serbia. Survey Review, 44 (327), 272–281. DOI: https://doi.org/10.1179/1752270611Y.0000000033
Olugbenga, E. (2000). Spectral analysis of gravity field data and errors in view of sub-decimetre geoid determination in Canada. Master’s thesis. Calgary: University of Calgary, Department of Geomatics Engineering. http://www.ucalgary.ca/engo_webdocs/MGS/00.20137.OEsan.pdf
Robertson, A. H. F., Karamata, S. (1994). The role of subduction-accretion processes in the tectonic evolution of the Mesozoic Tethys in Serbia. Tectonophysics, 234 (1–2), 73–94. DOI: https://doi.org/10.1016/0040-1951(94)90205-4
Schmid, S. M., Bernoulli, D., Fügenschuh, B., Matenco, L., Schefer, S., Schuster, R., Tischler, M., Ustaszewski, K. (2008). The Alpine-Carpathian-Dinaridic orogenic system: correlation and evolution of tectonic units. Swiss Journal of Geosciences, 101 (1), 139–183. DOI: http://dx.doi.org/10.1007/s00015-008-1247-3
Sjöberg, E. L., Nahavandchi, H. (1999). On the indirect effect in the Stokes– Helmert method of geoid determination. Journal of Geodesy, 73 (2), 87–93. DOI: http://dx.doi.org/10.1007/s001900050222
Tenzer, R., Sirguey, P., Rattenbury, M., Nicolson, J. (2011). A digital rock density map of New Zealand. Computers and Geosciences, 37 (8), 1181–1191. DOI: http://dx.doi.org/10.1016/j.cageo.2010.07.010
Torge, W. (1989). Gravimetry. Berlin-New York: Walter de Gruyter.
Tziavos, I., Sideris, M. (2013). Topographic Reductions in Gravity and Geoid Modeling. In Sansò F. (Ed.), Sideris M. (Ed.), Geoid Determination (pp. 337–400). Berlin: Springer. DOI: https://doi.org/10.1007/978-3-540-74700-0_8
Tziavos, I. N., Featherstone, W. E. (2000). First results of using digital density data in gravimetric geoid computation in Australia. In M.G. Sideris (Ed.), International Association of Geodesy Symposia: Gravity, Geoid and Geodynamics 2000 (pp. 335–340). Berlin: Springer-Verlag.
USGS, (2005). Shuttle radar topography mission (SRTM) - “Finished” products. U.S. Geological Survey. http://edc.usgs.gov/products/elevation/srtmbil.html
Vaniček, P., Novak, P., Martinec, Z. (2001). Geoid, topography, and the Bouguer plate or shell. Journal of Geodesy, 75 (4), 210–215. DOI: https://doi.org/10.1007/s001900100165
Oleg R. Odalović, Ph.D.University of Belgrade, Faculty of Civil Engineering
Department of geodesy and geoinformaticsBulevar kralja Aleksandra 73, SRB-11000 Belgrade, Serbia
e-mail: [email protected]
Sanja M. Grekulović, Ph.D.University of Belgrade, Faculty of Civil Engineering
Department of geodesy and geoinformaticsBulevar kralja Aleksandra 73, SRB-11000 Belgrade, Serbia
e-mail: [email protected]
Miroslav Starcević, Ph.D.Republic Geodetic Authority
Bulevar vojvode Mišića 39, SRB-11000 Belgrade, Serbiae-mail: [email protected]
Dobrica Nikolić, Ph.D.University of Belgrade, Faculty of Mining and Geology, Department of PhysicsĐušina 7, SRB-11000 Belgrade, Serbiae-mail: [email protected]
Miljana S. Todorović Drakul, Ph.D.Department of geodesy and geoinformaticsFaculty of Civil Engineering, University of BelgradeBulevar kralja Aleksandra 73, SRB-11000 Belgrade, Serbiae-mail: [email protected]
Danilo Joksimović, Ph.D. CandidateDepartment of geodesy and geoinformaticsFaculty of Civil Engineering, University of BelgradeBulevar kralja Aleksandra 73, SRB-11000 Belgrade, Serbiae-mail: [email protected]
Odalović O. R., Grekulović S. M., Starcević M., Nikolić D., Todorović Drakul M. S., Joksimović D. (2018). Terrain correction computations using digital density model of topographic masses. Geodetski vestnik, 62 (1), 79-97. DOI: 10.15292/geodetski-vestnik.2018.01.79-97
Oleg R. Odalović, Sanja M. Grekulović, Miroslav Starcević, Dobrica Nikolić, Miljana S. Todorović Drakul, Danilo Joksimović | RAČUNANJE TERENSKEGA POPRAVKA NA PODLAGI DIGITALNEGA MODE-LA GOSTOTE TOPOGRAFSKIH MAS | TERRAIN CORRECTION COMPUTATIONS USING DIGITAL DENSITY MODEL OF TOPOGRAPHIC MASSES | 79-97 |
GV_2018_1_Strokovni-del.indd 97 9.4.2018 16:06:07