Embed Size (px)
Citation preview
RESEARCH ARTICLE
Genetic structure and gene flow in Beta vulgaris subspeciesmaritima along the Atlantic coast of France
Christopher M. Richards • Patrick A. Reeves •
Ann L. Fenwick • Lee Panella
Received: 11 July 2013 / Accepted: 26 November 2013 / Published online: 21 December 2013
� Springer Science+Business Media Dordrecht (outside the USA) 2013
Abstract Locating and quantifying genetic variation
within crop wild relatives is an ongoing activity of
gene banks tasked with ex situ conservation. Without
detailed information about the population genetics of a
species, geography often serves as a reasonable proxy
for differentiation. With this in mind, this paper
examines the genetic diversity and differentiation of
Beta vulgaris subsp. maritima accessions collected
along a well-studied latitudinal gradient along the
French Atlantic coast of France as well as Corsica, for
use as representative genotypes from the Mediterra-
nean basin. The aim of this work is to identify the scale
and magnitude of differentiation and diversity in this
set of accessions, using both molecular and quantita-
tive traits. We assessed clinal variation and admixture
in genetic and morphometric data along this latitudinal
gradient. Results from this study revealed a complex
pattern of recent gene flow and immigration on a
historical biogeographic structure. Our data suggest
that a presumed latitudinal cline is in reality an
admixed mosaic of genotypes.
Keywords Beta vulgaris �Biogeography �Crop
wild relative � Gene flow � Genetic diversity �Genetic structure
Introduction
Variation in wild relatives of crop species is a critical
source of adaptive variation useful to plant breeding
(Harlan 1976; Tanksley and McCouch 1997; Gur and
Zamir 2004; Maxted et al. 2006; McCouch et al.
2012). Sea beet (Beta vulgaris L. subsp. maritima (L.)
Arcang. —B. vulgaris ssp. maritima—henceforth Beta
maritima) is estimated to be the wild progenitor of
cultivated beet (de Bock 1986; Letschert et al. 1994;
Santoni and Berville 1995; Biancardi et al. 2012). This
crop wild relative has become the major source of
genetic diversity and a reservoir of genetic traits useful
in improvement of cultivated beet, especially sugar
beet (Frese et al. 2001; Panella and Lewellen 2007;
Biancardi et al. 2012).
The sea beet populations along the French coast
have been well studied by researchers focusing on the
genetics of life history evolution and phenology (Van
Dijk and Boudry 1992; Van Dijk et al. 1997;
Hautekeete et al. 2002a, b; Boudry et al. 2002; Van
C. M. Richards (&) � P. A. Reeves
National Center for Genetic Resources Preservation,
Agricultural Research Service, United States Department
of Agriculture, 1111 South Mason Street, Fort Collins,
CO 80521, USA
e-mail: [email protected]
A. L. Fenwick
Beet Sugar Development Foundation, 1701 Centre Ave.,
Fort Collins, CO 80526, USA
L. Panella
Sugarbeet Research Unit, Agricultural Research Service,
United States Department of Agriculture,
1701 Centre Ave., Fort Collins, CO 80526, USA
123
Genet Resour Crop Evol (2014) 61:651–662
DOI 10.1007/s10722-013-0066-1
Dijk 2009; Wagmann et al. 2012). These studies have
described a gradient of variation that effects the
transition from an annual to a biennial life history. The
observed clinal pattern may be a consequence of post
glacial biogeographic processes along the French
Atlantic coast; the Mediterranean Basin was a refuge
in the last ice-age for populations of B. maritima
(Villain 2007; Villain et al. 2009).
Locating and quantifying the variation within crop
wild relatives is an ongoing activity of gene banks that
draws on methodology and analysis from evolutionary
biology, ecological genetics and landscape genetics.
Current and historical interactions between genetic
drift, mutation and selection configure natural varia-
tion across a species range (reviewed by Holsinger and
Weir 2009; Merimans and Hedrick 2011). These
dynamics play out at different geographic scales but
have the net effect of influencing gene flow and
eventual admixture. A well-curated ex situ collection
has a structure that can confirm genetic identity,
identify duplicates or hybrids, estimate under-sam-
pling of genetic diversity (i.e., gaps) and, ultimately,
guide future management decisions about efficient
sampling protocols and collection size (Lockwood
et al. 2007; Maxted et al. 2008; Ramirez-Villegas et al.
2010; Reeves et al. 2012).
Genetic structure can be estimated in crop wild
relatives using a number of complimentary methods
that include assignment tests and other population
genetic and phylogenetic approaches, which exploit
variation measured through molecular markers. The
goal of these analyses is to identify the range of gene
dispersal among sampling locations and to identify
major genetic lineages that make up the collection.
Estimating gene dispersal patterns from multi-locus
data has shifted from indirect estimates based on Fst
(Slatkin and Barton 1989; Whitlock and McCauley
1999) to new statistical methods in population genetics
that have been developed to better identify how genetic
variation is structured across the landscape (Pritchard
et al. 2000; Manel et al. 2003, 2005; Huelsenbeck and
Andolfatto 2007). These methods are able to help
reconcile cryptic patterns in genetic structure that may
be due to recent migration events with much older
biogeographic patterns (Wilson and Rannala 2003).
In this study we examine accessions of B. maritima
collected along a latitudinal transect extending up the
French Atlantic coast of France. In addition we
included in our analysis a set of accessions along the
coast of Corsica for use as representative genotypes
from the Mediterranean basin. The aim of this work is
to identify the scale and magnitude of differentiation
and diversity in this set of accessions, using both
molecular and quantitative traits. In particular we are
interested in assessing how genetic and morphometric
data estimate clinal variation and admixture along this
latitudinal gradient.
Materials and methods
Plant materials
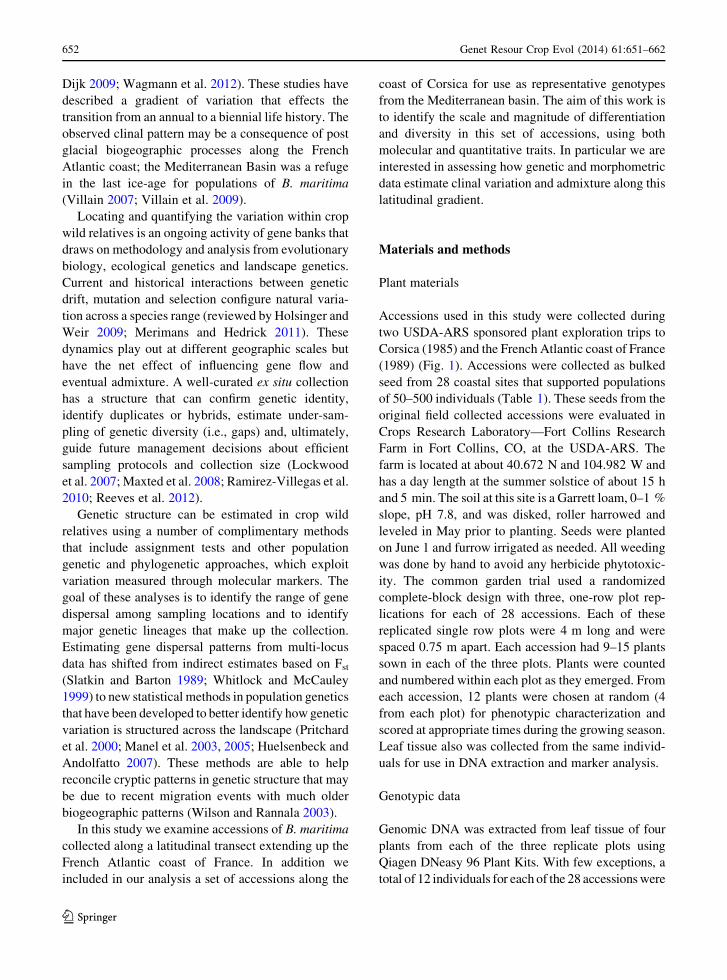
Accessions used in this study were collected during
two USDA-ARS sponsored plant exploration trips to
Corsica (1985) and the French Atlantic coast of France
(1989) (Fig. 1). Accessions were collected as bulked
seed from 28 coastal sites that supported populations
of 50–500 individuals (Table 1). These seeds from the
original field collected accessions were evaluated in
Crops Research Laboratory—Fort Collins Research
Farm in Fort Collins, CO, at the USDA-ARS. The
farm is located at about 40.672 N and 104.982 W and
has a day length at the summer solstice of about 15 h
and 5 min. The soil at this site is a Garrett loam, 0–1 %
slope, pH 7.8, and was disked, roller harrowed and
leveled in May prior to planting. Seeds were planted
on June 1 and furrow irrigated as needed. All weeding
was done by hand to avoid any herbicide phytotoxic-
ity. The common garden trial used a randomized
complete-block design with three, one-row plot rep-
lications for each of 28 accessions. Each of these
replicated single row plots were 4 m long and were
spaced 0.75 m apart. Each accession had 9–15 plants
sown in each of the three plots. Plants were counted
and numbered within each plot as they emerged. From
each accession, 12 plants were chosen at random (4
from each plot) for phenotypic characterization and
scored at appropriate times during the growing season.
Leaf tissue also was collected from the same individ-
uals for use in DNA extraction and marker analysis.
Genotypic data
Genomic DNA was extracted from leaf tissue of four
plants from each of the three replicate plots using
Qiagen DNeasy 96 Plant Kits. With few exceptions, a
total of 12 individuals for each of the 28 accessions were
652 Genet Resour Crop Evol (2014) 61:651–662
123
genotyped at 13 microsatellite (SSR) loci (Table 2)
using a Licor 4200 DNA Sequencer (Licor, Lincoln,
NE). PCR was carried out in 15 ll total volume as
previously described (Volk et al. 2005). Alleles were
called manually using Licor Saga GT software. Dupli-
cate samples from 12 individuals were extracted and
genotyped to estimate scoring error rates. To improve
scoring accuracy, loci were amplified and scored twice
for all samples. Alleles from replicate amplifications
were examined, and when alleles for replicates were not
identical, data were entered as ‘‘missing’’. Genotypic
data was used if no more than one locus was missing.
Phenotypic data
We measured five foliar traits, collected from three
mature leaves from each sampled individual. Leaf
length measured as the distance from leaf tip to the
distal terminus of the petiole (where it meets the leaf).
Leaf width was measured as the distance across the
widest portion of leaf surface, perpendicular to the
midrib. Petiole length was measured from leaf axil to
distal terminus of the petiole using a ruler. The distal
terminus of the petiole was considered to be located at
the line formed by connecting the points where the
right and left side leaf margins coincide with the
petiole. Petiole width was measured using a caliper
near the distal terminus of the petiole at the point
where the petiole first assumes a uniform width. Width
was measured perpendicular to the leaf midrib. The
petiole is curved at the terminus where it fuses with
leaf margins. Measurements were not taken in the
curved part, but further towards the leaf axial. Leaf
thickness was measured with a caliper to one side of
France
30 200 400
kilometers
N21
4
56
7
8*9
1011*
12
131415
16*17
18
1920*
22*21
23
2425
26
27
28
Fig. 1 Map of sampling locations for this study. Detailed descriptions given in Table 1
Genet Resour Crop Evol (2014) 61:651–662 653
123
the midrib, and not on top of any major lateral veins,
near the widest portion of the leaf. To remove
correlations between trait values, length and width
measurements of both the leaf and the petiole were
reduced to length/width ratios.
Data analysis
Molecular marker data
Descriptive statistics, including expected and observed
heterozygosities, differentiation between accessions
(overall and hierarchical Fst) and diversity within
accessions (as measured by the absolute number of
polymorphic alleles) and a sample adjusted metric of
allelic richness useful for group comparisons (El
Mousadik and Petit 1996), were estimated from
genotypic data using the software package GDA
(Lewis and Zaykin 2001) and FSTAT (Goudet 1995;
Lewis and Zaykin 2001). Distances between individual
genotypes were calculated as a proportion of shared
alleles using DARwin software (Perrier and Jacque-
moud-Collet 2006). The neighbor-joining tree using
these distances was produced within DARwin. Inter-
individual distances were rendered as an unrooted
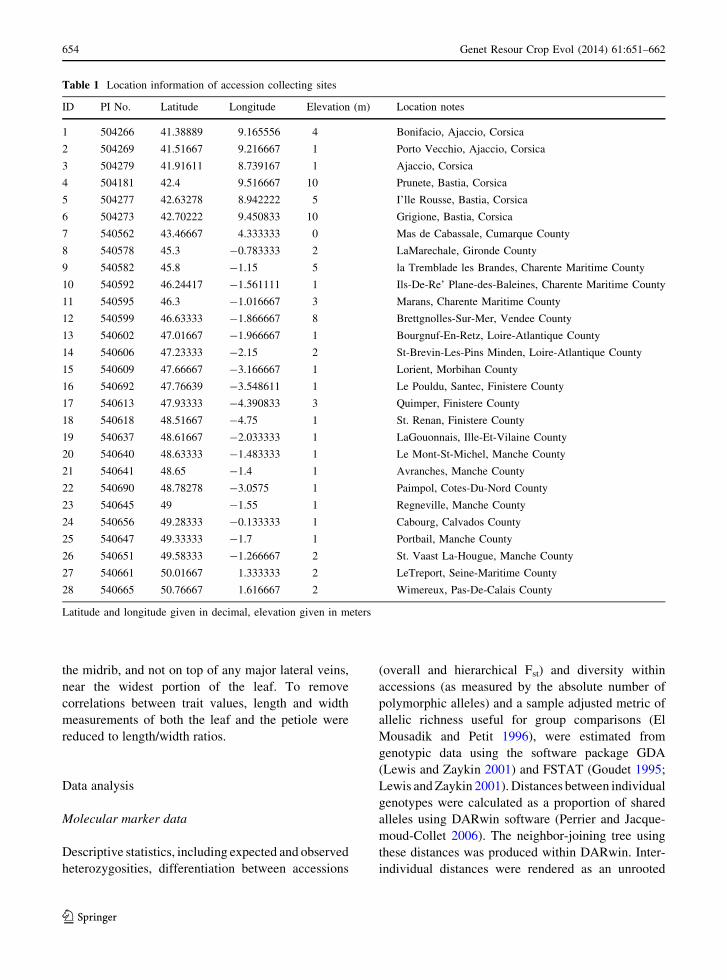
Table 1 Location information of accession collecting sites
ID PI No. Latitude Longitude Elevation (m) Location notes
1 504266 41.38889 9.165556 4 Bonifacio, Ajaccio, Corsica
2 504269 41.51667 9.216667 1 Porto Vecchio, Ajaccio, Corsica
3 504279 41.91611 8.739167 1 Ajaccio, Corsica
4 504181 42.4 9.516667 10 Prunete, Bastia, Corsica
5 504277 42.63278 8.942222 5 I’lle Rousse, Bastia, Corsica
6 504273 42.70222 9.450833 10 Grigione, Bastia, Corsica
7 540562 43.46667 4.333333 0 Mas de Cabassale, Cumarque County
8 540578 45.3 -0.783333 2 LaMarechale, Gironde County
9 540582 45.8 -1.15 5 la Tremblade les Brandes, Charente Maritime County
10 540592 46.24417 -1.561111 1 Ils-De-Re’ Plane-des-Baleines, Charente Maritime County
11 540595 46.3 -1.016667 3 Marans, Charente Maritime County
12 540599 46.63333 -1.866667 8 Brettgnolles-Sur-Mer, Vendee County
13 540602 47.01667 -1.966667 1 Bourgnuf-En-Retz, Loire-Atlantique County
14 540606 47.23333 -2.15 2 St-Brevin-Les-Pins Minden, Loire-Atlantique County
15 540609 47.66667 -3.166667 1 Lorient, Morbihan County
16 540692 47.76639 -3.548611 1 Le Pouldu, Santec, Finistere County
17 540613 47.93333 -4.390833 3 Quimper, Finistere County
18 540618 48.51667 -4.75 1 St. Renan, Finistere County
19 540637 48.61667 -2.033333 1 LaGouonnais, Ille-Et-Vilaine County
20 540640 48.63333 -1.483333 1 Le Mont-St-Michel, Manche County
21 540641 48.65 -1.4 1 Avranches, Manche County
22 540690 48.78278 -3.0575 1 Paimpol, Cotes-Du-Nord County
23 540645 49 -1.55 1 Regneville, Manche County
24 540656 49.28333 -0.133333 1 Cabourg, Calvados County
25 540647 49.33333 -1.7 1 Portbail, Manche County
26 540651 49.58333 -1.266667 2 St. Vaast La-Hougue, Manche County
27 540661 50.01667 1.333333 2 LeTreport, Seine-Maritime County
28 540665 50.76667 1.616667 2 Wimereux, Pas-De-Calais County
Latitude and longitude given in decimal, elevation given in meters
654 Genet Resour Crop Evol (2014) 61:651–662
123
dendrogram using FigTree v1.3.1 (Rambaut 2006;
Rambaut and Drummond 2009).
Population structure was evaluated with two com-
plementary Bayesian Markov Chain Monte Carlo
(MCMC) methods either using the whole data set of
28 accessions or a subset containing 21 accessions
distributed along the French Atlantic coast of France.
First, the approach of Huelsenbeck and Andolfatto
(2007) was implemented in the software STRUCTU-
RAMA and used to infer the number of genetic clusters
(K) from the genotypic data. K was treated as a random
variable with a Dirichlet process prior. The concentra-
tion parameter was set to 2. Each Markov chain was run
for 1 9 106 generations. The first half of the run was
treated as the burn in period (intended to allow the
chain to reach equilibrium), after which the chain was
sampled every 500 generations. A total of 100 inde-
pendent runs was conducted, each of which provided
an estimate of K as the number of subpopulations with
the highest posterior probability. The optimal K value
was inferred as the most common K value estimated
across the independent runs. Second, the software
STRUCTURE v2.2 (Pritchard et al. 2000) was used to
estimate admixture as the fractional assignment of a
genotype among the previously defined K clusters. The
largest fractional assignment is the membership coef-
ficient for the assigned cluster. The burn in period was
set to 5 9 105 generations, after which the chain was
sampled for 1 9 105 generations. Fifteen replicate
runs were conducted. Label switching and the possi-
bility of multimodality among independent runs was
corrected using CLUMPP (Jakobsson and Rosenberg
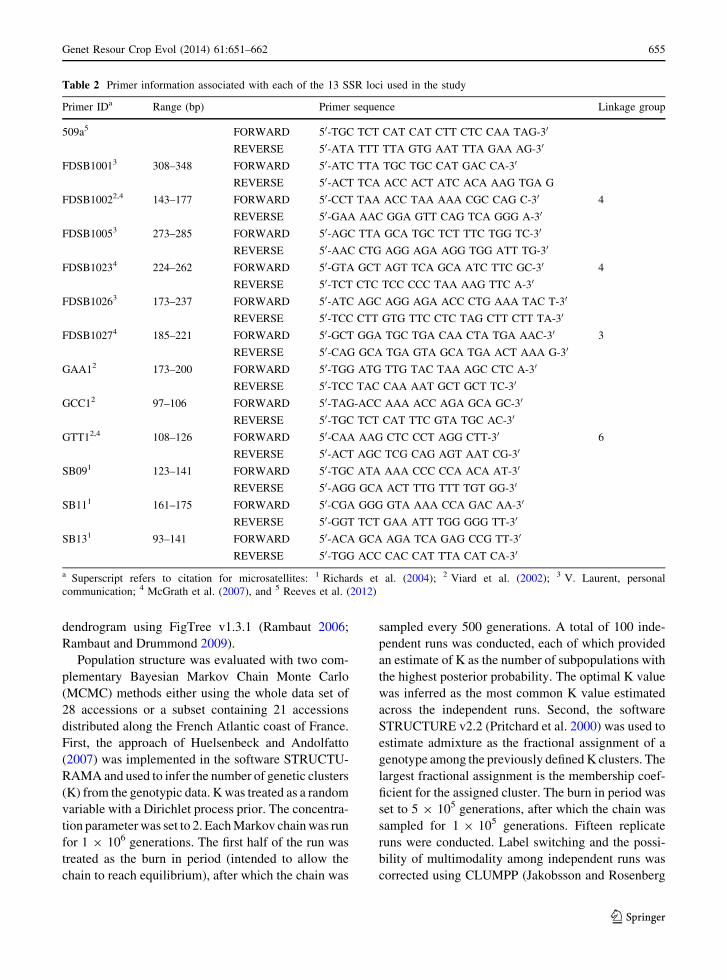
Table 2 Primer information associated with each of the 13 SSR loci used in the study
Primer IDa Range (bp) Primer sequence Linkage group
509a5 FORWARD 50-TGC TCT CAT CAT CTT CTC CAA TAG-30
REVERSE 50-ATA TTT TTA GTG AAT TTA GAA AG-30
FDSB10013 308–348 FORWARD 50-ATC TTA TGC TGC CAT GAC CA-30
REVERSE 50-ACT TCA ACC ACT ATC ACA AAG TGA G
FDSB10022,4 143–177 FORWARD 50-CCT TAA ACC TAA AAA CGC CAG C-30 4
REVERSE 50-GAA AAC GGA GTT CAG TCA GGG A-30
FDSB10053 273–285 FORWARD 50-AGC TTA GCA TGC TCT TTC TGG TC-30
REVERSE 50-AAC CTG AGG AGA AGG TGG ATT TG-30
FDSB10234 224–262 FORWARD 50-GTA GCT AGT TCA GCA ATC TTC GC-30 4
REVERSE 50-TCT CTC TCC CCC TAA AAG TTC A-30
FDSB10263 173–237 FORWARD 50-ATC AGC AGG AGA ACC CTG AAA TAC T-30
REVERSE 50-TCC CTT GTG TTC CTC TAG CTT CTT TA-30
FDSB10274 185–221 FORWARD 50-GCT GGA TGC TGA CAA CTA TGA AAC-30 3
REVERSE 50-CAG GCA TGA GTA GCA TGA ACT AAA G-30
GAA12 173–200 FORWARD 50-TGG ATG TTG TAC TAA AGC CTC A-30
REVERSE 50-TCC TAC CAA AAT GCT GCT TC-30
GCC12 97–106 FORWARD 50-TAG-ACC AAA ACC AGA GCA GC-30
REVERSE 50-TGC TCT CAT TTC GTA TGC AC-30
GTT12,4 108–126 FORWARD 50-CAA AAG CTC CCT AGG CTT-30 6
REVERSE 50-ACT AGC TCG CAG AGT AAT CG-30
SB091 123–141 FORWARD 50-TGC ATA AAA CCC CCA ACA AT-30
REVERSE 50-AGG GCA ACT TTG TTT TGT GG-30
SB111 161–175 FORWARD 50-CGA GGG GTA AAA CCA GAC AA-30
REVERSE 50-GGT TCT GAA ATT TGG GGG TT-30
SB131 93–141 FORWARD 50-ACA GCA AGA TCA GAG CCG TT-30
REVERSE 50-TGG ACC CAC CAT TTA CAT CA-30
a Superscript refers to citation for microsatellites: 1 Richards et al. (2004); 2 Viard et al. (2002); 3 V. Laurent, personal
communication; 4 McGrath et al. (2007), and 5 Reeves et al. (2012)
Genet Resour Crop Evol (2014) 61:651–662 655
123
2007) implemented in Structure Harvester (Evanno
et al. 2005). The average membership coefficients
calculated from aligned assignment matrices were
retained as a quantitative estimate of population
structure and admixture among the accessions.
Phenotypic data
The morphological trait measurements (leaf length/
width ratio, petiole length/width ratio and leaf thick-
ness) were summarized with descriptive statistics, and
analyzed with regression and multivariate analysis
using the statistical software JMP v10.0 (SAS Insti-
tute, Cary, NC). The morphological traits was ana-
lyzed independently as a two-way ANOVA with block
and accession_ID as the main effects. In addition, we
analyzed the relationship of trait value and latitude.
Each trait was examined independently using a linear
fit of latitude as X variable and trait value as the Y.
Block was used as a covariate.
To examine the relationship between diversity
estimates based on genetic versus morphological data
we used Canonical Discriminant Analysis. The goal
was to assess if a multivariate phenotype could be used
to predict its categorical group identity (population of
origin or its assigned genetic cluster from the SSR
analysis). For this analysis we used linear discriminant
analysis with prior probabilities proportional to their
occurrence. Significance was examined graphically
with a bi-plot of the first two canonical variables
showing the points, mean value of the discriminant
score for the group and an ellipse that corresponds to
the 95 % confidence interval of the mean. In addition a
Wilks Lambda test was used to test the significance of
the discriminant function using approximate F-statis-
tics and p-values.
Estimations of migration rates among genetic
clusters within the data set were conducted with the
software BA v3.0 (Wilson and Rannala 2003). This
Bayesian method is used to identify rates of recent
immigration from multi-locus data. Most significantly
this approach relaxes a few key assumptions typically
made in assignments tests or indirect gene flow
methods, such as letting genotype frequencies deviate
from Hardy–Weinberg equilibrium. To estimate the
posterior probabilities of migration, the MCMC chain
was run 2 9 106 iterations. The first half of the run
was used as a burn-in period after which the samples
were collected every 2,000 iterations. Upon the
author’s recommendation, we adjusted three of the
algorithms mixing parameters and performed 10
independent runs to look for acceptance rates of the
results and consistency of convergence.
Results
Molecular analysis
Each of the loci used in this study displayed a high
level of variability with PIC cores ranging from 0.91 to
0.3 (Table 3). This is reflected in the number of alleles
per locus and the number of observed genotypes
within the entire data set. Data filtering (used to limit
missing data to a maximum of one locus per multilo-
cus genotype) reduced the final sample size of the
study from 336 (12 individuals each for 28 accessions)
to 277 individuals (Table 4).
Patterns of diversity and differentiation across the
sample accessions revealed both clinal gradients and
admixture. The observed heterozygosity was high
across the set of accessions (mean of 0.48). The mean
inbreeding coefficient (f) was (0.13), and significantly
greater than zero. Variation for these two parameters
showed a gradient of values across latitudes within
both the entire set of 28 accessions and within only the
21 French Atlantic accessions. Inbreeding increased
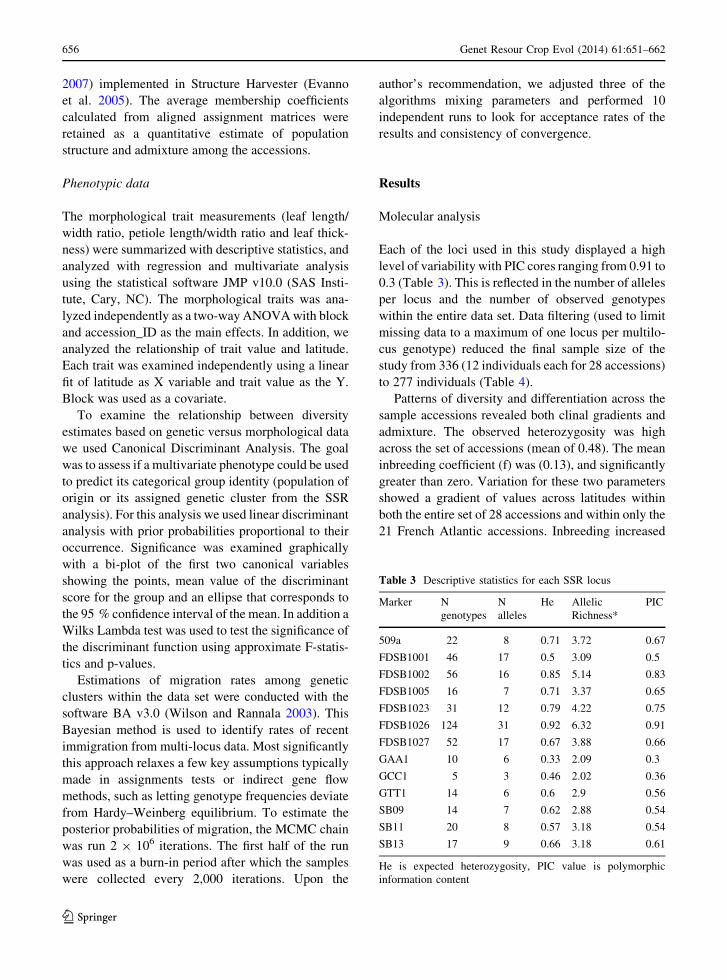
Table 3 Descriptive statistics for each SSR locus
Marker N
genotypes
N
alleles
He Allelic
Richness*
PIC
509a 22 8 0.71 3.72 0.67
FDSB1001 46 17 0.5 3.09 0.5
FDSB1002 56 16 0.85 5.14 0.83
FDSB1005 16 7 0.71 3.37 0.65
FDSB1023 31 12 0.79 4.22 0.75
FDSB1026 124 31 0.92 6.32 0.91
FDSB1027 52 17 0.67 3.88 0.66
GAA1 10 6 0.33 2.09 0.3
GCC1 5 3 0.46 2.02 0.36
GTT1 14 6 0.6 2.9 0.56
SB09 14 7 0.62 2.88 0.54
SB11 20 8 0.57 3.18 0.54
SB13 17 9 0.66 3.18 0.61
He is expected heterozygosity, PIC value is polymorphic
information content
656 Genet Resour Crop Evol (2014) 61:651–662
123
northward while heterozygosity increased southward
which support the idea of northward colonization from
species center of diversity in the Mediterranean basin.
Each regression was significant at the p \ 0.05 level
with R2 of 0.30 for observed heterozygosity and an R2
of 0.23 for inbreeding coefficient. In addition, we
examined the pattern of diversity as measured by
allelic richness, which controls for variation in sample
sizes across the French Atlantic sampling region. This
regression is significant at the p \ 0.001 level with an
R2 of 0.45 and shows a decrease in allelic richness with
increased latitude (Fig. 2). By contrast, isolation by
distance was not supported. Differentiation measured
as average Fst among all accessions was 0.14 with a
95 % confidence interval of (0.17–0.11). A Mantel test
between the French Atlantic accessions revealed no
significant correlation between pair-wise differentia-
tion (Fst) and geographic distance (data not shown).
Clustering the genotypic data using Bayesian
model-based methods revealed a strong genetic
discontinuity between the Mediterranean and French
Atlantic accessions. The mode value for K was found
to be two for the entire data set. The average posterior
probability was 0.98. Among 100 independent runs
K = 2 occurred 96 times. The mode value for K
among the 21 French Atlantic accessions was three
with an average posterior probability of 0.82 and
occurred in 88 % of the independent runs. Among all
the 28 accessions, there is a strong genetic disconti-
nuity between the Mediterranean and the French
Atlantic samples (Fig. 3a). However the pattern of
discontinuity is not precisely defined by these two
regions. Genotypes along the French Atlantic coast
were often assigned to the genetic cluster associated
with the Mediterranean accessions. The assignment
pattern observed in the whole data set also reappears
when the analysis is run at K = 3 for just the French
Atlantic accessions (Fig. 3b). From these observations
of genetic diversity we could identify three distinctive
genetic groups: a Mediterranean type (consisting of
the Corsican samples), an French Atlantic group, and a
set of genotypes found among accessions along the
French Atlantic that assign strongly (membership
coefficient above 0.8) to the Mediterranean type,
Table 4 Descriptive statistics for each accession used in the
study
ID PI no. N samples Weighted N He Ho f
1 504266 12 11.69 0.52 0.52 0
2 504269 8 7.54 0.5 0.51 -0.02
3 504279 12 11.46 0.67 0.63 0.06
4 504181 12 11.23 0.52 0.47 0.1
5 504277 12 11.31 0.61 0.58 0.05
6 504273 8 7.69 0.59 0.49 0.18
7 540562 12 11.15 0.67 0.54 0.2
8 540578 11 10.85 0.69 0.64 0.07
9 540582 8 6.85 0.55 0.44 0.21
10 540592 12 11.38 0.6 0.47 0.23
11 540595 8 7.31 0.62 0.53 0.15
12 540599 8 7.77 0.54 0.5 0.08
13 540602 12 11.62 0.5 0.41 0.18
14 540606 11 10.62 0.54 0.46 0.16
15 540609 8 7.62 0.46 0.43 0.09
16 540692 8 7.77 0.67 0.69 -0.04
17 540613 10 9.15 0.51 0.47 0.08
18 540618 8 7.92 0.58 0.47 0.21
19 540637 8 7.77 0.44 0.37 0.17
20 540640 12 11.08 0.54 0.45 0.17
21 540641 12 10.85 0.56 0.51 0.08
22 540690 7 6.77 0.47 0.47 0.01
23 540645 12 11.31 0.49 0.41 0.17
24 540656 8 7.69 0.61 0.54 0.11
25 540647 11 10.46 0.47 0.33 0.32
26 540651 8 7.54 0.56 0.36 0.37
27 540661 11 10.77 0.49 0.38 0.23
28 540665 8 7.85 0.4 0.29 0.3
Weighted N takes into account missing data in genotyping
scores, He is expected heterozygosity, Ho is observed
heterozygosity and f is a inbreeding coefficient
Degrees latitude
40 42 44 46 48 50 52
Mea
n al
lelic
ric
hnes
s at
13
SS
R lo
ci
2.0
2.2
2.4
2.6
2.8
3.0
3.2
3.4
3.6
3.8
Fig. 2 Bi-plot of alleleic diversity in SSR loci as a function of
sample site latitude. One way ANOVA is significant at
p = 0.0003. Coefficient of determination (R2) was 0.39
Genet Resour Crop Evol (2014) 61:651–662 657
123
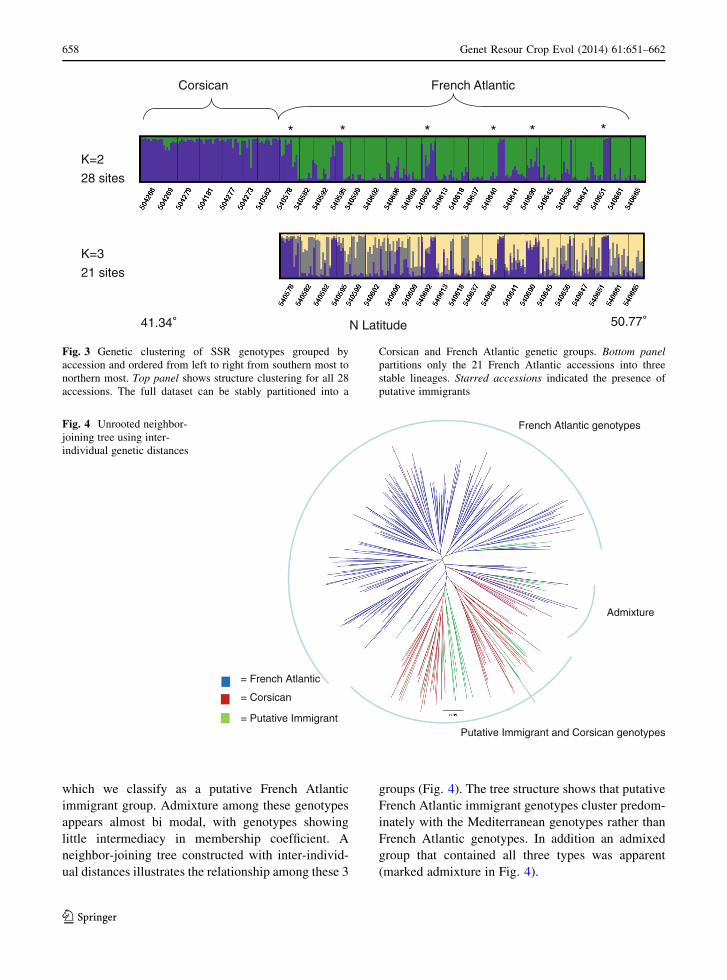
which we classify as a putative French Atlantic
immigrant group. Admixture among these genotypes
appears almost bi modal, with genotypes showing
little intermediacy in membership coefficient. A
neighbor-joining tree constructed with inter-individ-
ual distances illustrates the relationship among these 3
groups (Fig. 4). The tree structure shows that putative
French Atlantic immigrant genotypes cluster predom-
inately with the Mediterranean genotypes rather than
French Atlantic genotypes. In addition an admixed
group that contained all three types was apparent
(marked admixture in Fig. 4).
Corsican French Atlantic
K=2
28 sites
K=3
21 sites
* * * * **
41.34 50.77N Latitude
Fig. 3 Genetic clustering of SSR genotypes grouped by
accession and ordered from left to right from southern most to
northern most. Top panel shows structure clustering for all 28
accessions. The full dataset can be stably partitioned into a
Corsican and French Atlantic genetic groups. Bottom panel
partitions only the 21 French Atlantic accessions into three
stable lineages. Starred accessions indicated the presence of
putative immigrants
French Atlantic genotypes
Putative Immigrant and Corsican genotypes
Admixture
= French Atlantic
= Corsican
= Putative Immigrant
Fig. 4 Unrooted neighbor-
joining tree using inter-
individual genetic distances
658 Genet Resour Crop Evol (2014) 61:651–662
123
Phenotypic analysis
Phenotypic foliar traits were significantly different
among accessions in two-way ANOVA using block
and accession_ID as the main effects and either leaf/
length ratio, petiole length/width ratio or leaf thick-
ness as the response variable. Leaf length/width ratio,
petiole length/width ratio and leaf thickness were
significant at the 0.001, 0.05 and 0.001 levels respec-
tively. The linear regression of these three traits on
latitude resulted in significance for leaf length/width
ratio (y = 0.75 ? 0.02x, p \ 0.001) and leaf thick-
ness (y = -0.32 ? 0.02x, p \ 0.001) but not petiole
length/width ratio (p = 0.21). Both leaf length/width
ratio and leaf thickness increased with increasing
latitude but linear model had low predictive power
(R2 = 0.05 and 0.16, respectively).
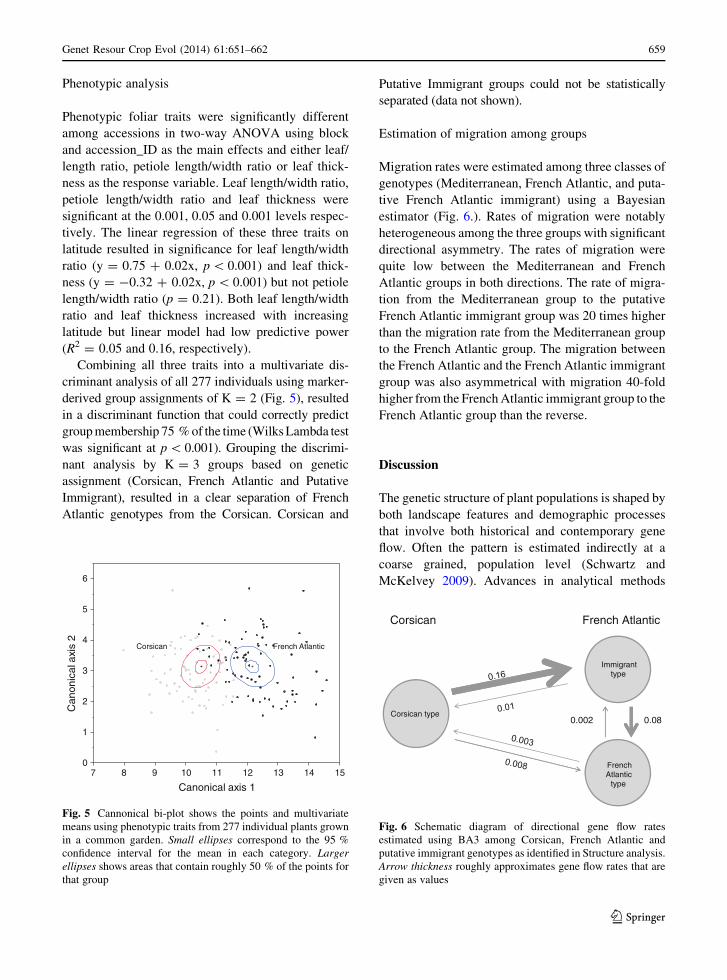
Combining all three traits into a multivariate dis-
criminant analysis of all 277 individuals using marker-
derived group assignments of K = 2 (Fig. 5), resulted
in a discriminant function that could correctly predict
group membership 75 % of the time (Wilks Lambda test
was significant at p \ 0.001). Grouping the discrimi-
nant analysis by K = 3 groups based on genetic
assignment (Corsican, French Atlantic and Putative
Immigrant), resulted in a clear separation of French
Atlantic genotypes from the Corsican. Corsican and
Putative Immigrant groups could not be statistically
separated (data not shown).
Estimation of migration among groups
Migration rates were estimated among three classes of
genotypes (Mediterranean, French Atlantic, and puta-
tive French Atlantic immigrant) using a Bayesian
estimator (Fig. 6.). Rates of migration were notably
heterogeneous among the three groups with significant
directional asymmetry. The rates of migration were
quite low between the Mediterranean and French
Atlantic groups in both directions. The rate of migra-
tion from the Mediterranean group to the putative
French Atlantic immigrant group was 20 times higher
than the migration rate from the Mediterranean group
to the French Atlantic group. The migration between
the French Atlantic and the French Atlantic immigrant
group was also asymmetrical with migration 40-fold
higher from the French Atlantic immigrant group to the
French Atlantic group than the reverse.
Discussion
The genetic structure of plant populations is shaped by
both landscape features and demographic processes
that involve both historical and contemporary gene
flow. Often the pattern is estimated indirectly at a
coarse grained, population level (Schwartz and
McKelvey 2009). Advances in analytical methods
Corsican French Atlantic
7 8 9 10 11 12 13 14 15
Canonical axis 1
0
1
2
3
4
5
6
Can
onic
al a
xis
2
Fig. 5 Cannonical bi-plot shows the points and multivariate
means using phenotypic traits from 277 individual plants grown
in a common garden. Small ellipses correspond to the 95 %
confidence interval for the mean in each category. Larger
ellipses shows areas that contain roughly 50 % of the points for
that group
French AtlanticCorsican
Corsican type
French Atlantic
type
Immigrant type
0.080.002
Fig. 6 Schematic diagram of directional gene flow rates
estimated using BA3 among Corsican, French Atlantic and
putative immigrant genotypes as identified in Structure analysis.
Arrow thickness roughly approximates gene flow rates that are
given as values
Genet Resour Crop Evol (2014) 61:651–662 659
123
make it possible to estimate the genetic origin of
individual immigrant genotypes (Waples and Gag-
giotti 2006). These methods do not look just for broad
signatures of differentiation at the population level but
are able to quantify the effect of admixture on
individual genotypes and may better describe the
biological reality of the population structure within a
species.
Distributions of many species in Europe have been
impacted by cycles of glaciation in that region of the
world (Hewitt 1999, 2000; Schmitt 2007). This pattern
of phylogeographic distribution is also observed in B.
maritima through variation in the chloroplast haplo-
type data [Villain (2007, 2009; reviewed by Biancardi
et al. 2012, Chap. 3.22]. Differences between French
Atlantic and Mediterranean populations of sea beet
have been noted by others including Doney (1992) and
Letschert (1993), who also found greater diversity
among the Mediterranean populations using allozyme
analyses. Sea beet has the Mediterranean as its center
of diversity and, most likely, center of domestication
(Doney 1992; Viard et al. 2004; Fievet et al. 2007,
Ford-Lloyd et al. 1975; Biancardi et al. 2012).
Although Letschert and Frese (1993) attribute at least
part of the greater variation in Mediterranean popu-
lations of sea beet to the ‘‘dynamic and variable
habitat’, it is likely that the associated drift effects
from colonization of the North French Atlantic coast
from Mediterranean refugia after the last ice-age has
allowed less time for these populations to develop the
diversity seen in the longer colonized habitats in the
Mediterranean regions.
As a consequence of this biogeographic history
several authors have described a continuous latitudinal
cline in life history traits that occurs among popula-
tions along the French Atlantic coast of France (Van
Dijk et al. 1997; Boudry et al. 2002; Hautekeete et al.
2002a; Wagmann et al. 2012). In these studies it was
demonstrated that there is a complex north–south cline
in flowering time across the French Atlantic sampling
region. These data suggest that flowering time is a
consequence of selection on photoperiod sensitivity
and vernalization requirement across this region
(Reeves et al. 2012). The distribution of these traits
is thought to be influenced by gene flow and demo-
graphic dynamics at both metapopulation and regional
scales (Van Dijk 2009).
Our results support a phylogeographic pattern that
separates the French Atlantic accessions from our
reference Corsican accessions. Viewed at the level of
sampled accessions, the allelic richness and heterozy-
gosity decrease while inbreeding levels increase
northward in a pattern consistent with glacial oscilla-
tions and range expansion and contraction. The main
genetic discontinuity identified in the Bayesian ana-
lysis stably clusters the Corsican accessions from the
rest of the French Atlantic accessions. This structure is
also supported by phenotypic discriminant analysis
using foliar traits.
The broad genetic and phenotypic discontinuity
appears to be overlaid with a more complex pattern of
recent gene flow. While Bayesian clustering separates
Corsican from French Atlantic genotypes, the data
also show a recurrent pattern of Corsican types up the
French Atlantic coast. The pattern might be expected
as gene flow among these coastal sampling sites
creates a gradient of admixture; however the observed
pattern shows a discrete and localized grouping of
Corsican genotypes. The Bayesian analysis showed
notable bi-modal membership coefficients where
individual genotypes are either strongly and unam-
biguously assigned to the Corsican or the French
Atlantic cluster including the putative immigrants.
Further analysis of these putative immigrants shows
that they are phenotypically distinguishable from the
more common French Atlantic phenotypes and indis-
tinguishable from the Corsican types. Estimate of
reciprocal gene flow among putative immigrants and
French Atlantic genotypes are highly asymmetrical.
Taken together, the lack of intermediacy in the
genotypic assignments, the phenotypic differentiation
and the asymmetry in estimated gene flow suggest that
immigrants identified in this study may be of recent
origin and could represent the result of an ongoing
dispersal dynamic. While the sampling design does
not allow us to determine the specific origin of the
putative immigrants (sources outside the sampling
accessions cannot be excluded), our analysis supports
the hypothesis that what once considered a gradual
cline is actually an admixed mosaic of genotypes.
Statistical tests that describe the geographic struc-
ture of intra specific variation are essential to many
types of genetic resources research. Accurate estima-
tion of genetic discontinuities and regions of high
diversity are important for locating populations that
may contain novel adaptations. Although isolation by
distance has been demonstrated in many plant species,
geography cannot always be a surrogate for genetic
660 Genet Resour Crop Evol (2014) 61:651–662
123
differentiation: validation is necessary (Wilson and
Rannala 2003). This work shows that large scale
patterns of genetic structure that might have built over
long periods of time are subject to contemporary gene
flow dynamics that may create mosaic distributions of
genetic diversity that are more challenging to interpret
in a strictly spatial context. Accounting for these
processes will improve the way we describe the scale
of adaptive differentiation and may help improve the
structure and utilization of genetic resources
collections.
References
Biancardi E, Panella LW, Lewellen RT (2012) Beta maritima,
the origin of beets. Springer, New York
Boudry P, Mccombie H, Van Dijk H (2002) Vernalization
requirement of wild beet Beta vulgaris ssp. maritima:
among population variation and its adaptive significance.
J Ecol 90:693–703
de Bock TSM (1986) The genus Beta: domestication, taxonomy
and interspecific hybridization for plant breeding. Acta
Horticul 182:335–343
Doney DL (1992) Morphology of North French Atlantic Beta.
In: Frese L (ed) International Beta genetic resources net-
work. A report on the 2nd international Beta genetic
resources workship held at the institute for crop science and
plant breeding, Braunschweig, Germany, 24–28 June 1991.
International Crop Network Series No. 7. IBPGR, Rome,
pp 17–28
El Mousadik A, Petit RJ (1996) High level of genetic differen-
tiation for allelic richness among populations of the argan
tree [Argania spinosa (L.) Skeels] endemic to Morocco.
Theor Appl Genet 92:832–839
Evanno G, Regnaut S, Goudet J (2005) Detecting the number of
clusters of individuals using the software structure: a
simulation study. Mol Ecol 14:2611–2620
Fievet V, Touzet P, Arnaud JF, Cuguen J (2007) Spatial analysis
of nuclear and cytoplasmic DNA diversity in wild sea beet
(Beta vulgaris ssp. maritima) populations: do marine cur-
rents shape the genetic structure? Mol Ecol 16:1847–1864
Ford-Lloyd BV, Williams ALS, Williams JT (1975) A revision
of Beta section Vulgares (Chenopodiaceae), with new light
on the origin of cultivated beets. Bot J Linn Soc 71:89–102
Frese L, Desprez B, Ziegler D (2001) Potential of genetic
resources and breeding strategies for base-broadening in
Beta. In: Cooper HD, Spillane C, Hodgkin T (eds)
Broadening the genetic base of crop production. FAO,
IBPRGI jointly with CABI Publishing, Rome, pp 295–309
Goudet J (1995) FSTAT (Version 1.2): a computer program to
calculate F-statistics. J Hered 86:485–486
Gur A, Zamir D (2004) Unused natural variation can lift yield
barriers in plant breeding. PLoS Biol 2:e245
Harlan JR (1976) Genetic resources in wild relatives of crops.
Crop Sci 16:329–333
Hautekeete NC, Piquot Y, Van Dijk H (2002a) Life span in Beta
vulgaris ssp. maritima: the effects of age at first repro-
duction and disturbance. J Ecol 90:508–516
Hautekeete NC, Piquot Y, Van Dijk H (2002b) Variation in
ageing and meristemic activity in relation to flower-bud
and fruit excision in the Beta species complex. New Phytol
154:575–579
Hewitt GM (1999) Post-glacial re-colonization of European
biota. Biol J Linn Soc 68:87–112
Hewitt G (2000) The genetic legacy of the Quaternary ice ages.
Nature 405:907–913
Holsinger KE, Weir BS (2009) Genetics in geographically
structured populations: defining, estimating and interpret-
ing Fst. Nat Rev Genet 10:639–650
Huelsenbeck JP, Andolfatto P (2007) Inference of population
structure under a dirichlet process model. Genetics
175:1787–1802
Jakobsson M, Rosenberg NA (2007) CLUMPP: a cluster
matching and permutation program for dealing with label
switching and multimodality in analysis of population
structure. Bioinformatics 23:1801–1806
Letschert JPW (1993) Beta section Beta: biogeographical pat-
terns of variation, and taxonomy. Ph.D. Wageningen
Agricultural University Papers, pp 93–1
Letschert JPW, Frese L (1993) Analysis of morphological var-
iation in wild beet (Beta vulgaris L.) from Sicily. Genet
Resour Crop Evol 40:15–24
Letschert JPW, Lange W, Frese L, van Der Berg RG (1994)
Taxonomy of Beta section Beta. J Sugar Beet Res 31:69–85
Lewis PO, Zaykin D (2001) GDA user’s manual. Department of
Ecology and Evolutionary Biology, University of Con-
necticut, http://lewis.eeb.uconn.edu/lewishome
Lockwood DR, Richards CM, Volk GM (2007) Probabilistic
models for collecting genetic diversity: comparisons,
caveats and limitations. Crop Sci 47:859–866
Manel S, Schwartz MK, Luikart G, Taberlet P (2003) Landscape
genetics: combining landscape ecology and population
genetics. Trends Ecol Evol 18:189–197
Manel S, Gaggiotti OE, Waples RS (2005) Assignment meth-
ods: matching biological questions with appropriate tech-
niques. Trends Ecol Evol 20:136–142
Maxted N, Ford-Lloyd BV, Jury SL, Kell SP, Scholten MA
(2006) Towards a definition of a crop wild relative. Biodiv
Conserv 15:2673–2685
Maxted N, Dulloo E, Ford-Lloyd BV, Iriondo JM, Jarvis A
(2008) Gap analysis: a tool for complementary genetic
conservation assessment. Divers Distrib 14:1018–1030
McCouch SR, McNally KL, Wang W, Sackville Hamilton R
(2012) Genomics of gene banks: a case study in rice. Am J
Bot 99:407–423
McGrath JM, Trebbi D, Fenwick A, Panella L, Schulz B, Lau-
rent V, Barnes S, Murray SC (2007) An open-source first-
generation molecular genetic map from a sugar-
beet 9 table beet cross and its extension to physical
mapping. Plant Genom 47:27–44. (A supplement to Crop
Science)
Merimans PG, Hedrick PW (2011) Assessing population
structure: Fst and related measures. Mol Ecol Res 11:5–18
Panella L, Lewellen RT (2007) Broadening the genetic base of
sugar beet: introgression from wild relatives. Euphytica
154:382–400
Genet Resour Crop Evol (2014) 61:651–662 661
123
Perrier X, Jacquemoud-Collet JP (2006) DARwin software.
http://darwin.cirad.fr/Home.php. Accessed 20 Feb 2013
Pritchard JK, Stephens M, Donnelly P (2000) Inference of
population structure using multilocus genotype data.
Genetics 155:945–959
Rambaut A (2006) FigTree v1.3.1. 1.3.1 edn. http://tree.bio.ed.
ac.uk/. Accessed 20 Feb 2013
Rambaut A, Drummond A (2009). FigTree v1. 3.1. Computer
program and documentation distributed by the author at
http://tree.bio.ed.ac.uk/software
Ramirez-Villegas J, Khoury C, Jarvis A, Debouck DG, Guarino
L (2010) A gap analysis methodology for collecting crop
genepools: a case study with Phaseolus beans. PLoS One
5:e13497
Reeves P, Panella L, Richards C (2012) Retention of agro-
nomically important variation in germplasm core collec-
tions: implications for allele mining. Theor Appl Genet
124:1155–1171
Richards CM, Brownson M, Mitchell S, Kresovich S, Panella L
(2004) Length polymorphisms of simple sequence repeats
in Beta vulgaris. Mol Ecol Notes 4:243–245
Santoni S, Berville A (1995) Characterization of the nuclear
ribosomal DNA units and phylogeny of Beta L. wild forms
and cultivated beets. Theor Appl Genet 83:533–542
Schmitt T (2007) Molecular biogeography of Europe: pleisto-
cene cycles and postglacial trends. Frontiers Zool 4:11–24
Schwartz M, McKelvey K (2009) Why sampling scheme mat-
ters: the effect of sampling scheme on landscape genetic
results. Conserv Genet 10:441–452
Slatkin M, Barton NH (1989) A comparison of three indirect
methods for estimating average levels of gene flow. Evo-
lution 43:1349–1368
Tanksley SD, McCouch SR (1997) Seed banks and molecular
maps: unlocking genetic potential from the wild. Science
277:1063–1066
Van Dijk H (2009) Evolutionary change in flowering phenology
in the iteroparous herb Beta vulgaris ssp. maritima: a
search for the underlying mechanisms. J Exp Bot
60:3143–3155
Van Dijk H, Boudry P (1992) Genetic variation for life histories
in Beta maritima. In: International Beta genetic resources
network. A report on the 2nd international WBN workshop,
institute for crop science and plant breeding, Braun-
schweig, Germany, 24–28, June, 1991. International Crop
Network Series No. 7. IPGRI, Rome, pp 9–16
Van Dijk H, Boudry P, Mccombie H, Vernet P (1997) Flowering
time in wild beet (Beta vulgaris ssp. maritima) along a
latitudinal cline. Acta Oecol 18:47–60
Viard F, Bernard J, Desplanque B (2002) Crop-weed interac-
tions in the Beta vulgaris complex at a local scale: allelic
diversity and gene flow within sugar beet fields. Theor
Appl Genet 104:688–697
Viard F, Arnaud J-F, Delescluse M, Cuguen J (2004) Tracing
back seed and pollen flow within the crop-wild Beta vul-
garis complex: genetic distinctiveness vs. hot spots of
hybridization over a regional scale. Mol Ecol 13:1357–
1364
Villain S (2007) Histoire evolutive de la section Beta. Ph.D.
Universite des Sciences et Technologies de Lille
Villain S, Touzet P, Cuguen J (2009) Reconstructing the evo-
lutionary history of Beta section Beta with molecular data.
A focus on the Canary Islands. In: Frese L, Germeier CU,
Lipman E, Maggioni L (eds) Report of the 3rd joint
meeting of the ECP/GR Beta working group and world
Beta network, 8–10 March 2006. Tenerife, Spain. Bio-
versity International, Rome, Italy
Volk GM, Richards CM, Reilley AA, Henk AD, Forsline PL,
Aldwinckle HS (2005) Ex situ conservation of vegetatively
propagated species: development of a seed-based core
collection for Malus sieversii. J Am Soc Hortic Sci
130:203–210
Wagmann K, Hautekeete NC, Piquot Y, Meunier C, Schmitt SE,
Van Dijk H (2012) Seed dormancy distribution: explana-
tory ecological factors. Ann Bot 110:1205–1219
Waples RS, Gaggiotti O (2006) What is a population? An
empirical evaluation of some genetic methods for identi-
fying the number of gene pools and their degree of con-
nectivity. Mol Ecol 15:1419–1439
Whitlock MC, McCauley DE (1999) Indirect measures of gene
flow and migration: FST[ne]1/(4Nm ? 1). Heredity
82:117–125
Wilson GA, Rannala B (2003) Bayesian inference of recent
migration rates using multilocus genotypes. Genetics
163:1177–1191
662 Genet Resour Crop Evol (2014) 61:651–662
123

![Pemphigus Vulgaris [Print] - eMedicine Dermatology Vulgaris .pdf · emedicine.medscape.com eMedicine Specialties > Dermatology > Bullous Diseases Pemphigus Vulgaris Bassam Zeina,](https://img.dokumen.tips/doc/110x75/5c984ab609d3f21c3a8b874e/pemphigus-vulgaris-print-emedicine-vulgaris-pdf-emedicinemedscapecom.jpg)