Embed Size (px)
Citation preview

March 10, 2020
FY 2019
Results Presentation
1
2
Disclaimer
This presentation contains or incorporates by reference ‘forward-looking statements’ regarding the belief orcurrent expectations of Union Bank Plc, the Directors and other members of its senior management about theGroup’s businesses and the transactions described in this presentation. Generally, words such as ‘‘could’’,‘‘will’’, ‘‘expect’’, ‘‘intend’’, ‘‘anticipate’’, ‘‘believe’’, ‘‘plan’’, ‘‘seek’’ or similar expressions identify forward-lookingstatements.
These forward-looking statements are not guarantees of future performance. Rather, they are based on currentviews and assumptions and involve known and unknown risks, uncertainties and other factors, many of whichare outside the control of the Company and/or its Group and are difficult to predict, that may cause actualresults to differ materially from any future results or developments expressed or implied from the forward-looking statements. Such risks and uncertainties include, but are not limited to, regulatory developments,competitive conditions, technological developments and general economic conditions. The Bank assumes noresponsibility to update any of the forward looking statements contained in this presentation.
Any forward-looking statement contained in this presentation based on past or current trends and/or activitiesof Union Bank should not be taken as a representation that such trends or activities will continue in the future.No statement in this presentation is intended to be a profit forecast or to imply that the earnings of theCompany for the current year or future years will necessarily match or exceed the historical or publishedearnings of the Company. Each forward-looking statement speaks only as of the date of the particularstatement. Union Bank expressly disclaims any obligation or undertaking to release publicly any updates orrevisions to any forward-looking statements contained herein to reflect any change in Union Bank’sexpectations with regard thereto or any change in events, conditions or circumstances on which any suchstatement is based.
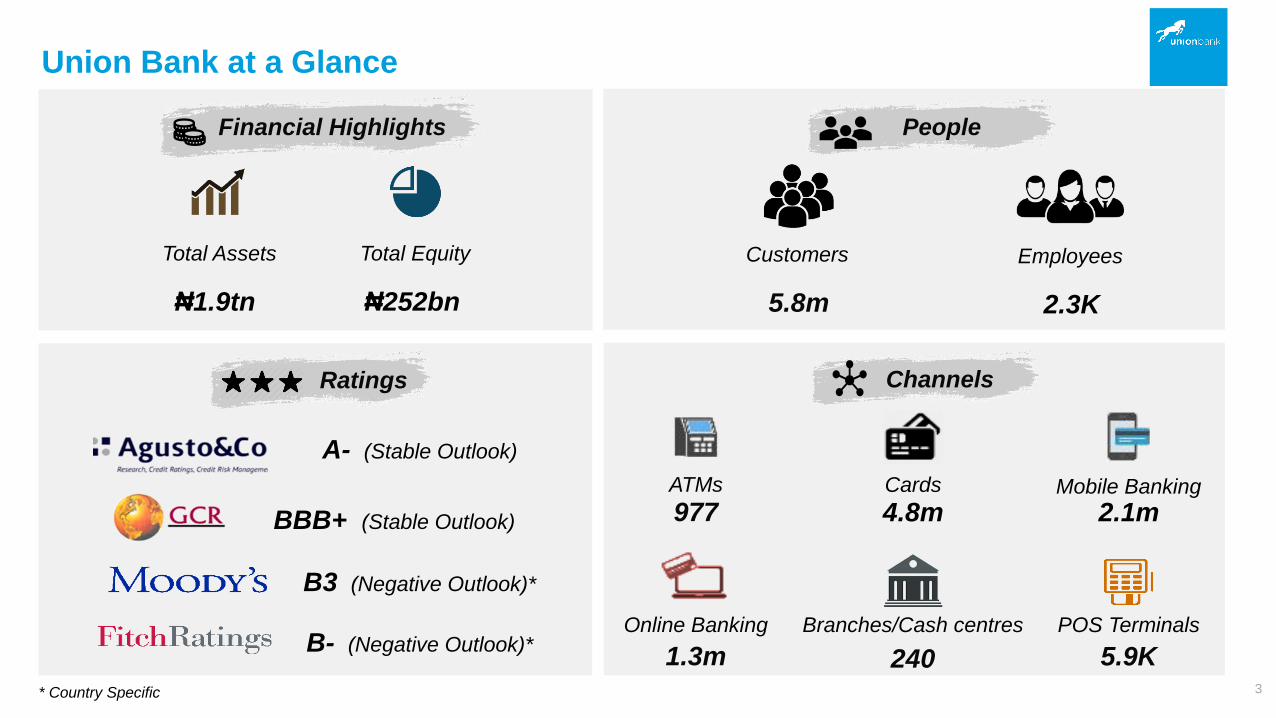
Union Bank at a Glance
Financial Highlights
ChannelsRatings
Total Assets Total Equity
₦1.9tn ₦252bn
A- (Stable Outlook)
B3 (Negative Outlook)*
B- (Negative Outlook)*
* Country Specific
ATMs
977Cards
4.8mMobile Banking
2.1m
1.3m
Branches/Cash centres
240
Online Banking POS Terminals
5.9K
Customers Employees
5.8m 2.3K
BBB+ (Stable Outlook)
3
People
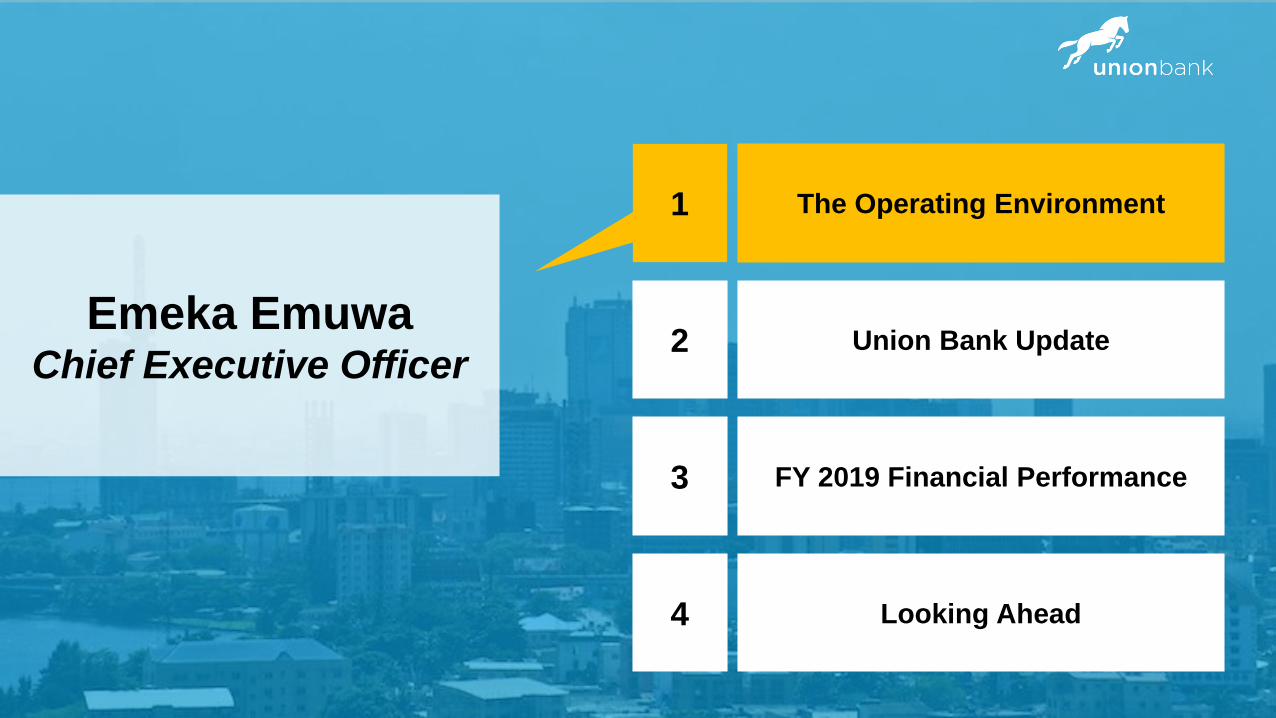
The Operating Environment
Union Bank Update
FY 2019 Financial Performance
Looking Ahead
2
3
4
1
Emeka EmuwaChief Executive Officer
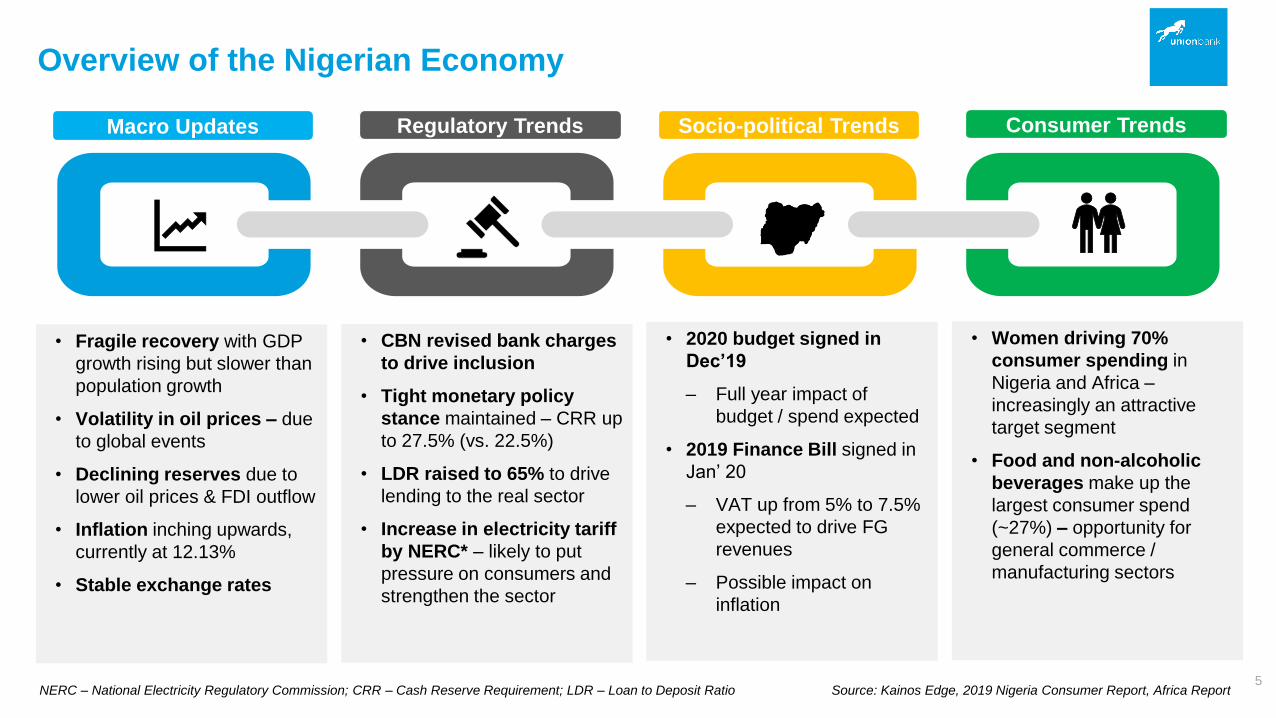
Overview of the Nigerian Economy
NERC – National Electricity Regulatory Commission; CRR – Cash Reserve Requirement; LDR – Loan to Deposit Ratio
• Fragile recovery with GDP
growth rising but slower than
population growth
• Volatility in oil prices – due
to global events
• Declining reserves due to
lower oil prices & FDI outflow
• Inflation inching upwards,
currently at 12.13%
• Stable exchange rates
• CBN revised bank charges
to drive inclusion
• Tight monetary policy
stance maintained – CRR up
to 27.5% (vs. 22.5%)
• LDR raised to 65% to drive
lending to the real sector
• Increase in electricity tariff
by NERC* – likely to put
pressure on consumers and
strengthen the sector
• 2020 budget signed in
Dec’19
‒ Full year impact of
budget / spend expected
• 2019 Finance Bill signed in
Jan’ 20
‒ VAT up from 5% to 7.5%
expected to drive FG
revenues
‒ Possible impact on
inflation
• Women driving 70%
consumer spending in
Nigeria and Africa –
increasingly an attractive
target segment
• Food and non-alcoholic
beverages make up the
largest consumer spend
(~27%) – opportunity for
general commerce /
manufacturing sectors
Macro Updates Regulatory Trends Socio-political Trends Consumer Trends
Source: Kainos Edge, 2019 Nigeria Consumer Report, Africa Report 5
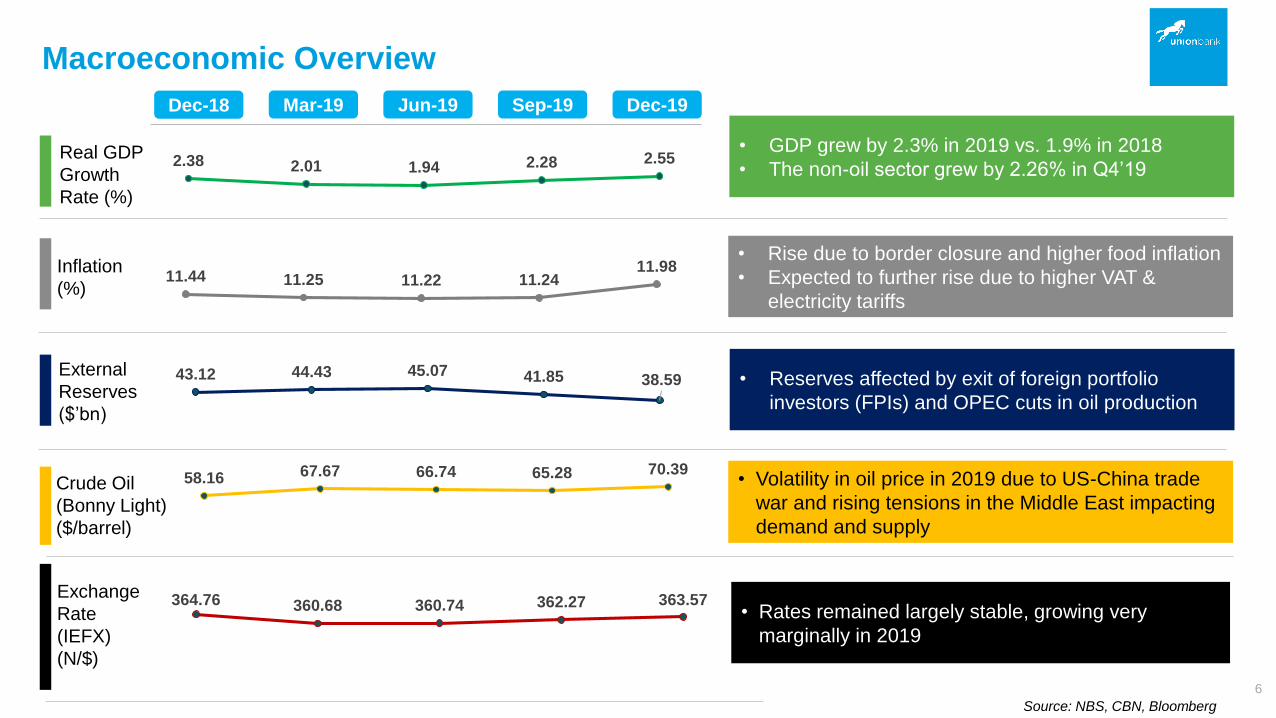
Real GDP
Growth
Rate (%)
Inflation
(%)
External
Reserves
($’bn)
Crude Oil
(Bonny Light)
($/barrel)
Exchange
Rate
(IEFX)
(N/$)
Dec-18 Mar-19 Jun-19 Sep-19 Dec-19
2.38 2.01 1.94 2.28 2.55• GDP grew by 2.3% in 2019 vs. 1.9% in 2018
• The non-oil sector grew by 2.26% in Q4’19
• Rise due to border closure and higher food inflation
• Expected to further rise due to higher VAT &
electricity tariffs
43.12 44.43 45.07 41.85 38.59 • Reserves affected by exit of foreign portfolio
investors (FPIs) and OPEC cuts in oil production
• Volatility in oil price in 2019 due to US-China trade
war and rising tensions in the Middle East impacting
demand and supply
58.16 67.67 66.74 65.28 70.39
364.76 360.68 360.74 362.27 363.57• Rates remained largely stable, growing very
marginally in 2019
Macroeconomic Overview
Source: NBS, CBN, Bloomberg
11.44 11.25 11.22 11.2411.98
6
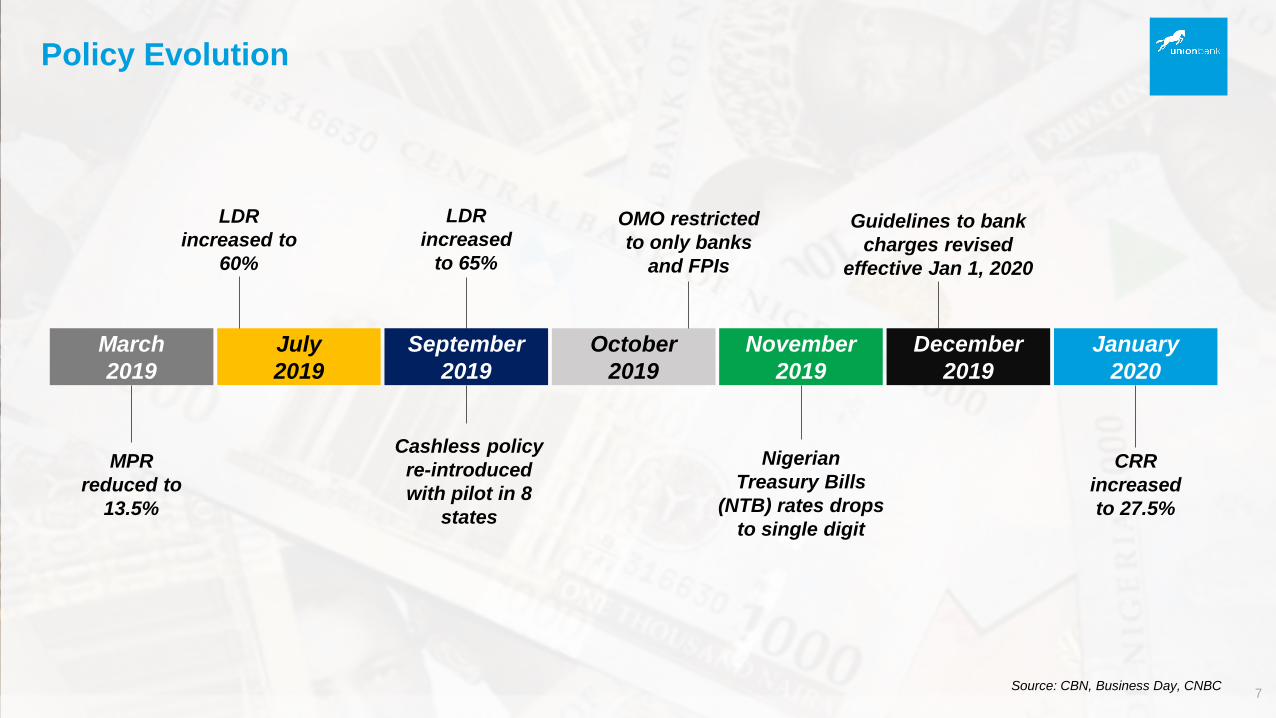
Policy Evolution
7Source: CBN, Business Day, CNBC
July
2019
September
2019
October
2019
December
2019
January
2020
Cashless policy
re-introduced
with pilot in 8
states
LDR
increased to
60%
November
2019
OMO restricted
to only banks
and FPIs
LDR
increased
to 65%
Nigerian
Treasury Bills
(NTB) rates drops
to single digit
Guidelines to bank
charges revised
effective Jan 1, 2020
CRR
increased
to 27.5%
March
2019
MPR
reduced to
13.5%
The Operating Environment
Union Bank Update
FY 2019 Financial Performance
Looking Ahead
1
3
4
2
Emeka EmuwaChief Executive Officer
8
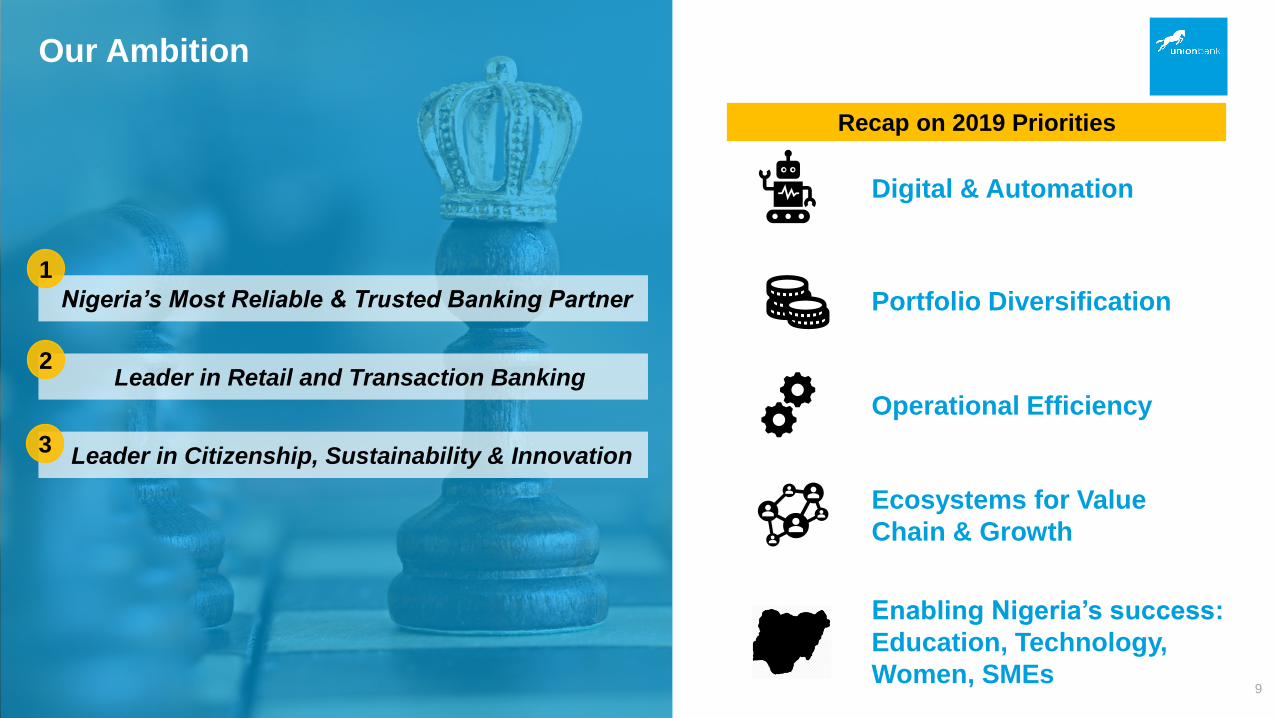
Our Ambition
Recap on 2019 Priorities
Digital & Automation
Portfolio Diversification
Operational Efficiency
Enabling Nigeria’s success:
Education, Technology,
Women, SMEs
Ecosystems for Value
Chain & Growth
Nigeria’s Most Reliable & Trusted Banking Partner
Leader in Retail and Transaction Banking
Leader in Citizenship, Sustainability & Innovation
1
2
3
9
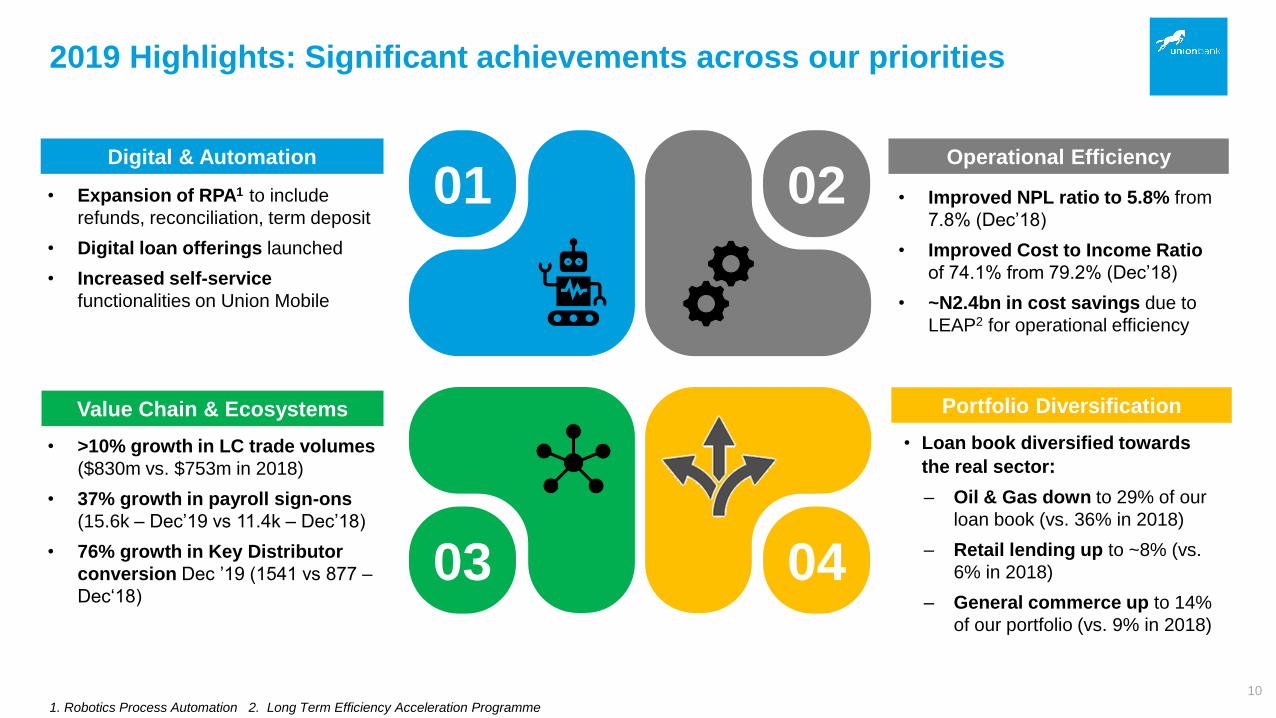
2019 Highlights: Significant achievements across our priorities
0403
01 02• Expansion of RPA1 to include
refunds, reconciliation, term deposit
• Digital loan offerings launched
• Increased self-service
functionalities on Union Mobile
Digital & Automation Operational Efficiency
1. Robotics Process Automation 2. Long Term Efficiency Acceleration Programme
Value Chain & Ecosystems
• Improved NPL ratio to 5.8% from
7.8% (Dec’18)
• Improved Cost to Income Ratio
of 74.1% from 79.2% (Dec’18)
• ~N2.4bn in cost savings due to
LEAP2 for operational efficiency
• >10% growth in LC trade volumes
($830m vs. $753m in 2018)
• 37% growth in payroll sign-ons
(15.6k – Dec’19 vs 11.4k – Dec’18)
• 76% growth in Key Distributor
conversion Dec ’19 (1541 vs 877 –
Dec‘18)
Portfolio Diversification
• Loan book diversified towards
the real sector:
‒ Oil & Gas down to 29% of our
loan book (vs. 36% in 2018)
‒ Retail lending up to ~8% (vs.
6% in 2018)
‒ General commerce up to 14%
of our portfolio (vs. 9% in 2018)
10
Capture your audience’s
attention. Download this
awesome diagram. Bring
your presentation to life.
All images are 100%
editable in PowerPoint.
Capture your audience’s
attention. Download this
awesome diagram. Bring
your presentation to life.
All images are 100%
editable in PowerPoint.
Capture your audience’s
attention. Download this
awesome diagram. Bring
your presentation to life.
All images are 100%
editable in PowerPoint.
Capture your audience’s
attention. Download this
awesome diagram. Bring
your presentation to life.
All images are 100%
editable in PowerPoint.
Capture your audience’s
attention. Download this
awesome diagram. Bring
your presentation to life.
All images are 100%
editable in PowerPoint.
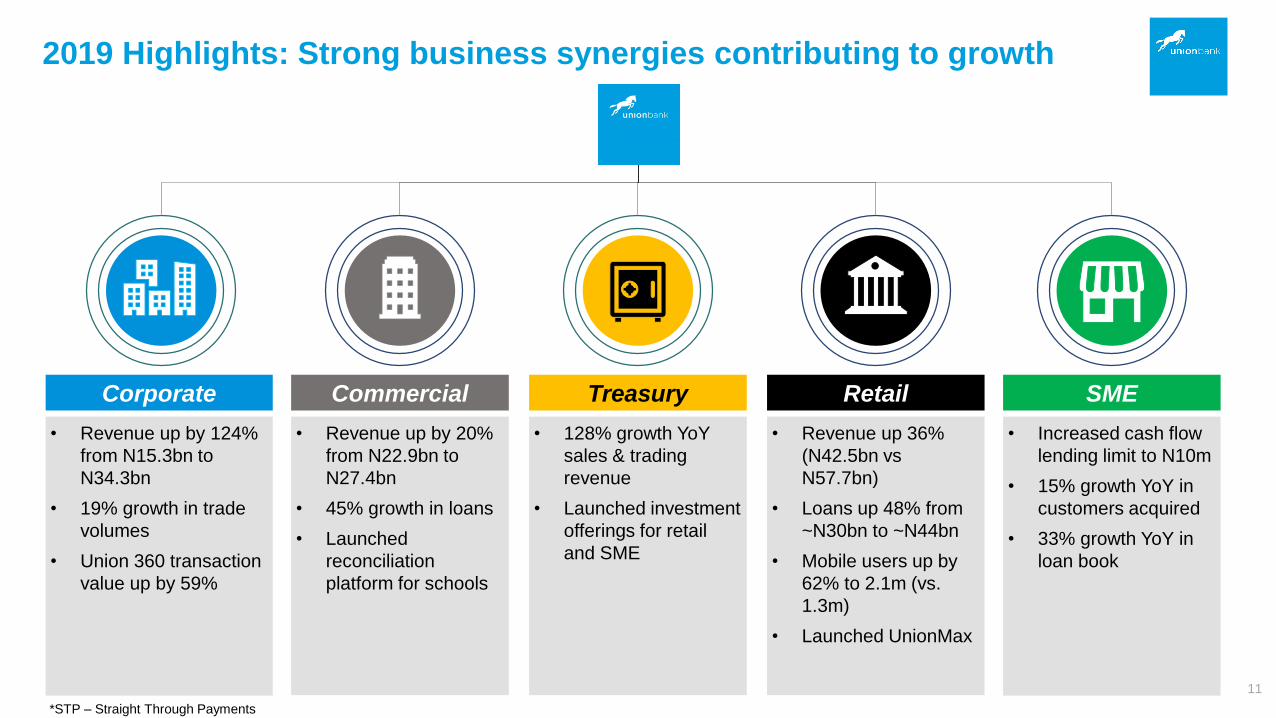
Corporate
• Revenue up by 124%
from N15.3bn to
N34.3bn
• 19% growth in trade
volumes
• Union 360 transaction
value up by 59%
Commercial
• Revenue up by 20%
from N22.9bn to
N27.4bn
• 45% growth in loans
• Launched
reconciliation
platform for schools
Treasury
• 128% growth YoY
sales & trading
revenue
• Launched investment
offerings for retail
and SME
Retail
• Revenue up 36%
(N42.5bn vs
N57.7bn)
• Loans up 48% from
~N30bn to ~N44bn
• Mobile users up by
62% to 2.1m (vs.
1.3m)
• Launched UnionMax
SME
• Increased cash flow
lending limit to N10m
• 15% growth YoY in
customers acquired
• 33% growth YoY in
loan book
2019 Highlights: Strong business synergies contributing to growth
11
*STP – Straight Through Payments
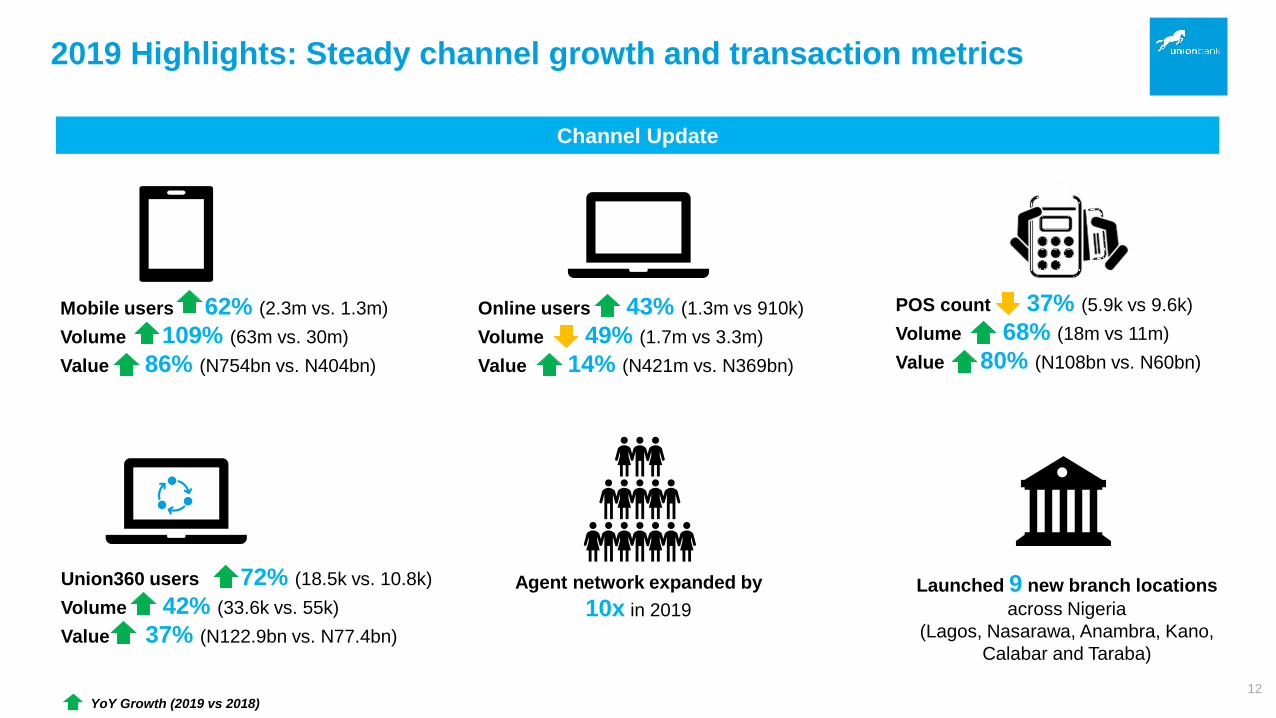
2019 Highlights: Steady channel growth and transaction metrics
YoY Growth (2019 vs 2018)
Channel Update
12
Mobile users 62% (2.3m vs. 1.3m)
Volume 109% (63m vs. 30m)
Value 86% (N754bn vs. N404bn)
Agent network expanded by
10x in 2019
Launched 9 new branch locations
across Nigeria
(Lagos, Nasarawa, Anambra, Kano,
Calabar and Taraba)
Online users 43% (1.3m vs 910k)
Volume 49% (1.7m vs 3.3m)
Value 14% (N421m vs. N369bn)
POS count 37% (5.9k vs 9.6k)
Volume 68% (18m vs 11m)
Value 80% (N108bn vs. N60bn)
Union360 users 72% (18.5k vs. 10.8k)
Volume 42% (33.6k vs. 55k)
Value 37% (N122.9bn vs. N77.4bn)
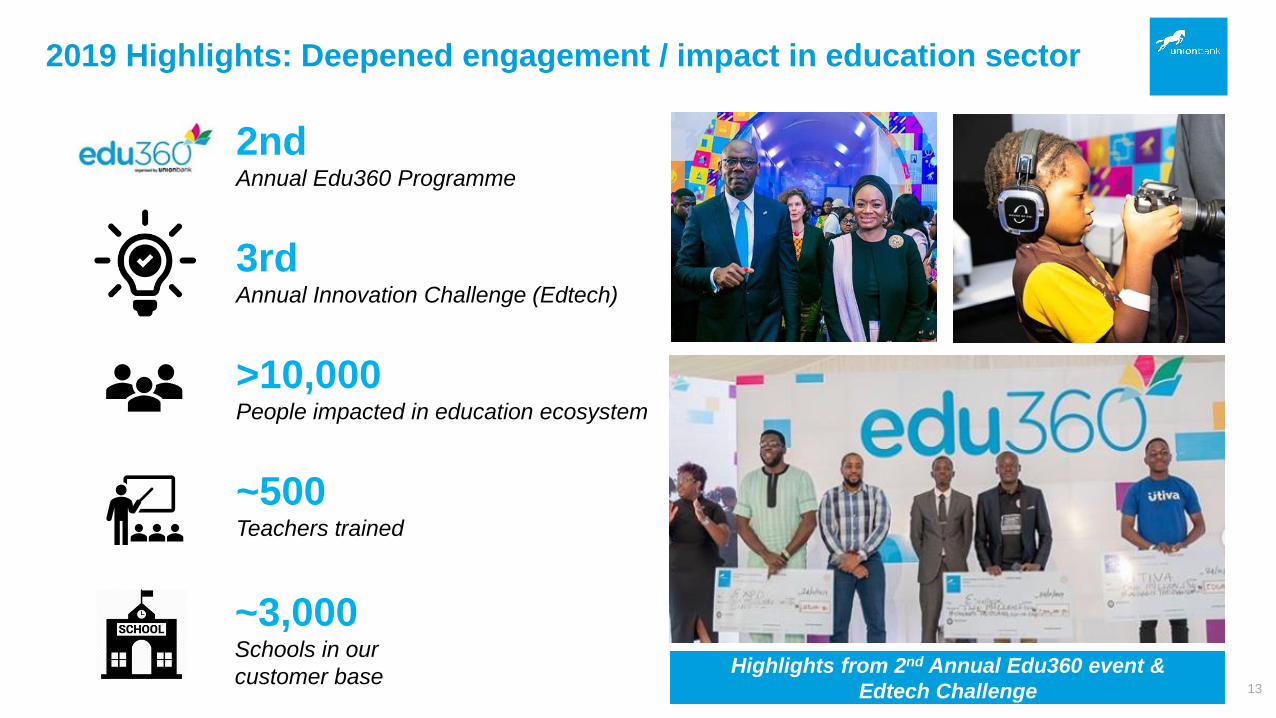
Highlights from 2nd Annual Edu360 event &
Edtech Challenge
2019 Highlights: Deepened engagement / impact in education sector
13
>10,000 People impacted in education ecosystem
~500 Teachers trained
2ndAnnual Edu360 Programme
3rdAnnual Innovation Challenge (Edtech)
~3,000 Schools in our
customer base
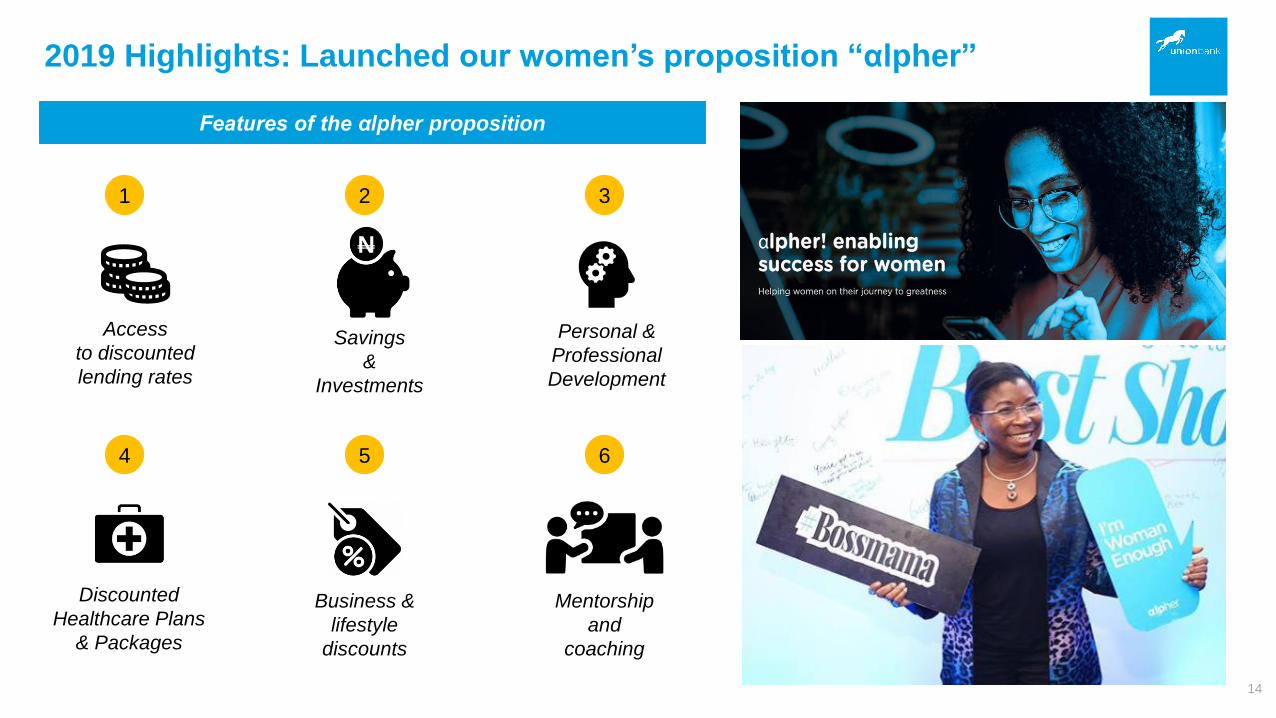
2019 Highlights: Launched our women’s proposition “αlpher”
Features of the αlpher proposition
14
1
Personal &
Professional
Development
2
Access
to discounted
lending rates
3
Savings
&
Investments
Business &
lifestyle
discounts
5
Mentorship
and
coaching
6
4N
4
Discounted
Healthcare Plans
& Packages

• Best Branch Digitization Initiative in Africa
Asian Banker West Africa Awards (Joint award
with Newgen Software)
• Best Company in Environmental Excellence
2019 Sustainability, Enterprise and Responsibility
Awards (SERAs)
• Excellence in Internet Banking
2019 Finnovex Awards (West Africa)
• 2019 Advertiser of the Year
Pitcher Awards Creativity Week
2019 Highlights: Received awards & recognitions in line with our focus
15
Mark
et
Su
sta
ina
bil
ity
& B
ran
d
• FMDQ Member Compliance Award winner 2019
Dig
ital
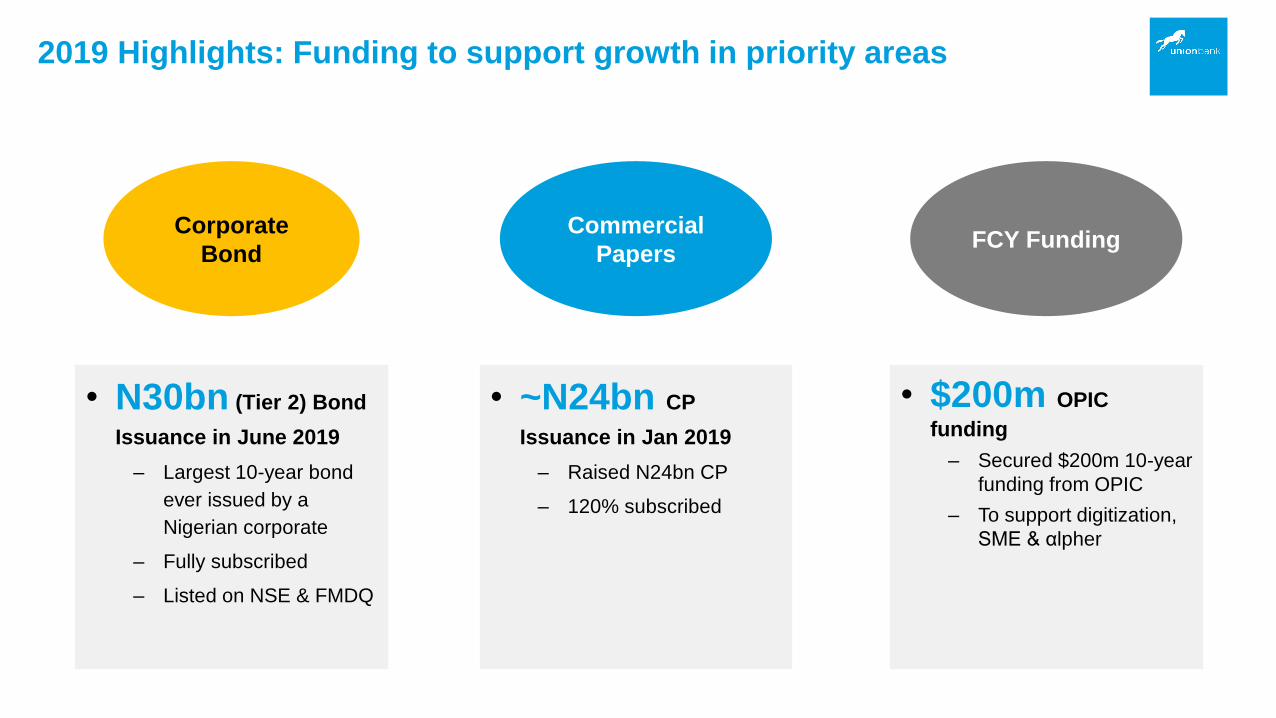
2019 Highlights: Funding to support growth in priority areas
Corporate
Bond
Commercial
PapersFCY Funding
• $200m OPIC
funding
‒ Secured $200m 10-year
funding from OPIC
‒ To support digitization,
SME & αlpher
• ~N24bn CP
Issuance in Jan 2019
‒ Raised N24bn CP
‒ 120% subscribed
• N30bn (Tier 2) Bond
Issuance in June 2019
‒ Largest 10-year bond
ever issued by a
Nigerian corporate
‒ Fully subscribed
‒ Listed on NSE & FMDQ
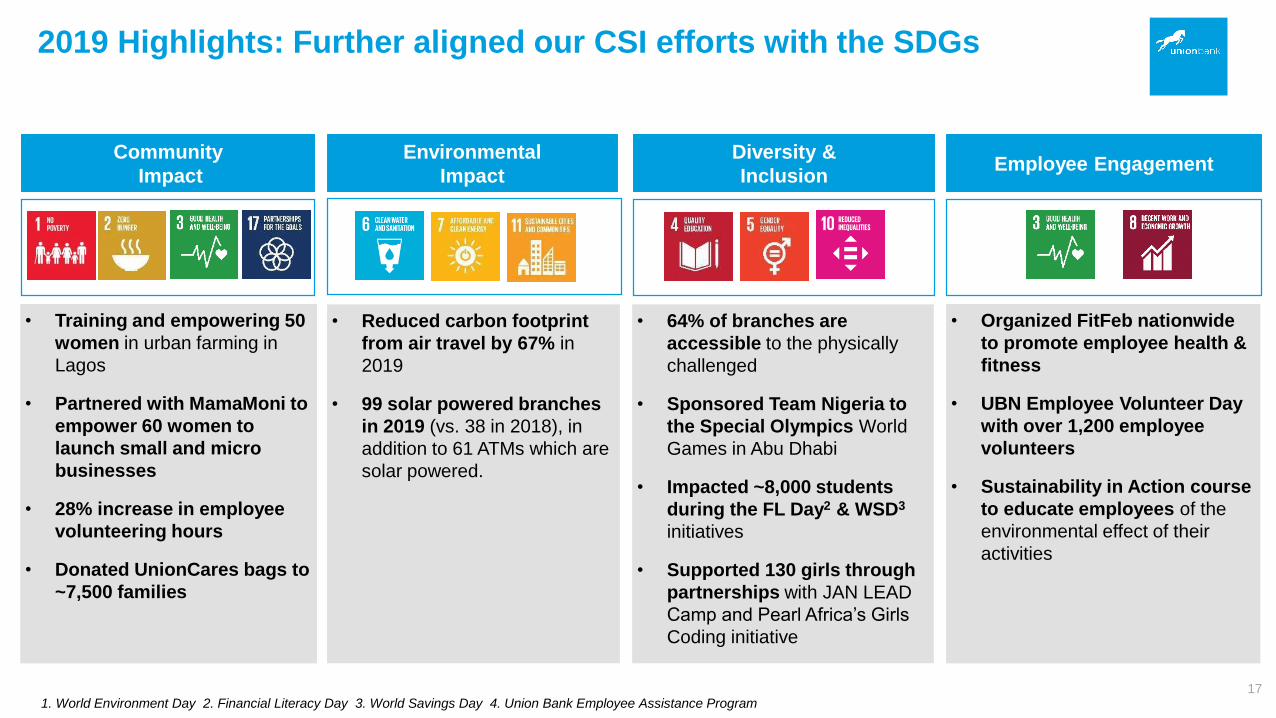
• Training and empowering 50
women in urban farming in
Lagos
• Partnered with MamaMoni to
empower 60 women to
launch small and micro
businesses
• 28% increase in employee
volunteering hours
• Donated UnionCares bags to
~7,500 families
• Reduced carbon footprint
from air travel by 67% in
2019
• 99 solar powered branches
in 2019 (vs. 38 in 2018), in
addition to 61 ATMs which are
solar powered.
• 64% of branches are
accessible to the physically
challenged
• Sponsored Team Nigeria to
the Special Olympics World
Games in Abu Dhabi
• Impacted ~8,000 students
during the FL Day2 & WSD3
initiatives
• Supported 130 girls through
partnerships with JAN LEAD
Camp and Pearl Africa’s Girls
Coding initiative
• Organized FitFeb nationwide
to promote employee health &
fitness
• UBN Employee Volunteer Day
with over 1,200 employee
volunteers
• Sustainability in Action course
to educate employees of the
environmental effect of their
activities
1. World Environment Day 2. Financial Literacy Day 3. World Savings Day 4. Union Bank Employee Assistance Program
Diversity &
InclusionEmployee Engagement
Community
Impact
Environmental
Impact
2019 Highlights: Further aligned our CSI efforts with the SDGs
17
Gross Earnings (₦’bn)
Net Revenue after Impairments (₦’bn)
Profit Before Tax (PBT) (₦’bn)
FY ‘19 FY ‘18 % Change
159.9 140.1 14%
95.5 89.7 6%
24.7 18.7 33%
Return on Average Equity (RoAE)
Return on Assets (ROA)
Capital Adequacy Ratio (CAR)
Cost to Income Ratio (CIR)
Non Performing Loans (NPL)
Customer Deposits (₦’bn)
Gross Loans (₦’bn)
FY ‘19 FY ‘18 % Change
886.3 844.4 5%
595.3 496.8 20%
FY ‘19 FY ‘18 % Change
11.3% 7.1% 4.2%
1.6% 1.4% 0.2%
19.7% 16.4% 3.3%
74.1% 79.2% 5.1%
5.8% 7.8% 2%
2019 Highlights: Execution of strategy translated to strong performance
18
Income Statement
Balance Sheet
Key Ratios
The Operating Environment
Union Bank Update
FY 2019 Financial Performance
Looking Ahead
1
2
4
3
Joe MbuluChief Financial Officer
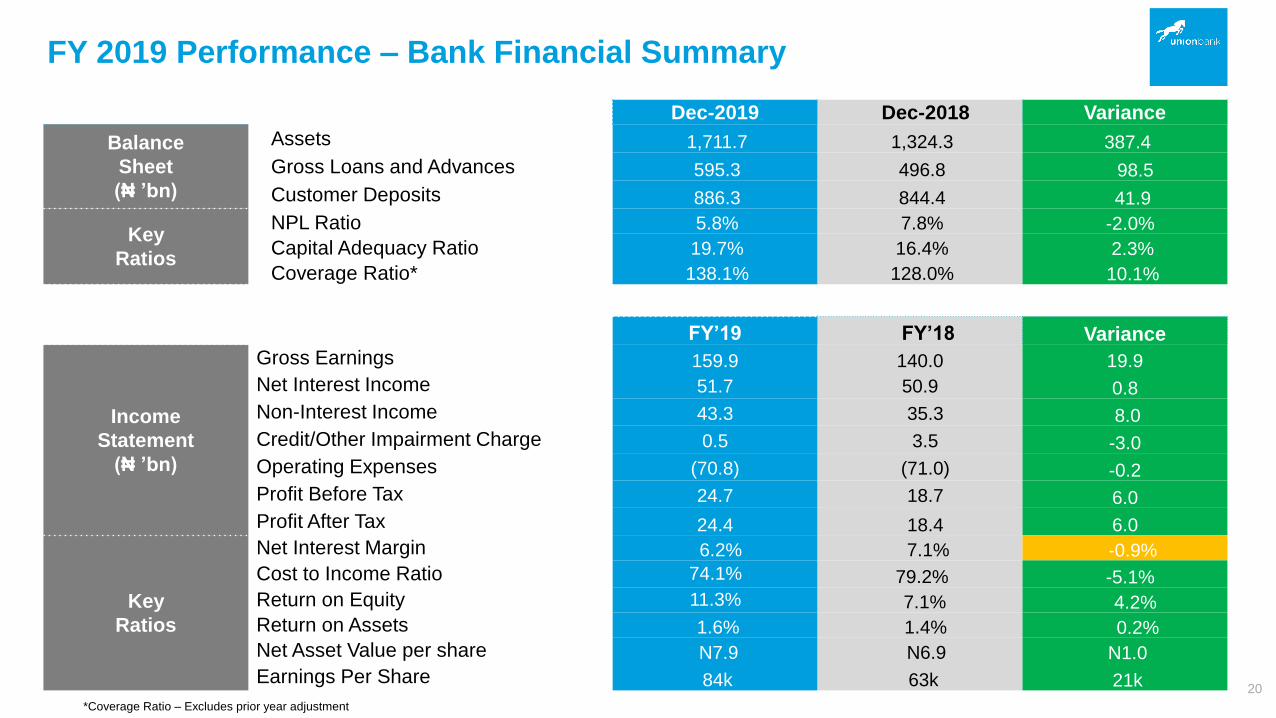
FY 2019 Performance – Bank Financial Summary
Dec-2019 Dec-2018 Variance
Balance
Sheet
(₦ ’bn)
Assets 1,711.7 1,324.3 387.4
Gross Loans and Advances 595.3 496.8 98.5
Customer Deposits 886.3 844.4 41.9
Key
Ratios
NPL Ratio 5.8% 7.8% -2.0%
Capital Adequacy Ratio 19.7% 16.4% 2.3%
Coverage Ratio* 138.1% 128.0% 10.1%
FY’19 FY’18 Variance
Income
Statement
(₦ ’bn)
Gross Earnings 159.9 140.0 19.9
Net Interest Income 51.7 50.9 0.8
Non-Interest Income 43.3 35.3 8.0
Credit/Other Impairment Charge 0.5 3.5 -3.0
Operating Expenses (70.8) (71.0) -0.2
Profit Before Tax 24.7 18.7 6.0
Profit After Tax 24.4 18.4 6.0
Key
Ratios
Net Interest Margin 6.2% 7.1% -0.9%
Cost to Income Ratio 74.1% 79.2% -5.1%
Return on Equity 11.3% 7.1% 4.2%
Return on Assets 1.6% 1.4% 0.2%
Net Asset Value per share N7.9 N6.9 N1.0
Earnings Per Share 84k 63k 21k20
*Coverage Ratio – Excludes prior year adjustment

FY 2019 Performance – Group Financial Summary
Dec-2019 Dec-2018 Variance
Balance
Sheet
(₦ ’bn)
Assets 1,872.2 1,463.9 408.3
Gross Loans and Advances 595.3 543.1 52.2
Customer Deposits 886.3 857.6 28.7
Key
Ratios
NPL Ratio 5.8% 8.4% -2.6%
Capital Adequacy Ratio 19.7% 16.4% 3.3%
Coverage Ratio* 138.1% 110.5% 27.6%
FY’19 FY’18 Variance
Income
Statement
(₦ ’bn)
Gross Earnings 166.6 145.5 21.1
Net Interest Income 52.3 51.6 0.7
Non-Interest Income 42.9 34.3 8.6
Credit/Other Impairment Charge 0.5 3.5 -3.0
Operating Expenses (71) (71.4) -0.4
Profit Before Tax 20.4 18.5 1.9
Profit After Tax 19.9 18.1 1.8
Key
Ratios
Net Interest Margin 5.8% 6.1% -0.3%
Cost to Income Ratio 74.1% 79.8% -5.7%
Return on Equity 10.2% 6.2% 4.0%
Return on Assets 1.6% 1.2% 0.4%
Net Asset Value per share N8.7 N7.7 N1.0
Earnings Per Share 67k 61k 6k21
*Coverage Ratio – Excludes prior year adjustment
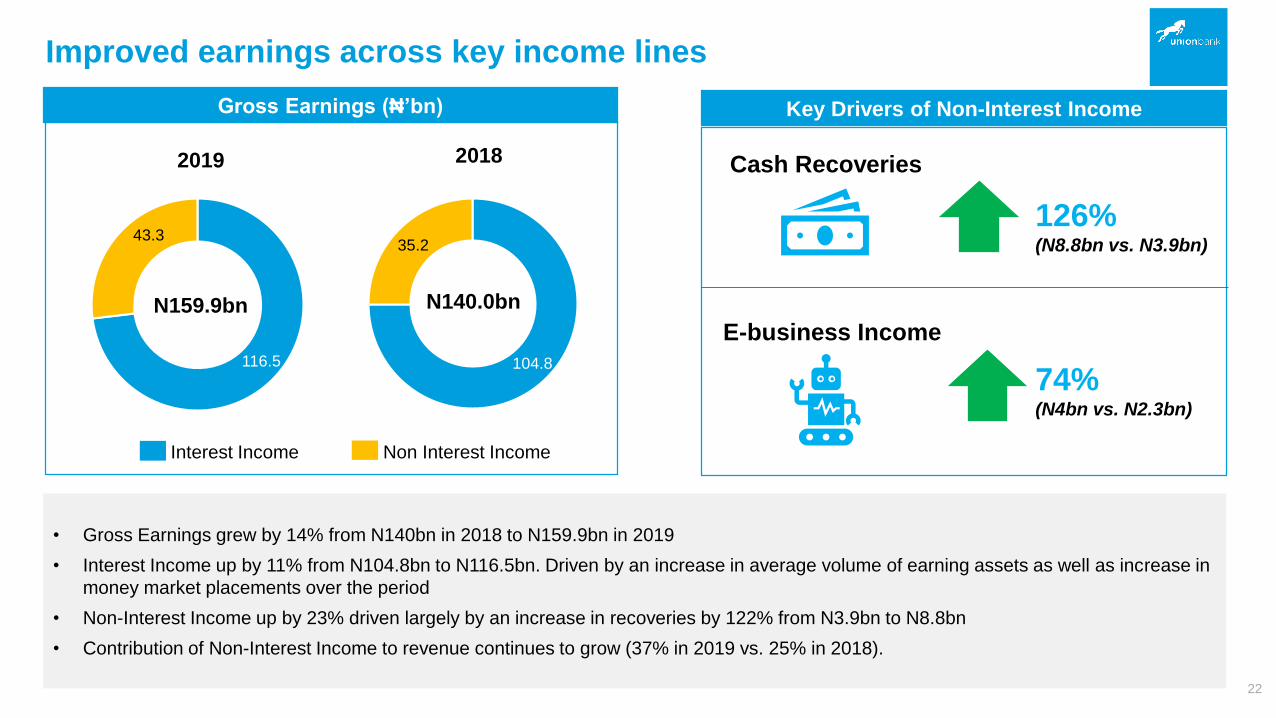
Improved earnings across key income lines
• Gross Earnings grew by 14% from N140bn in 2018 to N159.9bn in 2019
• Interest Income up by 11% from N104.8bn to N116.5bn. Driven by an increase in average volume of earning assets as well as increase in
money market placements over the period
• Non-Interest Income up by 23% driven largely by an increase in recoveries by 122% from N3.9bn to N8.8bn
• Contribution of Non-Interest Income to revenue continues to grow (37% in 2019 vs. 25% in 2018).
Gross Earnings (₦’bn)
2019
116.5
43.3
104.8
35.2
2018
Interest Income Non Interest Income
Key Drivers of Non-Interest Income
N159.9bn N140.0bn
22
Cash Recoveries
E-business Income
126%(N8.8bn vs. N3.9bn)
74%(N4bn vs. N2.3bn)
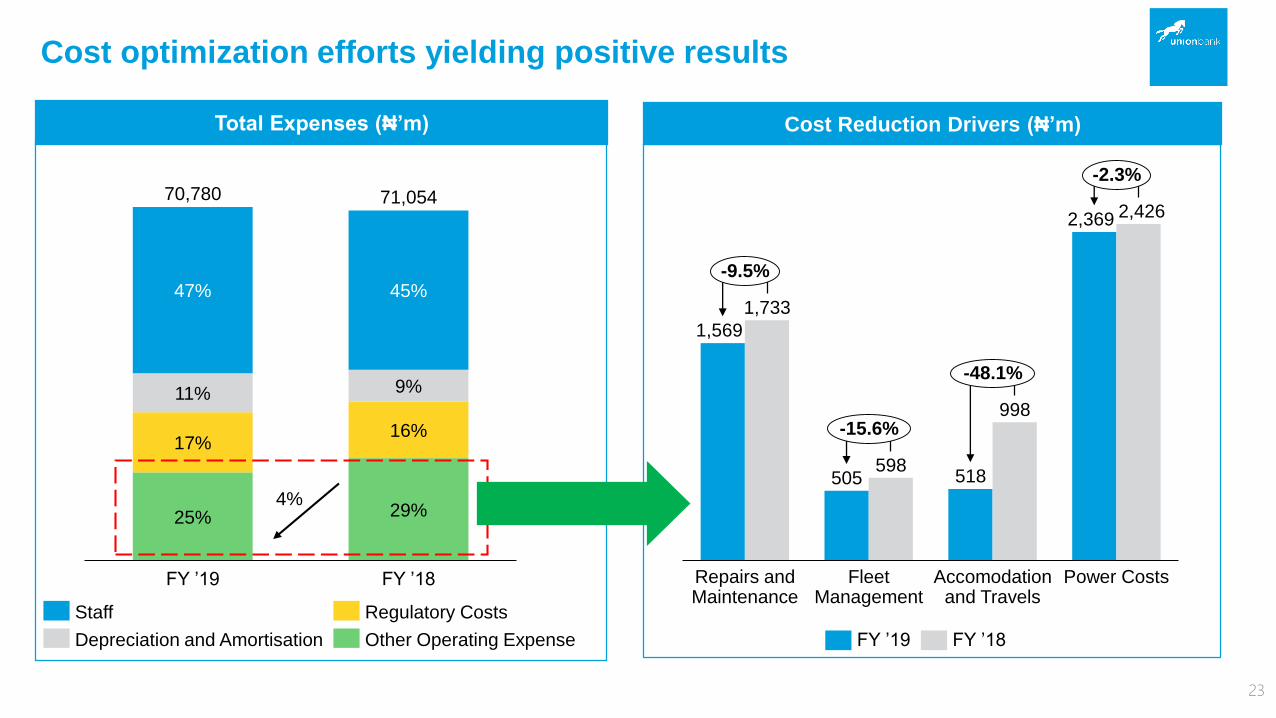
Cost optimization efforts yielding positive results
Total Expenses (₦’m) Cost Reduction Drivers (₦’m)
23
47%
25%
11%
FY ’19
17%16%
45%
9%
29%
FY ’18
71,05470,780
Staff Regulatory Costs
Depreciation and Amortisation Other Operating Expense
1,569
505 518
2,369
1,733
598
998
2,426
Power CostsRepairs and Maintenance
Fleet Management
Accomodation and Travels
-9.5%
-15.6%
-48.1%
-2.3%
FY ’19 FY ’18
4%
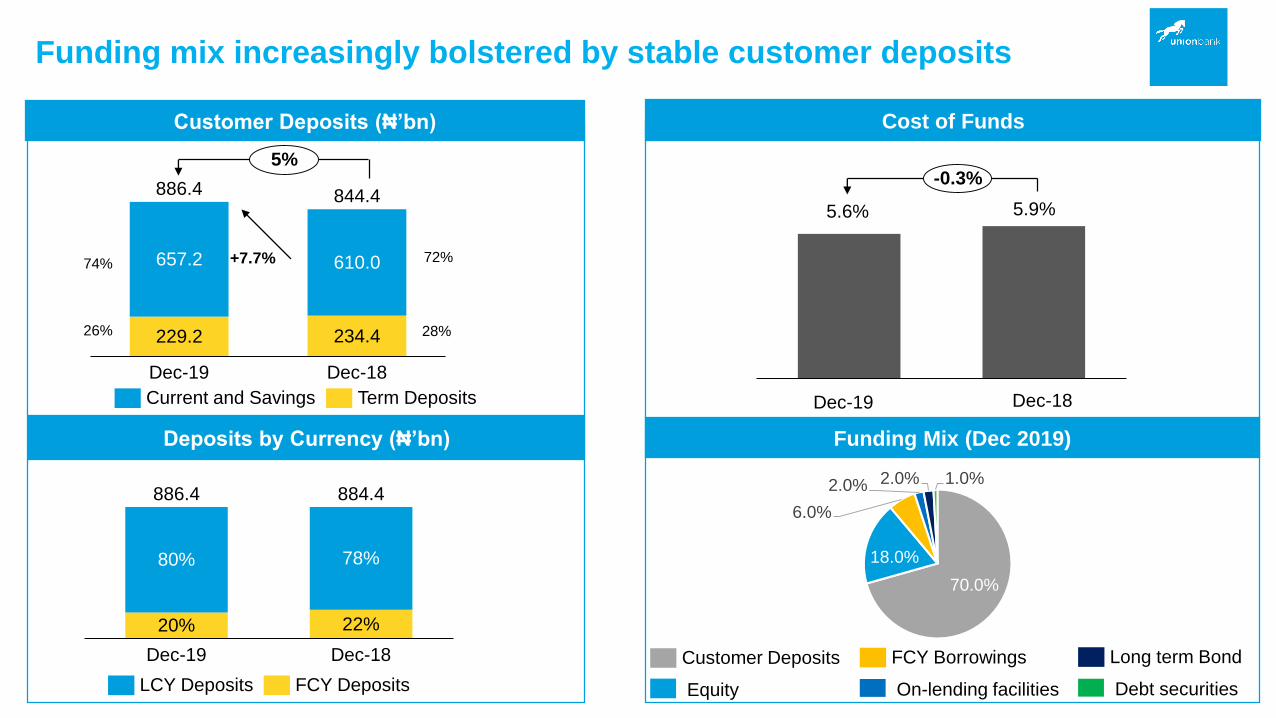
Funding mix increasingly bolstered by stable customer deposits
229.2 234.4
657.2 610.0
886.4 844.4
Dec-19 Dec-18
Current and Savings Term Deposits
Cost of FundsCustomer Deposits (₦’bn)
+7.7% 72%
28%
74%
26%
Dec-19 Dec-18
5.9%5.6%
-0.3%
Funding Mix (Dec 2019)Deposits by Currency (₦’bn)
884.4
Dec-19
80%
22%20%
78%
Dec-18
886.4
LCY Deposits FCY Deposits
70.0%
18.0%
6.0%
2.0% 2.0% 1.0%
Customer Deposits
Equity
FCY Borrowings
On-lending facilities
Long term Bond
Debt securities
5%
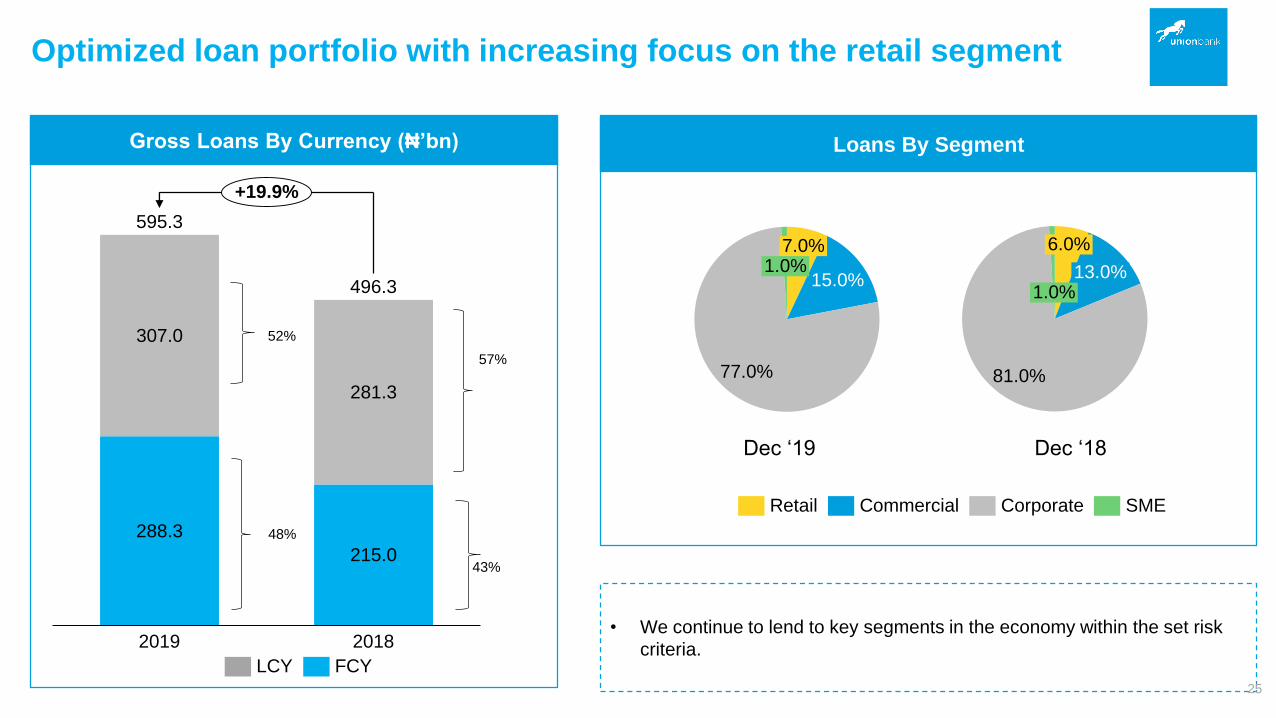
Optimized loan portfolio with increasing focus on the retail segment
288.3
215.0
307.0
281.3
2019 2018
595.3
496.3
+19.9%
LCY FCY
15.0%
77.0%
7.0%1.0%
Retail SMECommercial Corporate
Loans by Segment
• We continue to lend to key segments in the economy within the set risk
criteria.
Dec ‘19
Gross Loans By Currency (₦’bn) Loans By Segment
43%
57%
52%
48%
81.0%
1.0%
6.0%
13.0%
Dec ‘18
25
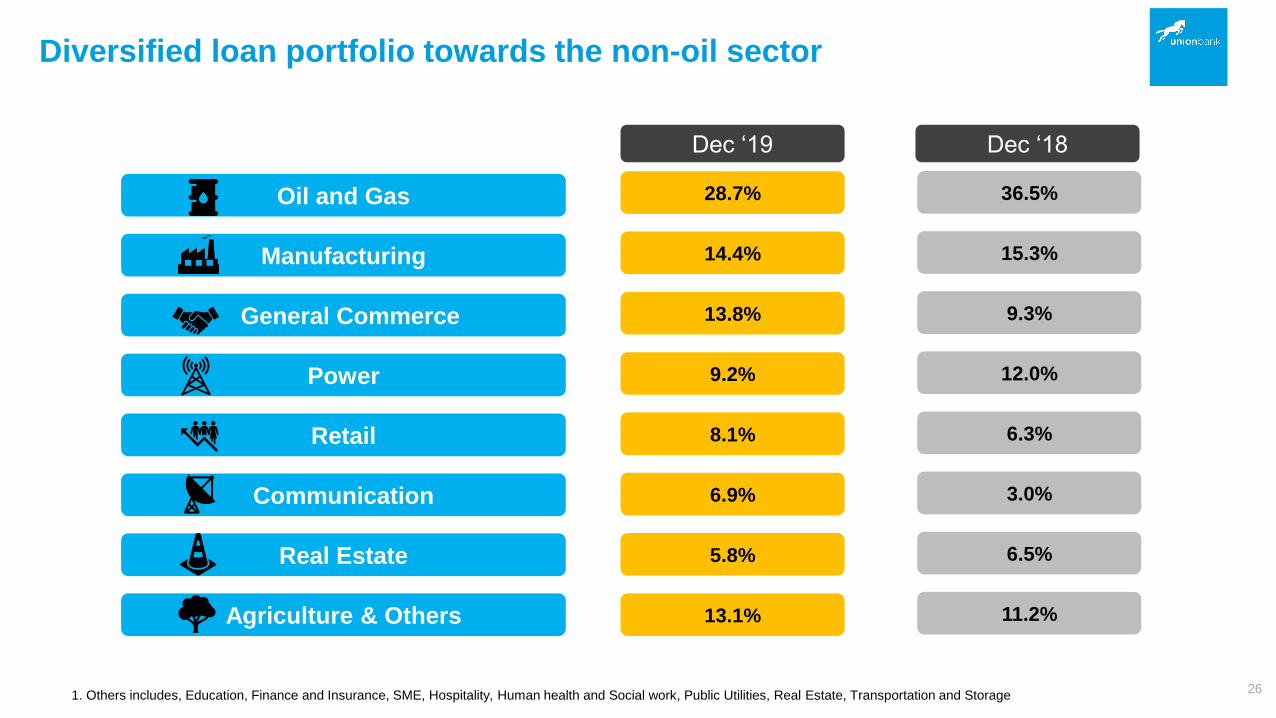
Diversified loan portfolio towards the non-oil sector
1. Others includes, Education, Finance and Insurance, SME, Hospitality, Human health and Social work, Public Utilities, Real Estate, Transportation and Storage
Oil and Gas
Manufacturing
General Commerce
Power
Retail
Communication
Real Estate
Agriculture & Others
Dec ‘19 Dec ‘18
28.7% 36.5%
14.4% 15.3%
13.8% 9.3%
9.2% 12.0%
8.1% 6.3%
6.9% 3.0%
5.8% 6.5%
13.1% 11.2%
26
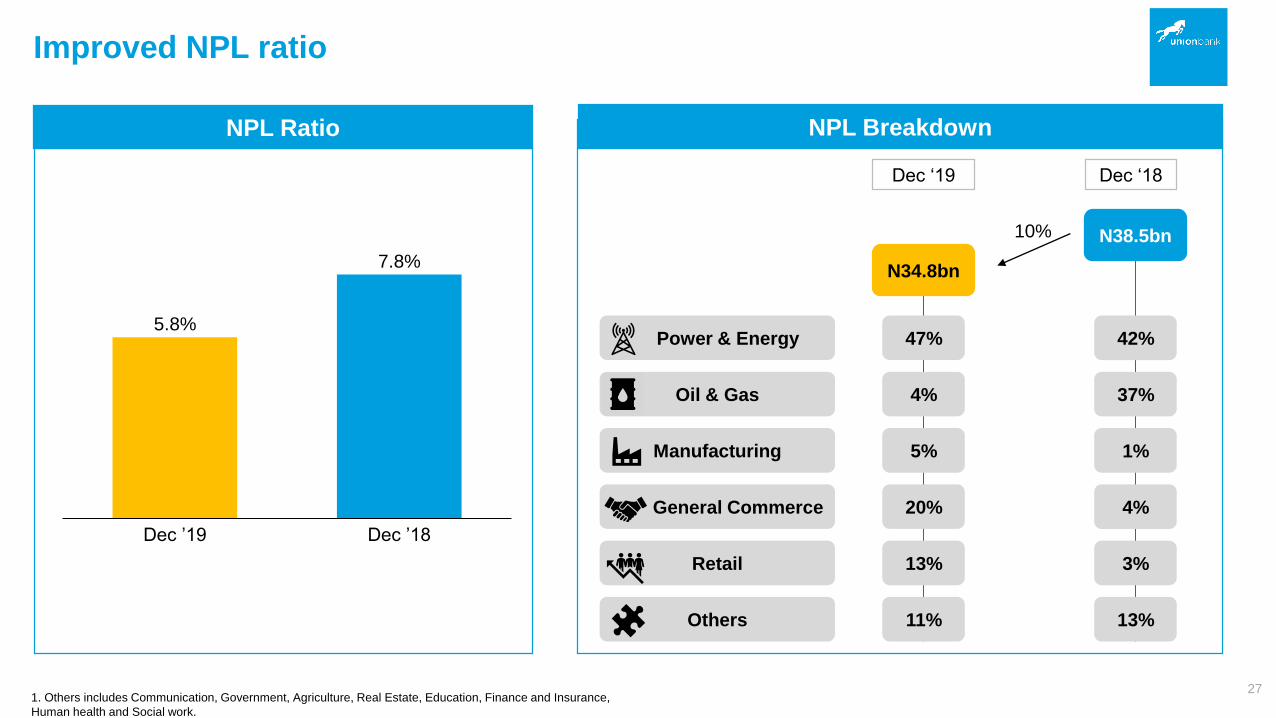
Improved NPL ratio
Dec ’19
5.8%
Dec ’18
7.8%
1. Others includes Communication, Government, Agriculture, Real Estate, Education, Finance and Insurance,
Human health and Social work.
NPL Ratio
27
NPL Breakdown
N34.8bn
N38.5bn
Dec ‘19 Dec ‘18
Power & Energy
Oil & Gas
Manufacturing
General Commerce
Retail
Others
47%
4%
5%
20%
13%
11%
42%
37%
1%
4%
3%
13%
10%
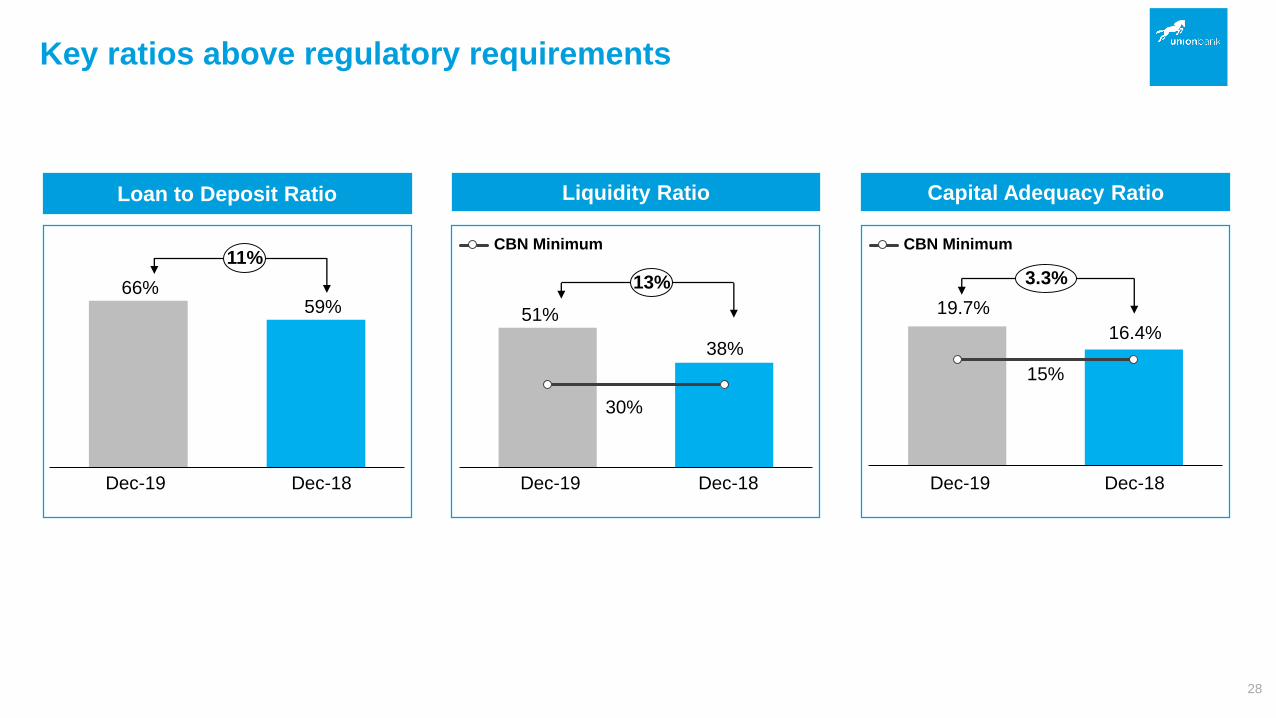
Liquidity RatioLoan to Deposit Ratio
38%
51%
30%
Dec-18Dec-19
CBN Minimum
66%
Dec-19 Dec-18
59%
11%
Key ratios above regulatory requirements
28
Capital Adequacy Ratio
16.4%
19.7%
15%
Dec-18Dec-19
CBN Minimum
13% 3.3%
The Operating Environment
Union Bank Update
FY 2019 Financial Performance
Looking Ahead
1
2
3
4
Emeka EmuwaChief Executive Officer
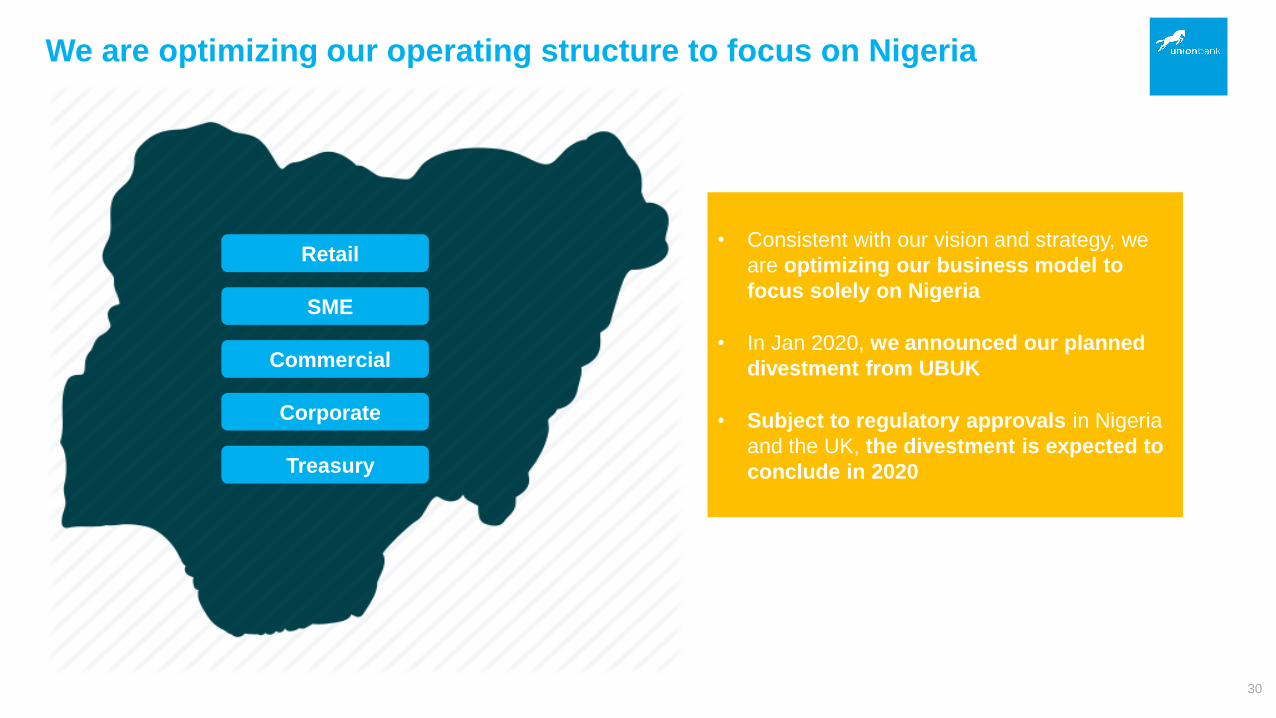
We are optimizing our operating structure to focus on Nigeria
• Consistent with our vision and strategy, we
are optimizing our business model to
focus solely on Nigeria
• In Jan 2020, we announced our planned
divestment from UBUK
• Subject to regulatory approvals in Nigeria
and the UK, the divestment is expected to
conclude in 2020
30
Retail
Commercial
Corporate
SME
Treasury
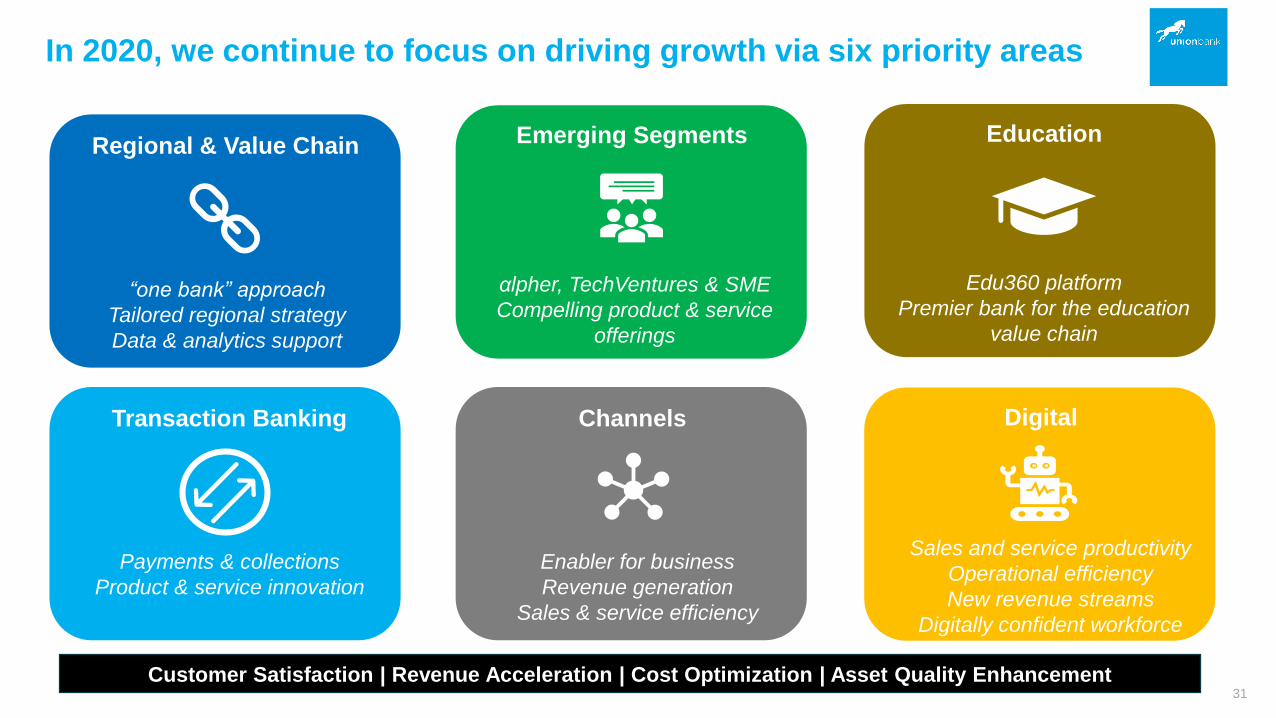
31
Regional & Value Chain
Transaction Banking
Education
Digital
“one bank” approach
Tailored regional strategy
Data & analytics support
Payments & collections
Product & service innovation
Edu360 platform
Premier bank for the education
value chain
Sales and service productivity
Operational efficiency
New revenue streams
Digitally confident workforce
Customer Satisfaction | Revenue Acceleration | Cost Optimization | Asset Quality Enhancement31
In 2020, we continue to focus on driving growth via six priority areas
Emerging Segments
αlpher, TechVentures & SME
Compelling product & service
offerings
Channels
Enabler for business
Revenue generation
Sales & service efficiency
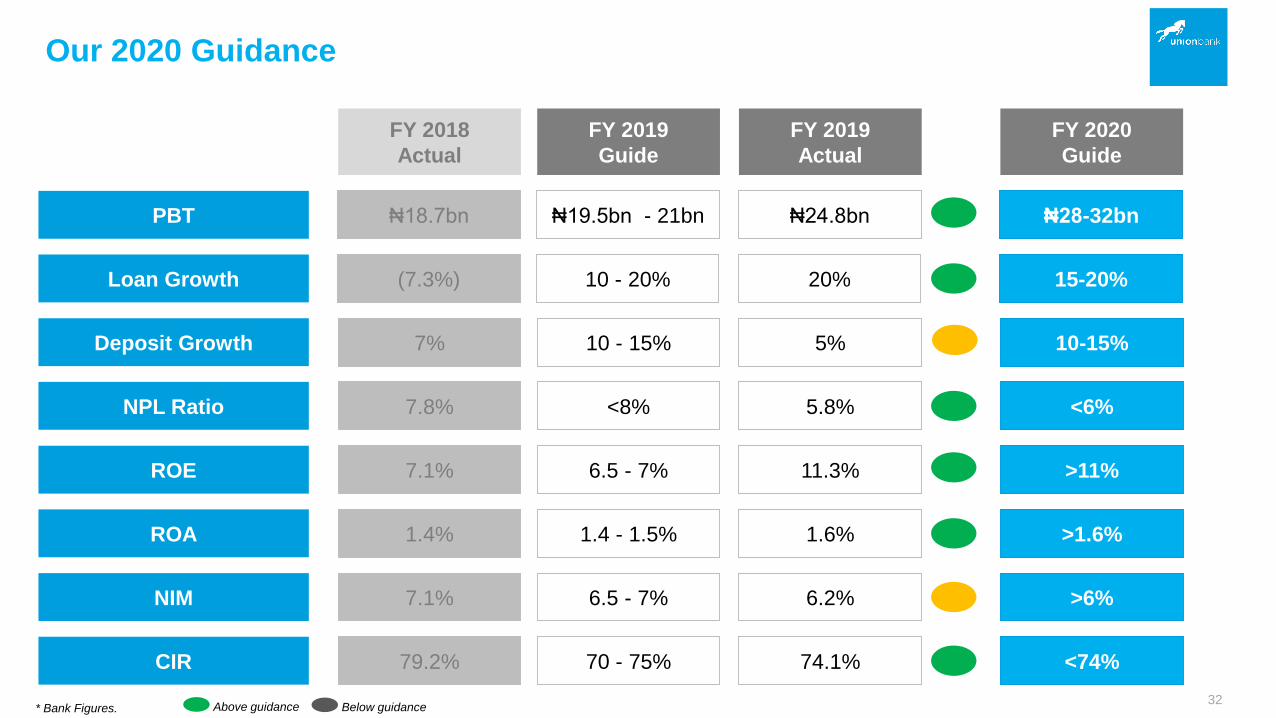
Our 2020 Guidance
PBT
Loan Growth
Deposit Growth
NPL Ratio
ROE
ROA
NIM
CIR
* Bank Figures.
₦28-32bn
FY 2020
Guide
15-20%
10-15%
<6%
>11%
>1.6%
>6%
<74%
₦24.8bn
FY 2019
Actual
20%
5%
5.8%
11.3%
1.6%
6.2%
74.1%
₦18.7bn
FY 2018
Actual
(7.3%)
7%
7.8%
7.1%
1.4%
7.1%
79.2%
32
₦19.5bn - 21bn
FY 2019
Guide
10 - 20%
10 - 15%
<8%
6.5 - 7%
1.4 - 1.5%
6.5 - 7%
70 - 75%
Above guidance Below guidance

33
Questions?

Appendix
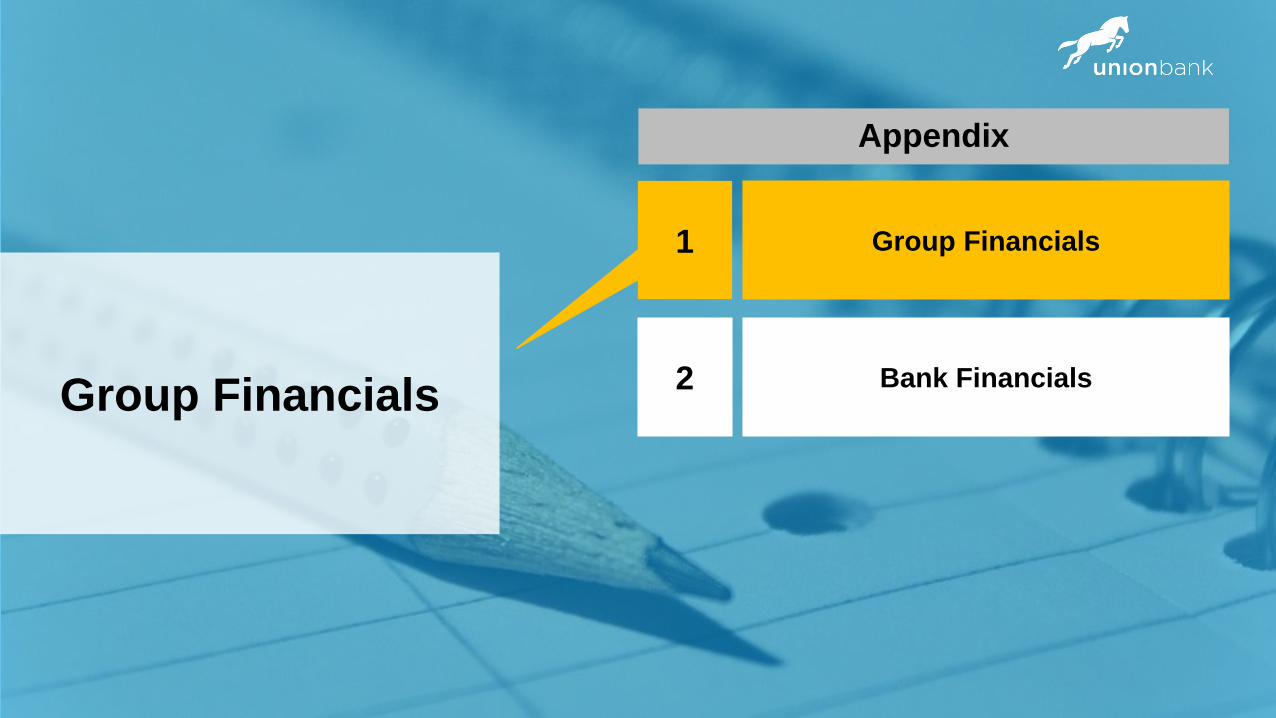
Group Financials
Bank Financials
Appendix
2
1
Group Financials

FY 2019 Performance – Group Financial Summary
Dec-2019 Dec-2018 Variance
Balance
Sheet
(₦ ’bn)
Assets 1,872.2 1,463.9 408.3
Gross Loans and Advances 595.3 543.1 52.2
Customer Deposits 886.3 857.6 28.7
Key
Ratios
NPL Ratio 5.8% 8.4% -2.6%
Capital Adequacy Ratio 19.7% 16.4% 3.3%
Coverage Ratio* 138.1% 110.5% 27.6%
FY’19 FY’18 Variance
Income
Statement
(₦ ’bn)
Gross Earnings 166.6 145.5 21.1
Net Interest Income 52.3 51.6 0.7
Non-Interest Income 42.9 34.3 8.6
Credit/Other Impairment Charge 0.5 3.5 -3.0
Operating Expenses (71) (71.4) -0.4
Profit Before Tax 20.4 18.5 1.9
Profit After Tax 19.9 18.1 1.8
Key
Ratios
Net Interest Margin 5.8% 6.1% -0.3%
Cost to Income Ratio 74.1% 79.8% -5.7%
Return on Equity 10.2% 6.2% 4.0%
Return on Assets 1.6% 1.2% 0.4%
Net Asset Value per share N8.7 N7.7 N1.0
Earnings Per Share 67k 61k 6k36
*Coverage Ratio – Excludes prior year adjustment
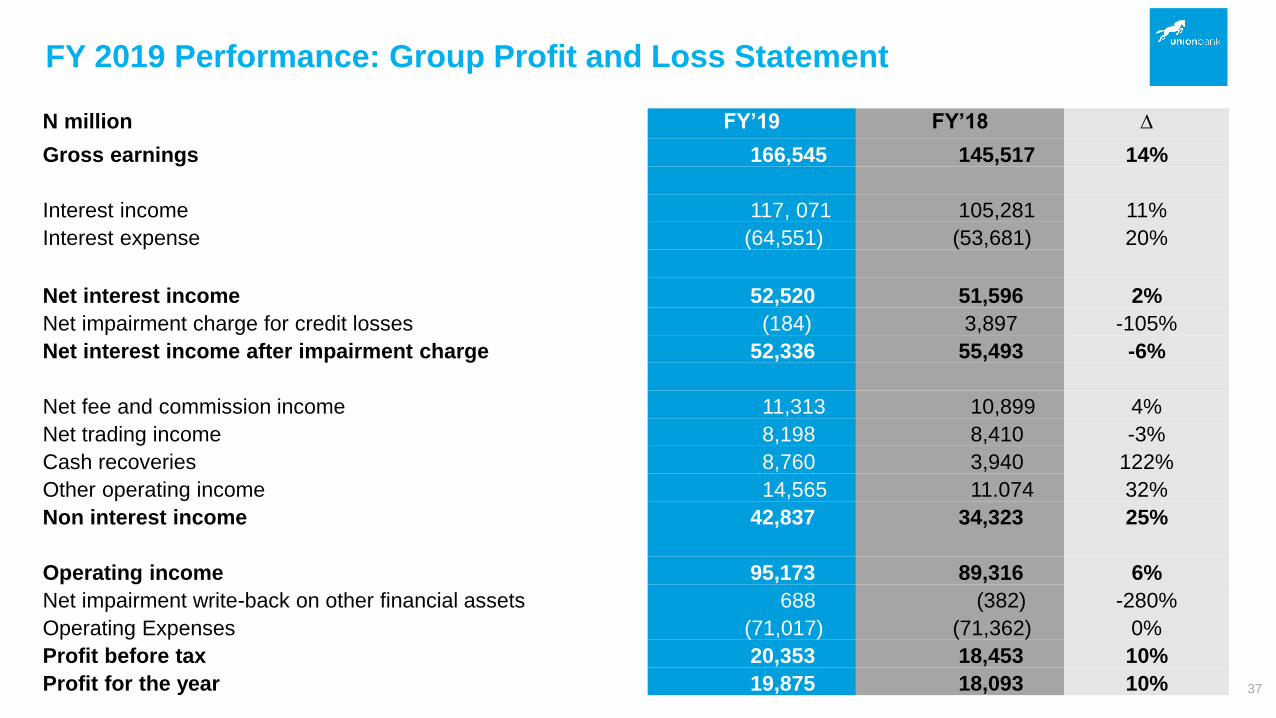
N million FY’19 FY’18 ∆
Gross earnings 166,545 145,517 14%
Interest income 117, 071 105,281 11%
Interest expense (64,551) (53,681) 20%
Net interest income 52,520 51,596 2%
Net impairment charge for credit losses (184) 3,897 -105%
Net interest income after impairment charge 52,336 55,493 -6%
Net fee and commission income 11,313 10,899 4%
Net trading income 8,198 8,410 -3%
Cash recoveries 8,760 3,940 122%
Other operating income 14,565 11.074 32%
Non interest income 42,837 34,323 25%
Operating income 95,173 89,316 6%
Net impairment write-back on other financial assets 688 (382) -280%
Operating Expenses (71,017) (71,362) 0%
Profit before tax 20,353 18,453 10%
Profit for the year 19,875 18,093 10%
FY 2019 Performance: Group Profit and Loss Statement
37
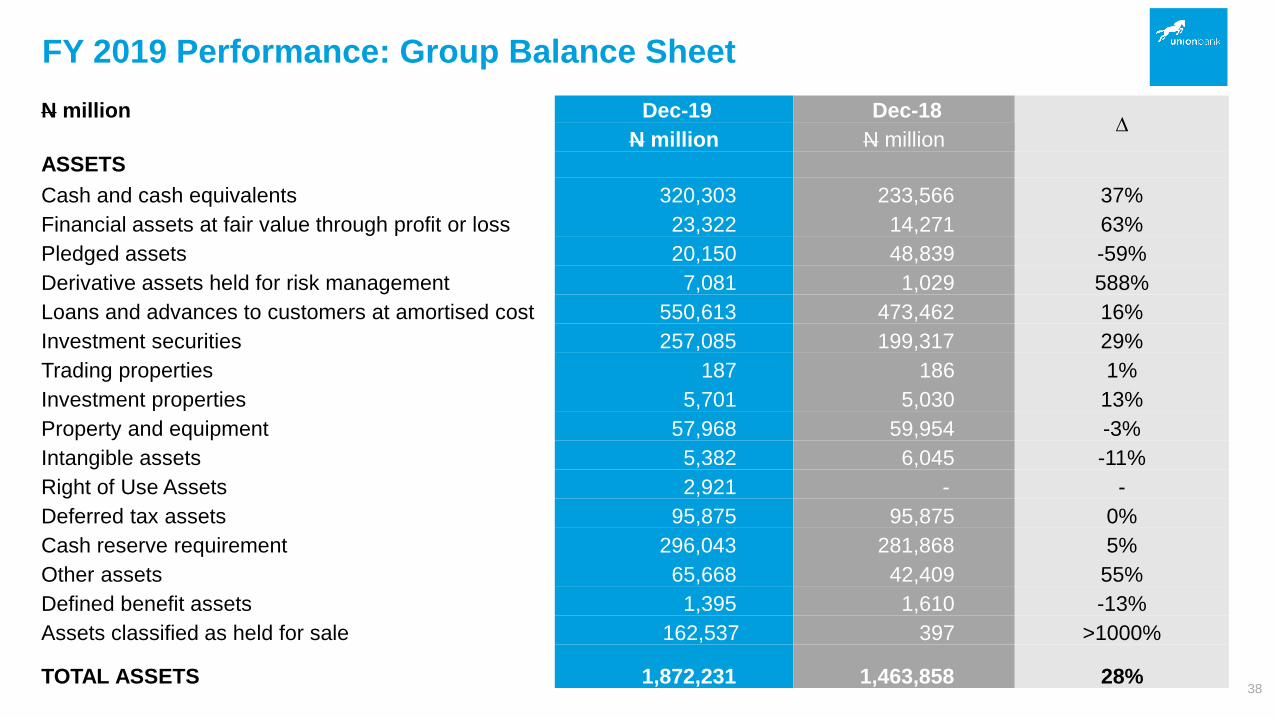
FY 2019 Performance: Group Balance Sheet
N million Dec-19 Dec-18 ∆
N million N millionASSETS
Cash and cash equivalents 320,303 233,566 37%
Financial assets at fair value through profit or loss 23,322 14,271 63%
Pledged assets 20,150 48,839 -59%
Derivative assets held for risk management 7,081 1,029 588%
Loans and advances to customers at amortised cost 550,613 473,462 16%
Investment securities 257,085 199,317 29%
Trading properties 187 186 1%
Investment properties 5,701 5,030 13%
Property and equipment 57,968 59,954 -3%
Intangible assets 5,382 6,045 -11%
Right of Use Assets 2,921 - -
Deferred tax assets 95,875 95,875 0%
Cash reserve requirement 296,043 281,868 5%
Other assets 65,668 42,409 55%
Defined benefit assets 1,395 1,610 -13%
Assets classified as held for sale 162,537 397 >1000%
TOTAL ASSETS 1,872,231 1,463,858 28%38
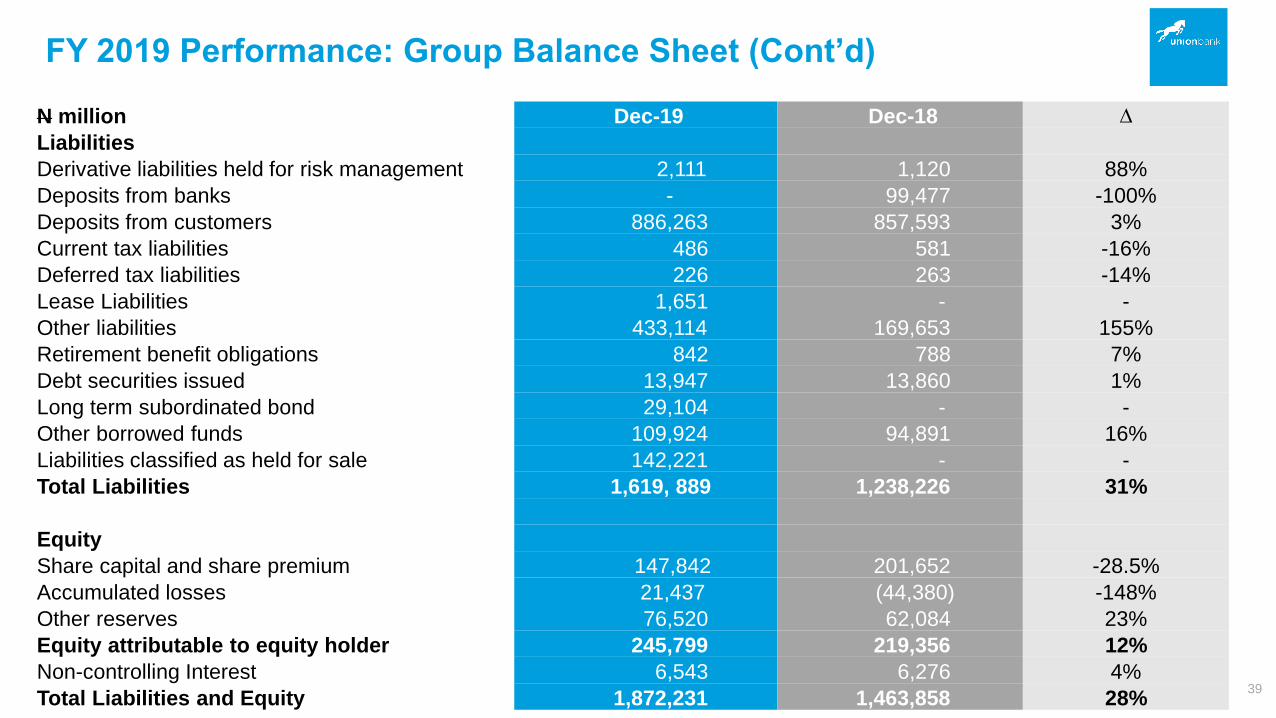
FY 2019 Performance: Group Balance Sheet (Cont’d)
N million Dec-19 Dec-18 ∆
Liabilities
Derivative liabilities held for risk management 2,111 1,120 88%
Deposits from banks - 99,477 -100%
Deposits from customers 886,263 857,593 3%
Current tax liabilities 486 581 -16%
Deferred tax liabilities 226 263 -14%
Lease Liabilities 1,651 - -
Other liabilities 433,114 169,653 155%
Retirement benefit obligations 842 788 7%
Debt securities issued 13,947 13,860 1%
Long term subordinated bond 29,104 - -
Other borrowed funds 109,924 94,891 16%
Liabilities classified as held for sale 142,221 - -
Total Liabilities 1,619, 889 1,238,226 31%
Equity
Share capital and share premium 147,842 201,652 -28.5%
Accumulated losses 21,437 (44,380) -148%
Other reserves 76,520 62,084 23%
Equity attributable to equity holder 245,799 219,356 12%
Non-controlling Interest 6,543 6,276 4%
Total Liabilities and Equity 1,872,231 1,463,858 28%39
Group Financials
Bank Financials
Appendix
2
Bank Financials
1
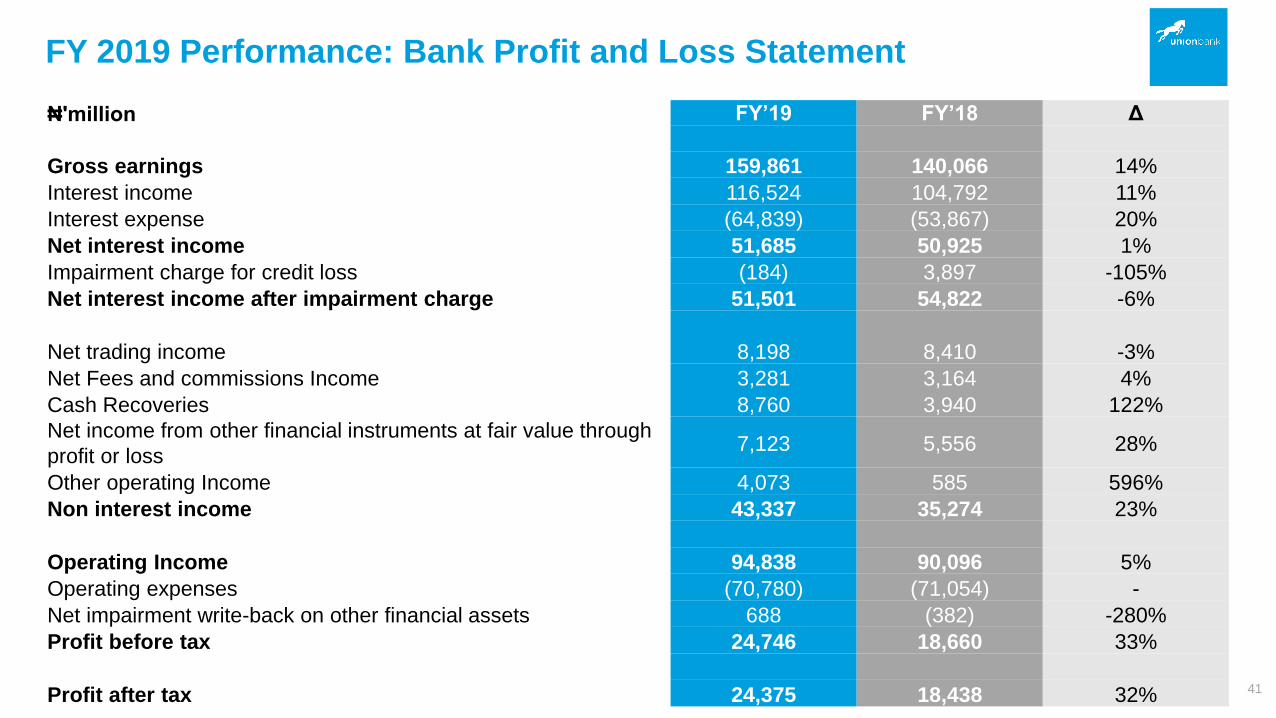
FY 2019 Performance: Bank Profit and Loss Statement
₦'million FY’19 FY’18 Δ
Gross earnings 159,861 140,066 14%
Interest income 116,524 104,792 11%
Interest expense (64,839) (53,867) 20%
Net interest income 51,685 50,925 1%
Impairment charge for credit loss (184) 3,897 -105%
Net interest income after impairment charge 51,501 54,822 -6%
Net trading income 8,198 8,410 -3%
Net Fees and commissions Income 3,281 3,164 4%
Cash Recoveries 8,760 3,940 122%
Net income from other financial instruments at fair value through
profit or loss7,123 5,556 28%
Other operating Income 4,073 585 596%
Non interest income 43,337 35,274 23%
Operating Income 94,838 90,096 5%
Operating expenses (70,780) (71,054) -
Net impairment write-back on other financial assets 688 (382) -280%
Profit before tax 24,746 18,660 33%
Profit after tax 24,375 18,438 32% 41
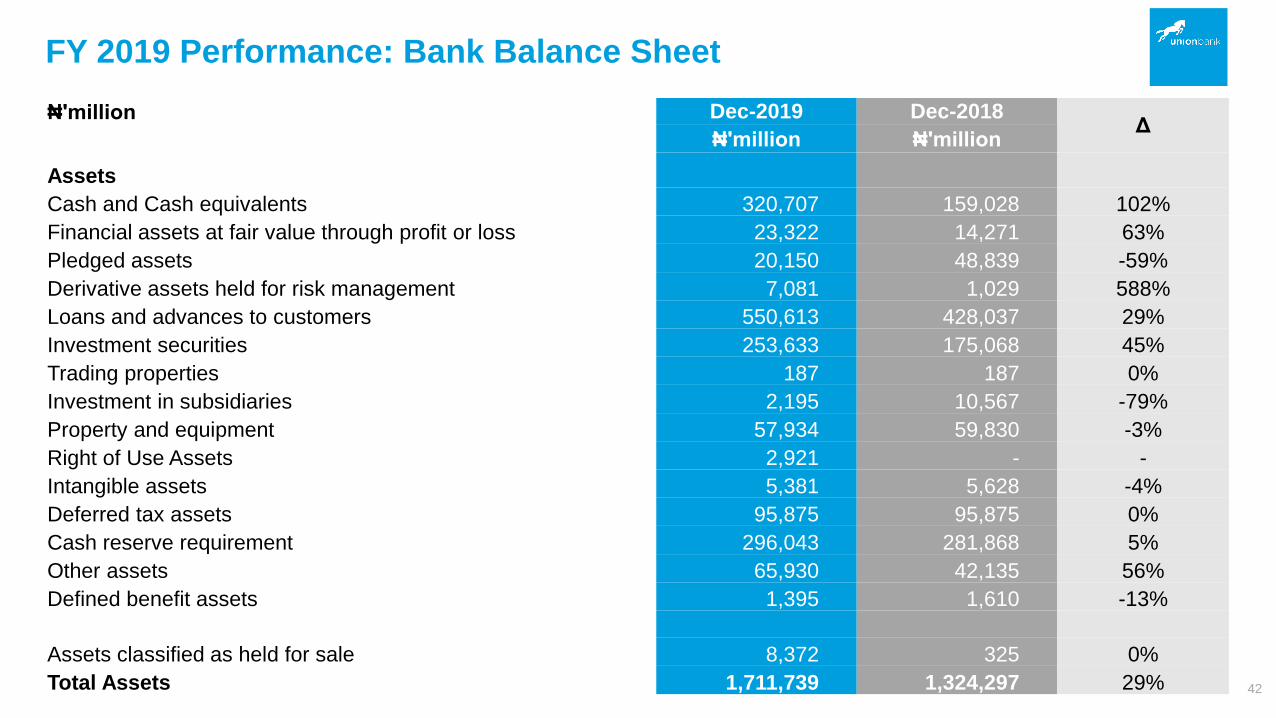
FY 2019 Performance: Bank Balance Sheet
₦'million Dec-2019 Dec-2018Δ
₦'million ₦'million
Assets
Cash and Cash equivalents 320,707 159,028 102%
Financial assets at fair value through profit or loss 23,322 14,271 63%
Pledged assets 20,150 48,839 -59%
Derivative assets held for risk management 7,081 1,029 588%
Loans and advances to customers 550,613 428,037 29%
Investment securities 253,633 175,068 45%
Trading properties 187 187 0%
Investment in subsidiaries 2,195 10,567 -79%
Property and equipment 57,934 59,830 -3%
Right of Use Assets 2,921 - -
Intangible assets 5,381 5,628 -4%
Deferred tax assets 95,875 95,875 0%
Cash reserve requirement 296,043 281,868 5%
Other assets 65,930 42,135 56%
Defined benefit assets 1,395 1,610 -13%
Assets classified as held for sale 8,372 325 0%
Total Assets 1,711,739 1,324,297 29% 42
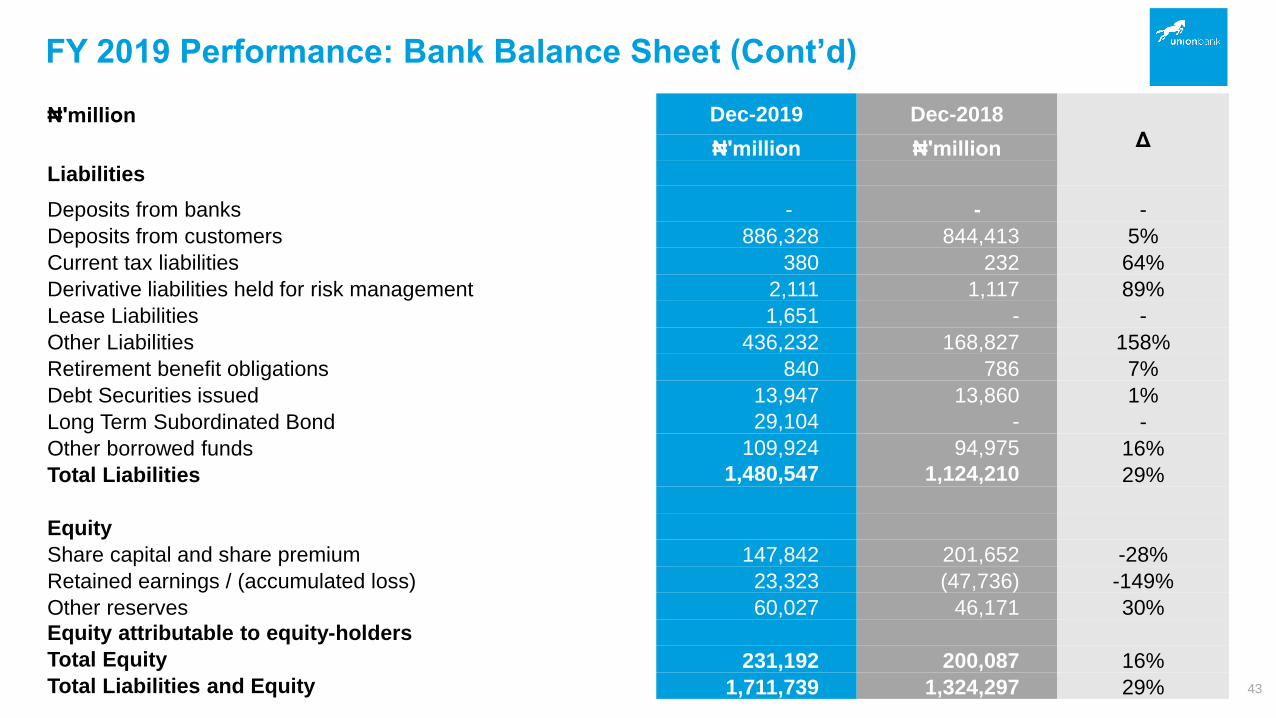
FY 2019 Performance: Bank Balance Sheet (Cont’d)
₦'million Dec-2019 Dec-2018
Δ₦'million ₦'million
Liabilities
Deposits from banks - - -
Deposits from customers 886,328 844,413 5%
Current tax liabilities 380 232 64%
Derivative liabilities held for risk management 2,111 1,117 89%
Lease Liabilities 1,651 - -
Other Liabilities 436,232 168,827 158%
Retirement benefit obligations 840 786 7%
Debt Securities issued 13,947 13,860 1%
Long Term Subordinated Bond 29,104 - -
Other borrowed funds 109,924 94,975 16%
Total Liabilities 1,480,547 1,124,210 29%
Equity
Share capital and share premium 147,842 201,652 -28%
Retained earnings / (accumulated loss) 23,323 (47,736) -149%
Other reserves 60,027 46,171 30%
Equity attributable to equity-holders
Total Equity 231,192 200,087 16%
Total Liabilities and Equity 1,711,739 1,324,297 29% 43
Thank You
Contact Information:Website: www.unionbankng.com
Email: [email protected]
Union Bank of Nigeria @unionbank_ng @unionbankng Union Bank of Nigeria