Embed Size (px)
Citation preview
Conference call
26 February 2015
3.00 p.m. CET
Results presentation as at 31/12/2014

DIS
CL
AIM
ER
This presentation does not constitute an offer or an invitation to subscribe for or purchase any securities.
The securities referred to herein have not been registered and will not be registered in the United States under the U.S. Securities Act of 1933, as
amended (the “Securities Act”), or in Australia, Canada or Japan or any other jurisdiction where such an offer or solicitation would require the approval
of local authorities or otherwise be unlawful. The securities may not be offered or sold in the United States or to U.S. persons unless such securities
are registered under the Securities Act, or an exemption from the registration requirements of the Securities Act is available. Copies of this
presentation are not being made and may not be distributed or sent into the United States, Canada, Australia or Japan.
This presentation contains forwards-looking information and statements about IGD SIIQ SPA and its Group.
Forward-looking statements are statements that are not historical facts.
These statements include financial projections and estimates and their underlying assumptions, statements regarding plans, objectives and
expectations with respect to future operations, products and services, and statements regarding plans, performance.
Although the management of IGD SIIQ SPA believes that the expectations reflected in such forward-looking statements are reasonable,
investors and holders of IGD SIIQ are cautioned that forward-looking information and statements are subject to various risk and uncertainties,
many of which are difficult to predict and generally beyond the control of IGD SIIQ; that could cause actual results and developments to differ
materially from those expressed in, or implied or projected by, the forward-looking statements.
These risks and uncertainties include, but are not limited to, those contained in this presentation.
Except as required by applicable law, IGD SIIQ does not undertake any obligation to update any forward-looking information or statements

3
26 February 2015 Results presentation as at 31/12/2014
2014,a year of transformation…in view of growth
PORTFOLIO
Pipeline execution (Centro d’Abruzzo and Le Porte di
Napoli extension) and capex that helped maintain the
property portfolio value
PROFITABILITY
Net profit and dividend per share increased
(considering the effects of the capital increase
concluded in October 2014)
Core
business
OPERATING ACTIVITY
Core business revenues, financial occupancy and
recurring cash flow (FFO) substantially steady (even
after the disposal of the mall in Livorno)
FINANCIAL STRUCTURE STRENGTHENING
• Capital increase of € 200 mn
• Dividend Reinvestment Option (78% of
subscriptions)
• Loan to Value from 57.4% to 48.3%
Extraordinary
management
Operating and financial bases consolidated to implement the next phase of growth
EXTERNAL GROWTH
• Acquisition of a core portfolio ( € 95 mn)
• Purchase of 20% of UnipolSai Investimenti Sgr
share capital
FINANCIAL MARKET OPPORTUNITIES
• Private placement of a senior bond (€ 150 mn)
• ABS loan (€ 135 mn)
DISPOSAL PLAN
• Assets: Le Fonti del Corallo and Via Rizzoli* with
values in line with or higher than the book value
• Treasury shares sold
* Preliminary contract communicated on 15 January 2015

4
26 February 2015 Results presentation as at 31/12/2014
Highlights (1/2)
€ 9.4 mn( € 0.9 mn at 31/12/2013)
€ 35.1 mn(-0.9% vs 31/12/2013)
• EBITDA (core business)€ 79.3 mn
( -4.3% vs 31/12/2013)
EBITDA
REVENUES
• EBITDA margin from Freehold77.3%
( -0.9 percentage points)
• Pre-tax Profit of the Group
• Group Net Profit € 7.3 mn
(+46.1% vs 31/12/2013)
• Core business revenues€ 120.5 mn
(-0.2% vs 31/12/2013)
€ 0.046
• Core business Funds From Operations (FFO)
• Core business FFO per share

5
26 February 2015 Results presentation as at 31/12/2014
Highlights (2/2)
€ 1,951.2 mn
• ITALY
• ROMANIA
96.2%
86.4%
FINANCIAL OCCUPANCY at 31/12/2014
Total Portfolio Market Value
48.3%(vs 57.4% at 31/12/2013)
Loan to Value
0.95(vs 1.38 at 31/12/2013)
Gearing (D/E)
* Adjusted: considering capital increase effects, total number of share moved to 348,001,715 to 756,356,289
Dividend per share € 0.0375+25.4% on 2013 adjusted DPS*
€ 1.23NNNAV

ECONOMIC CONTEXT

7
26 February 2015 Results presentation as at 31/12/2014
Italian macroeconomic indicators
GDP trend (% change)
• OUTLOOK: 1Q 2015 is the first quarter with an increase after thirteen negative ones. Confidence indexes
and 2015 outlook are gradually improving. Possible positive effects due to expansive monetary policy,
stability law measures, acceleration in international trade, drop in exchange rate and decline in oil prices. Also
consumption is expected to grow.
• REAL ESTATE INVESTMENTS: in 2014 investor interest, especially foreign, for the Italian real estate
market increased: total investment volume of € 5.3 billion (+10% vs 2013). In particular, the retail sector was
the one investors preferred (+18% vs 2013 for a total value of € 2.6 billion).
Consumption trend (% change)Evolution of annual foreign
investment in Italy (€ mn)
-0.4%
0.5%
1.0%
-0.5%
0.0%
0.5%
1.0%
1.5%
2.0%
2014 2015 2016
0.2%
0.6%0.8%
0.0%
0.5%
1.0%
1.5%
2.0%
2014 2015 2016
0
1,000
2,000
3,000
4,000
5,000
2007 2008 2009 2010 2011 2012 2013 2014

8
26 February 2015 Results presentation as at 31/12/2014
Romanian macroeconomic indicators
GDP trend (% change)
• OUTLOOK: positive macroeconomic data: GDP (excluding agriculture) is expected to increase in the year
by about 2.5% and unemployment is expected to be steady at about 7%. Excellent result in consumption in
2014 although the ongoing deleveraging of households has slowed down any possible benefits resulting in
greater retail sales in the coming years (however a constant growth is expected).
• REAL ESTATE MARKET: 2014 was the year with a lower increase in retail GLA since 2008 (+ 80,000 m²,
stock at 2.88 million m²). Restyling activities and refurbishment programs were also confirmed also in the
Romanian real estate retail market, in order to obtain better market placement.
Consumption trend (% change)
2.8% 2.7%2.9%
0.0%
0.5%
1.0%
1.5%
2.0%
2.5%
3.0%
3.5%
4.0%
2014 2015 2016
4.0%
2.8% 2.7%
0.0%
0.5%
1.0%
1.5%
2.0%
2.5%
3.0%
3.5%
4.0%
4.5%
5.0%
2014 2015 2016

ECONOMIC AND
FINANCIAL RESULTS

10
26 February 2015 Results presentation as at 31/12/2014
Consolidated Income Statement
Total revenues from rental activities:
115.6 €000
From Shopping Malls: 76.8 €000 of which:
• Italian Malls 68.5 €000
• Winmarkt Malls 8.3 €000
From Hypermarkets: 36.3 €000
From City Center Project – v. Rizzoli: 1.8 €000
From Other: 0.7 €000
€/000 31/12/2013 31/12/2014 D% 31/12/2013 31/12/2014 D% 31/12/2013 31/12/2014 D%
Revenues from freehold real estate and rental activities 105,653 102,907 (2.6)% 105,556 102,633 (2.8)% 97 274 n.a.
Revenues from leasehold real estate and rental activities 10,183 12,713 24.8% 10,183 12,713 24.8% 0 0 n.a.
Total revenues from real estate and rental activities 115,836 115,620 (0.2)% 115,739 115,346 (0.3)% 97 274 n.a.
Revenues from services 4,996 5,139 2.9% 4,996 5,139 2.9% 0 0 n.a.
Revenues from trading 6,163 1,644 (73.3)% 0 0 n.a. 6,163 1,644 (73.3)%
OPERATING REVENUES 126,995 122,403 (3.6)% 120,735 120,485 (0.2)% 6,260 1,918 (69.4)%
INCREASES, COST OF SALES AND OTHER COSTS (5,219) (1,360) (73.9)% 0 0 n.a. (5,219) (1,360) (73.9)%
Rents and payable leases (8,560) (11,067) 29.3% (8,560) (11,067) 29.3% 0 0 n.a.
Personnel expenses (3,679) (3,731) 1.4% (3,679) (3,731) 1.4% 0 0 n.a.
Direct costs (16,133) (16,662) 3.3% (15,772) (16,296) 3.3% (361) (366) 1.2%
DIRECT COSTS (28,372) (31,460) 10.9% (28,011) (31,094) 11.0% (361) (366) 1.2%
GROSS MARGIN 93,403 89,583 (4.1)% 92,724 89,391 (3.6)% 680 192 (71.7)%
Headquarters personnel (5,983) (6,096) 1.9% (5,881) (5,991) 1.9% (102) (105) 2.9%
G&A expenses (4,517) (4,673) 3.5% (4,049) (4,150) 2.5% (468) (523) 11.6%
G&A EXPENSES (10,501) (10,769) 2.6% (9,930) (10,141) 2.1% (570) (628) 10.1%
EBITDA 82,903 78,814 (4.9)% 82,795 79,250 (4.3)% 108 (436) n.a.
Ebitda Margin 65.3% 64.4% 68.6% 65.8%
Other provisions (125) (125) 0.0%
Impairment and fair value adjustment (33,487) (23,101) (31.0)%
Depreciations (1,323) (1,414) 6.9%
DEPRECIATIONS AND IMPAIRMENTS (34,935) (24,640) (29.5)%
EBIT 47,968 54,174 12.9%
NET FINANCIAL RESULT (46,550) (44,792) (3.8)%
EXTRAORDINARY MANAGEMENT (498) (16) (96.7)%
PRE-TAX INCOME 920 9,366 n.a.
Taxes 3,244 (2,317) n.a.
NET PROFIT FOR THE PERIOD 4,164 7,049 69.3%
* (Profit)/Loss for the period related to third parties 834 253 (69.7)%
GROUP NET PROFIT 4,998 7,302 46.1%
CORE BUSINESS PORTA A MARE PROJECTCONSOLIDATED

11
26 February 2015 Results presentation as at 31/12/2014
115,739 115,346
4,996 5,1396,163 1,644
97274
CONS 2013 CONS 2014
Revenues from non core
business rental activity
Revenues from trading
Revenues from services
Revenues from core business rental activity
Revenues
TOTAL REVENUES (€/000)BREAKDOWN OF TOTAL REVENUES BY TYPE
OF ASSET
CoreBusiness
-0.2%
Total Revenues
-3.6%126,995 122,403
59.3%
31.4%
1.5%
0.3%7.2%
0.2%
MALLS HYPERMARKETS
CITY CENTER OTHER
ROMANIA "PORTA A MARE" PROJECT

12
26 February 2015 Results presentation as at 31/12/2014
254
2,032
-959
-984
-735
177
-216
LFL Italian revenues Acquisitions/ Extensions/
Restyling
Other Romania (LFL) Romania (instrumental
vacancy)
Porta a Mare Total change
Rental Income Drivers (€/000)
-9.8%
+0.2%
-0.2%Negative change due to
instrumental vacancy
(work for new layout) +
positive effect of direct
management of Darsena
City and other minor
changes
LFL Italy: +0.2% (without strategic vacancy)
Growth in hypermarkets (+1.3%) and malls
substantially steady
Higher revenues in non LFL perimeter: Centro
d’Abruzzo extension; Le Porte di Napoli
remodelling; acquisition and opening of
Piazza Mazzini; portfolio acquisition after
capital increase
2014 Average
inflation in Italy
equal to about + 0.2%
LFL Romania: -9.8%; instrumental vacancy -
7.3%
LFL: downside drag at the end of 2013 and 2014 +
new marketing activities in progress (retail and office
building)
Instrumental vacancy due to continuing investment
plan and delay in planned openings.
13
26 February 2015 Results presentation as at 31/12/2014
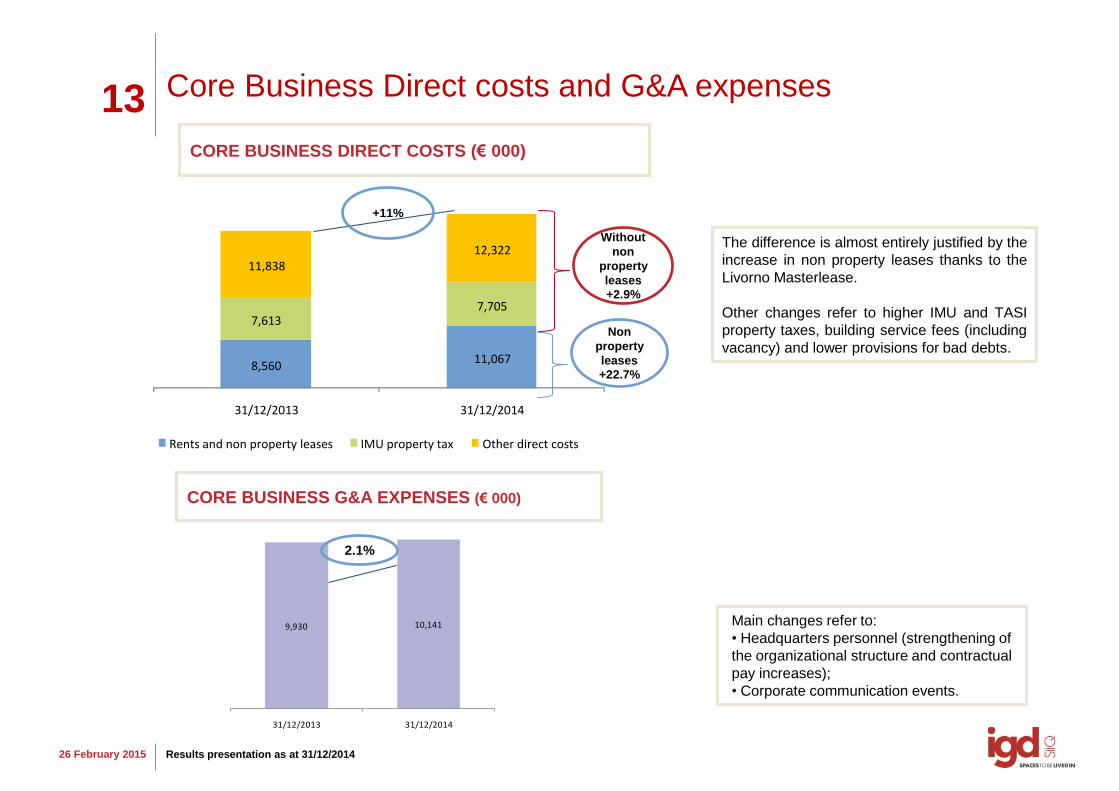
9,930 10,141
31/12/2013 31/12/2014
+11%
CORE BUSINESS DIRECT COSTS (€ 000)
Core Business Direct costs and G&A expenses
CORE BUSINESS G&A EXPENSES (€ 000)
2.1%
Main changes refer to:
• Headquarters personnel (strengthening of
the organizational structure and contractual
pay increases);
• Corporate communication events.
Without
non
property
leases
+2.9%
Non
property
leases
+22.7%
The difference is almost entirely justified by the
increase in non property leases thanks to the
Livorno Masterlease.
Other changes refer to higher IMU and TASI
property taxes, building service fees (including
vacancy) and lower provisions for bad debts.
8,56011,067
7,6137,705
11,83812,322
31/12/2013 31/12/2014
Rents and non property leases IMU property tax Other direct costs

14
26 February 2015 Results presentation as at 31/12/2014
82,795 79,250
31/12/2013 31/12/2014
68.6%
Total consolidated Ebitda: € 78.8 mn
Ebitda (core business): € 79.3 mn (-4.3%)
CONSOLIDATED EBITDA (€ 000)
EBITDA and EBITDA MARGIN CORE BUSINESS (€ 000)
65.8%
EBITDA MARGIN
from FREEHOLD
MANAGEMENT
Was equal to
77.3%
82,903
-73 -3.088 -660 -268
78,814
Ebitda 31/12/2013 Change in rental revenues and services
Change in direct costs Change in trading activities Change in G&A expenses Ebitda 31/12/2014

15
26 February 2015 Results presentation as at 31/12/2014
Pre-tax Profit of the Group: € 7.3 mn (+46.1%)NET PROFIT EVOLUTION (€ 000)
PERFORMANCE OF GROUP NET PROFIT EQUAL TO € 7.3 MN COMPARED TO 31/12/2013 REFLECTS:
• A positive change in fair value and other provisions and depreciation (+10.3€mn)
• An improvement in financial and extraordinary management of +2.2€mn
• A negative change in core business Ebitda (-3.5€mn) mainly due to increased direct costs, in particular regarding
rents and non property leases (Le Fonti del Corallo mall masterlease)
• A negative change in deferred taxes (-5.6€mn), which also include una tantum effects of “Unlock Italy” law
• Including una tantum effect of € 1.9 mn
of “Unlock Italy” law.
• € 4.4 mn failed allocation of deferred
taxes on 2014 changes.
4,998 -3,545
-544
10,295
2,240
-6,272
711 -581
7,302
Group net profit
31/12/2013
Change in core business Ebitda
Change in Ebitda 'Porta a mare' project
Change in depreciations,
provisions,
devaluations & FV
Change in financial and
extraordinary
management
Change in fiscal impact of
"Unlock Italy"
law
Change in other taxes
Change in (profit)/loss
related to third
parties
Group net profit
31/12/2014
+46.1%

16
26 February 2015 Results presentation as at 31/12/2014
Core Business Funds From Operations
FFO (€/000) 31/12/2013 301/12/2014 D D%
Of which:
• –3.5€mn due to
decreased Ebitda (mainly
due to Livorno mall
masterlease)
• +2.4€mn due to improved
financial management
(without non recurrent
charges)
• +0.9€mn due to other
changes
Pre-tax profit 6,584 12,925 6,341 96.3%
Depreciation and other provisions 1,446 1,537 90 6.3%
Change in FV and devaluations 28,467 20,604 -7,863 -27.6%
Extraordinary management 498 16 -481 -96.7%
Gross margin from trading activity 0 0 0 n.a.
Adjusted financial management 0 733 733 n.a.
Income taxes for the period -1,531 -673 859 -56.1%
FFO 35,464 35,143 -321 -0.9%
35,464 35,143
2013 FFO 2014 FFO
-0.9%
FFO TREND (€/000)
FY 2009 RESULTS
BolognaNovember 11, 2011
OPERATING
PERFORMANCE

18
26 February 2015 Results presentation as at 31/12/2014
Commercial Highlights
-0.1%
+3.4% progressive change
Footfalls in Italian IGD Shopping Malls
Tenant sales in Italian IGD Shopping Malls*
Footfalls in Romanian WINMARKT
Shopping Malls-5.9% vs 31/12/2013
-3.9% progressive change
IGD’s hypermarket and supermarket sales** -2.6% progressive change
Footfalls in Italian Shopping Malls -0.1%
Tenant sales in Italian Shopping Malls + 0.7
*IGD data is the annual total network performance (including tenant sale revenues of the two 2014 extensions)
**Sales of Afrafola Hypermarket were not considered because the sales areas of the old and new hypermarket were not comparable.
Hypermarket sales

19
26 February 2015 Results presentation as at 31/12/2014
-10.0%
-8.0%
-6.0%
-4.0%
-2.0%
0.0%
2.0%
4.0%
6.0%
Jan
-12
Feb
-12
Mar
-12
Ap
r-1
2
May
-12
Jun
-12
Jul-
12
Au
g-1
2
Sep
-12
Oct
-12
No
v-1
2
De
c-1
2
Jan
-13
Feb
-13
Mar
-13
Ap
r-1
3
May
-13
Jun
-13
Jul-
13
Au
g-1
3
Sep
-13
Oct
-13
No
v-1
3
De
c-1
3
Jan
-14
Feb
-14
Mar
-14
Ap
r-1
4
May
-14
Jun
-14
Jul-
14
Au
g-1
4
Sep
-14
Oct
-14
No
v-1
4
De
c-1
4
Tenant sales Footfalls
The performance of our shopping malls in 2014IGD’S* TENANT SALES PERFORMANCE 2012-2014
IGD*- ISTAT** PERFORMANCE 2009-2014
*IGD data is the annual total network performance (including tenant sales revenues of the two 2014 extensions. For 2011-2010 and 2010-2009 data is
LFL with regard to shopping centers taken into consideration
**ISTAT data: raw index of non-food products retail sales (Source ISTAT)
IGD’s performance
showing opposite
trend compared to
ISTAT data in the
2013-2014 period
4° consecutive
quarter on the
INCREASE
First year from 2010
with increasing
tenant sales and
steady footfalls
0.0%
-1.3%
2012 2013 2014
-2.7%
-1.3%-1.4%
3.4%
-4.0%
-3.0%
-2.0%
-1.0%
0.0%
1.0%
2.0%
3.0%
4.0%
2013-2012 2014-2013
ISTAT IGD

20
26 February 2015 Results presentation as at 31/12/2014
The performance of our shopping malls in 2014
TENANT SALES AND FOOTFALLS IN OUR
SHOPPING CENTERS
ITALY
Tenant sales increased (+3.4%) and footfalls were steady (-0.1% in line with CNCC -0.1%). An important increase in clothing and
consumer electronics was recorded in 2014, reversing the declining trend in 2013, and it represented 2/3 of total tenant sales in the
shopping centers.
ROMANIA
On an annual basis footfalls were -5.9% compared to 2013, but the 4Q, in terms of footfalls and tenant sales, appeared to be the best of
the year due to work in progress being reduced to one shopping mall and due to the Christmas holidays.
In terms of tenant sales (those that we can monitor) a general improvement compared to the previous quarter was recorded (average
+11% sales/m²) despite the downward trend compared to 2013 (average -5% tenant sales/m²). Good performance for consumer electronics
and food anchors.
* Not all our tenants have a cash register
SALES
progressive
change
progressive
changeabsolute value
ITALY +3.4% -0.1% 60 million
ROMANIA n.p* -5.9% 29.8 milion
FOOTFALLS

21
26 February 2015 Results presentation as at 31/12/2014
12.6% 11.2%16.4%
59.8%
12.5%
87.5%
0%
10%
20%
30%
40%
50%
60%
70%
80%
90%
100%
2015 2016 2017 >2017
Malls Hypermarkets/Supermarkets
44.7%
25.8%
17.2%12.2%
26.0%
18.0%
21.0%
36.0%
0%
5%
10%
15%
20%
25%
30%
35%
40%
45%
50%
2015 2016 2017 >2017
no. of contracts rent value
Contracts in Italy and RomaniaEXPIRY DATE OF CONTRACTS OF HYPERMARKETS
AND MALLS IN ITALY (% no. of contracts)
ITALYIn 2014, 229 contracts were signed, of which 89
turned over and 140 renewed.
Downside on renewal -7.2% mainly due to the
renewal of contracts in shopping centers opened
in 2009, before the crisis, and to
renewals/turnovers in shopping centers where
area remodeling is in progress.
ROMANIAIn 2014, 79 contracts were renewed (downside -
4%) and 41 contracts were signed.
The 4Q recorded an upside equal to 5% due to less
work in progress in shopping malls.
EXPIRY DATE OF CONTRACTS OF HYPERMARKETS AND
MALLS IN ITALY (% of value)
N 129 N 115N 168
N 21
N 90
N 64
N 135
N 234
EXPIRY DATE OF CONTRACTS OF MALLS IN ROMANIA
(no. and % of contracts and % of value)
N 612
N 3 10.8% 13.7% 15.2%
60.4%
16%
84.0%
0%
10%
20%
30%
40%
50%
60%
70%
80%
90%
2015 2016 2017 >2017
Malls Hypermarkets/Supermarkets

22 2014 Commercial and asset management activities (1/4)
Location: San Giovanni Teatino,
Chieti
Extension date: 10/04/2014
2014 footfalls: +9.3% vs 2013
(abs. Value 3.4 mn)
2014 tenant sales: +35.1% vs 2013
(abs. Value € 27.2 mn)
Activity: Extension and
restyling

23 2014 Commercial and asset management activities (2/4)
Location: Guidonia
Montecelio, Roma
2014 footfalls: +13.1% vs 2013
(abs. Value 5.1 mn)
2014 tenant sales: +12.6% vs 2013
(abs. Value € 75.7 mn)
Activity: Tenant mix
redefinition, unification of small
shops to create new middle
sized areas

24 2014 Commercial and asset management activities (3/4)
Location: Afragola, Napoli
Restyling date: 03/12/2014Dec-2014 footfalls: +11.3% vs Dec-2013
(abs. Value in 1 month 0.5 mn)
Dec-2014 tenant sales: +51.2% vs Dec-2013
(abs. Value in 1 month € 5.1 mn)
Activity: Mall extension,
internal remodeling and
hypermarket reduction

25
26 February 2015 Results presentation as at 31/12/2014
Location: Mondovì, Cuneo
Intervention date: April 2014
Activity: Creation of a middle sized area (Terranova) with
the unification of some vacant shops, to reduce vacancy
and increase attractiveness.
2014 footfalls: +0.6% vs 2013 (abs. Value 2.3 mn)
2014 tenant sales: +4.5% vs 2013 (abs. Value € 32.6 mn)
2014 Commercial and asset management activities (4/4)
Location: Porta a Mare, Livorno
Intervention date: 10/07/2014
Activity: Opening of Piazza Mazzini.
Opening of the first shops including
Coop, Unieuro and 8 others
Location: Villanova di Castenaso, Bologna
Intervention date: December 2014
Activity: Inclusion of new brands within the food court:
America Graffiti, La Torteria, Titto
Dec-2014 footfalls: +0.1% vs Dec-2013 (abs. Value 4.4 mn)
Dec-2014 tenant sales: +10.3% vs Dec-2013 (abs. Value € 42.9 mn)
26
26 February 2015 Results presentation as at 31/12/2014
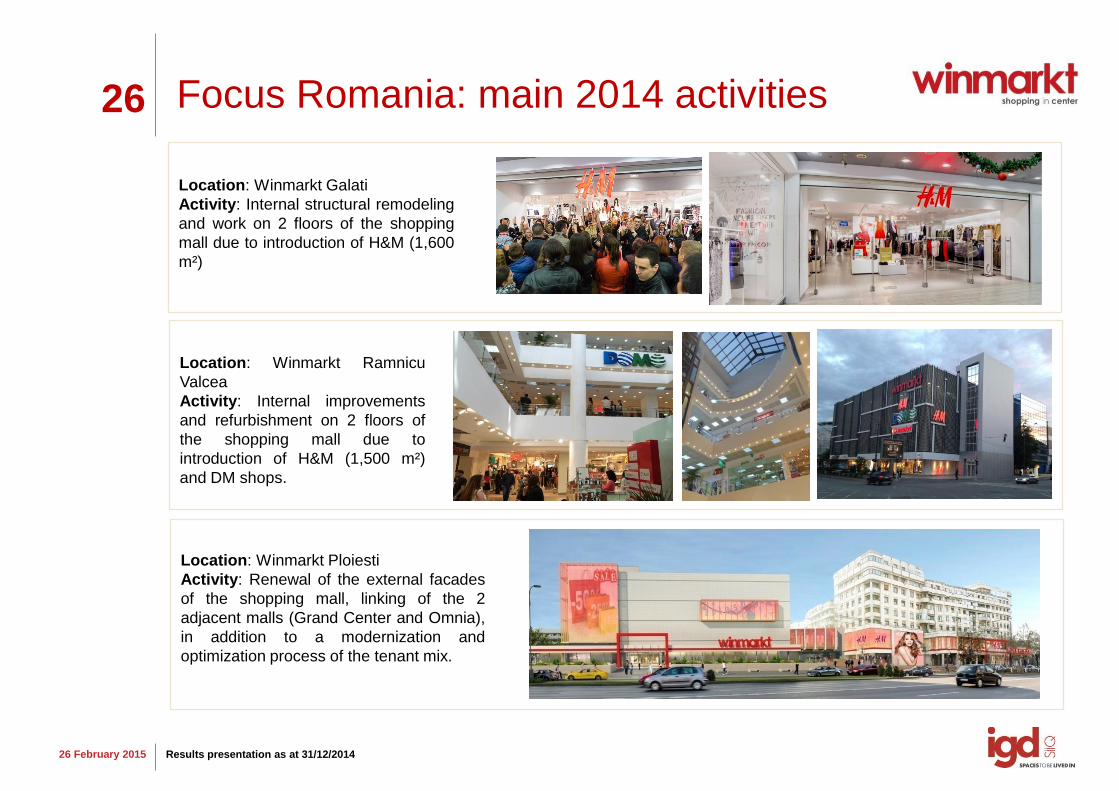
Focus Romania: main 2014 activities
Location: Winmarkt Galati
Activity: Internal structural remodeling
and work on 2 floors of the shopping
mall due to introduction of H&M (1,600
m²)
Location: Winmarkt Ramnicu
Valcea
Activity: Internal improvements
and refurbishment on 2 floors of
the shopping mall due to
introduction of H&M (1,500 m²)
and DM shops.
Location: Winmarkt Ploiesti
Activity: Renewal of the external facades
of the shopping mall, linking of the 2
adjacent malls (Grand Center and Omnia),
in addition to a modernization and
optimization process of the tenant mix.

27
26 February 2015 Results presentation as at 31/12/2014
CSR: the most important 2014 achievements
• The ISO 14001 certification of Shopping Centers in IGD’s
portfolio continued, according to the roll out plan
• Energy consumption reduced (-12.4% in the period 2013-2014
in Italy);
• BREEAM certification linked to Centro Sarca restyling
scheduled to be obtained in May 2015
• Stakeholder engagement activities continued, in particular
regarding tenants, visitors, shareholders and investors on CSR
topics.
• All employees trained in CSR
• Structural work and communication activities definied to make
IGD’s Shopping Centers increasingly accessible to all visitors
(in line with what emerged from the survey regarding individuals
with disabilities)
• 2 apps made for 2 Shopping Centers
Increase in quality and efficiency of Centers
Interpret the needs in a changing
environment
Reinforce the conceptof
BP TARGETS SOME RESULTS ACHIEVED IN 2014

28
26 February 2015 Results presentation as at 31/12/2014
Technological innovation in 2014
APPS
•2 apps created in 2
Shopping Centers
•About 2,400 total
downloads
DIGITAL TOTEM
• Introduction of digital
totem into malls to
communicate what is
happening in the
Center and to promote
visitor loyalty
WEB SITES
•All the centers have
a web site, with
increasing access
•Full alignment to a
unique format
SOCIAL NETWORK
•Facebook: all the
Shopping Centers have
their own account, with
increasing “Likes”
•Twitter: official account
opened @igdSIIQ

FY 2009 RESULTS
BolognaNovember 11, 2011
PORTFOLIO

30
26 February 2014 Results presentation as at 31/12/2014
Portfolio characteristics
ROMANIA
HYPERMARKETS MALLS AVERAGE MALLS
Financial occupancy 100.0% 94.3% 96.2% 86.4%
Market value as at 31 December 2014 €mn 602.18 970.44 171.90
Compound average yield of total portfolio (gross initial yield)
6.52% 6.58% 6.72%
Gla mq 262,160 279,860 77,969
ITALY
BTP yield vs Gross Initial Yield of IGD’s Italian Malls
Maximum change (4.91
percentage points) from
2009 to 2014 between
gross initial yield of IGD’s
Italian Malls and 5 year
BTP*1.67%
6.58%
0.00%
1.00%
2.00%
3.00%
4.00%
5.00%
6.00%
7.00%
2009 2010 2011 2012 2013 2014
BTP 5Y YIELD GROSS INITIAL YIELD ITALIAN MALLS
*Source: Italian Treasury Minister

31
26 February 2015 Results presentation as at 31/12/2014
€ mn Mkt Value Mkt Value
31/12/2013 31/12/2014
Market Value evolution
HYPERMARKETS: At 31.12. 2014 the change in FV, not including the hypermarket remodelling in Le Porte di
Napoli or the portfolio acquisition after the capital increase, was equal to +5.9mn€ recording +1.1% compared
to 31.12.2013
MALLS and RETAIL PARK: At 31.12. 2014 the FV, not including extraordinary effects such as the disposal of
Le Fonti del Corallo mall, the remodelling of Le Porte di Napoli mall, the extension of Centro d’Abruzzo mall
and the portfolio acquisition after the capital increase, depreciated by -11.1 € mn equal to -1.1% compared to
2013
CITY CENTER: At 31.12.2014 the change in FV, not including Piazza Mazzini which entered into the category
in the 2H 2014, was equal to +2.9%
ROMANIAN MALLS: At 31.12.2014 the FV recorded an increase of 1.1% (+1.9 € mn)
Malls+Hypermarkets+Other Italy 1,522.49 1,579.09
City Center ( V. Rizzoli + Piazza Mazzini) 27.80 56.50
Total income related portfolio in ITALY 1,550.29 1,635.57
Total income related portfolio in ROMANIA 173.40 175.30
TOTAL IGD INCOME RELATED PORTFOLIO 1,723.69 1,810.88
Porta a Mare + plots of land 167.59 140.33
TOTAL IGD PORTFOLIO 1,891.28 1,951.21

32
26 February 2015 Results presentation as at 31/12/2014
Chioggia Retail Park
Location: Chioggia, Venezia
Start of work: November 2013
End of work: 1H 2015
Total expected investment about € 39 mn
Work in progress (1/2)
Extension of Shopping Center
Location: Ravenna
Start of work: December 2014
End of work: December 2016
Total expected investment about € 51 mn
Officine Storiche
Location: Livorno
Start of work: 1H 2015
End of work: 2H 2017
Total expected investment about € 40 mn

33
26 February 2015 Results presentation as at 31/12/2014
Extension
Location: Porto d’Ascoli (AP)
Start of work: 1H 2015
End of work: 2H 2016
Total expected investment about € 10 mn
Work in progress (2/2)
Restyling
Location: Bologna
Start of work: 2014
End of work: 2015
Total expected investment about € 3.5 mn
Restyling
Location: Sesto San Giovanni (MI)
Start of work: 2013
End of work: 2015
Total expected investment about € 8 mn

34
26 February 2015 Results presentation as at 31/12/2014
Disposal plan
2/3 of disposals scheduled in the 2014-2016 Business Plan
(€ 150 mn excluding Porta Medicea) already carried out with values equal to or higher than the asset book value
5 March 2014: Disposal of treasury shares (no. of shares 10,976,592 about €
12 mn) to Quantum Strategic Partners Ltd
14 February 2014: Disposal of Le Fonti del Corallo mall (Livorno) for € 47 mn
15 January 2015: Preliminary contract signed for the disposal of a real
estate complex in the heart of Bologna (Via Rizzoli) for € 29.4 mn

35
26 February 2015 Results presentation as at 31/12/2014
€ € p.s. € € p.s.
Share total number 348,001,715 756,356,289
1) NAV per the financial statement 752,850 2.16 950,229 1.26
Include
Revaluation intangibles and operating assets 423 0
Exclude
Fair value of financial instruments 33,303 43,912
Deferred taxes on balance sheet 19,289 18,093
Goodwill as a result of deferred taxes
2) EPRA NAV 805,865 2.32 1,012,234 1.34
Include
Fair value of financial instruments (33,303) (43,912)
Fair value of debt 13,447 (16,697)
Effective deferred taxes (19,406) (18,093)
3) EPRA NNNAV 766,604 2.20 933,532 1.23
December 31, 2013 December 31, 2014EPRA NNNAV Calculation
NNNAV
Change in NAV almost entirely explainable by the effects of the capital increase

FY 2009 RESULTS
BolognaNovember 11, 2011
FINANCIAL STRUCTURE

37
26 February 2014 Results presentation as at 31/12/2014
Important financial transactions carried out in 2014
May: Issue of a € 150 mn Senior Bond with Morgan Stanley
May: Dividend Reinvestment Option successfully completed (about 78%
of subscriptions)
October: Capital increase of € 200 mn successfully completed (99.75%
of subscriptions, a record result in the corporate segment of the capital market,
unexercised rights sold at the opening auction)
Net Debt
€ 942.01 mn
New funds raised in 2014: € 237.2 mn
54.4%
45.6%
BANKING SYSTEM MARKET
90.2%
9.8%
L.T. S.T.
38
26 February 2015 Results presentation as at 31/12/2014
31/12/2013
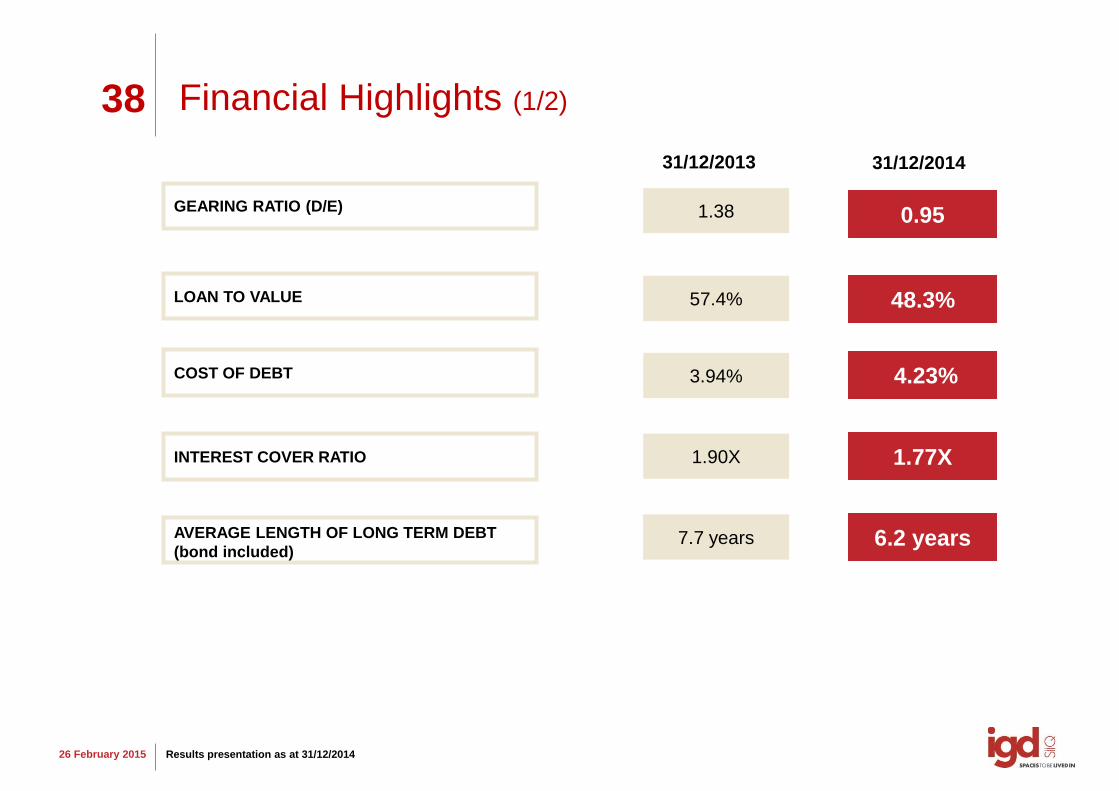
Financial Highlights (1/2)
LOAN TO VALUE
31/12/2014
GEARING RATIO (D/E)
57.4%
1.38
48.3%
0.95
3.94% 4.23%
1.90X 1.77X
COST OF DEBT
INTEREST COVER RATIO
AVERAGE LENGTH OF LONG TERM DEBT
(bond included)7.7 years 6.2 years

39
26 February 2015 Results presentation as at 31/12/2014
31/12/2013
Financial Highlights (2/2)
HEDGING ON LONG TERM DEBT + BOND
31/12/2014
90.9%
€ 273.5 mn € 267.5 mnBANKING CONFIDENCE
€ 86.6 mn € 234.0 mnBANKING CONFIDENCE AVAILABLE
€ 347.7 mn € 618.9 mnMKT VALUE OF MORTGAGE FREE
ASSETS/LANDS
79.3%

40
26 February 2015 Results presentation as at 31/12/2014
0
20,000,000
40,000,000
60,000,000
80,000,000
100,000,000
120,000,000
140,000,000
160,000,000
180,000,000
200,000,000
2014 2015 2016 2017 2018 2019 2020 2021 2022
Debt Maturity
€ 144.9
mn Bond
Of which €135 mn
BNP loan
€ 150 mn
Bond

41
26 February 2015 Results presentation as at 31/12/2014
0.065
0.02990.0375
0.0351
DPS2013 CAPITAL INCREASE EFFECT DPS 2013 ADJ* DPS 2014
Dividend
dividend of € 0.0375 per share
IGD’s Board of Directors will ask the shareholders at the Annual General Meeting on 15
April 2015, to approve the distribution of a
This year the Dividend Reinvestment Option will not be proposed
A Dividend amount equal to € 28.4 mn (81% of the FFO)
+25.4%
Dividend Yield on year end price
5.8%
Dividend Yield on 25 February price
4,6%
*Adjusted: including capital increase effects with total number of shares moved from 348,001,715 to 756,356,289

FY 2009 RESULTS
BolognaNovember 11, 2011
ATTACHMENTS

43
26 February 2015 Results presentation as at 31/12/2014
Margins from activities
Margin from freehold properties: 85.73% a slight decrease compared to 2013 (86.45%)
mainly due to a fall in revenues (especially in Romania due to strategic vacancy) and an
increase in direct costs (rise in property taxes and building services fees).
Margin from leasehold properties: 8% a decrease compared to 9.2% in 31/12/2013
mainly due to an increase in direct costs.
€/000 31/12/2013 31/12/2014 % 31/12/2013 31/12/2014 % 31/12/2013 31/12/2014 %
Margin from freehold properties 91,332 88,243 (3.4)% 91,256 87,985 (3.6)% 76 258 n.a.
Margin from leasehold properties 935 1,015 8.6% 935 1,015 8.6% 0 0 n.a.
Margin from services 534 391 (26.7)% 534 391 (26.7)% 0 (0) n.a.
Margin from trading 604 (66) n.a. 0 0 n.a. 604 (66) n.a.
Gross margin 93,404 89,583 (4.1)% 92,725 89,391 (3.6)% 680 192 n.a.
CONSOLIDATED CORE BUSINESS PORTA A MARE PROJECT

44
26 February 2015 Results presentation as at 31/12/2014
Tenants in Italy
TOTAL CONTRACTS
NEW BRANDS
Malls 1,024
Hypermarkets 24
Total 1,048
TOP 10 TenantProduct
category
Turnover
impactContracts
Gruppo Miroglio
clothing 3.5% 32
clothing 3.1% 10
clothing 2.7% 8
footwear 2.0% 5
clothing 1.6% 19
clothing 1.5% 4
electronics 1.5% 1
bricolage 1.4% 1
restaurant 1.4% 10
entertainment 1.4% 19
Total 20.0% 109

45
26 February 2015 Results presentation as at 31/12/2014
Tenants in Romania
TOTAL CONTRACTS 523
MAIN BRANDS
TOP 10 TenantProduct
category
Turnover
impactContracts
food 9.1% 9
clothing 5.1% 4
electronics 4.7% 8
jewellery 2.8% 8
household
goods2.6% 5
pharmacy 2.2% 4
House of artclothing
(family)1.7% 5
supermarkets 1.3% 2
footwear 1.2% 5
electronics 1.2% 3
Total 26.9% 53

46
26 February 2015 Results presentation as at 31/12/2014
Market Value evolution
As at 31 December 2014 IGD Group's real estate portfolio had been appraised by
3 independent experts: CBRE, REAG and CUSHMAN&WAKEFIELD
Rotated asset as
at 31/12/2014:
61%
Breakdown of the portfolio appraisals
38%
40%
21%
CBRE
REAG
CUSHMAN&WAKEFIELD

47
26 February 2015 Results presentation as at 31/12/2014
Italian and Romanian Portfolio
56 REAL ESTATE UNITS IN
11 ITALIAN REGIONS:
19 shopping malls and retail parks
24 hypermarkets and supermarkets
2 city center
3 plots of lands for development
1 property held for trading
7 other
14 SHOPPING CENTERS + 1 OFFICE BUILDING
IN 13 DIFFERENT ROMANIAN MEDIUM SIZED
CITIES

48
26 February 2015 Results presentation as at 31/12/2014
Italian and Romanian Portfolio
PORTFOLIO BREAKDOWN BY GEPGRAPHIC
AREA IN ITALY (mkt value)
BREAKDOWN BY TYPE OF IGD’S
PORTFOLIO MARKET VALUE
39.7%
13.8%
27.6%
19.0%
NORTH EAST NORTH WEST CENTRE SOUTH+ISLANDS
30.9%
49.7%
2.8%
0.3%4.4%
9.0%2.9%
HYPERMARKETS/SUPERMARKETS MALLSLANDS OTHERPORTA A MARE WINMARKT

49
26 February 2015 Results presentation as at 31/12/2014
Reclassified balance sheet
SOURCES/USE OF FUNDS (€ 000) FY13 FY14 D D%
GEARING RATIO (€ 000)
1,084,887942,095
785.559 991,046
31/12/2013 31/12/2014
Adjusted shareholders' equity
Net debt
0.951.38
Fixed assets 1,857,799 1,900,357 42,558 2.3%
Non-current assets held for sale 0 28,600 28,600 n.a.
NWC 71,271 66,637 -4,634 -6.5%
Other long term liabilities -47,189 -48,769 -1,580 3.3%
TOTAL USE OF FUNDS 1,881,881 1,946,825 64,944 3.5%
Net debt 1,084,887 942,095 -142,792 -13.2%
Net (assets) and liabilities for derivative instruments 33,302 43,912 10,610 31.9%
Shareholders' equity 763,692 960,818 197,126 25.8%
TOTAL SOURCES 1,881,881 1,946,825 64,944 3.5%
ww
w.g
rup
po
igd
.it
Claudia Contarini, IR
T. +39. 051 509213
Elisa Zanicheli
T. +39. 051 509242
to @igdSIIQ