Embed Size (px)
Citation preview

FY 2020 ANNUAL RESULTS PRESENTATION02 DECEMBER 2020

AGENDA
Stephen van CollerGroup CEO
01Strategic & operational overview
Megan PydigaduGroup CFO
02Financial overview
Stephen van CollerGroup CEO
03Looking Forward

STRATEGIC & OPERATIONAL OVERVIEWStephen van CollerGroup CEO

DELIVERING ON OUR PROMISES
Dec 2019
Late ’18/ Early ‘19
Feb 2019
Jun 2019
July 2019
Oct 2019
Apr 2020
May 2020
Jun 2020
Jul2020
Nov 2020
FY 2021+
Executing growth strategy
Exceeded R1 billion disposals target
Leadership changes
ENSafricainvestigation
initiated
Enhanced King IV compliant
Board
Agreed deleverage plan
with lenders
Established Internal Audit function
PwC appointedas auditors
ENSafricainvestigation completed
70% sale agreement between CCS & RIB
Deleverage Milestone:
R1,8bn paid to lenders since
Aug 2018
Sale of Syntell
*R1,65bntotal consideration from
disposals process
Debt balance as at 30 Nov:R2,0bn from R3,5bn in 2018
Launch ofiOCO strategy
Sale of remaining 30%
stake in CCS
*R1,4bn total consideration since
disposals process started in FY2019
90% improvement inNet Working Capital
investment since H2 2018Transparency
Liquidity
Credibility
*Including VFA liability relief 4

down to
R2,04bnPost-Syntell
TOTAL DEBT BALANCE
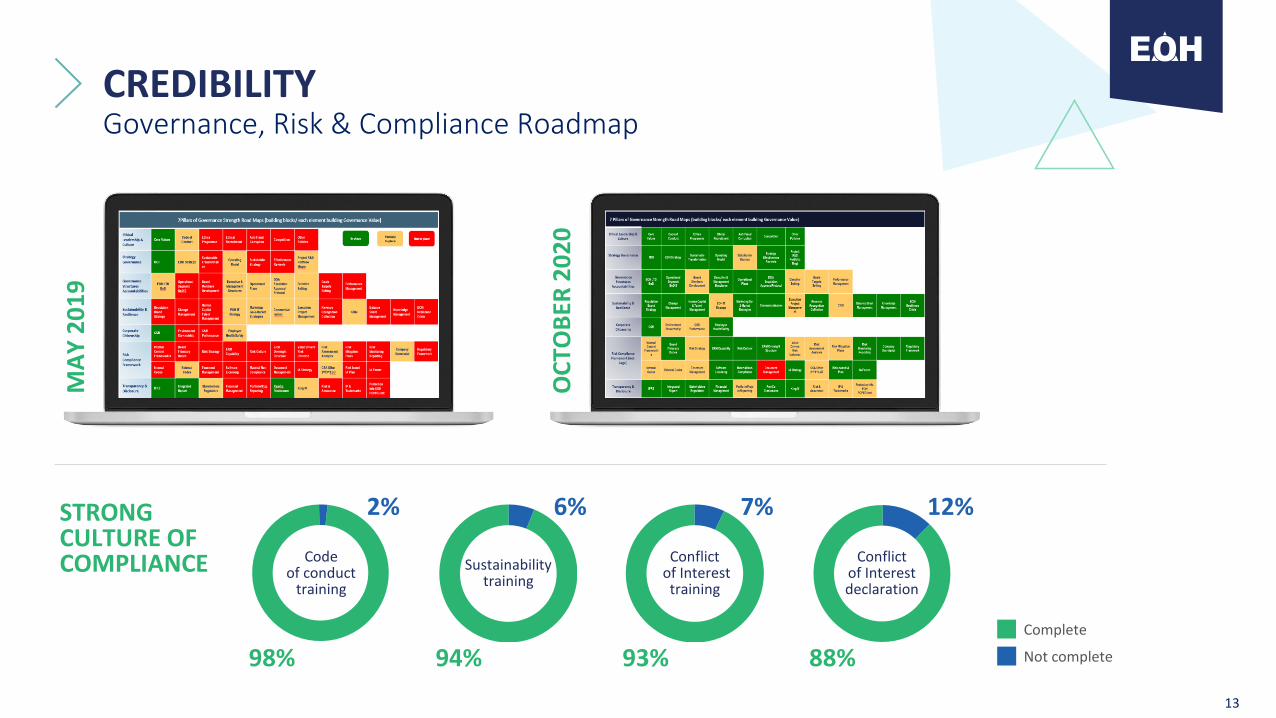
BUSINESS STABILISED2-year turnaround plan on target
Note: All numbers include continuing and discontinuing operations*Net of overdraft Normalised EBITDA refers to core normalised EBITDA after once-off cost savings as a result of COVID-19
Underpinned by:
5
NEXTECself sustaining
Focus on People through enhanced EVP
Total Revenue of
R11.3bnGP MARGIN
up 2%pts to 22%
NORMALISEDEBITDA MARGIN
up 4%pts to 7%
R946m*
POSITIVECASH BALANCE
REVENUE STABILISED LIQUIDITY PROGRESSIMPROVEMENT IN QUALITY OF EARNINGS
iOCO positioned for growth
Entrenched governance& ethical business practices
improved by
R337m
NET WORKING CAPITAL
in H2 2020
down to
R10m
ONCE-OFF CASH ITEMS
STRONG CASH generated from operations
R707mup 41%
Resilient CUSTOMER BASE
PositiveEBITDA of
R72m 72% HEPSimprovement
(fromR1.4bn loss)
iOCOREVENUE STABILISED
Corec.96%of CASH GENERATEDin H2 2020

Financial Services
Public Sector
Health
Manufacture & Logistics
Telecoms
Information Technology
Human capital
Other
Construction
Mining
Energy
Food & Beverage
Retail
Education
Hospitality
22%
21%
9%
7%
7%
6%
2%
2%
5%
4%
4%
4%
3%
2%
1%
RESILIENT BUSINESS MODEL Driven by high margin Services & Software categories
PRODUCT MIX
FY2019 FY2020
REVENUE EXPOSURE BY INDUSTRY
Central Government
39%Local
Government
44%
SOEs
17%
Public Sectorremains
meaningful
6
7% 7%
83% 81%
10% 11%Hardware
Software
Other
Services

WELL POSITIONED POST-STRATEGIC REVIEW
7
CORE REVENUE
67%contribution to Normalised EBITDA
59%contribution toTotal Revenue
iOCO Technologyns
iOCO Services
iOCO Digital
Sales & Advisory
Technology
Digital
Manage and Operate& Network Solutions
Digital Industries
Sales & Advisory
Jul-20Jul-19 Jan-20Sep-19 Nov-19 Mar-20 May-20 Sep-20 Oct-20
Normalised EBITDA refers to core normalised EBITDA after once-off cost savings as a result of COVID-19

STABILISEDSelf sustaining on a cash basis
8
focused on two main pillars
PeopleOutsourcing
Solutions
Supplying solutionsaround recruitment, staffing, training and
development, and Change Management
Intelligent Infrastructure
Solutions
Designing, installing, managing and creating bespoke data platforms
using the latest OEM technology solutions in
the infrastructure environment across
multiple sectors
7%contribution to Normalised EBITDA
30%contribution toTotal Revenue
-R33m>H1 EBITDA
R45m
H2 EBITDA
-R60m>
H1 NormalisedEBITDA
R158m
H2 NormalisedEBITDA
Normalised EBITDA refers to core normalised EBITDA after once-off cost savings as a result of COVID-19

IP BUSINESSES REMAIN RESILIENTIP cluster key to deleverage strategy and currently outperforming budget
9
Syntell disposal completed18 Nov 2020
Sybrin & Information Services disposals well advanced
COVID-19 REVENUE IMPACT
Info Services
26%contribution to Normalised EBITDA
11%contribution toTotal Revenue
Jul-20Jul-19 Jan-20Oct-19 Oct-20Apr-20
-9%
Normalised EBITDA refers to core normalised EBITDA after once-off cost savings as a result of COVID-19

CREATING A FIT-FOR-PURPOSE COST STRUCTURESustainable reduction in costs of 3-5% anticipated
Down
45%YoY
Once-off OPEXR104m vs R565min FY19
Down
51% in H2 2020 vs H1 2020
OPEX
PROPERTY RATIONALISATION
R75m rental savingsachieved in FY2020
81 buildings& c.57 000 sqm exited to date
PEOPLE
Reduction in employees from 10 279TAX OPTIMISATION
R102mreduction in tax payments
COVID-19 MEASURES
c.R400m in cashsavings deliveredover four months
to 7 333in 2020due to:
EFFICIENT STRUCTURE
Legal entitiesreduced by 99
10Normalised EBITDA refers to core normalised EBITDA after once-off cost savings as a result of COVID-19
Liquidated companies11%
Retrenchments16%
Contractors not renewed42%
Business as usual4%
Disposed entities27%

EMPLOYEES A KEY PRIORITYEnhanced EVP to ensure talent attraction and retention
A responsible employer.
Instilling purpose& motivation.
Promoting diversity & inclusion.
Generational Diversity
AmendedMaternity& Paternity Leave Policy
WellnessWednesdays
People &Culture Imbizo
Recognition
CEO AWARDS
Racial & Gender DiversityWOMEN IN LEADERSHIP PROGRAMME
SOCIAL COHESION
UNCONSCIOUS BIAS
Volunteerism
GEAR UP
LearningDevelopmentR(IS)E UP
#MyNextMove
Socio-Economic Development
11

STRONG DELEVERAGING PERFORMANCER’m
Debt
Liabilities for acquisitions
1 997
CREDIBILITYGovernance, Risk & Compliance Roadmap
MA
Y 2
01
9
OC
TOB
ER 2
02
0
Complete
Not complete
STRONG CULTURE OF COMPLIANCE
12%
Conflictof Interest declaration
88%
Conflictof Interest training
7%
93%
Sustainabilitytraining
6%
94%
Codeof conduct
training
2%
98%
13

LEGACY CONTRACTS RISK MITIGATEDLimited risk now, despite ongoing media speculation
Repayment settlement reached in
2 contracts
Resolution on remaining contract
imminent
Special Investigations Unit (SIU)
8 problematic legacy contracts
5 settled
1 in arbitration
1 contract ending April 2021
1 contract in final stages of close-out
14

CORPORATE CITIZENSHIP
Committedto enabling to our society
ICT
15
down to
R2,04bnPost-Syntell
TOTAL DEBT BALANCE
BUSINESS STABILISED2-year turnaround plan on target
Note: All numbers include continuing and discontinuing operations*Net of overdraft Normalised EBITDA refers to core normalised EBITDA after once-off cost savings as a result of COVID-19
Underpinned by:
16
NEXTECself sustaining
Focus on People through enhanced EVP
Total Revenue of
R11.3bnGP MARGIN
up 2%pts to 22%
NORMALISEDEBITDA MARGIN
up 4%pts to 7%
R946m*
POSITIVECASH BALANCE
REVENUE STABILISED LIQUIDITY PROGRESSIMPROVEMENT IN QUALITY OF EARNINGS
iOCO positioned for growth
Entrenched governance& ethical business practices
improved by
R337m
NET WORKING CAPITAL
in H2 2020
down to
R10m
ONCE-OFF CASH ITEMS
STRONG CASH generated from operations
R707mup 41%
Resilient CUSTOMER BASE
PositiveEBITDA of
R72m 72% HEPSimprovement
(fromR1.4bn loss)
iOCOREVENUE STABILISED
Corec.96%of CASH GENERATEDin H2 2020

FINANCIAL OVERVIEWMegan PydigaduGroup CFO

35%23% 27% 25%
HIGHLIGHTS
Continuing
Discontinued
65%
946
CASH*(R’m)
11 277
REVENUE(R’m)
77%8 690
2 469
GP(R’m)
GP MARGINUp from 20% to 22%Medium term target
mid 20%
73%1 796
827
203
625
NORMALISEDEBITDA (R’m)
EBITDA MARGINUp 4% from 4% to 8% Medium term target >
10%
75%
3292 586 673
618
18*Cash includes R87m of restricted cashNormalised EBITDA refers to core normalised EBITDA after once-off cost savings as a result of COVID-19

2020 PRIORITIES
1DELEVERAGEBALANCE SHEET FURTHER
2IMPROVED SYSTEMS, FINANCIAL DISCIPLINE & CONTROLS
3WORKING CAPITAL MANAGEMENT
4FIT FOR PURPOSECOST STRUCTURE
Additional R292mpaid toward debt in FY2020
VFA liabilitiesdecreased from
R303m to R44m
Cognos controller live for consolidation
IFRS 16 model
Combined assurance plan in flight
IDU system for budgeting & forecasting
New ERP process in flight
Automated attestation process on Nuvotec platform
Inventory Balancesreduced by
R138m
Net Working Capitalimproved by
R337m to R176mfor FY2020
c.R74m realized fromproperty optimization
Permanent headcountsreduced
Reduction in printingand connectivity costs
Reduction in consulting,travel and marketing costs
Reduction of once-off costs
19

CDMPLATFORM
To automatethe generation of financial statements and notes
BU & LEGALSTRUCTURE RATIONALISATION
To reduce costsand improve transparency
ATTESTATIONPROCESS
To embed a culture of accountability and oversight
IMPROVED SYSTEMS, FINANCIAL DISCIPLINE AND CONTROLS
REPLACEERP SYSTEM
With a fit-for purpose system that will enable both the finance control framework and efficiency
FINANCECONTROL FRAMEWORK
To define and govern the control environment, activities, monitoring, communication and risk assessment of financial reporting processes
CASHPOOLING
To ensure oversight and transparency of cash management
COMBINEDASSURANCE MODEL
To embed an objective monitoring and risk assessment of the control environment and activities
20

INCOME STATEMENT
R’mFY 2020 FY 2020 FY 2020 FY 2019 FY 2019 FY 2019
Audited Continuing Discontinued Restated Audited Continuing Discontinued
Revenue 11,277 8,690 2,586 14,949 10,746 4,203
Gross Profit 2,469 1,796 673 2,931 1,767 1,164
Net financial asset impairment losses (332) (321) (12) (979) (606) (372)
Operating expenses (3,403) (2,418) (986) (6,214) (4,861) (1,353)
Operating (loss)/ profit (1,267) (942) (325) (4,261) (3,700) (561)
Net finance costs (418) (411) (7) (340) (334) (6)
Other Income 40 27 13 40 25 15
Share of equity-accounted loss 9 (1) 10 (21) (8) (13)
Taxation 8 64 (56) (365) (208) (157)
Loss for the period (1,627) (1,262) (364) (4,947) (4,225) (721)
Gross margin 22% 21% 26% 20% 16% 28%
Operating margin (11%) (11%) (13%) (28%) (34%) (13%)
HEPS – Continuing (cents) (505) (464) (1,751) (1,504)
21

GROSS REVENUE & EBITDA
22Normalised EBITDA refers to core normalised EBITDA after once-off cost savings as a result of COVID-19
1 543
2 030
460267
1 524
587289
3 376
1 201
120339
181 310
(315)
4167
Digital Industries and C&A
Technology CorporateDigital M&O and NS (incl PS MS)
Advisory and Solutions
(23)33
Cornastone & Mthombo
HQaaS
74
Nextec IP
0
Revenue
Normalised EBITDA
8%MARGIN
17%MARGIN
7%MARGIN
25%MARGIN
12%MARGIN
7%MARGIN
-8%MARGIN
2%MARGIN
26%MARGIN

7% 7%
83% 81%
10% 11%
GROSS REVENUE
PRODUCT MIX
2%1%
PUBLIC SECTOR BREAKDOWN
23%17%
37%44%
39% 39%
0% 0%
FY2019
Public Sector
Private Sector
82% 79%
18% 21%
BY SECTOR
FY2020
Central Government
SOEs
Legislatures
Local Government
FY2020FY2019
23
1 481 1 201
4 1113 376
7 246
6 700
2 111
14 949
11 277 -12%
-18%
BY DIVISION (R’m)
FY2020FY2019
Hardware
Software
Other
Services
Sold entities
NEXTEC
IP
iOCO
FY2019 FY2020
-12%
-18%

ANALYSIS OF REVENUER725m lost to COVID-19, with a sharp recovery expected
14 949
2 111
475
11 277
368
Sold entitiesNEXTEC
182
239
175
iOCOFY2019 IP Pia Solar Hardware sales
122
Other FY2020
COVID-19 Impact
(R725m)

2 1541 119
131
H1’20
2 284
H2’20
-1 165
FIT FOR PURPOSE COST STRUCTURE
2 476 2 358
557 838
2 419
565
6 214
3 403
-5%
45%
FY2020FY2019
Non-core business lines OPEX
Normalised OPEX
Once offs
Non-cash OPEX
Sold Entities
-41%
Total OPEX
Sold Entities
-48%
25Note: Opex includes continuing and discontinued operations

142
28
38
12
61
27
16
15
PROPERTY SAVINGS/ OPTIMIZATIONSavings realized from property optimsation
Exits FY19Property Portfolio 2018
Exits FY20
3
Disposals Property sales
R74m rent expense savings to date
R10m additional annual savings
Property Portfolio 2023
Property Portfolio 2020
Exits FY22Exits FY21 Exits FY23
3
26

SIMPLIFIED LEGAL STRUCTURERationalization of BU and legal entity structure
272
18
76
Majority stake sold
Deregistered*August 2018 number of companies
5
Sale processes concluded
173
34
15
29
39
47
Sale processes underway
Dormant entity deregistrations*
Mthombo cleanup
July 2020 number of companies
January 2022: Phase 3
Targeted number of companies
9
99 reductions in legal entities
27
Phase 3 cleanup

10 279
7 333
1 228
805
476308
11 423
10 279
Jul-18 Jul-19 Jul-20
129
LiquidationsBusiness as usual
Contractors not renewed
RetrenchmentsSold businesses
Structural
(2 817)
HEADCOUNTReduction of almost 3000 in headcount
28

NORMALISED EBITDAContinuous improvement between H1 and H2
(991)776
562
Operating Loss
(276)
EBITDAEBITDA adjustments
+72%
-28%
271405
349(214)
286
(89)225
422
233% -125%
-17% +4%
H1
H2
Once-off costs Non-core businesses to close Normalised EBITDA
R’m
29Normalised EBITDA refers to core normalised EBITDA after once-off cost savings as a result of COVID-19

NON-CORE BUSINESS LINES
Legacy Public Sector
Pia Solar
R45mBond outstanding
8onerouscontracts
5 closed
1 council approval
1 in Arbitration
1 runs out in April
R25m
Netoutflow of
expected
LegacyEPC
R20m
Autospec netoutflow of
expected R2.5m
Netoutflow of
expected
30
Projectsubstantiallycompleted

BALANCE SHEET

67%
BALANCE SHEETAssets
32
R413mIn impairments
GOODWILL
R367mright of use IFRS 16 asset capitalized
PPE
76%
24%
R’000FY 2020 FY 2019
Audited Restated Audited
Non-current Assets
Property, plant, equipment and right-of-use assets 544,846 481,674
Intangible assets 112,967 488,974
Goodwill 916,743 1,850,854
Equity-accounted investments 6,689 228,067
Other financial assets 60,881 11,610
Deferred taxation 200,972 245,278
Finance lease receivables 55,120 106,775
1,898,218 3,413,232
Current AssetsInventory 113,754 251,456
Other financial assets 137,109 76,718
Finance lease receivables 67,720 72,638
Current taxation receivable 53,940 52,916
Trade and other receivables 2,116,576 3,353,971
Cash and cash equivalents 645,837 1,048,583
3,134,936 4,856,282
Assets held for sale 2,152,366 1,765,016
Total Assets 7,185,520 10,034,530

BALANCE SHEETEquity & Liabilities
33
Borrowingclassified as
current due torefinancing on1 April 2021
PROVISIONS
PAYE246
249OnerousProvisions
Other2
173Over-invoicing
R’000FY 2020 FY 2019
Audited Restated Audited
Equity
Stated capital 4,250,219 4,239,621
Shares to be issued to vendors 15,300 20,257
Other reserves 924,862 742,597
Retained earnings (4,680,506) (3,077,996)
Equity attributable to the owners of EOH Holdings Limited 509,875 1,924,479
Non-controlling interest 29,624 40,621
539,499 1,965,100
LiabilitiesNon-current liabilities
Other financial liabilities 5,674 2,255,825
Lease liabilities 171,699 28,030
Deferred taxation 111,291 305,917
288,664 2,589,772Current liabilities
Other financial liabilities 2,748,028 1,068,132
Current taxation payable 49,329 97,988
Lease liabilities 104,723 29,331
Trade and other payables 1,951,060 3,303,241
Provisions 670,125 410,428
5,523,265 4,909,119
Liabilities directly associated with the assets held for sale 834,092 570,539
Total liabilities 6,646,021 8,069,430
Total equity and liabilities 7,185,520 10,034,530

STRONG DELEVERAGING PERFORMANCER’m
Debt
Liabilities for acquisitions
1 997

WORKING CAPITAL MANAGEMENT90% reduction in net working capital since H2’18
378 287 287
4 733
3 879 4 074
3 329
2 640
-3 562 -3 475 -3 848
-3 174 -2 602
1 549
204
H2’18*
690359
H1’19*
513
H2’19 H1’20
176
H2’20
35
*Un-restated.As presented in Financials
Gross Receivables
Working Capital
Inventory
Payables
137
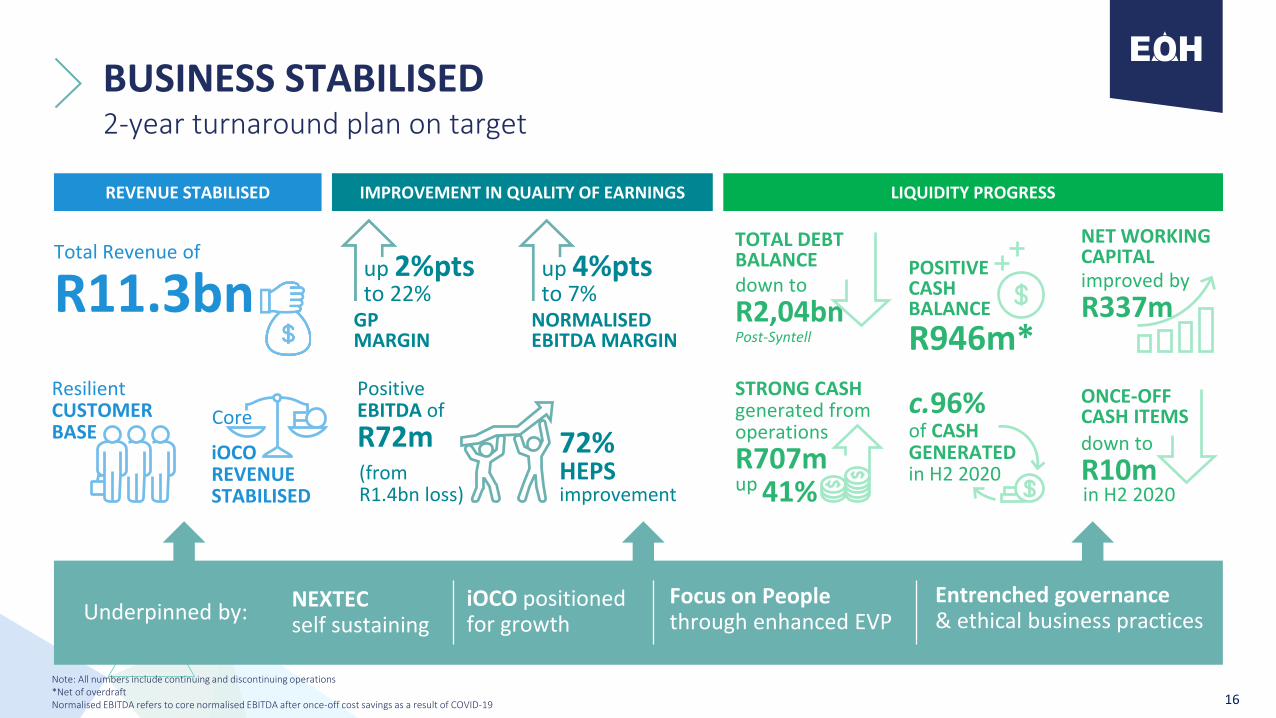
LIQUIDITY MANAGEMENT SOUNDSignificant initiatives to secure sustainability
CashManagement
Liquidity forecasting & weekly management implemented in prior year
Cash management system implemented in current year
Allows for reduced carry costs on working capital lines
Enables cash to be available where the company requires it
More than 75% of all group available cash managed
HeadroomFacilities
Cash management has improved accessto headroom facilities
Cash balances remain strong and until deleveraging completed a part of working capital lines
ContingentLiabilities
R353m of guarantees issued
Limited issuanceof corporate guarantees
3636

1 359
443
151
821
363
211
296
396
115
77
Net finance costs
Opening cash balance
7 5
Forex movements
946
12
Other Closing cash balance
54
Disposal & advisory
related costs
Debt repayments
including VFAs
Staffone-offs
Taxationpaid
Net capital expenditure
Operational cash flows
Saleproceeds
OEM Settlements
Otherone-offs
R247m (R692m) (R248m)
37
FY2020 CASH FLOW BRIDGESignificantly lower one-off payments and stronger operational cashflow
Note: Operational cashflow impacted by working capital swings
Sources offunding
Business as usual
Debt cashflows
One offs
R292m
R87mrestricted
cash
Cash gonewith sales or liquidations
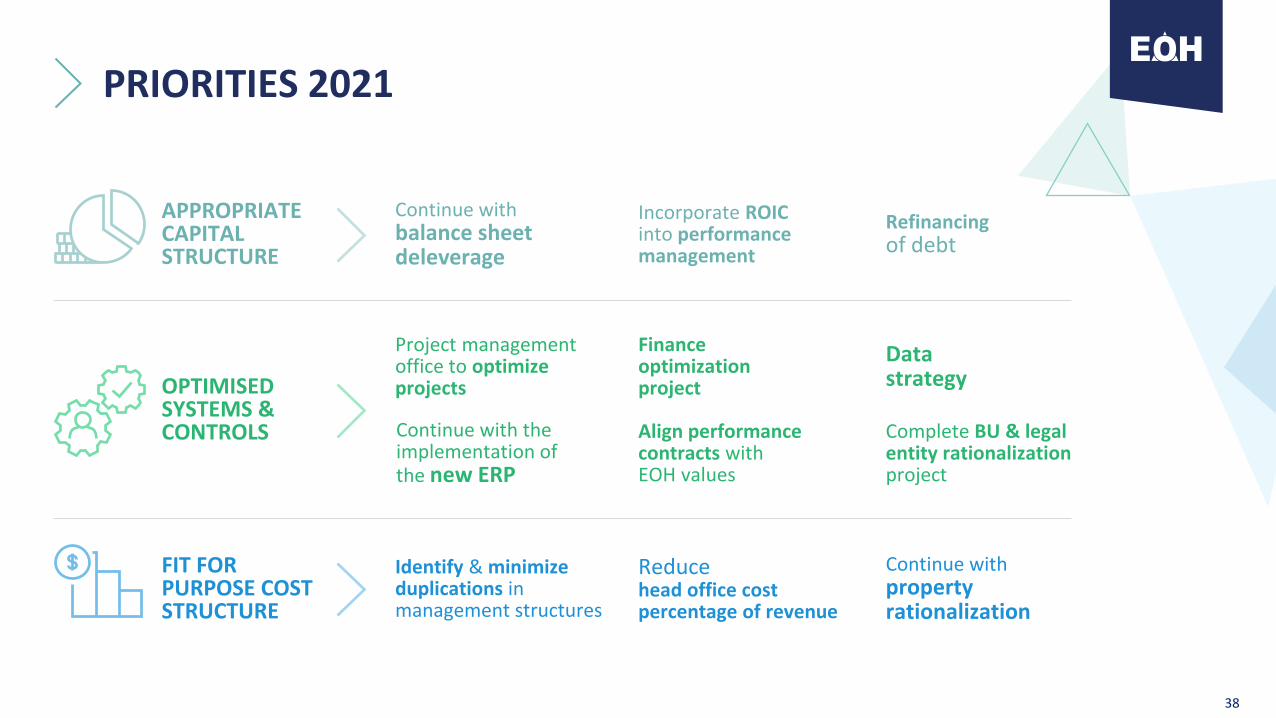
PRIORITIES 2021
Incorporate ROICinto performance management
Financeoptimizationproject
Reducehead office cost percentage of revenue
OPTIMISED SYSTEMS &CONTROLS
APPROPRIATE CAPITAL STRUCTURE
FIT FOR PURPOSE COST STRUCTURE
Continue withbalance sheet deleverage
Identify & minimize duplications in management structures
Refinancingof debt
Datastrategy
Project management office to optimize projects
Continue with the implementation of the new ERP
Complete BU & legal entity rationalization project
Align performance contracts withEOH values
Continue with property rationalization
38

DOWNSIDE RISKS CONTAINED
PWC audit completed1
Legacy public sectorcontracts largely resolved2
NEXTEC stabilized3
SARS4
SIU settlement5
Building platformfor future growth
39

BUSINESS STABILISED
Revenuestabilised
Cashgenerative
EBITDA improvement
Debt reduced

LOOKING FORWARDStephen van CollerGroup CEO

42
THE EOH VALUE PROPOSITION
Technology
Digital
CUSTOMER CENTRIC
Advisory& Consulting
ServicesPeople
OutsourcingSolutions
IntelligentInfrastructure
Solutions
42

STRATEGIC PARTNERSHIPS UNDERPIN STABILITYProvide robust platform for future growth
GO-TO PARTNERfor international OEMs
RENEWED major partnership deals:
43
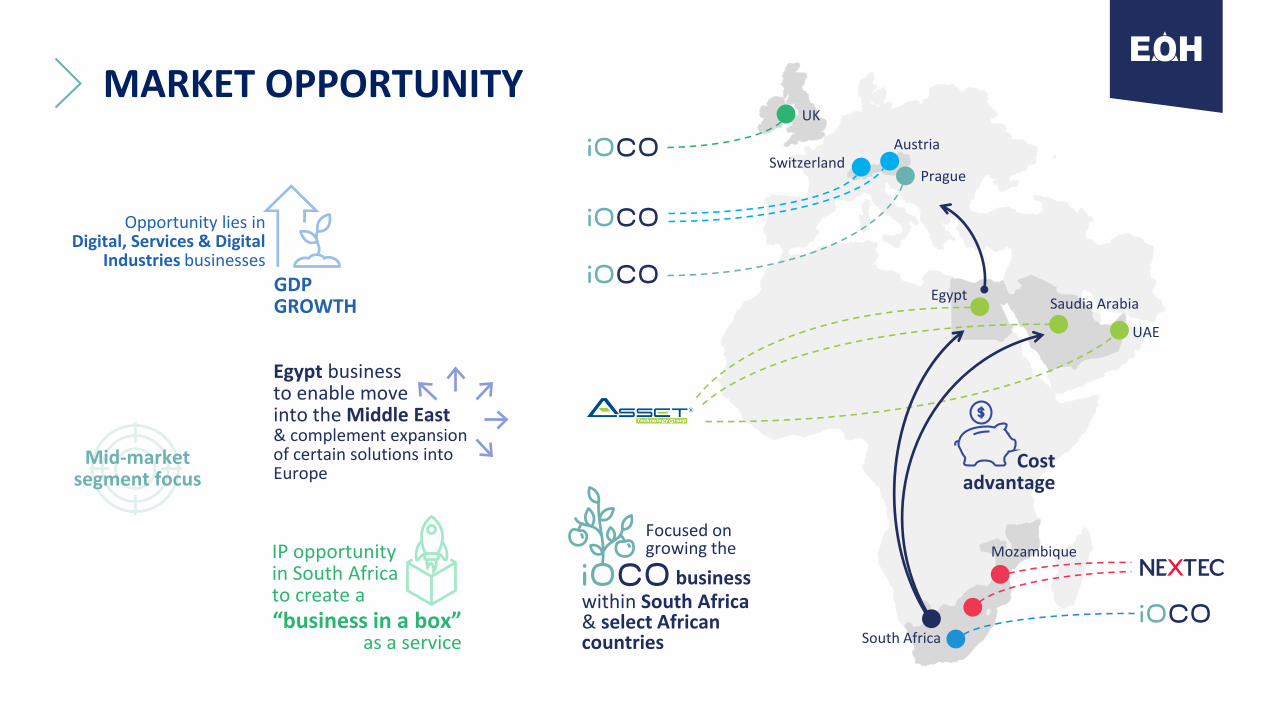
Cost advantage
UK
SwitzerlandAustria
Prague
EgyptSaudia Arabia
UAE
South Africa
Mozambique
MARKET OPPORTUNITY
Opportunity lies inDigital, Services & Digital
Industries businesses
GDP GROWTH
Egypt businessto enable moveinto the Middle East & complement expansionof certain solutions into Europe
IP opportunityin South Africato create a“business in a box”
as a service
Mid-market segment focus
within South Africa & select African countries
Focused on growing the
business

THANK YOU

1 359
826
181126
263186
171
166
100
115
66
Cash gonewith sales or liquidations
46
APPENDIX 1H1:2020 CASH FLOW BRIDGELarge one-off payments and large tax payments, weaker operational cashflow
Note: Operational cashflow impacted by working capital swings
Sources of funding
Business as usual
Net capital expenditure
Debt repayments
including VFAs
Operational cash flows
Opening cash
balance
Net finance
costs
Disposal & advisory
related costs
Saleproceeds
Taxationpaid
Forex movements
OEM settlements
391
Staffone-offs
7
Otherone-offs
R55m (R94m) (R266m) (R229m)
Debt cashflows
One-offs
Closing cash balance

APPENDIX 2H2:2020 CASH FLOW BRIDGESignificantly lower one-off payments and stronger operational cashflow
47Note: Operational cashflow impacted by working capital swings
R341m (R426m)
Sources offunding
Business as usual
Debt cashflows
One-offs
R237m
Closing cash balance
Cash gonewith sales or liquidations
826
262
558
177
130
296
946
OtherNet finance costs
Opening cash balance
Staffone-offs
Disposal & advisory
related costs
0
Otherone-offs
6 1211
OEM settlements
0
Forex movements
Debt repayments
including VFAs
Operational cash flows
Net capital expenditure
40
25
Taxationpaid
Saleproceeds
15
(R20m)