Embed Size (px)
Citation preview

FY 2017 Results Presentation
27 April 2018

Disclaimer
This confidential presentation (“Presentation”) has been prepared by Forise International Limited (“Forise”) for discussion with selectedrecipients only. This Presentation is for information purposes and shall not be construed as an offer to sell or a solicitation for thesubscription or purchase of interests, or as an invitation, inducement or intermediation for the sale, subscription or purchase of interests,or form the basis of any decision to subscribe for or purchase any interests in Forise or any of its affiliates, or for engaging in any othertransaction. While reasonable care has been taken to prepare this document, the information contained herein may not be relied uponfor accuracy or completeness; and any opinion or estimate contained in this document is subject to change without notice.
This Presentation is solely for information purposes only and is not intended for anyone other than the recipients. It may not bepublished, circulated, reproduced or distributed, in whole or part, to any other person without the prior consent from Forise. Theinformation contained in this Presentation is proprietary and confidential to Forise and may not be disclosed to third parties orduplicated or used for any purpose other than the purpose for which it has been provided. Any unauthorized use, duplication ordisclosure of this Presentation is prohibited by law. If, at any time, such transmission, reproduction or disclosure is made, and Forise,and/or any affiliates, suffers any loss, damage, liability of any kind whatsoever arising out of, or in connection with, any suchtransmission, reproduction or disclosure, the recipient agrees to hold harmless and indemnify Forise and/or affiliates from and againstany such loss, damage or liability.
Forise or its affiliates may have acted upon or have made use of material in this document prior to its publication. If you have any doubtabout any of the contents of this publication, you should obtain independent professional advice.
2

Table of Contents
Introduction Business Update Financial Review Growth Plans Conclusion
Corporate Overview
Group Structure
Financial Highlights
Discontinued Operations
New Business Platforms
Management Team
Financial Performance
Financial Position
Key Financial Indicators
Market Outlook
Business Model
Growth Strategy
Corporate Vision
Contact Details
Q & A
3

1 Introduction
4

Introduction Business Update Financial Review Growth Plans Conclusion
Corporate Overview
5
Exchange Listing Mainboard of the SGX-ST on 25 Sep 2009
Exchange Code I5H
Market Capitalization (SGD) 12,780,000
Share Price (SGD) 0.006 (Closing price on 25 April 2018)
Issued & Paid-Up Shares 2,130,000,000
PE Ratio (SGD) 40.00
Trailing EPS (SGD) 0.00015
NAV per Share (SGD) 0.0043
Source: Shareinvestor, 25 April 2018

Introduction Business Update Financial Review Growth Plans Conclusion
Corporate Overview
Forise International Limited is a SGX-listed company and provides a comprehensive range of corporate
advisory services to fund and investment managers, SMEs, and high net-worth individuals.
6
Fund Managers &
Investment Managers
Small Medium Enterprises &
High Net-Worth Individuals
▪ Advisory services relating to various corporate actions
▪ Business consulting services for fund management
▪ Investment management and due diligence services
▪ Advisory services to optimize idle capital deployment
▪ Advisory services on debt and equity financing
▪ Commercial factoring services for financing flexibility
Mergers & Acquisitions
Pre-IPO financing
Mezzanine Financing
Private Equity
Investment Portfolio Planning
Investment Target Recommendation
Investment Target Due Diligence
Fund Initiation & Operations
Corporate Reorganisations
Recapitalizations
Debt Restructuring & Informal Work-Outs
Formal Insolvency Procedures
Financial Management
Investment Consulting
Operations & Processes
Business Intelligence
Strategic Analysis & Evaluation
Strategic Design & Implementation
Market, Competitive & Industry Analyses
Continuous Management and Review
Domestic Factoring
International Factoring
Recourse Factoring
Non-Recourse Factoring
Management ConsultingFinancial Restructuring Commercial FactoringStrategic PlanningAsset ManagementCorporate Advisory
Our Clients
Our Solutions
Introduction Business Update Financial Review Growth Plans Conclusion
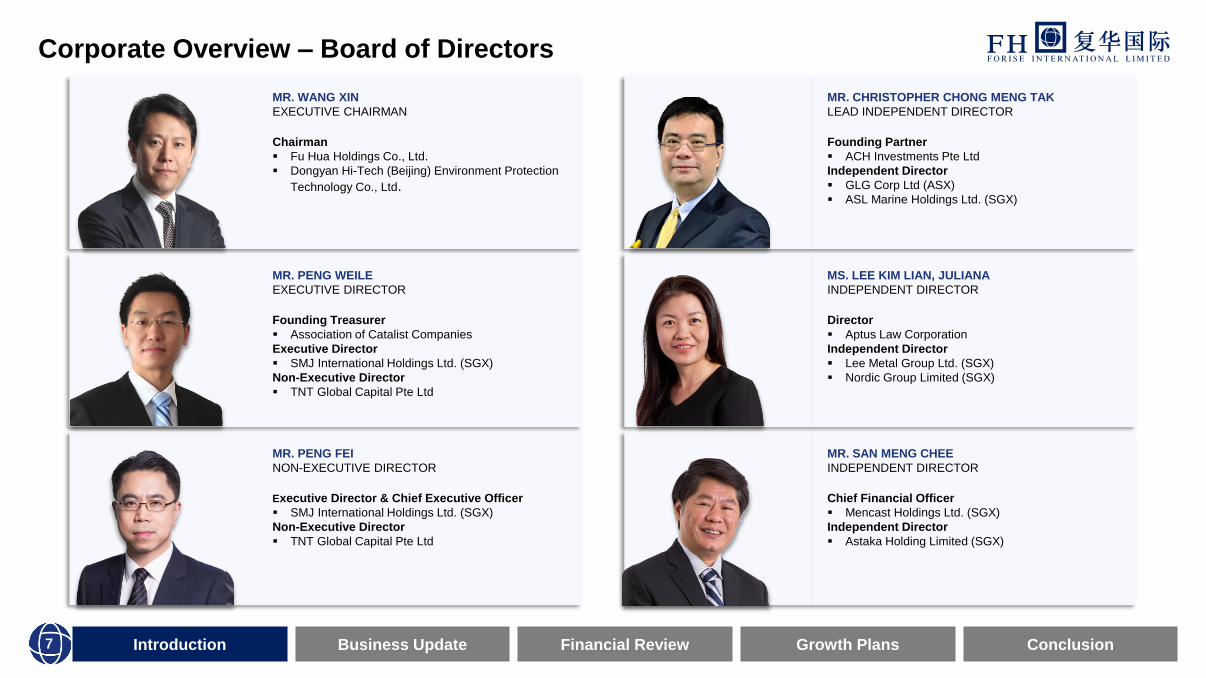
Corporate Overview – Board of Directors
7
MR. WANG XIN
EXECUTIVE CHAIRMAN
Chairman
▪ Fu Hua Holdings Co., Ltd.
▪ Dongyan Hi-Tech (Beijing) Environment Protection
Technology Co., Ltd.
MR. CHRISTOPHER CHONG MENG TAK
LEAD INDEPENDENT DIRECTOR
Founding Partner
▪ ACH Investments Pte Ltd
Independent Director
▪ GLG Corp Ltd (ASX)
▪ ASL Marine Holdings Ltd. (SGX)
MR. PENG WEILE
EXECUTIVE DIRECTOR
Founding Treasurer
▪ Association of Catalist Companies
Executive Director
▪ SMJ International Holdings Ltd. (SGX)
Non-Executive Director
▪ TNT Global Capital Pte Ltd
MS. LEE KIM LIAN, JULIANA
INDEPENDENT DIRECTOR
Director
▪ Aptus Law Corporation
Independent Director
▪ Lee Metal Group Ltd. (SGX)
▪ Nordic Group Limited (SGX)
MR. PENG FEI
NON-EXECUTIVE DIRECTOR
Executive Director & Chief Executive Officer
▪ SMJ International Holdings Ltd. (SGX)
Non-Executive Director
▪ TNT Global Capital Pte Ltd
MR. SAN MENG CHEE
INDEPENDENT DIRECTOR
Chief Financial Officer
▪ Mencast Holdings Ltd. (SGX)
Independent Director
▪ Astaka Holding Limited (SGX)

Introduction Business Update Financial Review Growth Plans Conclusion
Group Structure
8
Forise
International
Limited
Incorporated in Singapore
100%
Great
Holding
Limited
Incorporated in Hong Kong
100%
Forise
Management
Limited
Incorporated in Hong Kong
100%
Forise
Capital Management
Company Limited
Incorporated in the BVI
40%
TNT
Global Capital
Pte Ltd
Incorporated in Singapore
100%
Tianjin Forise
Corporation Management
Consultancy Limited
Incorporated in China
100%
Forise
Global Strategy
Investment SPC
Incorporated in the Cayman Islands
100%
Great
Fashion Trading
(Shanghai) Limited
Incorporated in China
100%
Great
Brand Management
Limited
Incorporated in the BVI
100%
天津复有新茂企业管理咨询
有限公司Incorporated in China
40%
Le Rong
Financial Factoring
Company Limited
Incorporated in China
100%
Tianjin Forise
Corporation Management
Consultancy Limited
Beijing Branch
Introduction Business Update Financial Review Growth Plans Conclusion
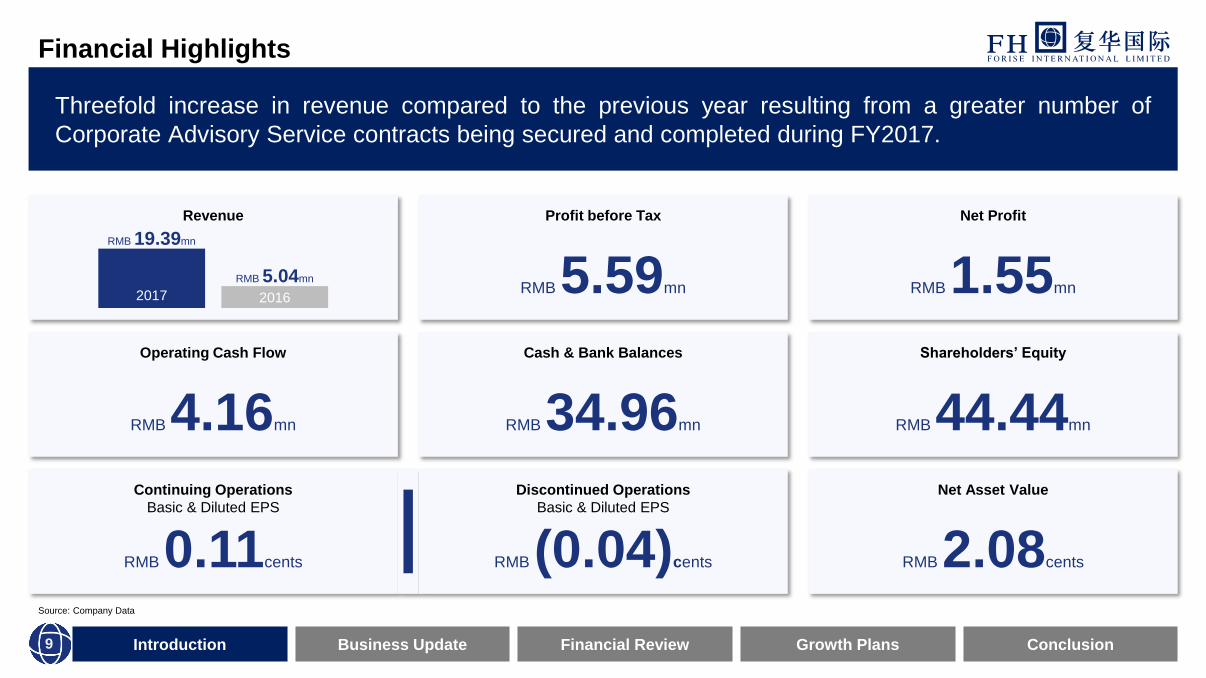
Financial Highlights
Threefold increase in revenue compared to the previous year resulting from a greater number of
Corporate Advisory Service contracts being secured and completed during FY2017.
9
Revenue Profit before Tax
RMB 5.59mn
Net Profit
RMB 1.55mn
Operating Cash Flow
RMB 4.16mn
Cash & Bank Balances
RMB 34.96mn
Shareholders’ Equity
RMB 44.44mn
Continuing Operations
Basic & Diluted EPS
RMB 0.11cents
Discontinued Operations
Basic & Diluted EPS
RMB (0.04)cents
Net Asset Value
RMB 2.08cents
2017 2016
RMB 19.39mn
RMB 5.04mn
Source: Company Data

2 Business
Update
10

Introduction Business Update Financial Review Growth Plans Conclusion
Significant Developments
The Group has been focusing on the development and growth of its strategic planning, corporate
advisory, financial restructuring and management consultancy services.
11
Ongoing Strategy
Met all exit criteria for removal
from the Financial Watch-list
Broaden the Group’s
revenue stream
Actively seek opportunities
to capture performance
and growth synergies
Major Developments
Successful exit from the Financial
Watch-list of the SGX-ST
Threefold increase of
the Group’s revenue
Recently established
Asset Management Platform
Objectives & Goals
Removal from the Financial
Watch-list of the SGX-ST
Deliver greater value
to Shareholders
Expand and enhance
Group’s performance
and net asset value
Introduction Business Update Financial Review Growth Plans Conclusion
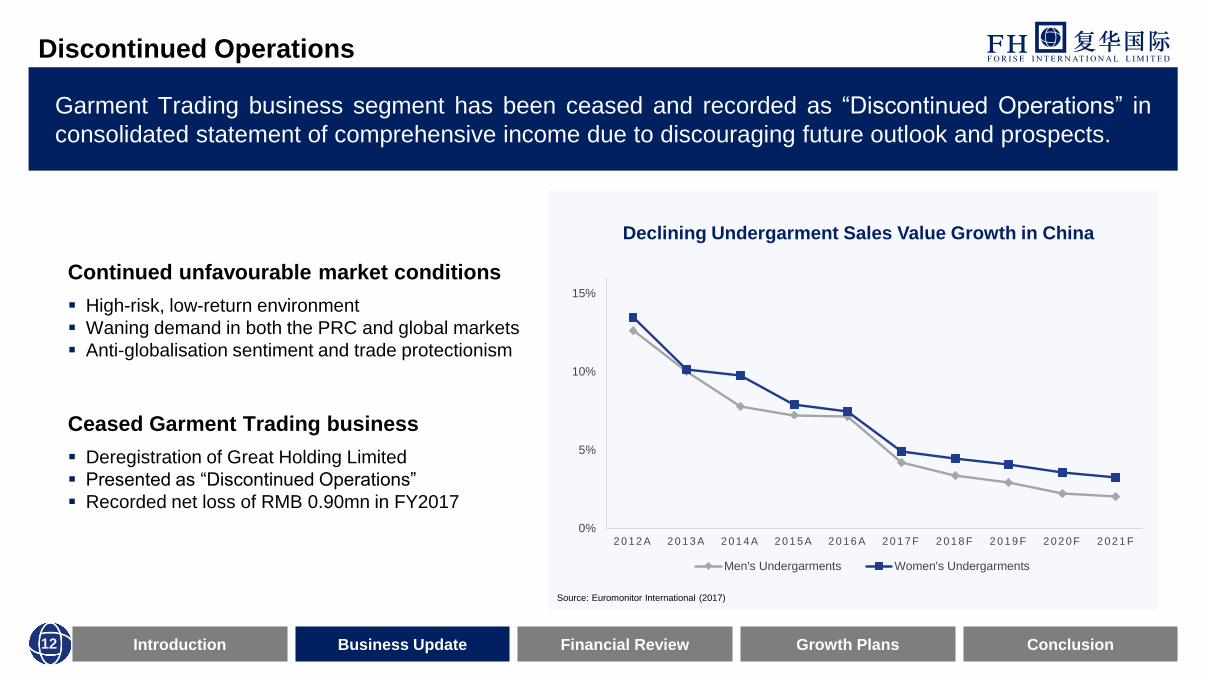
Discontinued Operations
Garment Trading business segment has been ceased and recorded as “Discontinued Operations” in
consolidated statement of comprehensive income due to discouraging future outlook and prospects.
12
0%
5%
10%
15%
2 0 1 2 A 2 0 1 3 A 2 0 1 4 A 2 0 1 5 A 2 0 1 6 A 2 0 1 7 F 2 0 1 8 F 2 0 1 9 F 2 0 2 0 F 2 0 2 1 F
Men's Undergarments Women's Undergarments
Declining Undergarment Sales Value Growth in China
Continued unfavourable market conditions
▪ High-risk, low-return environment
▪ Waning demand in both the PRC and global markets
▪ Anti-globalisation sentiment and trade protectionism
Ceased Garment Trading business
▪ Deregistration of Great Holding Limited
▪ Presented as “Discontinued Operations”
▪ Recorded net loss of RMB 0.90mn in FY2017
Source: Euromonitor International (2017)
Introduction Business Update Financial Review Growth Plans Conclusion
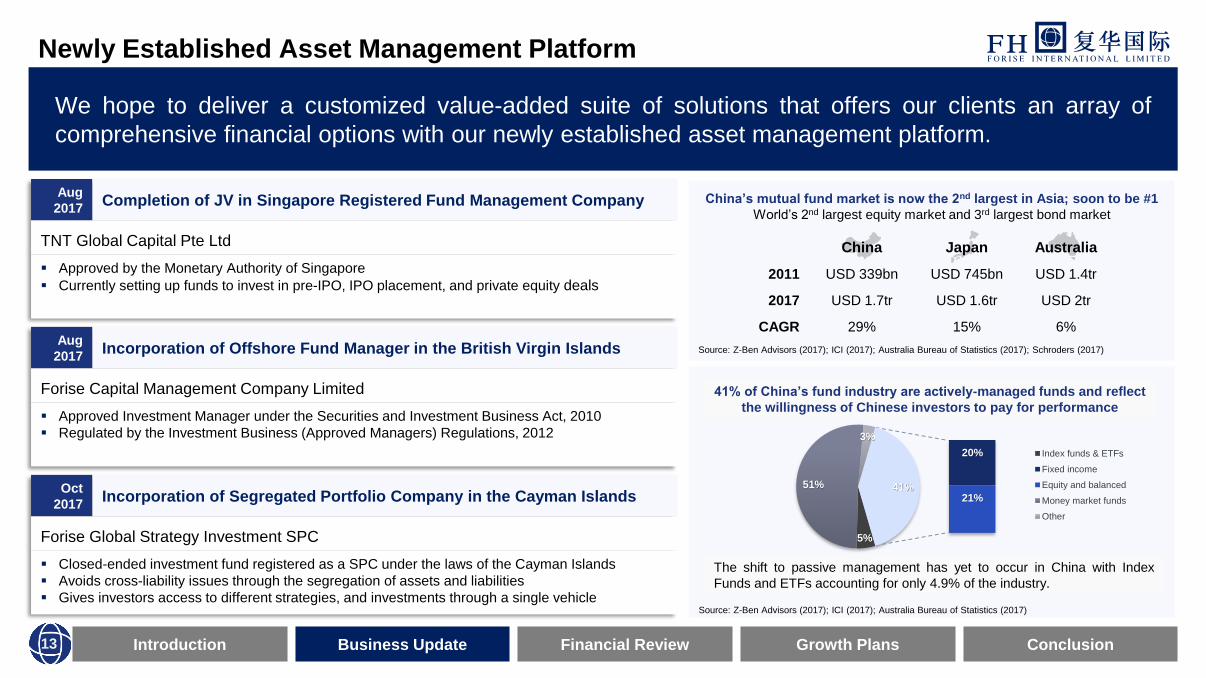
Newly Established Asset Management Platform
We hope to deliver a customized value-added suite of solutions that offers our clients an array of
comprehensive financial options with our newly established asset management platform.
13
Aug
2017Completion of JV in Singapore Registered Fund Management Company
TNT Global Capital Pte Ltd
▪ Approved by the Monetary Authority of Singapore
▪ Currently setting up funds to invest in pre-IPO, IPO placement, and private equity deals
Aug
2017Incorporation of Offshore Fund Manager in the British Virgin Islands
Forise Capital Management Company Limited
▪ Approved Investment Manager under the Securities and Investment Business Act, 2010
▪ Regulated by the Investment Business (Approved Managers) Regulations, 2012
Oct
2017Incorporation of Segregated Portfolio Company in the Cayman Islands
Forise Global Strategy Investment SPC
▪ Closed-ended investment fund registered as a SPC under the laws of the Cayman Islands
▪ Avoids cross-liability issues through the segregation of assets and liabilities
▪ Gives investors access to different strategies, and investments through a single vehicle
5%
20%
21%
51%
3%
41%
Index funds & ETFs
Fixed income
Equity and balanced
Money market funds
Other
41% of China’s fund industry are actively-managed funds and reflect
the willingness of Chinese investors to pay for performance
The shift to passive management has yet to occur in China with Index
Funds and ETFs accounting for only 4.9% of the industry.
China Japan Australia
2011 USD 339bn USD 745bn USD 1.4tr
2017 USD 1.7tr USD 1.6tr USD 2tr
CAGR 29% 15% 6%
China’s mutual fund market is now the 2nd largest in Asia; soon to be #1
World’s 2nd largest equity market and 3rd largest bond market
Source: Z-Ben Advisors (2017); ICI (2017); Australia Bureau of Statistics (2017); Schroders (2017)
Source: Z-Ben Advisors (2017); ICI (2017); Australia Bureau of Statistics (2017)
Introduction Business Update Financial Review Growth Plans Conclusion
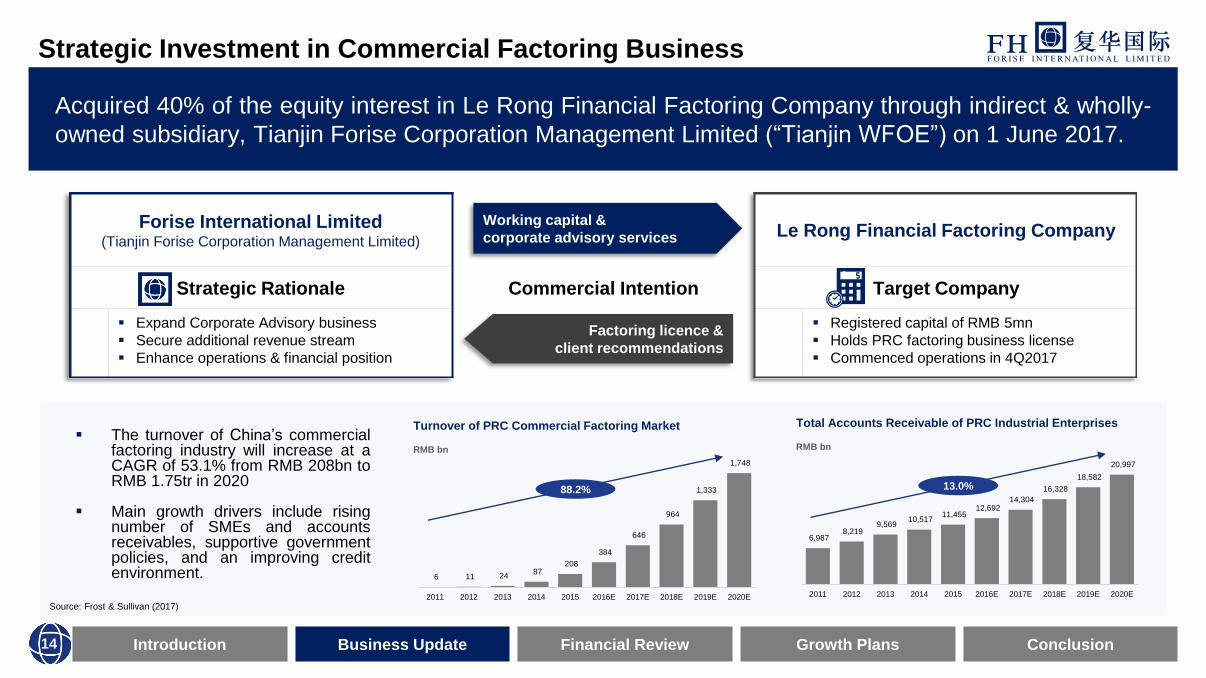
Strategic Investment in Commercial Factoring Business
Acquired 40% of the equity interest in Le Rong Financial Factoring Company through indirect & wholly-
owned subsidiary, Tianjin Forise Corporation Management Limited (“Tianjin WFOE”) on 1 June 2017.
14
Forise International Limited(Tianjin Forise Corporation Management Limited)
Le Rong Financial Factoring Company
Strategic Rationale Commercial Intention Target Company
▪ Expand Corporate Advisory business
▪ Secure additional revenue stream
▪ Enhance operations & financial position
▪ Registered capital of RMB 5mn
▪ Holds PRC factoring business license
▪ Commenced operations in 4Q2017
Total Accounts Receivable of PRC Industrial Enterprises
RMB bn
6,987 8,219
9,569 10,517
11,455 12,692
14,304
16,328
18,582
20,997
2011 2012 2013 2014 2015 2016E 2017E 2018E 2019E 2020E
13.0%
Turnover of PRC Commercial Factoring Market
RMB bn
6 11 24 87
208
384
646
964
1,333
1,748
2011 2012 2013 2014 2015 2016E 2017E 2018E 2019E 2020E
88.2%
Working capital &
corporate advisory services
Factoring licence &
client recommendations
▪ The turnover of China’s commercialfactoring industry will increase at aCAGR of 53.1% from RMB 208bn toRMB 1.75tr in 2020
▪ Main growth drivers include risingnumber of SMEs and accountsreceivables, supportive governmentpolicies, and an improving creditenvironment.
Source: Frost & Sullivan (2017)

Introduction Business Update Financial Review Growth Plans Conclusion
Management Team & Consultant with Decades of Experience at Renowned MNCs
15
Mr. Wang XinExecutive Chairman
Forise International Limited
▪ Chairman, Fu Hua Holdings Co., Ltd.
▪ Chairman, Dongyan Hi-Tech (Beijing) Environment Protection
Technology Co., Ltd.
Mr. Peng Fei (George)Non-Executive Director &
Consultant
Forise International Limited
▪ Executive Director & CEO, SMJ International Holdings Ltd.
▪ Non-Executive Director, TNT Global Capital Pte Ltd
▪ Former President, Reignwood International Investment Ltd
▪ Former Vice President, Chinalco Overseas Ltd
Mr. Peng Weile (Leo)Executive Director
Forise International Limited
▪ Non-Executive Director, TNT Global Capital Pte Ltd
▪ Executive Director, SMJ International Holdings Ltd.
▪ Founding Treasurer, Association of Catalist Companies
▪ Former Executive Director, Beijing Weihao Investment Ltd
Mr. Ng Wee ChengExecutive Director
TNT Global Capital Pte Ltd
▪ Former Executive Director & Founder, Genesis Capital Pte Ltd
▪ Former Vice President, ICBC Singapore Investment Banking
▪ Previously from OCBC Corporate Finance
Ms. Toh Shih HuaExecutive Director
TNT Global Capital Pte Ltd
▪ Former Executive Director & Founder, Genesis Capital Pte Ltd
▪ Former Vice President, ICBC Singapore Investment Banking
▪ Previously from OCBC Corporate Finance
Mr. Cheong Yee YangFinancial Controller
Forise International Limited
▪ Former Audit Manager, Nexia TS PAC
▪ Former Audit Manager/Auditor, PricewaterhouseCoopers LLP
In-Depth & Diverse
Industry Knowledge
▪ Capital Markets
▪ Investment Management
▪ Asset Management
▪ Corporate Advisory
▪ Business Development
▪ Strategic Planning
▪ Financial Restructuring
Extensive Network of
Contacts & Resources▪ Business Partners
▪ Financial Institutions
▪ Asset Managers
▪ Fund Managers
▪ High Net Worth Individuals

3 Financial
Review
16

Introduction Business Update Financial Review Growth Plans Conclusion
Revenue
RMB mn
Revenue by Client Segment
RMB mn
Earnings before Interest & Taxes
RMB mn
Net Income
RMB mn
Financial Performance of Corporate Advisory Services
17
Source: Company Data
4.76 3.04 5.36 6.23
5.04
19.39
1Q17 2Q17 3Q17 4Q17 FY16 FY17
1.14 0.75
0.33 0.25
252.84
2.47
1Q17 2Q17 3Q17 4Q17 FY16 FY17
Fund & Investment Managers19.28
Small-Medium Enterprises0.11
188.92
290.92
4.72
FY15 FY16 FY17

Introduction Business Update Financial Review Growth Plans Conclusion
Assets
RMB mn
Cash Ratio
Shareholders’ Equity
RMB mn
Total Liabilities
RMB mn
Financial Position of Corporate Advisory Services
18
(132.70)
42.89 44.44
FY15 FY16 FY17
142.68
60.26 44.17
53.15
0.31 5.30
FY15 FY16 FY17
Current Assets Non-Current Assets
0.24
2.20
6.95
FY15 FY16 FY17
328.53
17.67
5.03
FY15 FY16 FY17
Source: Company Data

Introduction Business Update Financial Review Growth Plans Conclusion
Key Financial Indicators
19
Source: Company Data
Financial Performance FY2017 FY2016 FY2015
Continuing Operations EPS (RMB cents) 0.11 11.87 (1.09)
Discontinued Operations EPS (RMB cents) (0.04) 1.72 (18.95)
Return on Assets (%) 0.03 4.78 n.m.
Return on Equity (%) 0.03 6.75 n.m.
Financial Position 31 Dec 2017 31 Dec 2016 31 Dec 2015
Net Asset Value Per Share (RMB) 0.02 0.02 (0.06)
Cash & Cash Equivalents (RMB mn) 34.96 38.86 79.58
Cash Ratio 6.95 2.20 0.24
Current Ratio 8.78 3.41 0.43

4 Growth
Plans
20

Introduction Business Update Financial Review Growth Plans Conclusion
Growth Opportunity in China’s Asset Management Industry
In 2016, China’s wealth management market had assets under management of RMB 100tr. By 2021, awealth management market comprising 4 million high net-worth households with assets of RMB 110tr isprojected to take shape in china.
21
87%86%
86%86%
85%85%
85%85%
84%
12%
12%
12%
12%
12%
12%
12%
13%
13%
2%
2%
2%
2%
3%
3%
3%
3%
3%
39
121
150
186
212
244
277
314
355
400
USD 1-5mn USD 5-20mn >USD 20mn
Number of HNW Households in China
10,000 households
12
4955
6472
7986
93102
110
11
28
36
46
54
63
73
85
97
111
Ordinary Households HNW Households
Total Investable Assets of Households in China
RMB tr
30.87%29.05%
21.40%
20.16%
15.63%
17.27%15.24%
15.57%16.22%
15.07%
0.51%
2.60%
76.1
100.2
Internet firms
Insurance firms
Futures firms
Fund managers
Securities firms
Trusts companies
Banks
AUM of China’s Wealth Management Market
RMB tr
Note: HNW households are those with investable assets of over USD 1 million.
Source: Boston Consulting Group and Industrial Bank of China (2017)Source: Hurun Report, Kungfu Finance, and Meixin Global (2018)

Introduction Business Update Financial Review Growth Plans Conclusion
Growth Opportunity in China’s Asset Management Industry
Independent wealth management companies gaining more market share
22
0%
20%
40%
60%
80%
100%
2009 2011 2013 2015 2017
Independent Wealth Managers Foreign Private Banks State-Owned Banks Joint-Stock Commercial Banks
Trends of Asset Allocation by HNWIs in China
65%
52%
39%
24%
18%
10%
10%
4%
2%
Higher return rate
More diversified products
Customized offerings
Family wealth planning
Non-WM financial services
Overseas financial services
Other value-added services
Poor client experience
Unsatisfactory services
Reasons for HNWIs Choosing Non-Banks in China
Source: Bain & Company and China Merchant Bank (2017) Source: Boston Consulting Group and Industrial Bank of China (2017)

Introduction Business Update Financial Review Growth Plans Conclusion
Other
PE Funds
Family Trust
Private Securities Funds
Public Funds
Insurance
Investment Property
Bonds
Stocks
Deposits/Cash
Growth Opportunity in China’s Asset Management Industry
Chinese HNWIs are increasingly allocating their assets outside China in search of higher returns.
23
19%
33%37%
56%
0%
20%
40%
60%
80%
100%
2011 2013 2015 2017
Overseas Domestic % of HNWIs with Overseas Investments
Percentage of HNWIs with Overseas Asset Allocation from 2011-2017
0%
20%
40%
60%
80%
100%
10-50M 50-100M 100-200M 200-500M >500M Total
Allocation of Total Overseas Investible Assets of Chinese HNWIs in 2017
Source: Bain & Company and China Merchant Bank (2017) Source: Bain & Company and China Merchant Bank (2017)

Introduction Business Update Financial Review Growth Plans Conclusion
Client-Centric Business Model
24
The Group leverages top management’s extensive network and expertise to deliver bespoke and
innovative solutions to enable its clients to achieve their objectives.
Leverage extensive network
of senior management
Deliver highly value-added
& tailored solutions
Grow reputation & cultivate
strong track record
▪ Develop client base for recurring work
▪ Establish business associations and form
strategic partnerships
▪ Build a highly skilled professional team
▪ Comprehensive bespoke financial services
to meet clients’ complex needs
▪ Product mix adapted to macroeconomic
changes and investor risk profiles
▪ Actively seek opportunities to build a
strong track record
▪ Facilitates repeat businesses and
generates new clients and businesses

Introduction Business Update Financial Review Growth Plans Conclusion
Growth Strategy
The Group will capitalize on the opportunities presented in China’s financial services market by developing itscorporate advisory, commercial factoring and asset management businesses via organic growth, mergers &acquisitions, joint ventures, and strategic alliances to enhance shareholder value.
25
Organic
Growth
Mergers &
Acquisitions
Joint Ventures
& Partnerships
▪ Deploy more resources to develop business
and actively seek opportunities to build a
sizeable portfolio that comes with a strong
track record.
▪ Acquire assets, investments and shares or
interests in any entity to reinforce product
range & expertise to achieve cost synergies
and operating efficiencies.
▪ Explore joint ventures and strategic
alliances with third parties to develop
investment capabilities, expertise, and
resources when opportunities arise.
Corporate
Advisory
Asset
Management
Commercial
Factoring
▪ Expand range of product and service
offerings to provide one-stop services to
Chinese clients globally
▪ New services business line for third-party
asset managers and first fund to be launched
in the second half of 2018
▪ Expand market presence by actively
sourcing and allocating resources to
secure more deals and clients

5 Conclusion
26

Introduction Business Update Financial Review Growth Plans Conclusion
We aspire to offer a comprehensive
suite of integrated and highly value-
added Corporate Advisory Solutions
to grow our business and deliver
greater value to our Shareholders.
Corporate Vision
27
CAPITAL
RESOURCES
EXPERIENCED
TEAM
TRACK
RECORD
CLIENT
BASE
BUSINESS NETWORK
REPUTATIONAL
CAPITAL

For further enquiries, please contact us at:
Forise International Limited80 Raffles PlaceUOB Plaza 2 #11-20Singapore 048624Tel: (65) 6532 3008Fax: (65) 6532 3007E-mail: [email protected]