Embed Size (px)
Citation preview

1
Foreign Capital and Economic Growth in the First Era of Globalization*
September 25, 2006
Michael D. Bordo Rutgers University, University of Cambridge, King’s College, and NBER
Christopher M. Meissner
University of Cambridge, King’s College and NBER
Abstract The First Era of Globalization, 1870-1913, was marked by a degree of integration in goods and financial markets comparable to that which prevails today. It also exhibited a large number of financial crises that unfolded in ways very similar to those experienced since the 1970s. In light of skepticism about whether market-based finance is good for development, this paper will reexamine the impact of capital market integration on economic growth during this period. First we will explore whether there are growth benefits from participation in the international capital market. Second we will analyze the side effects of open international capital markets. Between 1880 and 1913 financial crises that accompanied sudden stops meant that any growth advantages to greater inflows of foreign capital were greatly diminished. We then look at several determinants of debt crises and financial crises including the currency composition of debt, debt intolerance and the role of political institutions. We argue that the set of countries that had the worst growth outcomes were those that had currency crises, original sin, poorly developed financial markets and presidential political systems. Those that avoided financial catastrophe generated credible commitments and sound fiscal and financial policies. Such countries succeeded in escaping major financial crises and grew relatively faster despite the potential of facing sudden stops of capital inflows, major current account reversals and currency speculation that accompanied international capital markets free of capital controls.
* Paper prepared for the conference on Sovereign Debt and Development at the World Bank October 2006. Comments from Brian Pinto and Moritz Schularick were very helpful. We thank Antonio David and Wagner Dada for excellent research assistance on early data collection. We thank Michael Clemens, Moritz Schularick, Alan Taylor, and Jeff Williamson for help with or use of their data. The financial assistance from the UK’s ESRC helped build some of the data set that underlies this paper. Support is acknowledged with pleasure. Errors remain our responsibility.

2
1. Introduction The period from 1870-1913 was a period of globalization in both goods and
financial markets comparable to the present era of globalization. Growth of international
trade surged, so that by 1913, the principal economies of the world had ratios of
merchandise exports to GDP of at least 15 percent. .Globally the figure almost doubled
from 4.5 to eight percent between 1870 and 1913. Transportation costs fell, and tariffs
stayed low compared to their levels after 1913. It was also an age of mass migration with
few impediments to the flow of people across borders. Financial globalization burgeoned-
-current account deficits persisted for long periods, and many nations imported foreign
capital to the tune of at least three to five percent of GDP each year. In 1913 Obstfeld and
Taylor (2004) estimate that the ratio of net foreign liabilities to global GDP was on the
order of 25 percent. Of great importance, capital controls were non-existent.
Today, opponents and supporters of “globalization” argue vigorously about the
benefits of such a process. With respect to financial globalization, optimists suggest that
opening up to global capital markets can make crucial investment funds available,
enhance risk sharing, transfer technology and reign in errant policy makers. Pessimists
suggest that global capital flows are fickle and move for reasons unrelated to
fundamentals causing financial disruption and economic volatility. Decoupling from the
global capital market through the use of capital controls can help protect a country from
temperamental financial markets.
Optimists might cite as evidence for their view the late nineteenth century when
many countries seem to have benefited from the free movement of capital. The areas of
recent European settlement such as Australia, Canada, the United States, and even parts
of Argentina and Brazil had high standards of living and witnessed rapid economic
growth. Inward investment to these areas, coming largely from Great Britain, was
massive prior to 1913. Much of this financing went into fixed interest rate long-term
bonds that national governments and local companies issued in London, but equity
investments were important too. By 1913 a majority of overseas investment was direct
investment. Early in the period, conventional wisdom holds that funds were essential in

3
building productive capacity and improving the infrastructure that would allow goods to
reach ever larger international markets. Such investment also enhanced technology
transfer from the core to the periphery.
Investment in machinery and equipment is often acknowledged to be a driver of
growth as in Delong and Summers (1991). But it is not totally clear from basic growth
theory that greater investment per effective worker leads to significantly faster economic
growth. Gourinchas and Jeanne (forthcoming) argue that financial liberalization may not
be associated with large increases in the growth rate. Moreover, many countries fail to
channel available funds into productive investments. They often squander them instead
on frivolous military campaigns or excessive public consumption. In addition, some
countries are unprepared for the rapid cessation of capital inflows that seem to
periodically afflict open international capital markets. Like today, nations in this earlier
period had to contend with financial crises--many of which have great resonance for
recent experience. In both eras, many emerging countries faced sudden stops
accompanied by currency crises, banking crises and twin crises. They also faced a
number of debt crises and all-encompassing financial crises.
This leads us to ask several questions:
• Did borrowing and integration into the global capital market of the time
confer growth benefits? Was reliance on the global capital market
associated with faster economic growth?
• Did the numerous financial crises and sudden stops of the era reduce the
growth benefits of unencumbered international financial integration?
• What were the determinants of financial crises? Why were some countries
able to borrow so heavily and have so few financial crises while others
borrowed relatively little and still suffered from financial meltdowns.

4
In terms of fundamental causes of financial crises, original sin, debt intolerance
and currency mismatches have been recently cited as key problems in debt management,
and as a matter of fact, many, if not most, countries suffered from original sin in the first
era of globalization. The external, and even the domestically issued debt they
accumulated to finance their development was largely denominated in foreign currency
or in terms of pre-defined amounts of gold through “gold clauses”, just as emerging
market debt today is almost entirely denominated in dollars, euros or yen. When the
exchange rate depreciates, debt service in gold or foreign currency becomes very difficult
leading to default, the consequent drying up of external funding and economic collapse.
We wish to ascertain whether different debt structures might play a role in explaining the
difference in crisis incidence.
We also wonder if debt management policies that created or alleviated balance
sheet mismatches as discussed in Goldstein and Turner (2004) mattered. We examine
whether poor reputation and accumulated default experience was a problem as
hypothesized by Carmen Reinhart, Kenneth Rogoff and Miguel Savastano (2003) in their
work on debt intolerance. Finally we check whether politics matters since Kohlscheen
(2006) has argued that presidential systems are one reason nations have been serial
defaulters since 1960.
After accounting for all of these factors, we find striking evidence consistent with
modern theoretical developments on financial crises that examine the way capital
markets, balance sheets, exchange rates, financial development and politics interact. But
the emerging country experience was quite varied. Although most capital importers had
original sin, some were relatively financially mature and a few had crucial political
institutions that generated credibility. There were few crises in these countries. These
countries are very likely to have experienced positive growth benefits from integration.
But in other places, financial mismanagement, financial underdevelopment or
severe imbalances led to currency mismatches. These made debt payments more onerous
and tended to push countries to the brink of default. When capital markets became
illiquid, the accountability of the executive branch of government, something determined
by the constitutional framework, led to crises of confidence and ultimately to significant
differences in the willingness of countries to continue servicing their debt. We find that

5
presidential countries (i.e., where the executive did not rely on the legislative branch for
continued tenure) were significantly more likely to default.
Our assessment of the benefits of capital market integration is thus mixed. Our
findings are also based somewhat more on correlation than on evidence that would allow
us to argue unambiguously for a causal role of capital market integration in spurring
economic growth. Nevertheless, the evidence is suggestive that the growth benefits of
integration for many countries were positive after controlling for the incidence of crises.,
However holding integration constant, crises paired with sudden stops seem to be
associated with slower growth leading to lower levels of output per capita in every year
after a crisis. We discuss the reasons countries were more likely to suffer crises. Nations
that had the strongest growth in this period of freely mobile international capital were
those that had robust financial systems and a certain set of institutions and safeguards in
place that shielded them from severe financial crises.
2. Background and History on International Capital Markets
The period between 1880 and 1913 was one of deep integration in international
capital markets. Capital moved across borders freely and with virtually no controls. With
the recent decline in capital controls in many important countries, there has been a surge
of interest in this earlier period. This is not surprising. The first period of globalization
was a period free of capital controls and where market-based financing of both the core
and periphery reigned. Trade costs were low between many core countries and they
declined quickly between the core and the periphery due to technological revolutions in
transportation and communications, exceedingly low-tariffs in Great Britain and the rise
of a global system of fixed exchange rates under the classical gold standard (Jacks,
Meissner and Novy, 2006). Box 1 discusses the main features of the first wave of
globalization.

6
At the core of this globalized economy was Great Britain. She had experienced an
industrial revolution slightly earlier than other countries and had also accumulated a vast
surplus of savings. This surplus was channelled through the City of London to borrowers
from all over the world. Net inflows were large even by contemporary standards. Figure 1
shows the average ratio of the current account to GDP in the economically advanced
core (excluding the main capital exporters), the economically advanced capital importers
and the poorer regions of the world.1 In the core capital importing countries, the average
deficit in the later part of the period was on the order of three to five percentage points of
GDP. On average the current account deficit in countries such as Australia, Canada, New
Zealand and the US, was on the order of three percent and much higher in many years. In
the periphery the levels were somewhat lower in absolute value. Great Britain exported
the majority of capital flows while France, Germany and Holland provided somewhat
smaller amounts. In Great Britain the current account surplus never fell below one
percent of GDP and averaged over four percent of GDP the entire period.
Schularick (2006) estimates a global measure of capital market integration (gross
world assets divided by global GDP) to be about 20 percent in 1913 while today he
estimates it at roughly 75 percent. However, much of today’s “integration” is about rich-
to-rich gross flows. Gross inflows (which are widely assumed to equal net flows) into the
less developed world were much larger in the first era of globalization as Obstfeld and
Taylor (2004) and Schularick (2006) discuss. This was a period less afflicted by the so
called Lucas Paradox whereby foreign capital shies away from poor countries.
Capital exports from Britain took the form of fixed income bond finance, private
bank loans and direct investment. Early in the period portfolio investment dominated, but
by 1913 Svedberg (1978) argued that direct investment accounted for over 60 percent of
all foreign investment. The type of inflow varied by country and by period. Marketable
bonds were typically placed by London investment banks such as the Rotshchilds or
Baring Brothers amongst many others. Bonds were traded on the London Stock exchange 1 We define the core countries to include Belgium, Denmark, Norway, Sweden and Switzerland. France, Germany, Great Britain, and the Netherlands. These are a group of capital exporters and/or financial centers. We place Australia, Canada, New Zealand and the United States into an “offshoots” category. These regions were extensive capital importers and also had a special institutional heritage being members (or once having been members) of the British Empire. The periphery is defined to include Argentina, Austria-Hungary, Brazil, Chile, Egypt, Finland, Greece, India, Italy, Japan, Mexico, Portugal, Russia, Spain, Turkey, Uruguay

7
and daily quotes were available in the London Times. Obstfeld and Taylor (2004), Mauro
and Sussman (2006) and Flandreau and Zúmer (2004) all contain interesting discussions
on the details of high finance in this first era of globalization. Obstfeld and Taylor (2004)
emphasize that covered interest parity held tightly for a number of core countries. Mauro
and Sussman study the efficiency of the London bond market and pay particular attention
to the reactions of bond yields to political information. They argue that markets moved
on news of domestic political turmoil and that comovement amongst bond prices was
much lower than it has been in the past twenty to thirty years. Flandreau and Zúmer
(2004) discuss at length the models that institutional investors used to judge the finances
of recipient countries. They argue that the ratio of interest payments to revenue was one
of the key determinants of countries sovereign risk assessment since nominal debt values
can carry significantly different interest burdens. Moreover they show evidence of
threshold effects in judging sustainability. The marginal increase in the bond spread for a
one percent increase in the interest to revenue ratio for less indebted countries (i.e., lower
than 20 to 30 percent) was virtually nil while above this point it was large and positive.
A large amount of British lending went to the British Empire. Ferguson and
Schularick (forthcoming) argue that these regions paid less for their capital than other
similar countries outside of the empire. This was natural because of the nature of property
rights, political ties and other institutional distortions such as the Joint Stock Acts.
Property rights and political ties would tend to reassure investors that debts would be
repaid. As a matter of fact no British colony ever defaulted in this period.
Clemens and Williamson (2005) find little evidence that Empire mattered for the
quantity of capital imported. They note that key recipients of capital such as Canada, the
various colonies of Australasia and other new world regions were richly endowed in
natural resources, high in human capital and scarce in labor and capital. Such a
combination apparently made for profitable investment relative to the domestic
opportunities and those available in labor abundant resource poor Europe. After
controlling for these factors, they find that the British empire did not receive greater
inflows from Britain (i.e., quantities) than other regions such as Latin America and Asia.
France was the second largest capital exporter. The volumes exported were about half
those of Britain. French capital was mainly directed eastward towards Russia and also to

8
other outposts in the French sphere of geo-political influence (cf. Fishlow, 1986). Politics
rather than the market is widely believed to have determined where a significant portion
of French funds ended up. Loans would be granted if strategic purposes would be served
or special industrial interests could be assured of a market for their wares.
Previous work by Edelstein (1982) has shown that ex post returns on British
foreign investments were not extremely high compared to the alternatives at home and
that debenture return differentials converged by 1910. Nevertheless, Figure 2 shows that
as capital markets developed further between 1870 and 1913 and low inflation reigned,
nominal bond yields (the coupon yield divided by the price) converged dramatically. This
evidence would be consistent with the idea that default risk fell over the period as
development proceeded and projects and countries matured. Meissner and Taylor (2006)
also show that the British yield on foreign investments relative to the yield paid on
liabilities outstanding fell over the period. One reading of this is that international capital
markets became more competitive and the number of high yield projects fell over time.
On the receiving side, contemporaries mostly viewed foreign inward investment
as something to be coveted. American, Japanese and Russian policy makers amongst
many many others of the period cited the need to attract greater foreign capital as one of
the reasons to join the gold standard and fix their exchange rates to the British pound.
Foreign capital was viewed an essential ingredient for these savings constrained
economies. Without it they argued that further development of their economic potential
would have been limited. Fishlow (1986) remarks that foreign investment accounted for
about 20 percent of total investment in the typical developing country of the time and up
to 50 percent in Australia, Canada, Argentina and Brazil.
The ratio of public borrowing to private varied over time. Clemens and
Williamson (2005) tabulated the data available in Irving Stone (1999) based on gross
capital issues (gross inflows) on London markets for the period 1870 to 1913. New
capital issues were split roughly 55 percent to public and 45 percent to private entities in
the 1870s. The share of public investment declined secularly over time to 33 percent
between 1886 and 1893 and 28 percent between 1907 to 1913. Measuring these shares is
complicated because many governments of the time guaranteed railway debt and so the
actual liability fell to the government in many cases. Heavy government involvement in

9
borrowing wasn’t necessarily synonymous with unproductive borrowing as vital
infrastructure development was often managed by national and local governments.
Fishlow (1986) characterized countries as revenue borrowers or development
borrowers. We examined an investors’ almanac of the period called Fenn on the Funds to
gain further insight into this distinction, and Box 2 discusses this distinction further. In
1874 this manual provides short outtakes from the bond prospectuses for each and every
sovereign borrower on the London market. Australasia, the component colonies of the
future South Africa, and Canada and its provinces borrowed the vast majority, if not the
strict entirety, of funds for railroads, harbors, sewage systems, and other infrastructure.
For these places, Fenn’s manual would often state something to the effect that ‘the vast
majority of funds have been for internal improvement’.
Other bond issues in countries like Russia (an issue to strengthen the specie
[reserve] fund), Japan (to pay charges on pensions), Egypt (Pasha loan for re-payment of
existing debt), Austria (an issue in 1851 to improve upon the value of the paper florin),
and India (debt issued for many wars including the Sepoy mutiny of 1857) borrowed to
plug revenue gaps or to fund offensive, defensive and civil wars. Many of these same
countries had considerable amounts of issues dedicated to unspecified ends in the
prospectuses. Of course unsound investment would often be greeted coolly by the market
with a low price at its initial public offerings.
It is difficult to sort out whether new issues for unspecified projects were simple
consolidations of old productive debt, whether war finance should be classified as
productive spending or not (since the vanquished often paid large war indemnities or
suffered economic repression), and to know the actual share for each country of
sovereign borrowing versus private borrowing. Therefore we have not been able to
systematically assess whether countries were revenue or development borrowers for each
and every year of the period. Future work could attempt to delineate more clearly each
kind of borrower and to correlate this variable with subsequent economic growth.
Another problem is that it is not clear whether this source and the
productive/revenue dichotomy could adequately characterize countries’ prospects. For
1874 we catalogued the issues for the entire set of economically important countries. We
found that for countries like the US (federal financing of the Civil War we know), and

10
even Canada (which the very same source reported as being a sound infrastructure
borrower), a majority of its issues were listed as unspecified. Compounding the
difficulties would be judging between the quality and management of the projects such as
railroads that actually seem on paper to be for productive purposes. For example in
Bolivia one issue was for the construction of a canal to the Atlantic. This project failed to
prove technically feasible and the market value of the issue sank.
Despite these difficulties we totalled the face value of all bonds listed in Fenn’s
1874 edition that clearly stated in the abstracted prospectus that the bond was issued for
infrastructure or other productive investment. We then divided this value by the total face
value of bonds outstanding. As a matter of fact the yield spread roughly captures these
distinctions. For bond spreads we use data based on Bordo, Meissner and Weidenmier
(2006). The spread is calculated for a long-term issue listed in London and payable in
gold minus the British consol yield.2 The correlation between the spread and the ratio of
bonds issued for productive purposes to total bonds is -0.25. Figure 3 plots the spread
versus the ratio and reveals a negative correlation. The coefficient on the spread in a
regression is -0.03 and has a robust t-statistic of -1.96 (p-value = 0.06). Thus the bond
spread can be considered a more continuous measure of development versus revenue
financing. Figure 3 reveals that both types of countries inhabited the market during this
period of open capital flows. Moreover, the calculation is not perfect. We see Turkey
(i.e., the Ottoman Empire), a fiscal disaster with a high spread but Brazil and the US with
equivalent measures of productive spending and low spreads. The latter two had sound
finances and solid reputations (see Summerhill 2006 on Brazil). Moreover it is likely that
some of the unclassified debt was actually put towards productive uses or markets had the
belief that this would be the case.
In sum, a sort of proto-Washington Consensus of free trade, fixed exchange rates,
and liberal economies more or less reigned between 1880 and 1913. Capital markets
became strongly integrated and nations relied on foreign and domestic capital to finance
new projects aimed at meeting the demand of ever-larger and wealthier global markets,
but also for bringing forward future revenue that they hoped for or expected.
2 The consol was the British long-term bond payable in sterling which was solidly convertible into gold. This calculation is the period equivalent to today’s calculation which would subtract the long-term US treasury yield from the yield on a domestic dollar bond of equivalent maturity.

11
3. Economic Growth and Foreign Capital in Theory and Empirics
The theoretical case for capital market integration is nearly the same as that for
free trade. Opening to foreign capital allows for resources to be allocated where they are
most needed. In addition, risk sharing is also enhanced with globally integrated capital
markets. It is also argued that policy is improved since footloose capital harnesses errant
policy makers.
Recent research on these benefits has not been as unambiguous about the salutary
effects of globalized capital. In a standard Solow growth model Gourinchas and Jeanne
(forthcoming) argue that the growth and welfare effects of capital market liberalization
are surprisingly small. For instance, for a country that has an initial capital to labor ratio
of one-half its steady state value, the growth rate in output would rise after a move from
financial autarky to financial liberalization by only 0.5 percent (not percentage points!).
The reason is that opening up speeds a country to its steady state. And since in a standard
growth model convergence towards the steady state is quite quick (11.49 percent of the
output gap is eliminated each year in the Gourinchas and Jeanne calibration) most
countries are on average very near their steady state already , the growth and welfare
impact is small. To get a larger impact, one would have to argue that capital market
liberalization changes the steady state potential of a country.
Other studies based on contemporary empirical evidence are inconclusive.
Edison, Levine, Ricci and Slok (2002) suggest there is no evidence against the null
hypothesis that international financial integration does not raise the growth rate of per
capita output. Prasad, Rajan and Subramanian (2006) find little evidence that greater
reliance on foreign capital is accompanied by higher growth rates and some evidence that
higher growth accompanies less reliance on foreign capital.3 Nevertheless Schularick and
Steger (2006) apply the Edison et. al. methodology as closely as possible to the years
between 1880 and 1913. They argue that there was a positive association between gross
capital inflows from Britain and growth between 1880 and 1913.
3 See Kose et al (2006) for a survey of these issues.

12
Indeed, the conventional wisdom is that borrowing on capital markets was
important for economic growth. Fishlow (1986) argued “[F]oreign investment was
central to the trade and growth performance of most of the recipients in the late 19th
century…” James Foreman-Peck (1994) claims that by adopting the gold standard Russia
lowered its cost of capital, increased its imports of capital by 50 percent, or one percent
of national product, and raised the growth rate of total output by perhaps one half of a
percentage point. Collins and Williamson (2001) estimated that the decrease in
investment from higher relative prices of capital goods was likely to decrease economic
growth.
Notwithstanding this conventional wisdom, there are few papers that consider
financial crises and integration together to assess the overall growth benefits of open
international capital markets.4 Financial crises and sudden stops of international capital
flows seem to be part and parcel of liberalized international capital markets. Crises are
known to be costly events in terms of output losses, and they most likely reduce welfare
due to market coordination failures.5 Moreover crises were not rare events in this period.
In Figure 4 we present the frequency of various types of financial crises (banking,
currency, twin, debt, “third generation” crises and all types of crisis together) for the
period 1880 to 1913.6 The frequency is measured as the number of years a country was
in crisis divided by total possible years of observation. We use the country-year as the
unit of observation and eliminate all country-years that witness ongoing crises to come up
with a total number for years of observation.7 We see the pattern found in Bordo et. al.
(2001) in terms of the relative frequency of types of crises. The predominant form of
4 Eichengreen and Leblang (2003) is an early exception. They look at our period plus evidence from the following 100 years and concluded that capital controls are associated with higher growth and crises are associated with lower growth. Their measure of integration is whether a country has capital controls or not. No country had such controls in our period so we use information on gross inflows as in Edison et. Al. (2003) and Schularick and Steger (2005). 5 Allen and Gale (2000) analyze theoretically the possibility that banking and currency crises can be optimal. Marion (2000) argued that the assumptions of their model are unlikely to be fulfilled in practice. What one needs is that countries can issue large of amounts of debt in their own currency abroad and lend in equally large amounts to other countries in foreign currency. Since original sin was a fact of life even in this period it is unlikely that financial crises were optimal in the sense of Allen and Gale. 6 Box 3 explains the various types of crises we consider and how we define them. Our crisis dates are listed in the appendix to Bordo and Meissner (2006a). 7 For third generation crises we do not eliminate ongoing banking and currency crises and in the sudden stop and crisis measure we allow ongoing banking, currency or debt crises to enter the set of country-year observations.

13
crises before 1914 was banking crises, followed by currency crises, twin and then debt
crises.8 Bordo et al. (2001) and Bordo and Meissner (2006a, 2006b) noted in previous
work that the recent period between 1973 and 1997 seems slightly more crisis prone. The
incidence of nearly all varieties of crises is much higher relative to the past although
crises are still quite uncommon overall. Mitchener and Weidenmier (2005), in a more
inclusive sample, document 46 debt defaults by 25 different countries (out of roughly 40
to 50 sovereign countries) between 1870 and 1913. Overall, the average country could
expect to be in crisis once a decade prior to 1913.
Another feature of the open capital markets landscape is the sudden stop. Sharp
reversals in the current account or snap decreases in the inflow of foreign capital are
alleged to be problematic for countries suffering from currency mismatch and which also
are not very open to international trade (cf. Calvo, Izquierdo and Mejía, 2004). Calvo and
Talvi (2005) show how Argentina and Chile both suffered a sudden stop. Financially
fragile Argentina was hit by an “excruciating collapse” but Chile was hit by a growth
slowdown. Adalet and Eichengreen (2005) note that current account reversals or sudden
stops do not always come along with currency crises. In the period 1880-1913, they note
that 15 percent of the crises preceded by current account deficits ended in a sudden stop,
whereas the percentage was 37 percent between 1973 and 1997. Finally Bordo (2006)
shows that the average (unconditional) output loss from a financial crisis was small, but it
was large when the sudden stop was accompanied by some sort of financial crisis
(banking, currency, twin, or debt). In Figure 4 we also give the incidence of sudden stops
and the incidence of sudden stops accompanied by some sort of a financial crisis. We see
that only about one-eighth of the sudden stops were accompanied by some sort of a
financial crisis.
Bordo et al. (2001) also studied growth losses from financial crises. They found
that the (unconditional) drop in the growth of income per capita during various types of
crises was 30 to 50 percent larger in the first era of globalization than between 1973 and
1997.9 Overall ,currency crises and banking crises were associated with growth losses of
8 Debt crises were not studied by Bordo et al. (2001) 9 The statistic is the cumulative growth loss from the initial year of a crisis until resolution. The loss in each year is calculated as the difference between the pre-crisis growth trend and the actual growth rate of per capita output.

14
roughly eight percentage points, and twin crises with losses of upwards of 14 percentage
points. At a trend growth rate of roughly 1.5 percent these are equivalent to losses of over
four years worth of trend growth. The average length of these crises was between two and
four years making for rather sharp downturns in the event of a crisis. So even though
crises seem less frequent in this period than today, those countries that experienced them
almost surely suffered important setbacks in economic progress. There is little doubt then
that any assessment of the net impact on growth of global capital market integration
needs to include financial crises. In the next section we attempt to gauge the growth
benefits of capital market integration after accounting for financial crises. After that we
proceed to isolate the determinants of financial crises and hence to ascertain how some
countries were able to minimize their losses in the earlier period of unfettered capital
flows.
We use several measures of integration into or reliance on the international
capital market. The first, the current account relative to GDP, measures the period net
inflow or outflow of capital. The scatter plot in the upper left hand corner of Figure 5
reveals no clear correlation between growth and net capital inflows. This data is for only
those countries with a negative current account and covers 25 countries for a total of 783
country-year observations.
The next panel in the northwest corner uses a measure of gross inflows. This is
data from Stone (1999) on total capital calls on London and includes public and private
issues of debt effectively purged of refinancing issued. The conventional wisdom for the
period is that gross flows were roughly equal to net flows for the capital importers (cf.
Obstfeld and Taylor 2004). This panel also reveals no systematic relationship between
growth in the years following large inflows.
The lower panels use stock measures. The lower left panel places the public debt
to revenue ratio on the x-axis. The intent is to see if official borrowing either
internationally or domestically had any impact on growth. A negative relationship is
evident here. Canada, the uppermost point in the scatter is an outlier as much of its
infrastructure improvement was funded publicly or guaranteed publicly but it also had the
highest growth rate of the period. This unusual case stands out in the lower right panel as
well. We also use the average (taken between 1880 and 1913) of the ratio of cumulative

15
inflows of capital (where annual inflows from the Stone data are accumulated up to the
present year) to GDP against the average rate of growth of per capita output between
1880 and 1913. This is the lower right panel in Figure 5. No particularly strong
relationship is visible here either.10
In the three panels of Figure 6 we break the period into three parts (1880-1889,
1890-1899, and 1900-1913). We also average the growth rates within the period and
average the ratio of gross inflows to GDP within each period. Schularick and Steger
(2005) reported a strong positive relationship between 1900 and 1913 in a simple
regression of average growth on the average level of capital inflows, initial income,
enrolment rates and the primary fiscal surplus and inflation. We exhibit the same
relationship here but note that strong sample selection bias is also evident by looking at
the first and second periods. In the first period there is no obvious simple correlation and
in the second period, a period of financial turmoil beginning with the Baring crisis, a
default in Portugal, American free silver problems and further debt defaults in Portugal
and Greece, there appears to be a negative relationship.11
Table 1 explores these correlations further with regression analysis. Here we run
regressions of the following form
Where Growth is the annual growth of per capita output , , is the average growth
rate of per capita output for the set for countries for which growth observations are
available, Integration is one of the four measures of capital market integration suggested
above, ∆ Population is the annual percentage change in the population, Enrol is the
percentage of the population aged 14 and below enrolled in primary school, µ is a country
10 Separating flow to the private sector and flows to the public sector does not change the look of our scatter plots. 11 A similar picture emerges if we use the lagged average inflows from the period 1880-1889.
( )ititit
itititit
GrowthGrowth
EnrolPopulationnIntegratioGrowth
εµαααααα
+++
++∆++=
− 514
3210
tGrowth

16
fixed effect and ε is an idiosyncratic error term.12 Note we control for lagged levels of
output per capita by using the lagged growth rate.13
In columns 3 and 4 we implement the following regression for the year 1913
where the bars denote averages for the period 1880 to 1913 and the value of initial GDP
per capita in real terms is used as a standard conditional “convergence” term.
Finally in columns 6 and 7 of Table 1 we implement the GMM estimators used by
Schularick and Steger (2005) and Eichengreen and Leblang (2003).14 This takes care of
the potential endogeneity of the lagged income term and the error term when including
fixed effects.
Few of the measures of integration in Table 1 display a positive statistically
significant relationship between economic growth and capital market integration. This is
true whether we use flows and annual data or stocks and long-run average growth. In
unreported regressions we separated private from government inflows of capital and
found little difference in their coefficients in the growth regressions. More importantly
there is even some evidence that growth was lower the more a country relied on market
capital. The regression using the debt to revenue ratio shows that countries with higher
debt to revenue ratios had lower average growth rates. Column 3 would have a negative
and statistically significant coefficient on average gross inflows if Canada were excluded
from the regression. If capital market integration were uncorrelated with any other
omitted variables relevant to the growth experience then we could conclude from Table 1
that there were not large growth benefits on average from the greater use of international
funds. What explains these dismal results?
12 We allow for heteroscedasticity by using robust standard errors. We also cluster these at the country level. 13 Schularick and Steger (2005) follow the methodology of Edison et al. (1999). This involves first eliminating roughly 80 percent of the observations because only averages over the previous five years are included as observations. Next, GMM techniques for dynamic panels developed are used. We believe that the temporal aggregation procedure is not likely to be appropriate when the times series are highly persistent (cf. Pesaran and Smith, 1995) and that GMM techniques are likely to be unsound for short panels. On the other hand, it is well known that when the time series component of the panel is large (here we have roughly 33 observations for each country) fixed effects in a dynamic panel is consistent. This still leaves the problem of the endogeneity of capital flows, and crises and slope heterogeneity. These issues are deserving of investigation and our econometric results should be interpreted with requisite caution. 14 These are from Roodman (2005)
ii
iiiii Pop
GDPEnrolPopulationnIntegratioGrowth ε+
++∆+=
1880
1880ln

17
Many hypotheses come to mind as potential explanations for why greater capital
market integration was not associated with faster economic growth. Table 2 gives us
some leads to go on. In this table we have divided the countries into three separate groups
in order of their reliance on British capital. We also put initial income in the third column
so as to emphasize that catching-up is not playing any obvious role over the long-term.
What does leap out of the table is that some countries performed well within each
category and some countries performed poorly.
Taking the Gourinchas and Jeanne framework, one could argue that the difference
between countries that grew faster and those that grew slower was that the former were
implementing institutional reforms so as to raise their steady state potential. Nothing like
this leaps out of this table. In the middle group we see the US, Norway and Japan as the
growth leaders. With the exception of Japan, perhaps there were no sweeping institutional
changes in these countries during the period that one could argue shifted the steady states
so dramatically.
What does stand out to us is that financial crises are the difference within each
group. Countries that grew slower (at each level of inflow to GDP) were much more
likely to have spent more time in some sort of a financial crisis. Taking a closer look, it
appears that it was not just financial crises. Sudden stops of foreign capital inflows and
debt defaults also matter. Greece and Australia did not spend an inordinate amount of
time mired in crisis. Nevertheless Australia had a major banking crisis and sudden stop
and Greece defaulted on its sovereign debt in 1894.
Columns 5 through 7 of Table 1 explore the association between growth and
integration while controlling for financial crises. In column 5 we reproduce the growth
regression of column 2 but include a dummy equal to one if there was some sort of
financial crisis and a dummy equal to one if there was a “sudden stop”.15 We also include
the interaction between the two indicators to see if crises accompanied by sudden stops
were especially troublesome as Bordo (2006) found using unconditional averages. We
find that having a crisis and a sudden stop is associated with an economically significant
decline in the growth rate (after controlling for a country specific trend and the average
15 Our measure of sudden stop requires that there is a drop in the ratio of capital inflows to gdp of at least two standard deviations for the within country level over the period and/or any drop in capital flows that exceeds three percent of GDP over a period shorter than four years.
18
world growth rate) of over five percentage points. The coefficient is only significant at
the 89 percent level of confidence but this is highly suggestive that financial crises
coupled with funding problems on international capital markets can wreak economic
havoc on domestic growth trajectories.16
In column 6 we re-run our regression from column 2 that used gross inflows as
the measure of integration, but here we utilize the GMM estimator for dynamic panels as
in Schularick and Steger (2005).17 We find, as they did, a positive and statistically
significant correlation between (the change in) capital inflows and growth. When we
include controls for crises and sudden stops in column 7, we also find that increased
integration still has a positive point estimate. But at the same time, having a crisis and a
sudden stop at the same time is associated with growth that is lower by ten to fifteen
percentage points and this coefficient is statistically significant at better than the 95
percent level of confidence. Our conclusion is that there is some evidence that increased
capital market integration is associated with faster growth holding exposure to crises and
sudden stops constant. But the opposite also holds. Holding integration constant, a
financial crisis coupled with a sudden stop or slowdown in the inflow of capital would
lead to significantly lower growth rates.18
Financial turbulence is not considered in the Gourinchas and Jeanne modification
of the Ramsey-Cass-Koopmans model. One could discount the necessity of including
such messy short-run disturbances in such a model, but crises were a feature of the
international landscape then as they are now. Moreover, countries had little will or
capacity to use controls on the capital account. The next sections take a closer look at the
determinants of crises. We make the point that countries avoided crises when they opted
for sound financial policies. We also emphasize that the record seems to show that certain
16 Bordo et. al ( 2001) looked at the connection between growth, recessions and crises. They argued that the potential endogeneity between crises and recessions was not the reason they found a strong connection between growth losses and financial crises. Future work on this period should address the potential endogeneity issues more carefully. 17 We treat lagged growth as predetermined, using the second lag of the level of GDP per capita as an instrument, and all other variables as exogenous. We also include year dummies in this specification. 18 In one of the most recent studies of the connection between foreign capital and growth Prasad, Rajan and Subramanian (2006) find no clear positive link between reliance on foreign capital and economic growth except for a possibly negative relationship. They suggest that financially underdeveloped countries are unable to channel foreign funds into productive projects and hence that fast growing developing countries tend to send their funds abroad to the advanced countries which are naturally growing more slowly.

19
financial developments and political factors allowed countries to avoid the side effects
emanating from curtailment of capital inflows.
4. The Theory and History of Financial Crises, Balance Sheets, Hard Currency
Debt, and Exchange Rate Instability
We now turn to analyzing the determinants of financial crises. The balance sheet view of
financial crises sees banking trouble, currency crises and debt crises that occur in the
same or consecutive years as inter-related phenomena. Moreover there is a strong
prediction that financial crises will be accompanied by economic downturns as
accelerator effects or financial frictions lead to a sharp fall in investment. This is different
from first generation models that viewed currency crises as events arising from
unsustainable fiscal policy under a pegged exchange rate. It is also different from a strand
of the literature which views banking crises as arising uniquely from poor supervision,
weak structure or stochastic liquidity runs.
A few countries had first generation crises prior to 1913, but just as often they
faced financial meltdown and economic turbulence by suffering twin (banking and
currency crises) or even triple crises where in addition to a large depreciation and
disruption in the banking sector sovereign debt went into default. One important factor
determining the ultimate outcome may have been an interaction between the nature of the
debt contracts in place and the robustness of the financial system. Our framework for
thinking about financial crises follows Mishkin (2003) and Jeanne and Zettlemeyer
(2005).19 This view is inspired by an open-economy approach to the credit channel
transmission mechanism of monetary policy. Balance sheets, net worth and informational
asymmetries are key ingredients in this type of a model. Moreover the development of
the financial system is crucial. In Box 4 we present some aspects of financial
development. We present a diagram in Figure 7 that follows our chain of logic described
below. In the following paragraphs we explain more fully the chain of logic in Figure 7.
19 Mishkin’s informal analysis follows a stream of literature from the late 1990s on the links between net worth, crises and depreciation.

20
In our view, initial trouble might begin in the banking sector for a number of
reasons. One possibility is that international interest rates rise. This worsens the balance
sheets of non-financial firms and banks alike. As the number of non-performing loans
rises and net worth falls, a decline in lending can occur, contributing further to output
losses. At this point, reserves may be used as a first line of defense as internationally
mobile capital takes a pessimistic view. Net inflows of capital may also slow to a trickle
perhaps culminating in a sudden stop. As reserves run out and foreign financing becomes
scarce, larger financing gaps arise, and more trouble comes up in the financial sector.
If there is a strong financial system, that is, if any or all of the following obtain
then countries can pull though the turbulence and avoid further economic fallout: there is
a lender of last resort; deep and liquid financial markets exist; the quality of private
lending has been high; the fiscal position is sound. These factors help generate credibility
and confidence and assuring markets that the exchange rate will not move too much and
hence there are no further impacts on the net worth of firms.
On the other hand, if the financial sector is weak or underdeveloped there could
be increased stress for non-financial firms if they are forced to cut investment due to a
lack of financing. Low investment could drive down demand for nontradeable goods or
decrease the supply of tradeables. Coupled with nominal rigidities an economic downturn
might be expected. If policy makers wanted to maintain economic activity this could lead
to an expectation of easy future monetary policy, inflation, and an expected exchange rate
depreciation.20 Governments may also have trouble making interest payments on debt
coming due as capital markets become unwilling to continue rolling debt over and
monetization and depreciation could be expected. The abandonment of an exchange rate
peg, as reserves are depleted, is a possibility and floating regimes could also see large
depreciation (expected and/or actual) occurring under such a scenario.
20 Many countries cut the link to the gold standard in times of financial stringency or never had a formal link to the gold standard even in this hey day of the classical gold standard. Such countries typically ended up with accelerated money supply growth, inflation and nominal depreciations. Countries that adhered strictly to the gold standard were supposed to “play by the rules of the game” or implement a procyclical monetary policy. In the short run they did not necessarily do so. Nevertheless, countries that credibly adhered to the gold standard would often see stabilizing speculation and markets often expected tighter policy and/or deflation in countries running balance of payments deficits. These types of countries, because of their credibility could avoid the third generation fallout which we describe in the next few paragraphs.

21
A slowdown of capital inflows could come along or even precede this
depreciation. A contemporary view of the impact of such exchange rate changes and
sudden stops is that they may be contractionary.21 This is where original sin enters the
picture. Since the majority of obligations for nearly all countries are in foreign currency
or, in the late nineteenth century, denominated in terms of a fixed amount of gold,
depreciation vis-à-vis creditor countries or breaking the link between gold and the
domestic currency could lead to increases in the real value of debt. This is a redistribution
of wealth from domestic borrowers to their creditors who are expecting a certain amount
of gold or foreign currency.22 This decline in the net worth of debtors can lead to another
round of “disintermediation” because net worth matters for lending decisions. Less
lending implies the possibility of widespread bankruptcies due to liquidity problems. Of
course a few countries had low original sin, and some of them were even relatively
undeveloped (financially and economically) such as Russia. In such a country, the
probability that the depreciation causes further trouble may be limited. The deterioration
to debtors’ balance sheets would be more severe the greater the amount of fixed interest
rate hard currency debt outstanding.
There is some contention in the literature as to whether the amount of hard
currency debt alone is what matters. Goldstein and Turner (2003) have argued that often
countries insure themselves against exchange rate movements. Hard currency debt can
be, and often is, backed up by hard currency assets. Alternatively, countries could have
enough export capacity (or capability) to offset changes in liabilities due to exchange rate
swings. To gauge the actual effect of original sin one must take account of the mismatch
position or the entire balance sheet position of an economy.
It could also be the case that a solid financial system matters. When financial
frictions are smaller and capital can get to most of the projects that are worthwhile (i.e.,
net worth and collateral constraints play less of a role in lending decisions perhaps due to
better monitoring technologies or better property rights systems) the impact of 21 Theoretical work by Céspedes, Chang and Velasco (2004) demonstrates how under certain very plausible circumstances original sin can lead to contractionary depreciations. 22 Eichengreen, Hausmann and Panizza (2003) argue that what matters is the aggregate external mismatch and if all debt is domestic, that one sector’s losses are the others’ gains. Our view however is that net worth matters. When a debtor’s net worth deteriorates, borrowing capacity falls, and the capital markets seize up. This is one reason why we focus on domestic and external hard currency debt rather than just foreign holdings (or issues) of hard currency debt.

22
depreciation and the loss of international capital could be less crucial. Lending dries up
more slowly when there is a lender of last resort or a large liquid domestic asset market.
When finances are sound in the first place, a liquidity problem has a high chance of being
resolved and massive losses can be stemmed before they occur. Jeanne and Zettlemeyer
(2005) emphasize that international crisis lending (into the official budget) from
multilateral institutions can forestall crises if the government’s finances would be sound
in the absence of the “bad” no financing equilibrium.23 This underscores the importance
of fiscal probity in the definition of financial development.
In addition to the capital markets’ decisions we must also consider the political
decision making mechanisms that determine a sovereign’s actions. Reinhart, Rogoff and
Savastano (2003) have argued that original sin is a proxy for a weak financial system and
poor fiscal control so we control for this possibility below. But we also think it is
important to emphasize a political channel that interacts with an unfortunate financial
hand of cards. When the going gets this tough and meltdown is a possibility, some types
of political systems seem more capable of sustaining the good credit of a country than
others. In an interesting set of papers, Emanuel Kohlscheen (2006a, 2006b) discusses
why parliamentary and presidential regimes might have differential propensities to
default on sovereign debt. In a parliamentary democracy, the executive depends upon
continued support from the governing coalition while in a presidential democracy no such
constraint exists. His main theoretical conclusion is that presidential democracies are
much more likely to default than parliamentary democracies. An executive in a
parliamentary democracy may try to find ways to improve the fiscal position through
some sort of a political compromise on belt tightening. A presidential executive may
hand the costs of a default to an interest group that is out of favor, and in any case he is
usually not immediately liable for such an act. Empirically Kohlscheen (2006) finds that
between 1970 and 2000 presidential democracies were (unconditionally) nearly five
times as likely to default as parliamentary democracies. The correlation also stands up to
closer scrutiny in multivariate regressions and advanced applied econometric techniques
that control for endogeneity and selection. Bordo and Oosterlinck (2005) also find
23 Economic historians are more familiar with the “cooperation” between central banks and governments and private actors highlighted by Eichengreen, 1992.

23
preliminary evidence that debt defaults were more likely amongst presidential
democracies in the late nineteenth century.
The point of this chain of logic is that there are various routes that limit the
probability of a major growth slowdown in the face of financial unrest. Those countries
that limited the fallout from financial crises and sudden stops were the ones that managed
to avoid deep economic downturns due to such crises. These countries borrowed for
productive purposes, maintained strong reserve positions, were open to international
trade, had sound financial development, and political institutions geared towards adhering
to contractual obligations. On the other hand, some countries were extremely vulnerable
to the capricious international capital market and its expectations that accompanied the
free movement of capital. Their outcomes differed from the first group because they
borrowed for revenue purposes which left little by way of future revenue streams and lent
little credibility to them in the event of a shock or liquidity run. Eventually these nations
would need to resort to inflation finance (and hence a depreciated exchange rate), or fell
victim to a speculative attack--either of which could worsen their debt position due to
original sin and their preponderant currency mismatches. We now turn to an empirical
test of this framework in the late nineteenth century.
4.1 The Record on Original Sin
It has been the case since the 18th century that debt issued on international capital
markets has been denominated in the currency of the market of issue and not the currency
of the issuing country. It has also long been noted that such debt can become more
onerous to repay in the face of depreciations, and that since emerging markets often face
rapid exchange rate depreciations associated with sudden stops and reversals of capital
inflows or very loose monetary policy, these countries are more often the victims of such
a volatile combination.24
24 Of course the overall level of indebtedness matters too. We control for this below. Right now we are holding this factor constant.

24
With the resurgence of private international lending to emerging markets since the
1970s, these phenomena have started to attract attention again. Eichengreen and
Hausmann (1999) argued that the danger of exchange rate fluctuations in the face of
foreign currency borrowing might oblige many countries to adopt hard currency pegs.
They coined the term “original sin” because they argued foreign currency denominated
debt was imposed by international capital markets. Nations with poor reputations, and
even nations with good reputations or solid fundamentals, are obliged to issue debt in key
international currencies. In other words, domestic policies or problems were not the only
reason countries could not borrow in their own currencies. Because of “original sin” and
the subsequent problems in the face of devaluation, Eichengreen and Hausmann (1999)
argued that exchange rate stabilization was of the utmost importance. Contrary to our
evidence from previous work (Bordo and Meissner 2006a, 2006b) they argued that
original sin might be a problem even for countries where fundamentals and fiscal policies
were sound but which might fall victim to a liquidity run. Bordo and Meissner (2006a,
2006b). looking at evidence from 1880 to 1913 and 1973 to 1997 found that many
countries with high original sin were not obviously more prone to currency, banking or
debt crises than countries with low levels. Instead they argued that a high level of original
sin did not render a country financially fragile if it was accompanied by a sound financial
system and a low mismatch (plus some idiosyncratic factors).
Eichengreen, Hausmann and Panizza (2005) have shown that countries with
higher original sin have higher exchange rate volatility and higher macroeconomic
volatility. Flandreau (2003) argues that in the nineteenth century, depreciation increased
the debt burden because of original sin which led to sovereign debt crises. He illustrates
this with reference to several cases in a narrative way.25
We collected data from various national sources on hard currency debt (cf. Bordo
and Meissner, 2006a) and augmented and compared this with data made available by
Flandreau and Zúmer (2004). What we refer to as hard currency debt is debt that carried a 25 Our conclusions differ from Flandreau’s as we take on a wider set of hypotheses and cases. Empirical work by Flandreau and Zúmer (2004) which regresses sovereign bond yields on a ratio of interest service to government revenues and a number of other variables also argues that hard currency or gold debt was dangerous. Their tests are quite different from ours since our dependent variables are debt crises, banking crises, currency crises or twin crises. Frankel and Rose (1996) examined “currency crashes,” external debt and exchange rate fluctuations but their approach to measuring original sin, its impact and the type of crises considered is different than ours.

25
gold clause or was made payable at a fixed rate in a foreign currency.26 Our measure of
original sin, OS, is the ratio of this quantity to total public debt outstanding.
−= 0,
icountry by issued Securities
icountry by icurrency in issued Securities1maxiOS .
The key difference between our measure and the workhorse measure in
Eichengreen, Hausmann and Panizza (2005) is that we look at debt issued in domestic
and international markets instead of looking only at international issues. One reason we
view this as important is because many domestic issues of the day carried gold clauses.
As described above, in the case where monetary authorities devalued the local currency
in terms of gold this would have a similar effect to a depreciation when a country had
foreign currency debt. In either event, real debt repayments for local currency gold clause
debt and for foreign currency debt would both increase.27 Hence, we do not classify debt
as “debt issued in currency i" if it contained a “gold clause” stipulating a fixed quantity of
gold per unit of local currency payable. Only debt payable in local paper currency,
without mention of the gold-local currency exchange rate upon payment of coupons and
principal, is included in the ratio above.
Figure 8 shows the ratio of hard currency government debt to total government
debt by country between 1880 and 1913. Our time series plots reveal most countries’
measure of original sin to be constant over time. Some countries’ situations “worsened”.
Japan became more exposed to foreign currency debt as it entered global capital markets
from the late 1890s. Argentina and Brazil converted local currency paper debt into gold
clause debt in the 1880s and 1890s respectively. One reason they did so was to lower the
interest burden of new issues since gold debt was priced as a safer risk by investors. Only
Spain and Italy appear to have decidedly decreased their reliance on hard currency debt
relative to internal currency debt. All of these nations had floating currencies for some
portion of the period. As noted by Flandreau and Sussman (2005), their situations appear
similar to those of Russia and Austria-Hungary, countries which had relatively low
degrees of original sin and which also had floating currencies over most of the period we 26 The data appendices and the text in our previous work on crises has more to say about the structure of this debt. 27 We assume here that nominal depreciations are equivalent to real depreciations in the short-run perhaps because of sticky prices. On the domestic side we assume going off gold or a depreciation implies a depreciation of the local currency versus gold and domestic prices are constant over the short run.

26
cover. These are the counter-examples to those who believe that poor fiscal history, a
shaky exchange rate policy and economic backwardness are causes of original sin. Nearly
all of these countries had previous episodes of debt default and chronically poor fiscal
situations. We return to these stories below.
The long-run averages of our original sin measure in Figure 8 also reveal a
counterintuitive ranking, but are consistent with previous findings by Flandreau and
Sussman (2005) and Eichengreen, Hausmann and Panizza (2005). Financial centers have
less original sin. Small peripheral countries have a lot of original sin. Countries with
ostensibly rotten fiscal institutions and poor international track records have intermediate
levels of original sin. Notice that Spain, Russia, Austria-Hungary, Italy and Argentina are
all towards the lower middle of the spectrum and many of these countries suffered some
of the worst crises of the period. However, some countries with sound fiscal, financial
and monetary records, like Australia, Canada, Denmark, Sweden, and the US also have
moderate to high original sin. These countries, like others in Western Europe, had
financial institutions that were evolving in the same direction as the core. The question
then becomes: are these fundamentals along with the historical and current fiscal
positions more important for explaining crisis incidence than the actual level of hard
currency debt?
4.2 Currency Mismatches
Goldstein and Turner (2004) have argued that currency “mismatches” are the
main problem with foreign currency debt. Countries that have foreign currency liabilities
which are not offset by foreign currency assets may be more likely than countries with
more foreign assets to find it difficult to repay their foreign currency debts in the event of
a depreciation. Changes in the exchange rate can become a problem the greater the
mismatch, as local currency assets lose value in terms of foreign liabilities. Goldstein and
Turner have three key ingredients to their overall measure of a nation’s mismatch. They
first use the difference between all reported foreign assets and foreign currency liabilities
outstanding. They then divide this measure by exports to account for openness to trade.
For example, the mismatch decreases when exports are higher because a depreciation
27
would likely attract a larger amount of extra revenue and thus such a country would be
more naturally hedged. Finally they pre-multiply this ratio by the ratio of all reported
foreign currency liabilities to all reported liabilities outstanding.
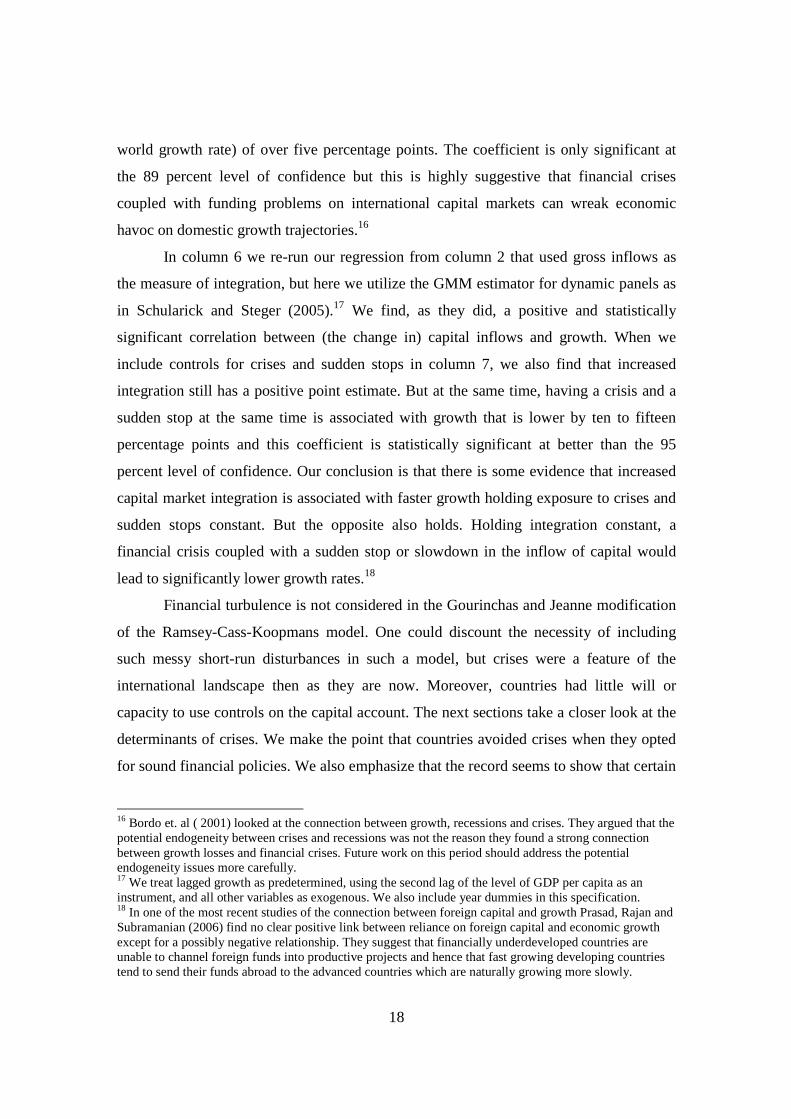
We focus on the government’s mismatch due to severe data constraints. But we
believe this is a relatively good proxy for the economy-wide mismatch. The functional
form we choose is different from Goldstein and Turner and slightly closer to that found in
Eichengreen, Hausmann and Panizza (2003).28 For country i we have
exports
reserves nalinternatio-goutstandindebt currency hard totalMismatchi = .
Our measure of reserves usually only includes gold reserves held at the central
bank, in the banking system or held by the government treasury. The sources are listed in
the appendix to our previous papers (cf. Bordo and Meissner 2006a and 2006b). Total
hard currency debt (domestic and international issues) is calculated directly if the data are
available or by multiplying the total debt outstanding by the percentage of total debt that
is payable in gold or foreign currencies. A higher mismatch measure should be correlated
with a greater probability of a debt default.
Countries that maintained strong reserves in their financial position relative to
debt outstanding would possess low mismatch ratios. Nations that had fiat currency
episodes, usually as a last resort in financing government deficits, or because of the
inability to borrow at reasonable prices to get reserves would have low mismatch ratios.
Nations that had a sound export base relative to their debt; or vice versa maintained their
debt position in reference to their economic potential would also have low mismatch
ratios. In essence then, the mismatch ratio while directly relevant for the capacity to repay
and for immediate market expectations is grosso modo a proxy for the ability to maintain
sound finances.
28 Eichengreen Hausmann and Panizza (2003) report that the correlation between their measure of mismatch and the Goldstein and Turner measure is 0.82.

28
4.3 Debt Intolerance
A new literature on sovereign financial difficulties has emphasized the role of past
defaults in creating current difficulties. Reinhart, Rogoff and Savastano (2003) (RRS)
have coined the term debt intolerance. This line of research tries to explain why some
countries are able to sustain very high debt to GDP ratios while other emerging market
countries run into debt problems with comparatively low debt to GDP ratios. Their
evidence suggests that past defaults generate poor sovereign ratings. Countries with
worse track records in international capital markets suffer greater financial fragility due
to increased borrowing costs at a given level of debt to GDP.
Default history or sovereign ratings are proxies for other underlying structural or
institutional problems which make any given level of borrowing more difficult to sustain
than if the country has a clean track record on international markets. Political institutions
that raise the probability of default and which persist over time such as the constitutional
frameworks discussed above are one possibility. Financial development may also be
persistent because it depends in part on political and legal history. Economic structure
which determines macroeconomic volatility but which is also endogenous to a nation’s
institutions could be another possibility (cf. Catão and Kapur, 2006) Confidence and
willingness of markets to sustain particular situations could be attainable either through
sound fundamentals or because of membership in a particular empire or sphere of
political influence. Hence we would also like to control for such fundamentals, as far as
possible, to allow for the possibility of graduation from debt intolerance and also to be
more precise about the particular factors which account for debt intolerance.
In addition to other controls such as the spread, the mismatch and the level of
original sin, we control for debt intolerance by including a public debt to government
revenue ratio and interacting this with an indicator variable that equals one if a country
had at least one default episode between 1800 and 1880. If the increase in the probability
of a financial crisis for a marginal increase in the debt to revenue ratio is larger for a past
defaulter, we would argue there is evidence in support of the debt intolerance hypothesis.
We also include a control for the constitutional setup of a country. In addition, the

29
constitutional system turns out to be a significant determinant of financial crises. This
could also be evidence compatible with the ‘debt intolerance’ hypothesis.
4.4. The Political Determinants of Financial Crises
Torsten Persson and Guido Tabellini (2003) have done path breaking research on
the politics of fiscal outcomes. Two of their hypotheses are potentially relevant. The first
is that electoral rules matter for the size of the budget deficit. Proportional electoral
systems (PR) with higher propensities to form coalition and minority governments have
greater tendency to spend more than they collect in revenue. Their evidence for the late
twentieth century suggests majoritarian systems produce smaller deficits all else equal. It
is not hard to see that if countries have PR systems that such low public saving could tilt
the economy towards an unsustainable accumulation of foreign debt and reliance on
international capital markets that make them vulnerable in ways described above.
Nevertheless we found no evidence in the pre 1914 era that different political
systems produced the types of fiscal outcomes seen in the late twentieth century. Also we
found no evidence (results unreported) that the electoral system mattered for financial
crises. In the full sample, the median ratio of the surplus to GDP for PR systems was 0.16
while for majoritarian systems it was -0.42. This is not necessarily evidence against the
Persson and Tabellini hypothesis since if something else varied with the electoral system
(perhaps the party structure, country size or empire membership patterns) this could
easily hide any clean evidence on such a relationship. Also, deficits and fiscal patterns
were quite a lot different in the nineteenth century than they are today in the age of
entitlement spending and social democracy. Countries ran deficits to fund public
spending on infrastructure, wars, or (in Egypt for example) the leaders’ follies (see Box
2). Little spending, save for the odd veterans’ pension scheme or the nascent social
security schemes of which Germany was a leader, was in the form of entitlement outlays.
And there was probably little expectation that intense lobbying would generate such
spending. Nevertheless, more research could and should be done on the connection
between fiscal outcomes and election rules in this historical period.

30
Another key hypothesis is that the constitutional framework matters. Presidential
systems are different than parliamentary democracies. Presidents are not subject to votes
of confidence. These institutions tend to limit the ability of the executive to undertake
policies that are costly to particular interests. Presidents are able to carry out and
implement policies that are much more directed towards special interests. Kohlscheen
(2006) takes the argument to the issue of repayment of debt. He argues that the
presidential constitutional framework is one of the reasons that nations serially default on
their creditors.29
In Table 3 we show that between 1880 and 1913 only one parliamentary
democracy, Greece, defaulted. The rest of the defaults (nine in total) were mostly by
presidential democracies (seven) or in dictatorships.30
If we look back further in time to the period between 1820 and 1880, the years when
capital began to move freely and range widely across international borders, and years in
which there were a large number of defaults, we also find that most defaults were by
dictatorships or in places where executives were relatively unconstrained. In the 1840s in
the United States nine out of 28 states or territories of the time defaulted and three other
states came close to doing so (Wallis, Sylla and Grinath III 2004). A number of other
significant defaults occurred in the newly created “republics” of Latin America and the
older nations of southern Europe. The fact that state constitutions and the Latin American
constitutions primarily follow a “presidential” system, where governors’/presidents’
terms are independent of the legislature’s support, is inescapable. Nevertheless the
29 The older literature on default poses the issue of default in terms of reputation versus gunboats. Eaton and Gersovitz (1981) argued that reputation was enough to sustain repayment. Bulow and Rogoff (1989) argued that absent the authority or ability to seize assets nations would always default and place the proceeds in a savings account thus making them better off. Amador (2006) provides a rationale for why democracies do not default. He argues they are unable to commit to a savings plan in the future and hence the Bulow Rogoff result does not hold. In his framework autocracies always default due to short time horizons. Our contribution to the debate fits in between Bulow and Rogoff and Amador. We define democracy more finely distinguishing between presidencies and parliaments—though the logic of the theory about default is slightly different the outcomes are similar. Gunboats and financial custodians working on behalf of creditors were also paramount in the late nineteenth century. We discuss some of the evidence on this below. 30 Expanding this sample back to the 1870s would not overturn these tabulations or if we included more countries than we have in our macroeconomic database. No European parliamentary democracy defaulted after 1870 (perhaps with the exclusion of Portugal which we have coded as being presidential). See Table 1 in Mitchener and Weidenmier (2005).

31
constitutional rule itself cannot explain everything. The constitutional rule for the
executive persisted in the American states but few defaults occurred after the 1840s.
Wallis and co-authors argue that states implemented constitutional provisions for
tax funding schemes for new debt and made voter approval via bond referenda
mandatory. In addition, states eliminated the agency problem arising when state credit
was channeled to private enterprises by discontinuing this practice. Exactly why
American states were able to overhaul their institutions and to avoid a downward spiral
into debt intolerance would also seem to be a promising avenue for future investigation.
This could help us understand how emerging markets suffering from debt intolerance can
escape such a problem today.
In terms of why sovereign countries actually did repay their debts there is a large
amount of evidence from the period. Weidenmier (2005) analyzes the defaults of the US
confederacy and finds evidence that both trade sanctions and reputation mattered for the
ability to issue new debt on international capital markets during the war. Mitchener and
Weidenmier (2005 and 2006) look at the impact of informal empires, trade sanctions,
gunboats and the surrender of fiscal sovereignty. They find that the advent of informal
ties with the US due to the Roosevelt corollary markedly improved the credit ratings of
nations in the Caribbean basin in the early twentieth century. They also find that when
groups of creditors sent in administrators to collect revenue (as they did in Egypt, Turkey
and several other sovereigns between 1880 and 1913) countries were able to regain
access to the capital markets more quickly than those which refused such a settlement. In
contrast to Rose’s findings for the late twentieth century, the authors find no evidence
consistent with the idea of trade sanctions.
6. The Determinants of Financial Crises
We next turn to formal tests of the framework for thinking about financial crises.
The goal is to see whether the chain of logic proposed in Figure 7 represents a reasonable
approximation to the globalized capital markets of the late nineteenth century. We have
already established that, holding constant the level of capital inflows relative to GDP,
having a financial crisis coupled with a sudden stop was associated with substantially

32
lower growth relative to the long-run trend growth rate. The goal now is to isolate the
determinants of financial crises. That is to take the story one layer back. Growth is lower
during crises, but what causes crises? Are crises the fault of the capital importing
countries, or simply a side effect of participating in open international capital markets?
What did nations do that avoided crises in the past?
Figure 7 starts with real shocks and banking trouble leading to reserve losses, a
currency crisis and eventually a halt to fresh capital inflows from abroad. There is a vast
literature on American banking crises that suggests a major determinant of banking
trouble was the rigidity of the local currency under the national banking system and the
gold standard. Shocks to the market rate of interest due to unusually high demand for
funds (for example, seasonal demands combined with cyclical financial stress) often led
to banking failures and suspension of payments. But tracking the determinants of banking
crises in a large sample of countries with standard macroeconomic controls is difficult as
our previous work shows (2006a). This suggests that the trigger events for banking crises,
which may end up cascading into other types of crises, are idiosyncratic real shocks,
contagions and panics. The international dimensions of the major banking meltdown of
the early 1890s in Australia have been synthesized most recently by Adalet and
Eichengreen (2006). There poor regulation and over lending to the real estate sector
contributed to something of a bubble. The roots of the famous 1890 Baring crisis in
Argentina and London have been attributed by Flores (2006) to intensified competition
amongst lenders. Many of the banking crises (but certainly not all) ended up, to some
extent, having an international dimension to some extent and so it would appear that there
is substantial evidence supporting the idea that such shocks are a prime mover. In our
regressions on the determinants of currency crises in Table 4 we find that banking crises
are positively associated with currency crises but their marginal impacts are not
statistically significant at conventional levels.
In Table 4 we investigate further the determinants of currency crises. We use a
probit model where the dependent variable is one if there was a currency crisis and zero
otherwise. We control for international and year-specific factors using the rate of interest
on long-term consol bonds in London. We condition on the change in the ratio of the
current account surplus to GDP, a gold standard dummy , and the presence of a banking

33
crisis in the current or previous year. We also include the currency mismatch and the
level of original sin. The idea is that higher levels of either variable could lead to an
expectation of deeper trouble. The long-term interest rate, debt to revenue ratio, growth
of the money supply and the ratio of gold reserves to outstanding bank liabilities roughly
control for the level of financial development of an economy. The long-term interest rate
also proxies for the quality of investment as per our discussion above.
Column 1 of Table 4 shows that the change in the current account to GDP ratio,
and a lower level of reserves to notes outstanding are the only variables that are
statistically significant. They are both associated with higher probabilities of a currency
crash.31 As mentioned above, the indicator for lagged banking crises is positive but not
highly statistically significant. The original sin, mismatch variable, exchange rate regime,
money supply growth and London interest rates are also not highly statistically
significant.
The next link in our framework in Figure 7 relates currency depreciation, liability
dollarization and balance sheets to further trouble including debt default. We argued that
exchange rate depreciation, or the expectation of it, could exacerbate already precarious
net worth positions in the face of extensive hard currency debt. Of course alternative
strategies to avoiding this meltdown phase existed including obviating currency
mismatches or greater financial development. A probit regression (column 2 Table 4)
using as a dependent variable the first year in which a country defaults (partially or in
whole) on its sovereign debt obligations finds evidence for all of this.
First we see that a higher ratio of hard currency debt to total debt outstanding is
associated with a higher probability of having a debt crisis. In column 3 we interact our
original sin variable with an indicator variable equal to one if there was a currency crisis
in the same year. This variable is positive and statistically significant. It implies that the
marginal impact on the probability of having a debt crisis would be more than doubled
from 0.03 to 0.07. We find evidence consistent with the hypothesis that original sin and
currency crises are a factor in macroeconomic volatility.
31 The results are robust if we use the percentage change in the ratio of the current account to GDP. We follow Edwards (2004) and the current account literature that looks at the change in percentage points rather than in percent.

34
We also find that a larger mismatch would lead to a higher risk of having a debt
crisis. We include a squared term on this variable too and find that as the mismatch
becomes very high the marginal impact becomes slightly smaller. It is possible that at
very high levels of mismatch other policies are implemented to mitigate the impact but
we are not controlling for these and venture few guesses as to what these policies might
be.
As for the debt intolerance and political variables we find that constitutions matter
while default history does not (column 2, Table 4). We find that presidential regimes
raise the probability of having a debt crisis by 0.10 percentage points compared to
parliamentary regimes.32 The partial effect associated with having a presidential regime
is substantive. It is highly statistically significant. What this says to us is that political
institutions become crucial at the point that financial markets lose confidence, the
country’s net worth takes a major hit and default is being considered. Based on this
indirect evidence it appears that parliamentary democracies were able to find other ways
of resolving their financial troubles besides default. Part of the difference, is that most
empire observations in our sample were parliamentary democracies, while Latin
American countries in our sample were presidential. We cannot rule out the possibility
that omitted factors correlated with presidential systems are driving this result, but it does
echo findings based on Kohlscheen’s recent theoretical and sophisticated empirical
research. And Kohlscheen claims to find the same high propensity to default amongst
presidential systems even after carefully controlling for regional effects.
Previous default history does not make sustaining any given level of debt to
revenue ratio more difficult. The notion that debt intolerance existed in the nineteenth
century and manifested itself simply by the default record does not stand up. It appears
more likely that institutional or structural factors and their interactions could have been at
work in creating the phenomenon of serial default.
We also find that a surplus on the current account is related to fewer debt crises,
higher interest rates at home and abroad are associated with a greater risk of a crisis and
that there is only weak evidence that contemporaneous banking crises are associated with
debt crises. Overall then we find strong support that original sin and balance sheets
32 There are no countries classified as dictatorships in our sample.

35
matter, but we also find evidence that financial development and deeper institutions are
important for explaining the incidence of major financial meltdowns.
7. International Capital Markets and the Net Benefits of Laissez Faire Financial Globalization: Some Tentative Conclusions We started this survey by highlighting the fact that there were basic features of the first
era of globalization in capital markets quite similar to those today. We then proceeded to
look at the stylized facts of globalization between 1880 and 1913. Cross- border capital
flows were large, asset trade was unencumbered by capital controls. British and European
capital scoured the planet in search of high returns going to where natural resources were
abundant and capital and labor were scarce. Coincident with all of this, growth in many
countries was strong. Some countries no doubt benefited from foreign capital. Canada
and the other dominions and the United States prior to the Civil War come to mind.
On the other hand, these rather special examples obscure the difficulty that many
other nations had in dealing with the capital market addiction. When funds dried up and
the fundamentals were sour this combined to generate economically pernicious financial
crises. Growth was substantially lower in the face of crises coupled with sudden stops.
The more time a country spent in the midst of a crisis, the longer the growth downturn
and the slower such countries grew. There were a number of catastrophes in this period
that still have lessons for today.
We have outlined the role that hard currency debt, currency mismatches and
financial development played in interacting with sudden stops of capital flow from the
core countries. We also highlighted that political issues matter. There is no evidence that
proportional electoral rules generated precarious situations because in this period such
countries did not suffer from higher government deficits. Nevertheless, and much like
today, presidential constitutions seem to be have been one of the decisive factors in
leading countries to default when the final decision had to be made.
We also find evidence that the emerging markets of the day that had significant
amounts of original sin can be divided into two sub-groups. One group includes, but is

36
not limited to, Argentina, Brazil, Chile, Italy and Portugal. Each of these suffered a
financial catastrophe (banking and currency crises, a sudden stop and a debt default)
between 1880 and 1913. The other group, including Australia, Canada, New Zealand,
Norway, and the US, had relatively little trouble with financial crises in terms of
frequency or virulence. We ascribe this to the level of financial development and partially
to the political characteristics that other independent peripheral countries did not possess.
These countries had credibility and also managed their currency crises, banking crises
and sudden stops relatively well preventing economic disaster from striking. Countries in
the second group also matched their hard currency liabilities with hard currency reserves
or took out such debt in proportion to their export earning potential and were less likely
to have growth reducing sudden stops and financial crises. The opposite appears to have
occurred in the first set of countries.
Our assessment of the growth benefits of market-based accumulation of capital is
thus mixed and cautious. Unbridled enthusiasm for international capital markets is not
enough. Poor governance and weak credibility combined with original sin and skittish
capital markets led to much lower net benefits. On the other hand, there were some
countries that accumulated a domestic capital stock through the judicious use and
application of market purchased capital. Further research into the institutional
mechanisms and decision making processes that enhance the proper use of capital will
emphasize this point. It should also provide useful analysis for policy makers and other
actors who wish to garner maximum benefit from access to capital markets.

37
References Adalet, Muge and Barry Eichengreen (2006) “Current Account Reversals: Always a Problem?” mimeo Victoria University Wellington. Allen, Franklin and Douglas Gale (2000) “Optimal Currency Crises” Carnegie Rochester Conference Series on Public Policy 53 (2000). Pp. 177-230. Amador, Manuel (2006) “A Political Model of Sovereign Debt Repayment” mimeo. Stanford University. Beim, David O. & Calomiris, C.W. Emerging Financial Markets New York: MacGraw-Hill, 2001. Bordo, Michael D. “Sudden Stops, Financial Crises, and Original Sin in Emerging Countries: Déjà vu?” NBER working paper 12393 Bordo, Michael D., Barry Eichengreen, Daniela Klingebiel. Maria-Soledad Martinez-Peria, (2001). “Is the Crisis Problem Growing More Severe?” Economic Policy 32, pp. 51--75. Bordo, Michael D. and Christopher M. Meissner (forthcoming 2006a) “Financial Crises, 1880-1913: The Role of Foreign Currency Debt” in Sebastian Edwards ed. (provisional title Growth, Protection and Crises: Latin America from an Historical Perspective) Cambridge: National Bureau of Economic Research. Bordo, Michael D. and Christopher M. Meissner (forthcoming 2006b) “The Role of Foreign Currency Debt in Financial Crises: 1880-1913 vs. 1972-1997” Journal of Banking and Finance. Bordo, Michael D. and Christopher M. Meissner and Marc Weidenmier (2006) “Currency Mismatches, Default Risk, and Exchange Rate Depreciation: Evidence from the End of Bimetallism” NBER working paper 12299. Bordo, Michael D. and Kim Oosterlinck (2005) “Do Political Changes Trigger Debt Default? And do Defaults Lead to Political Changes?” mimeo. Rutgers University Bulow, J., Rogoff, K.S., (1989). “Sovereign debt: Is to forgive to forget?” American Economic Review 79, pp. 43--50. Calvo, Guillermo A., Alejandro Izquierdo and Luis Fernando-Mejía (2004) “On the Empirics of Sudden Stops: The Relevance of Balance Sheets” Inter-American Development Bank working paper 509. Calvo, Guillermo A. and Ernesto Talvi (2005) “Sudden Stop, financial factors and Economic Collapse in Latin America: Learning from Argentina and Chile” NBER working paper 11153.

38
Catão, L. and Sandeep Kapur (2006) “Volatility and Persistence in Sovereign Risk” mimeo Birkbeck College. Céspedes, Luis Felipe, Roberto Chang, and Andres Velasco (2004). “Balance Sheets and Exchange Rate Policy.”American Economic Review 94 (4) pp. 1183-1193. Clemens, Michael A. and Jeffrey G. Williamson (2004), "Wealth Bias in the First Global Capital Market Boom, 1870-1913," Economic Journal, 114 (April): 304-337 Collins, William J. and Jeffrey G. Williamson. (2001) "Capital-Goods Prices And Investment, 1879-1950," Journal of Economic History, v61(1,Mar), 59-94 DeLong, J. Bradford and Lawrence H. Summers (1991) “Equipment Investment and Economic Growth,” Quarterly Journal of Economics, CVI May pp. 445-502. Eaton, J., and M. Gersovitz, (1981) “Debt with potential repudiation: theoretical and empirical analysis.” Review of Economic Studies (48), pp. 289--309. Edelstein, Michael. 1982. Overseas Investment in the Age of High Imperialism. New York: Columbia University Press. Edison, H., R. Levine, L. Ricci, and T. Slok (2002) "International Financial Integration and Economic Growth." IMF Working Paper 02/145. Edwards, Sebastian (2004) “Thirty Years of Current Account Imbalances, Current Account Reversals, and Sudden Stops” IMF Staff Papers (51) pp. 1-49. Eichengreen, Barry J. (1992) Golden Fetters: The Gold Standard and the Great Depression, 1919-1939. New York: Oxford University Press. Eichengreen, Barry and Ricardo Hausmann (1999), “Exchange Rates and Financial Fragility” Federal Reserve Bank of Kansas City. New Challenges for Monetary Policy pp. 329-368.
Eichengreen, Barry, Ricardo Hausmann and Ugo Panizza (2003) “Currency Mismatches, Debt Intolerance, and Original Sin: Why they are not the Same and Why it Matters.” NBER working paper 10036.
Eichengreen, Barry, Ricardo Hausmann and Ugo Panizza (2005), “The Pain of Original Sin,” in Barry Eichengreen and Ricardo Hausmann (eds.), Other People’s Money Chicago: University of Chicago Press Eichengreen, Barry and David Leblang (2003) "Capital Account Liberalization And Growth: Was Mr. Mahathir Right?," International Journal of Finance and Economics, v8 (3, Jul), pp. 205-224.

39
Ferguson, N. and M. Schularick (forthcoming). "The Empire Effect: The Determinants of Country Risk in the First Era of Financial Globalization." Journal of Economic History. Fishlow, Albert (1986) “Lessons from the Past, Capital Markets and International Lending in the 19th Century and the Interwar Years,” in Miles Kahler (ed.), The Politics of International Debt, Ithaca: Cornell University Press. Flandreau, Marc (2003) “Crises and punishment: moral hazard and the pre-1914 international financial architecture” in Marc Flandreau ed. Money Doctors: The Experience of International Financial Advising, 1850-2000. London: Routledge.
Flandreau, Marc and Nathan Sussman (2005), “Old Sins,” in Barry Eichengreen and Ricardo Hausmann (eds.), Other People’s Money, Chicago: University of Chicago Press. Flandreau, M., and Frederic. Zúmer, (2004) The Making of Global Finance. OECD: Paris. Flores, Juan (2004) “A microeconomic analysis of the Baring crisis, 1880-1890”, Working Paper, Universidad Carlos III de Madrid . Foreman-Peck, James (1994) A History of the World Economy; International Economic Relations since 1850 London: Harvester, Barnes and Noble. Frankel, Jeff and Andrew K. Rose (1996) “Currency Crashes in Emerging Markets: An Empirical Treatment” (with Jeffrey Frankel), The Journal of International Economics. Goldstein, Morris and Philip Turner (2004), “Controlling Currency Mismatches in Emerging Market Economies” Washington: Institute of International Economics. Gourinchas, Pierre Olivier and Olivier Jeanne (forthcoming) “The Elusive Gains from International Financial Integration” Review of Economic Studies. Issawi, Charles. (1982) An Economic History of the Middle East and North Africa. Methuen and Co. Ltd: London. Jacks, David, Christopher M. Meissner and Dennis Novy (2006) “Trade Costs and the First Wave of Globalization” mimeo University of Cambridge. Jeanne, Olivier and Jeromin Zettlemeyer (2005) “Original Sin, Balance Sheet Crises and International Lending” in Barry Eichengreen and Ricardo Hausmann (eds.), Other People’s Money pp. 95-121. Chicago: University of Chicago Press. Kohlscheen, Emanuel (2006) “Why are There Serial Defaulters? Quasi-Experimental Evidence from Constitutions” mimeo. University of Warwick.

40
Kose, M. Ayhan, Eswar Prasad, Kenneth Rogoff and Shang-Jin Wei (2006) “Financial Globalization: A Reappraisal” IMF working paper WP/06/189. Mauro, Paolo, Nathan Sussman and Yishay Yafeh (2006) Emerging Markets and Financial Globalization: Sovereign Bond Spreads in 1870-1913 and Today. Oxford: Oxford University Press. Marion, Nancy P. (2000) “Optimal Currency Crises: A Comment” Carnegie Rochester Conference Series on Public Policy 53 (2000). pp. 231-238. Meissner, Christopher M and Alan M. Taylor (2006) “Losing our Marbles in the New Century? The Great Rebalancing in Historical Perspective” mimeo. University of Cambridge. Mishkin, F. S., (2003) “Financial Policies and the Prevention of Financial Crises in Emerging Market Countries” pp. 93-130. in Martin Feldstein (Ed.) Economic and Financial Crises in Emerging Markets. Chicago: University of Chicago Press. Mitchener, Kris and Marc Weidenmier (2005) "Empire, Public Goods, and the Roosevelt Corollary." Journal of Economic History 65. Mitchener, Kris and Marc Weidenmier (2006) “Supersanctions and Sovereign Debt Repayment." NBER Working Paper 11472 Obstfeld, Maurice, and Alan M. Taylor. 2004. Global Capital Markets: Integration, Crisis, and Growth. Cambridge: Cambridge University Press.
Persson, Torsten and Guido Tabellini (2003) The Economic Effects of Constitutions, Cambridge: MIT Press.
Pesaran, M. Hashem and Ron Smith (1995) “Estimating Long-Run Relationships from Dynamic Heterogeneous Panels”, Journal of Econometrics 68 pp.79-113.
Prasad, Eswar, Raghuram Rajan and Arvind Subramanian (2006) “Foreign Capital and Economic Growth” paper presented at the Kansas City Federal Reserve Jackson Hole Symposium, 2006.
Reinhart, Carmen, Kenneth Rogoff and Miguel Savastano (2003), “Debt Intolerance,”
Brookings Papers on Economic Activity 1, pp.1-74. Roodman, D. 2005 Stata module to extend xtabond dynamic panel data estimator. Center for Global Development, Washington. http://econpapers.repec.org/software/bocbocode/s435901.htm Rousseau, Peter and Richard Sylla (2003) “Financial Systems, Economic Growth, and Globalization" (with Richard Sylla). In Bordo, M., A. Taylor, and J. Williamson, eds.,

41
Globalization in Historical Perspective. Chicago: University of Chicago Press for the National Bureau of Economic Research, 2003, pp. 373-413. Schularick, Moritz (2006) “A Tale Of Two ‘Globalizations’: Capital Flows From Rich To Poor In Two Eras Of Global Finance” mimeo Free University Berlin. Schularick, Moritz and Thomas M. Steger (2006) “Does Financial Integration Spur Economic Growth? New Evidence from the First Era of Financial Globalization” mimeo Free University of Berlin. Stone, Irving (1999) The Global Export of Capital from Great Britain, 1865-1914. New York: St-Martin’s Press. Summerhill, William (2006) “Political Economics of the Domestic Debt in Nineteenth Century Brazil” mimeo UCLA. Svedberg, P. (1978) “The portfolio direct compsotion of private foreign investment in 1914 revisited.” Economics Journal, 88, pp.763-777. Wallis, JJ, Richard Sylla and Arthur Grinath III (2004) “Sovereign Debt and Repudiation: The Emerging-Market Debt Crisis in the U.S. States, 1839-1843” NBER working paper 10753. Weidenmier, Marc (2005) "Gunboats, Reputation, and Sovereign Repayment: Lessons from the Southern Confederacy," Journal of International Economics, Vol. 66, 407-422.
42
Data Appendix
Most of the data underlying this paper was used in our previous work and is explained
thoroughly in those sources. The bulk of the macro historical data set is that used in
Bordo et. al. Data descriptions and sources are listed in our NBER working papers 11173
and 11897.
Constitutional Rules: Data kindly supplied from David Leblang.
Crisis Dating:
As in Bordo et. al ( 2001) we date currency and banking crises using both qualitative and
quantitative evidence. For all countries besides Austria-Hungary, Russia, New Zealand,
South Africa, Mexico, Turkey, Egypt, Uruguay and India we have relied on the dates of
Bordo et. al. in both periods. In the earlier period we have tried to date currency crises,
when possible, by using an approach based on the exchange market pressure (EMP)
methodology which looks at changes in reserves, the exchange rate and the interest rate.
Debt crisis dates were based on Beim and Calomiris (2001). Only private lending
to sovereign nations is considered when building those default dates. Not every instance
of technical default is included in the chronology, the authors identified periods (six
months or more) where all or part of interest/principal payments were suspended, reduced
or rescheduled. Some of those episodes are outright debt repudiations, while others were
reschedulings agreed upon mutually by lenders and borrowers. Also data is taken from a
spreadsheet underlying Reinhart, Rogoff and Savastano (2003).

43
Figure 1 Average Levels of the Ratio of the Current Account to GDP for Different Types of Capital Importers, 1880, 1913 Figure 1 Average Growth in per capita output vs. the Ratio of Debt to Revenue
-8-6
-4-2
02
Unw
eigh
ted
Avg
. CA
Sur
plus
to G
DP
1880 1885 1890 1895 1900 1905 1910 1913Year
Mean CA Surplus/GDP--Core Ex. Offshoots Mean CA Surplus/GDP Offshoots
Mean CA Surplus/GDP--Periphery

44
Figure 2 Average Bond Spreads, 1880-1913 Notes: Averages exclude bonds in default with spreads greater than 1200 basis points. Figure 3 Bond Spreads versus a Measure of Productive Investment, 1874
11.
52
2.5
Unw
eigh
ted
Ave
rage
of L
ong-
Ter
m B
ond
Spr
ead
1880 1885 1890 1895 1900 1905 1910 1913year
arg
aus
S. austlabrazil
canada
chile
egypthungary
italyjapan
nz
peru
portugal
russafrica
sweden
turkey
usa
02
46
81
0B
on
d S
prea
d
0 20 40 60 80 100Listed Bond Issues for Productive Uses/Total Value of Bonds Listed

45
Figure 4 Crisis Incidence, 1880-1913 and 1973-1997
0
5
10
15
20
25
Per
cen
t Pro
bab
ility
per
yea
r
BankingCrises
CurrencyCrises
Twin Crises
Debt Crises
"ThirdGen."Crises
AllCrises
SuddenStops
SuddenStopswith aCrisis
Type of Crisis
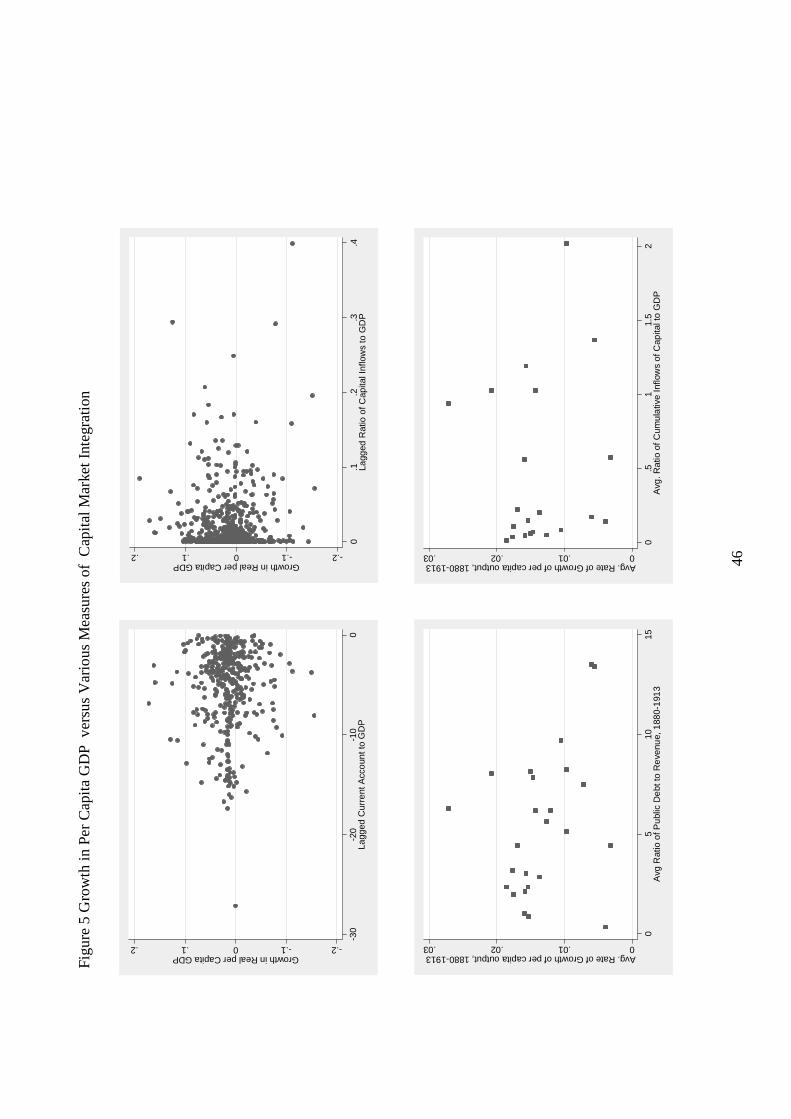
46
-.2-.10.1.2Growth in Real per Capita GDP
0.1
.2.3
.4La
gged
Rat
io o
f Cap
ital I
nflo
ws
to G
DP
-.2-.10.1.2Growth in Real per Capita GDP
-30
-20
-10
0La
gged
Cur
rent
Acc
oun
t to
GD
P
0.01.02.03Avg. Rate of Growth of per capita output, 1880-1913
0.5
11.
52
Avg
. Rat
io o
f Cum
ula
tive
Inflo
ws
of C
apita
l to
GD
P
0.01.02.03Avg. Rate of Growth of per capita output, 1880-1913
05
1015
Avg
Rat
io o
f Pub
lic D
ebt
to R
eve
nue,
188
0-1
913
Figu
re 5
Gro
wth
in P
er C
apit
a G
DP
ver
sus
Var
ious
Mea
sure
s of
Cap
ital
Mar
ket I
nteg
rati
on

47
0.02.04.06Avg. Growth of per capita GDP 1880-1889
0.0
5.1
.15
Avg
. Gro
ss In
flow
of C
apita
l to
GD
P 1
880-
188
9
0.01.02.03.04Avg. Growth of per capita GDP 1900-1913
0.0
2.0
4.0
6.0
8A
vg. G
ross
Inflo
w o
f Cap
ital t
o G
DP
190
0-1
913
-.020.02.04Avg. Growth of per capita GDP 1890-1899
0.0
2.0
4.0
6.0
8A
vg. G
ross
Inflo
w o
f Cap
ital t
o G
DP
189
0-1
899
Figu
re 6
Gro
wth
in P
er C
apit
a G
DP
for
thre
e Su
b-Pe
riod
s ve
rsus
Gro
ss I
nflo
ws
of C
apit
al.

48
Tab
le 1
Gro
wth
, Cap
ital M
arke
t Int
egra
tion
and
Fina
ncia
l Cri
ses
Reg
ress
ors
Cur
rent
Acc
ount
Gro
ss In
flow
sA
vg. C
umul
ativ
eA
vg.
Gro
ss In
flow
s &
Gro
ss In
flow
s G
ross
Inflo
ws
&G
ross
Inflo
ws
Deb
t/Rev
enue
Cris
esC
rises
GM
MG
MM
(1)
(2)
(3)
(4)
(5)
(6)
(7)
[Cur
rent
Acc
ount
/GD
P] t
-1
0.00
---
---
---
---
---
---
[0.0
0][G
ross
Cap
ital I
nflo
ws/
GD
P] t
-1 -
---0
.03
---
---
-0.0
31.
121.
11[0
.06]
[0.0
6][0
.59]
*[0
.64]
*A
vg. [
Cum
ulat
ive
Cap
ital I
nflo
w /G
DP
] -
--0.
0007
---
---
[0.0
03]
Avg
. [D
ebt/R
even
ue]
---
---
-
---0
.000
5 -
-- -
-- -
--[0
.000
2]**
Sud
den
Sto
p x
Fin
anci
al C
risis
-0.0
5 -
---0
.15
[0.0
3][0
.05]
***
Sud
den
Sto
p -
--
---
-
--
---
0.
01 -
--0.
06[0
.01]
[0.0
3]**
Fin
anci
al C
risis
---
-
--
---
-
--
0.01
---
0.06
[0.0
1][0
.04]
ln[ P
erce
ntag
e of
the
Pop
ulat
ion
0.03
0.02
---
---
0.02
0.20
0.20
Enr
olle
d in
Sch
ool]
t-1
[0.0
1]*
[0.0
1]*
[0.0
1]*
[0.0
9]**
[0.0
9]**
Mea
n {
ln[P
erce
ntag
e of
the
---
---
0.00
80.
007
---
---
---
Pop
ulat
ion
Enr
olle
d in
Sch
ool t
-1] }
[0.0
03]*
**[0
.002
]**
---
Gro
wth
rat
e of
Pop
ulat
ion
-0.0
0-0
.00
---
---
-0.0
0-0
.02
-0.0
2[0
.00]
**[0
.00]
**[0
.00]
**[0
.02]
[0.0
2]G
row
th o
f GD
P p
er C
apita
t-1
-0.1
8-0
.19
---
---
-0.1
90.
660.
67[0
.04]
**[0
.04]
**[0
.04]
**[0
.14]
***
[0.1
4]A
vg. o
f gro
wth
rat
es in
the
sam
ple
1.14
1.02
---
---
1.02
---
---
[0.5
3]*
[0.4
5]*
[0.4
8]*
GD
P p
er c
apita
188
0 -
-- -
---0
.007
-0.0
04 -
-- -
-- -
--[0
.004
][0
.003
]C
onst
ant
0.07
0.07
0.08
20.
070.
073.
353.
2[0
.03]
*[0
.02]
*[0
.034
][0
.02]
[0.0
2]**
[1.4
3]**
[1.4
5]**
Num
ber
of o
bs57
569
520
2169
565
365
3R
-squ
ared
0.11
0.10
0.40
0.63
0.11
---
---
Not
es: D
epen
dent
var
iabl
e in
col
umn
(1)
, (2)
, (5)
, (6)
, and
(7)
is
the
annu
al g
row
th r
ate
of G
DP
per
cap
ita. D
epen
dent
var
iabl
e in
col
umns
(3)
and
(4)
is th
e a
vera
ge b
etw
een
1880
and
1913
. Rob
ust c
lust
ered
sta
ndar
d er
rors
are
in p
aren
thes
es. C
ount
ry fi
xed
effe
cts
are
incl
uded
in a
ll co
lum
ns. S
ee th
e te
xt fo
r pr
ecis
e de
finiti
ons
of v
aria
bles
. *
p-va
lue
< 0
.1; *
* p-
valu
e <
0.0
5; *
** p
-val
ue <
0.0
1

49
Tab
le 2
Cap
ital
Flo
ws,
Gro
wth
and
Cri
ses
C
umul
ativ
e G
ross
In
flow
C
umul
ativ
e G
row
th
Rea
l GD
P p
er
Cap
ita
Per
cent
age
of 3
3 Y
ears
of
Cap
ital
/GD
P
of R
eal P
er C
apit
a G
DP
in
188
0 w
ith
a C
risi
s G
erm
any
0.01
1 0.
845
2,07
8 0.
09
Aus
tria
0.
044
0.51
6 1,
911
0.09
It
aly
0.05
2 0.
622
1,54
6 0.
15
Fran
ce
0.05
3 0.
644
2,10
0 0.
12
Spai
n 0.
077
0.41
5 1,
594
0.03
D
enm
ark
0.09
4 0.
793
2,09
9 0.
06
Swed
en
0.10
2 0.
677
1,84
6 0.
06
Ja
pan
0.11
4 0.
685
791
0.15
P
ortu
gal
0.15
8 0.
217
1,11
3 0.
29
Uni
ted
Stat
es
0.16
5 0.
662
3,19
3 0.
14
Indi
a 0.
197
0.13
8 58
2 0.
2 G
reec
e 0.
228
0.48
9 -
--
0.12
N
orw
ay
0.30
6 0.
575
1,44
4 0
Mex
ico
0.38
6 0.
750
838
0.25
Chi
le
0.68
4 0.
693
1,56
7 0.
21
Uru
guay
0.
723
0.60
2 2,
066
0.06
B
razi
l 0.
825
0.11
0 75
6 0.
47
Arg
enti
na
1.17
2 0.
618
2,26
4 0.
15
Can
ada
1.22
8 1.
448
1,72
1 0.
08
Aus
tral
ia
1.37
1 0.
199
4,59
0 0.
03
New
Z
eala
nd
1.57
8 0.
375
3,76
5 0.
12
Not
es:
Cum
ulat
ive
capi
tal i
nflo
ws
com
e fr
om S
tone
and
are
mea
sure
d in
191
3 ag
ains
t GD
P in
191
3. G
reec
e's
per
capi
ta o
utpu
t is
avai
labl
e in
dif
fere
nt u
nits
than
the
rest
of
the
per
capi
ta o
utpu
t the
refo
re o
nly
grow
th
rate
s ar
e av
aila
ble.
Yea
rs w
ith
a cr
isis
incl
ude
initi
al y
ears
of
a cr
isis
or
cont
inui
ng y
ears
of
cris
es.

50
Rea
l sho
ck, d
eclin
es in
net
wor
th,
bank
ing
inso
lven
cies
, lo
caliz
ed b
anki
ng p
anic
Inte
rnat
iona
l liq
uidi
ty fa
lls,
rese
rve
depl
etio
n
Sud
den
stop
and
/or
cu
rren
t acc
ount
rev
ersa
l
(exp
ecte
d) c
urre
ncy
depr
ecia
tion
Peg
ged
exch
ange
rat
e fa
ils
liabi
lity
dolla
rizat
ion
+ d
epre
ciat
ion
=
mor
e ba
lanc
e sh
eet d
eter
iora
tion
Lend
ing
drie
s up
com
plet
ely
Mar
kets
lose
con
fiden
ce
(low
cre
dibi
lity
in th
e m
arke
ts)
Pre
side
ntia
l sys
tem
s:
Def
ault
prob
abili
ty H
IGH
P
R s
yste
ms
F
isca
l con
solid
atio
n D
efau
lt pr
obab
ility
LO
W
- Lo
w c
urre
ncy
mis
mat
ch
- Le
nder
of l
ast r
esor
t -
Dee
p fin
anci
al m
arke
ts
- C
redi
bilit
y
- C
oope
ratio
n
- S
mal
ler
finan
cial
fric
tions
In
vest
men
t mai
ntai
ned
` Lend
er o
f las
t res
ort,
Dee
p fin
anci
al m
arke
ts,
Cre
dibl
e pe
g,
Fis
cal p
robi
ty,
Any
or
all m
aint
ain
mar
ket c
onfid
ence
. T
urbu
lenc
e en
ds.
Low
orig
inal
sin
. E
xpan
sion
ary
depr
ecia
tion
Figu
re 7
Fra
mew
ork
for
Bal
ance
She
et C
rise
s

51
Figu
re 8
Ori
gina
l Sin
, 188
0-19
13
0.51 0.51 0.51 0.51 0.51
1880
1890
190
019
10
1880
1890
190
019
10
1880
1890
1900
1910
188
018
9019
0019
1018
80
1890
190
019
10
1880
189
019
00
191
0
Arg
entin
aA
ustr
alia
Aus
tria
Bel
gium
Bra
zil
Can
ada
Chi
leD
enm
ark
Fin
land
Fra
nce
Ger
man
yG
reec
e
Indi
aIt
aly
Japa
nM
exic
oN
ethe
rland
sN
ew Z
eala
nd
Nor
way
Por
tuga
lR
ussi
aS
outh
Afr
ica
Spa
inS
wed
en
Sw
itzer
land
Uni
ted
Kin
gdom
Uni
ted
Sta
tes
Uru
guay
Ratio of Hard Currency Debt to Total Public Debt
Yea
rG
raph
s b
y co
un
try

52
Figu
re 9
Ave
rage
Ori
gina
l Sin
, 188
0-19
13
0.00
0.10
0.20
0.30
0.40
0.50
0.60
0.70
0.80
0.90
1.00
Average Hard Currency Public Debt to Total Public Debt
Belgium
France
Germany
Netherlands
Switzerland
United Kingdom
Austria
Spain
Italy
Japan
Denmark
Portugal
Sweden
Russia
India
Brazil
Argentina
Mexico
Chile
Greece
Uruguay
Finland
Norway
Australia
Canada
New Zealand
South Africa
United States
Cou
ntry

53
Fig
ure
10 G
row
th L
osse
s B
efor
e D
urin
g an
d A
fter
a S
udde
n St
op/F
inan
cial
Cri
sis
-0.0
4
-0.0
3
-0.0
2
-0.0
10
0.01
0.02
0.03
t-3
t-2
t-1
tt+
1t+
2t+
3t+
4
Tim
e be
fore
/aft
er a
cri
sis
Deviation of Growth Rate from .Non-Crisis Avg. Growth Rate
Cris
is in
yea
r t
Cris
es in
yea
r t-
-Sud
den
Sto
pbe
twee
n t-
2 an
d t+
2
Cris
is in
yea
r t-
-Sud
den
Sto
p in
year
t

54
Tab
le 3
Tab
ulat
ions
of
Def
ault
s an
d th
e C
onst
itut
iona
l Sys
tem
Pres
iden
tial
A
P
arlia
men
t B
R
atio
of
Pre
side
ntia
l/Par
liam
enta
ry
Def
ault
s N
umbe
r of
Cou
ntri
es
14
11
Pe
rcen
tage
with
a
Def
ault
50
9
5.5
Not
es: S
ee th
e da
ta a
ppen
dix
for
how
cou
ntri
es w
ere
clas
sifi
ed. S
ampl
e is
res
tric
ted
to c
ount
ries
w
here
the
exec
utiv
e is
not
a d
icta
tor
incl
udin
g B
ritis
h de
pend
enci
es (
e.g.
, Ind
ia, a
nd th
e B
riti
sh
colo
nies
com
pris
ing
wha
t wou
ld b
ecom
e S
outh
Afr
ica)
.

55
Table 4 The Determinants of Crises Regressors Currency Crises Debt crises I Debt Crises II
(1) (2) (3)
Original Sin 0.001 0.070** 0.031**
(0.019) (0.032) (0.014)
Original Sin x currency crisis --- --- 0.043*(0.023)
Original Sin x gold standard indicator --- -0.051 ---(0.033)
Mismatch 0.003 0.011** 0.013**
(0.003) (0.004) (0.006)
Square of mismatch --- -0.002*** -0.002***(0.001) (0.001)
Debt/Revenue -0.002 0.002 0.003*
(0.003) (0.002) (0.001)
Debt/Revenue x Pre-1880 Default --- 0.003* 0.001
(0.002) (0.001)
Pre-1880 Default --- -0.064* -0.017
(0.035) (0.015)
Presidential System --- 0.10 0.11(0.02)*** (0.02)***
Change in the Current Account/GDP 0.004 --- ---
(0.002)**Current Account/GDP --- -0.003*** -0.004***
(0.001) (0.001)
Long-term interest rate 0.0001 0.009** 0.009***(0.003) (0.003) (0.003)
Consol interest rate -0.006 0.033** 0.038**(0.021) (0.016) (0.017)
Gold standard dummy 0.023 0.044 0.004(0.018) (0.030) (0.004)
Percentage Change in the money supply -0.053 --- ---(0.098)
Gold reserves/notes in circulation -0.055** --- ---(0.025)
Currency crisis in t --- 0.061*** -0.003(0.023) (0.008)
Currency crisis in t- 1 --- -0.007* -0.007*(0.004) (0.004)
Banking crisis in t 0.022 0.016 0.016(0.040) (0.011) (0.010)
Banking crisis in t- 1 0.082 0.004 0.012(0.075) (0.006) (0.011)
constant -1.46 -27.77 -26.36(1.16) (9.73) (11.7)
Number of obs 596 604 604Pseudo R-squared 0.103 0.71 0.69
* p-value < 0.1; ** p-value < 0.05; *** p-value < 0.01
Notes: Dependent variable in column (1) is currency crises. Dependent variable in columns (2) and (3) is a debt default. Robust clustered standard errors are in parentheses. See the text for precise definitions of variables.

56
Box 1 Globalization’s First Wave, 1870-1913 A large body of comparative economic history has emerged in the last decade and a half. The focus has been on comparing and contrasting the experiences of countries between 1870 and 1913 and after 1970 since both periods in time witnessed strong international capital market integration, impressive international trade and sweeping changes in international communications. This box outlines some of the main features of the global economy between roughly 1870 and 1913. Great Britain was at the center of the global economy of the late nineteenth century. This country was one of the first to experience modern economic growth or sustained increases in per capita incomes. It was also the first country to adhere to a policy of relatively free and non-discriminatory international trade. Most famously this was enshrined in the Cobden Chevalier treaty of 1860 between Britain and France which established the Most Favored Nation clause and lowered tariffs substantially. Importantly it was also home to the most important banks and investment houses in global finance. The terminology core and periphery probably stems largely out of this conceptualization of the late nineteenth century global economy. Colloquially economic historians often refer to the more developed countries as the core countries. Mainly these countries were in Western Europe and we consider all of the following in the core: Belgium, Denmark, Norway, Sweden and Switzerland. France, Germany, Great Britain, and the Netherlands. The periphery includes Argentina, Austria-Hungary, Brazil, Chile, Egypt, Finland, Greece, India, Italy, Japan, Mexico, Portugal, Russia, Spain, Turkey, Uruguay. We place Australia, Canada, New Zealand and the United States into an “offshoots” or areas of recent European settlement category. These countries were important capital importers but maintained stable political systems, were relatively rich and enjoyed fairly stable and rapid economic growth. Nations on the periphery were not only figuratively, but also literally, on the periphery or away from the centers of rapid economic change in Northwestern Europe (Northern France, Belgium, Western Germany, Holland and the British Isles). Britain was at the heart of global economic finance in this period. Stable and predictable monetary policy in the form of a gold standard and vast trade links helped create the most important center of international finance of the time. In terms of the gold standard, by 1880 the vast majority of countries in the world, especially those with strong trade ties to the core countries, mimicked the British adherence to gold (defining their domestic currencies in terms of a fixed weight of gold) thus generating a global system of fixed exchange rates called the classical gold standard. Nevertheless a number of countries were unable to consistently maintain adherence to the gold standard. These countries operated fiat currencies and for the most part their exchange rates floated (or crashed) against the major economies. London finance then was as important as New York finance is today. Major investment banks like the Baring brothers, N.M. Rothschild and Sons, Hambro, etc. all worked out of London and specialized in underwriting the bond issues for sovereigns and foreign

57
private companies alike. The London Stock Exchange was a large, liquid market that trades foreign bonds and equities as well as domestic equities. Numerous other correspondent banks that generated trade credit operated within London and the main credit instrument for trade settlement was the sterling Bill of Exchange. The reference, risk free interest rate was typically the yield on British perpetual bonds called “consols”. Like today, financial crises were a fact of life. Each country has its own history of banking panics, typically characterized by a scramble by the public to convert bank liabilities into hard currency. Currency crises or large and rapid depreciations of the nominal exchange rate occurred from time to time when nations ran out of reserves (often due to speculation), or when they monetized fiscal expansions. The 1890s were a period of severe financial turmoil. Problems started when loans made by Barings to Argentine concerns failed to pay off. As British interest rates rose and international capital lost its appetite for risk, a banking crisis afflicted Australia. Currency speculation also dogged the United States in the early 1890s as interest groups advocating abandonment of the gold standard in exchange for a silver standard increased their political power. Silver was expected to keep depreciating against gold and so a silver victory would have meant a persistently depreciating exchange rate. Portugal (1891) and Brazil (1898) also defaulted on their sovereign debts in this decade. A number of debt defaults in periphery countries in the mid-1870s and a banking panic in 1907 emanating from the US, are other episodes when international capital markets faced systemic pressure. Box 2 Revenue and Development Borrowers The categorization of countries into revenue and development borrowers can best be understood by way of an example of each from the 1870s. The Australian colonies would have been considered development borrowers. Egypt would have been considered a revenue borrower. In between there were countries that did some of each type of borrowing in which case a finer measure than the revenue versus development dichotomy would be needed. The Australian colonies undertook large amounts of borrowing. Fenn on the Funds notes that these colonies had some of the largest outstanding debt levels per capita. Nevertheless the very same manual advised that investors not to worry because most funds had been invested into infrastructure that would ensure the abundant natural resources could be brought to market to repay these debts. The prospectuses listed in the 1874 issue describe the reasons for which the bonds were issued in Queensland as “public works and immigration”. In South Australia great confidence is assured because the “whole [of the borrowing] has been for public works, ports, telegraphs, water,…” In New South Wales similar wording is found. In Egypt it was quite a different situation. In 1876 Egypt defaulted on its sovereign debts leading to foreign administration of taxation and spending (see Mitchener and Weidenmier 2005 for a recent summary of the episode). Information about the use to which Egypt put its borrowing was sketchy at best during the run up to default. Fenn’s

58
Compendium does not list a single bond prospectus thus leaving the reader unaware of how the funds would have been invested. The Cave Report (quote is from Issawi 1982)which summarized Egypt’s finances after the default claimed “…[Egypt] suffers from the ignorance, dishonesty, waste and extravagance of the East, such as have brought her Suzerin [Pasha] to the verge of ruin…caused by hasty and inconsiderate endeavours to adopt the civilization of the West”. (Even after default, British auditors found it difficult to evaluate the ultimate destination of borrowed funds. In between these two extremes, many countries borrowed for both revenue and development reasons. The United States borrowed heavily on international capital markets (especially the states and private companies) in the 1840s and 1850s to help build railroad infrastructure to improve market access for farmers and inland manufacturers and to expand the size of the domestic market. On the other hand, in the 1860s the government of the Union contracted large debt liabilities to help it fund the Civil War. In Italy a large issue was for the Maremmana railroad but an even larger amount of issues went to unspecified destinations. For these reasons the dichotomy of revenue versus development borrower, although useful for analytical purposes, deserves a finer measure. One possibility is to use the spread between long-term domestic bonds and the British long-term yield as a standard measure of default risk. Alternatively, Flandreau and Zúmer (2005) discuss the proto-credit rating system developed by the Credit Lyonnais at the end of the nineteenth century which depends upon several key determinants of the bond spread including the debt service to revenue ratio. Box 2 Dating Financial Crises and Sudden Stops In this paper we look at several different kinds of financial crises. These include currency crises, banking crises, and debt crises. Additionally we define twin crises as concurrent banking and currency crises, and “third generation crises” as a twin crisis accompanied by a debt default. The building block for this data set is Bordo et al. (2001). As in Bordo et. al. (1999) we date currency and banking crises using both qualitative and quantitative evidence. For all countries besides Austria-Hungary, Russia, New Zealand, South Africa, Mexico, Turkey, Egypt, Uruguay and India we have relied on the dates of Bordo et. al. We identify currency crises as a period when there was a forced abandonment of an exchange rate commitment (typically the gold standard) or a large change in the nominal value of exchange rate within a given year. To date currency crises we also used an approach based on the exchange market pressure (EMP) methodology which looks at changes in reserves, the exchange rate and the interest rate. Banking crises are identified as periods of severe difficulty in the banking sector when a large proportion of the banking system’s capital is eroded.

59
Debt crisis dates were based on Beim and Calomiris (2001). Only private lending to sovereign nations is considered when creating these default dates. Not every instance of technical default is included in the chronology. The authors identified periods (six months or more) where all or part of the interest/principal payments were suspended, reduced or rescheduled. Some of those episodes are outright debt repudiations, while others were reschedulings agreed upon mutually by lenders and borrowers. Also data is taken from a spreadsheet underlying Reinhart, Rogoff and Savastano (2003). Our measure of a sudden stop requires that there is a drop in the ratio of capital inflows to GDP of at least two standard deviations for the within country level over the period and/or any drop in capital flows that exceeds three percent of GDP over a period shorter than four years. Other measures based on the current account and which may also take into account output declines exist. For our purposes we wanted to purge the definition of a GDP measure since it is also the dependent variable of this analysis. The current account data has not yet been fully elaborated to include a large sample of countries using a definition based on such data. For this reason we use the Stone capital inflow data to date these episodes. Box 4 The Financial System and Financial Development The mechanics of the financial system has come to feature increasingly in the way economists’ think about the macroeconomy. In recent macroeconomic theory financial frictions are formalized as a problem of asymmetric information in credit markets in which borrowers have better information on their prospects than do lenders. In these types of models collateral matters and the net worth of borrowers determines the equilibrium allocation of capital. Because of these frictions markets cannot always allocate capital optimally. However, when financial intermediaries are better at monitoring and have more information about the prospects for any particular project the economy can push closer to the first best outcome. This is one aspect of financial development and certainly if firms can get the optimal amount of capital at the right time this promotes economic stability and helps dampen the fallout from liquidity runs and debt deflation. Another strand of the literature focuses more broadly on the entire financial system. Sylla and Rousseau (2003) claim that a well developed financial system has five key components. They are (1) sound public finances and public debt management (2) stable monetary arrangements (3) a variety of banks that operate both internationally and nationally (4) a central bank to stabilize domestic finances and manage international financial relations , and (5) well functioning securities markets. The basic point is that a financial system that is well articulated can channel capital where it is most profitable and can withstand domestic and international real and financial shocks without major disruption.


![ETHIOPIA’S MEDIUM TERM DEBT MANAGEMENT STRATEGY (2013 …siteresources.worldbank.org/INTDEBTDEPT/Resources/468980... · Ethiopia’s Medium Term Debt Strategy [2013-2017] Page 1](https://img.dokumen.tips/doc/110x75/5b1c3d1c7f8b9a1b688b5d65/ethiopias-medium-term-debt-management-strategy-2013-ethiopias-medium.jpg)