Embed Size (px)
Citation preview

1
2011 Full-year results 17 February 2012
Disclaimer & important notice
This presentation contains forward looking statements that are subject to risk factors associated with the oil and gas industry. It is believed that the expectations reflected in these statements are reasonable but they mayexpectations reflected in these statements are reasonable, but they may be affected by a range of variables which could cause actual results or trends to differ materially, including but not limited to: price fluctuations, actual demand, currency fluctuations, geotechnical factors, drilling and production results, gas commercialisation, development progress, operating results, engineering estimates, reserve estimates, loss of market, industry competition, environmental risks, physical risks, legislative, fiscal and regulatory developments, economic and financial markets conditions in
2
various countries, approvals and cost estimates.
All references to dollars, cents or $ in this document are to Australian currency, unless otherwise stated.F
or p
erso
nal u
se o
nly

2
2011 Full-year results David Knox
Managing Director & CEO
2011 delivery
Target Delivery
Safety TRCFR 3.3, best performance in company history
Production 47 2 mmboe within guidance rangeProduction 47.2 mmboe, within guidance range
Projects delivered on plan Spar: on time and budget Chim Sáo: on time and under budget Reindeer/Devil Creek: on time and budget Wortel: on budget, 30 days behind schedule
Sanction of new projects 2-train GLNG project sanctioned Fletcher Finucane sanctioned (January 2012)
Exploration success Zola gas discovery Finucane South oil discovery
4
Finucane South oil discovery
Portfolio optimisation Acquisition of Eastern Star Gas Ltd Divestment of Evans Shoal Asset swap in Amadeus Basin
Strong balance sheet US$1.2 billion in Export Credit Agency facilities $7.5 billion of funding capacityF
or p
erso
nal u
se o
nly

3
Safety
Personnel safety Process safety
A balanced focus on personnel and process safety
4
5
6
7
case
fre
quen
cy r
ate
(per
ho
urs
wor
ked)
3 3
95%
100%99.8%
TRCFR performance(employees and contractors)
Safety critical compliance long-term trend
5
0
1
2
3
2006 2007 2008 2009 2010 2011
Tota
l rec
orda
ble
cm
illio
n h 3.3
80%
85%
90%
2006 2007 2008 2009 2010 2011
Production 47 2 mmboe (5%)
Underlying net profit up 20%
Change on 20102011 Full-year result
Production 47.2 mmboe (5%)
Sales revenue $2,530 million 14%
EBITDAX $2,126 million 27%
Net profit after tax $753 million 51%
6
Underlying net profit $453 million 20%
Operating cash flow $1,253 million (2%)
Final dividend 15 cents per share No changeFor
per
sona
l use
onl
y

4
Working with local landholders and communities
Australia’s largest domestic gas producer, Santos has a 50-year track record of safe, sustainable operations
W itt d t ki ith l l l dh ld d We are committed to working with local landholders and contributing to communities
We will work in partnership with agriculture for sustainable resource management
7
2011 Full-year results Andrew Seaton
CFO
For
per
sona
l use
onl
y

5
Production impacted by GLNG sell down
mmboe59.1
54.4 54.4 51-5560
Production
49.947.2
0
10
20
30
40
50
9
02007 2008 2009 2010 2011 2012 guidance
2011 production impacted by 15% sell-down of GLNG (1.9 mmboe), flooding in Cooper Basin and cyclones offshore Western Australia
2012 guidance unchanged at 51-55 mmboe, driven by new projects on-line (Reindeer/Devil Creek, Spar, Chim Sáo and Wortel)
Sales revenue increased by 14%
$m
2,489
2,7622,530
2 500
3,000
Sales revenue
2,181 2,228
0
500
1,000
1,500
2,000
2,500
10
02007 2008 2009 2010 2011
Oil Sales gas, ethane and LNG Condensate and LPG
Higher realised prices for all products; oil price up 32% and gas price up 9%
Third party products revenue of $297 millionFor
per
sona
l use
onl
y

6
Production costs increased by 4%
$m 610-640700
$m Cash production costs
449
543 532 537 556
200
300
400
500
600
11
0
100
2007 2008 2009 2010 2011 2012 guidance
2011 costs higher due to flood recovery in the Cooper Basin and commencement of production from Chim Sáo
Higher costs in 2012 with full year contribution from new projects
Net profit increased by 51%
$m 1,650
Net and underlying profit after tax
359
434500
753
404572
257376
453250
500
750
1000
,
1,500
12
02007 2008 2009 2010 2011
NPAT Underlying Profit
Underlying profit of $453 million increased by 20%, with higher commodity prices offset by lower production and a higher effective tax rateFor
per
sona
l use
onl
y

7
Net profit reconciliation
$m
Net profit after tax
1,000500 216 (43) (40) (16) (40) (29) 56 215 (66) 753
500
216 (43)(40)
(16) (40)(29) 56
216 (66)753
300
400
500
600
700
800
900
1,000
13
2010 Prices & foreign
exchange
Sales volumes
Effective tax rate
Other0
100
200
2011Net finance costs
Gain on sale & impairment
Prod’ncosts
DD&A E&E
Net profit after tax 753 500
Significant items after tax
2011 2010$m
Less:Significant items:
Net gains on sales 408 214Net impairment
Bangladesh (79) -Kipper (12) -Cooper Basin (5) (58)Kyrgyz Republic - (24)Other (6) (41)
N t i i t l ( b t t l) (102) (123)
14
Net impairment loss (sub-total) (102) (123)Other (6) 33
Significant items (sub-total) 300 124Underlying net profit 453 376For
per
sona
l use
onl
y

8
Operating cash flow remains strong
1,385
2 3
1,500
$mOperating cash flow
$m1,2141,155
1,273 1,253
300
600
900
1,200
15
02007 2008 2009 2010 2011
Consistent cash flow generation from the base business
Capital expenditure
$m
3,750
3,500
4,000
Capital expenditure
3,069
1,3051,628 1,557
1,882
0
500
1,000
1,500
2,000
2,500
3,000
16
02007 2008 2009 2010 2011 2012 guidance
GLNG Asia (incl PNG LNG) EA WA&NT Exploration Total
Reindeer/Devil Creek, Spar and Chim Sáo on-line during 2011, Wortel in January 2012
2012 guidance unchanged at $3.75 billion; GLNG and PNG LNG on track
For
per
sona
l use
onl
y
9
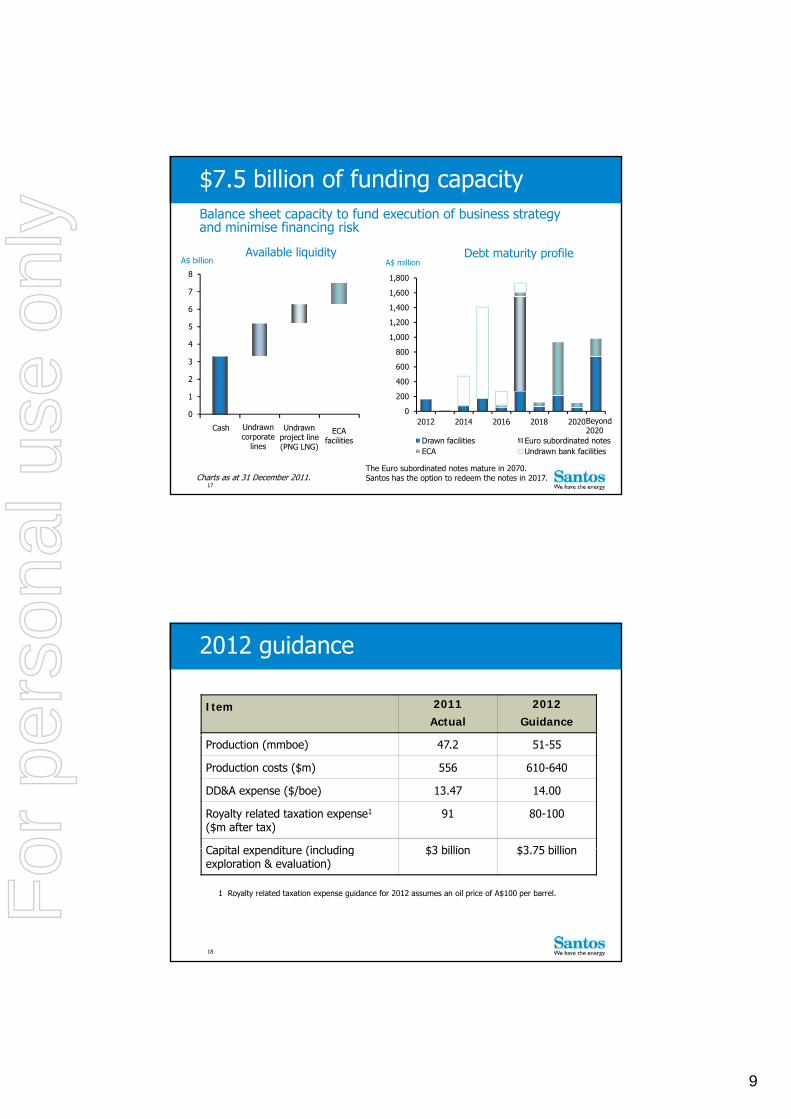
A$ millionAvailable liquidity Debt maturity profile
A$ billion
Balance sheet capacity to fund execution of business strategy and minimise financing risk
$7.5 billion of funding capacity
400
600
800
1,000
1,200
1,400
1,600
1,800
2
3
4
5
6
7
8
17
0
200
400
2012 2014 2016 2018 2020
Drawn facilities Euro subordinated notesECA Undrawn bank facilities
0
1
Cash Undrawn corporate
lines
Undrawn project line(PNG LNG)
The Euro subordinated notes mature in 2070. Santos has the option to redeem the notes in 2017.Charts as at 31 December 2011.
ECA facilities
Beyond 2020
2012 guidance
Item 2011Actual
2012Guidance
Production (mmboe) 47.2 51-55
Production costs ($m) 556 610-640
DD&A expense ($/boe) 13.47 14.00
Royalty related taxation expense1
($m after tax)91 80-100
Capital expenditure (including $3 billion $3 75 billion
18
Capital expenditure (including exploration & evaluation)
$3 billion $3.75 billion
1 Royalty related taxation expense guidance for 2012 assumes an oil price of A$100 per barrel.For
per
sona
l use
onl
y

10
2011 Full-year results David Knox
Managing Director & CEO
Santos vision and strategy
LNG markets
Strong
LNGCHANNEL
DOMESTICCHANNEL
A leading Focused Asian
20
Australian base
A leading gas producer in high-growth
markets
genergy
companyin Australiaand Asia
growth
For
per
sona
l use
onl
y

11
Delivering 80-90 mmboe of production by 2020
Production
b
Reindeer and Wortel now producing; Fletcher Finucane sanctionedUpside potentialAust: Cooper shale, Amadeus, Zola,
Winchester, SoleLNG: PNG LNG T3, Browse, Caldita/Barossa
mmboe
50
60
70
80
90
100
Likely sanctionAust: Gunnedah LNG: Bonaparte LNGAsia: Peluang
SanctionedAust: Fletcher Finucane, Cooper infill,
KipperLNG PNG LNG GLNG
Sanctioned
Likely sanction
Asia: Chim Sáo upside, Dua, Bay of Bengal, Fergana Basin, Indonesia CSG
21
-
10
20
30
40
2011 2012 2013 2014 2015 2016 2017 2018 2019 2020
Producing Aust: Cooper Basin, Carnarvon Basin,
Queensland CSG, offshore VictoriaLNG: Darwin LNGAsia: Chim Sáo, Indonesia, Sangu, SE
Gobe
LNG: PNG LNG, GLNG
Producing
AustraliaAustralia
2012 is an exciting year for Santos
High-impact drilling campaign in Western Australia Fletcher Finucane oil project underway Cooper infill drilling program U ti l l ti i th C Unconventional exploration in the Cooper
GLNG: upstream and pipeline construction commences; LNG plant construction ramps-up
PNG LNG: Hides development drilling program
LNG LNG projectsprojects
22
Wortel producing Peluang FID targeted for late 2012 Significant drilling program: Chim Sáo NW; Indonesia
CSGAsiaAsiaFor
per
sona
l use
onl
y

12
High-impact WA campaign in 2012
Browse Basin gas
Exciting drilling campaign, including three offshore Santos-operated rigs
Territory of Ashmore & Cartier
IslandsBrowse Basin gas Exploration - Crown
Carnarvon Basin gas Appraisal – Zola, Hurricane
Exploration – Winchester, Beam
Carnarvon Basin oil 3 development wells for
CarnarvonBasin
Browse Basin
Indian Ocean
Crown
Hurricane
Hoss
Winchester
Fletcher Finucane
NorthernTerritory
LegendSantos acreageOil fieldGas fieldOil pipelineGas pipeline
23
pFletcher Finucane
5 appraisal & development wells for Stag
Exploration - Hoss, Clark
Western Australia
Devil CreekBeam
Zola
Winchester
Clark
DampierStag
Fletcher Finucane
$490 million gross oil project in the Carnarvon Basin
Sanctioned in January 2012, first oil production expected in 2H 2013
the Carnarvon Basin
Santos is operator with a 48% effective interest
Three-well sub sea tie back to existing Santos operated facility at Mutineer-Exeter
Estimated average gross production rate of 15,000 barrels per day for first year
24
barrels per day for first year
Approximately 14 million barrels of gross 2P reserves
Pipeline route survey, Fletcher Finucane
For
per
sona
l use
onl
y

13
Cooper infill: 6-well pad underway
6 well slots prior to rig mobilisation
Undrilled slots
25
Cooper unconventionalUnconventional resource gas plays to be explored in 2012
Moomba fieldMoomba 191 shale gas well Dedicated vertical shale gas well drilled in
TOOL DARA
ROSE EPSI MTRE REM* shale
Tight sands
Developed conventional
Gross gas thickness
Dedicated vertical shale gas well drilled in December 2011 with cores taken from each of three shale intervals
Microseismic monitored fracture stimulation in Q1 2012
Moomba North shale well Well design in progress for drilling in Q4 2012
First horizontal well, 1000-2000 feet lateral length with multiple stages
Oth ti l
26* Roseneath, Epsilon and Murteree shale zones
PATC
GRANITE
Tight sands and
mixed lithology
Deep coal
thickness ~1600
feetOther unconventional gas resources
Drilling four wells in 2H 2012
Applying contemporary technology, targeting basin centred gas sands and other unconventional horizons including deep coalF
or p
erso
nal u
se o
nly

14
GLNG project
7 8 mtpa US$16 billion two-train project
First LNG exports expected in 2015; construction progressing well
7.8 mtpa, US$16 billion two train project
Santos operator and 30% equity interest
Recent activities include:− Two deliveries of gas transmission pipeline
received
− First 288 accommodation units built on Curtis Island; due to be occupied in March 2012
− Assistance provided with Roma flood
27
Curtis Island construction camp
Assistance provided with Roma flood recovery
Targeting 175 wells to be drilled in 2012
Rig fleet to be updated in 2012; pad drilling to reduce footprint with higher productivity
GLNG plant site, Curtis Island
281 February 20121 February 2012
For
per
sona
l use
onl
y

15
GLNG material offloading facility, Curtis Island
291 February 20121 February 2012
PNG LNG project On track for start-up in 2014
6.6 mtpa, US$15.7 billion two-train development, operated by ExxonMobildevelopment, operated by ExxonMobil
Santos 13.5% equity
Project progressing well, recent milestones include:− Commenced piling work at Hides Gas Conditioning
Plant
− Significant earthworks progress at Komo and first foundation installed for the terminal building
− 100km onshore pipeline and 130km of
LNG tank construction
30
100km onshore pipeline and 130km of offshore pipeline completed
− LNG tank foundation complete and construction underway on outer LNG tank shells
Hides drilling program to commence in 2012, with well targeting the gas/water contact early in sequence. Hides gas conditioning plant
For
per
sona
l use
onl
y

16
PNG LNG plant construction
31
Growth in Indonesia
Wortel delivered in January 2012, on-budget
Wortel delivered on-budget; growth opportunities
Wortelon budget− Extends economic life of Oyong
− Gas prices in excess of US$5/mmbtu
Peluang FID targeted for late 2012− 45 bcf tie-back to Maleo
− Start-up expected in second half 2013
South Sumatra CSG drilling campaign to commence in 1H 2012
MaduraOffshore PSC
East Java
Madura Island
Bali
GratiProcessing
Plant50km
Surabaya
SampangPSC
Wortel
Peluang
32
− Licences located close to pipelines connected to existing markets
− Santos has opportunity to access further acreage
Bali
Legend
Santos acreage
Oil field
Gas field
Oil pipeline
Gas pipelineFor
per
sona
l use
onl
y

17
Vietnam next steps
Duadevelopment
Dua oilfieldChim Sáo north-westoil discovery
Chim Sáo online in October 2011, production 25,000 bbl/day
Chim Sáodevelopmentarea
area
Chim Sáo productionplatform
5km
Chim Sáo oilfield
China
Laos
− Chim Sáo NW to be drilled in Q3 2012
− Explore upside potential of Chim Sáo
− Potential for significant resource additions
Dua development area− Discovered oil resource
− Development concept being worked
Block 123, Phu Khanh Basin3D i i l d f 2012
33
Chim Sáo,Dua
VietnamLegendSantos acreageOil fieldGas fieldOil pipelineGas pipeline
Thailand
Cambodia
− 3D seismic planned for 2012
Block 13/03, Nam Con Son Basin− PSC awarded in December 2011
Summary
Safety: 40% improvement in 3 years Reported full-year profit up 51% to $753 million Strong project delivery $7.5 billion funding capacity
20112011
20122012
Cooper Basin potential continues to be unlocked Three-rig drilling campaign in Western Australia
34
20122012 LNG project construction ramps up Significant drilling campaign in Asia 40% of production subject to oil-linked pricing,
growing to 70% in 2015For
per
sona
l use
onl
y

18
2011 Full-year results 17 February 2012
Reference slidesFor
per
sona
l use
onl
y

19
Production cost and cost of sales
Cash production costs Total cost of sales
1600$m $m600
600
800
1000
1200
1400
1600
Third party product
purchases
Cost of produced
hydrocarbons1$537m $556m
200
250
300
350
400
450
500
550
600
$1,300
$229
$1,333
$162
37
0
200
400
2010 20110
50
100
150
2010 2011
1 Includes production costs, pipeline tariffs, processing tolls and other, royalties, inventory and DD&A
Business unit EBITDAX
1,000
$m Business unit EBITDAX
200
400
600
800
633577
791
641
157111
547
295
38
0
2010 2011EasternAustralia
WA&NT GLNGAsia Pacific Corporateand other
111
(2)48
Corporate and other in 2011 includes gains on sale of 15% of GLNG and Evans ShoalFor
per
sona
l use
onl
y

20
Well Name Basin / Area TargetSantos
Interest%
Timing
Tardrum Bowen CSG 50 Successful
Beam 1 Carnar on 45 Q1
2012 exploration schedule
Beam-1 Carnarvon Gas 45 Q1
Hoss-1 Carnarvon Oil 37.3 Q2
Indonesia CSG South Sumatra CSG 60 Q2/Q3
Chim Sáo NW-1 Nam Con Son Oil 31.875 Q3
Crown-1 Browse Gas 30 Q3
Van Der Waals 1 Cooper Gas 66.6 Q3
Central Asia* Fergana Oil/Gas 100 Q3/Q4
Denison CSG Bowen CSG 50 Q4
39
Gaschnitz 1 Cooper Gas 66.6 Q4
Langmuir 1 Cooper Gas 66.6 Q4
Winchester-1 Carnarvon Gas 75 Q4
Moomba Deep Exploration Cooper Gas 66.6 Q4
Moomba North Shale Cooper Gas 66.6 Q4
Gunnedah CSG Gunnedah CSG Various 2012
The exploration portfolio is continuously being optimised therefore the above program may vary as a result of rig availability, drilling outcomes and maturation of new prospects
* Conditional on final PSC approvals
Contact information
Head officeAdelaideGround Floor, Santos Centre60 Flinders Street
Andrew NairnGroup Executive Investor RelationsLevel 10, Santos CentreDirect: + 61 8 8116 5314
Adelaide, South Australia 5000GPO Box 2455Adelaide, South Australia 5001Telephone: +61 8 8116 5000Facsimile: +61 8 8116 5050
Useful email contactsShare register enquiries:[email protected]
Facsimile: +61 8 8116 5131Email: [email protected]
Nicole WalkerInvestor Relations ManagerLevel 10, Santos CentreDirect: + 61 8 8116 5302Facsimile: +61 8 8116 5131Email: [email protected]
40
q p
Investor enquiries:[email protected]
Website:www.santos.comF
or p
erso
nal u
se o
nly