Embed Size (px)
Citation preview
2016-17 School Accountability Report CardPublished in 2017-18 SARC
Alan Harris, Ph.D. ▪ Principal [email protected]
29147 Auberry Road ▪ Prather, CA 93651 (559) 855-3551 ▪ www.sierrausd.org/fes
Grades K-6 CDS Code 10-75275-0124586
Foothill Elementary School
Sierra USDDr. Melissa Ireland, Superintendent ▪ [email protected] ▪ (559) 855-3662 Sierra Unified School District ▪ 29143 Auberry Road Prather, CA 93651 ▪ www.sierrausd.org
"SOAR-ing to our Eagle best!"

SARC Foothill Elementary School 2
Principal's MessageFoothill Elementary School (FES) is located in a beautiful and spacious setting in the foothills of the Sierra Nevada mountains in the community of Prather, California. As part of the Sierra Unified School District and feeding Sierra Junior and Senior High School, we provide a comprehensive academic program for transitional kindergarten (TK) through sixth grade. Our strong academic program in math, language arts, social stud-ies and science is enhanced by credentialed specialists in physical education, music, literacy, research and technology. Kindergarten through sixth grade students at FES attend physical education, music, or library rotations daily, in addition to receiving excellent core academic instruction. Additionally, with Response to Intervention (RTI), there is a daily focus to challenge students at their specific ability level. The FES facility originally opened in 1994 as Foothill Middle School, and was home to Sierra Unified students in grades 6-8. In 2011, Auberry Elementary, Sierra Elementary and the sixth grade students of Foothill Middle School came together on the Foothill campus to form Foothill Elementary School. Our experienced, highly qualified and committed faculty, many of whom have been in education and this community for 20 years or more, provide students a safe classroom experience that builds a sense of belonging. This inspires students to be their Eagle best. Educators at Foothill work collaboratively to build a community between students, families and staff that is second to none. Education at FES goes beyond the classroom. Students in grades 3-6 have the opportunity to participate in after-school activities that include cross-country, track, guitar club, electronics club, spelling bee, book club, wrestling and more. Additionally, an extended day-care program, Eagle’s Nest, is available at 7:30 a.m. and ends at 6 p.m.
As a mountain community, we are blessed to have diversity. Our students come to school daily on 14 dif-ferent buses and their families’ vehicles from across the mountain. Young scholars from Tollhouse, Auberry, Prather, Shaver and other micro communities come together each day. Three Native American rancherias are served by our school as well as families living in Fresno, Clovis, Shaver, Wishon and more. As a comprehensive elementary, we provide services to students with disabilities in a manner that simultaneously individualizes and integrates their education. We are proud of our reputation as a school where students and families feel comfortable, supported and included. Every student at our school is an asset. Hence, all students are provided the opportunity to get to know themselves and each other as learners, contributing community members, and empowered and authentic human beings. We know rich learning happens when a variety of ideas, opinions, strengths and challenges come together. Our school mascot Kwi’na is a golden eagle who embodies being our best in body, intellect and spirit. As a recognized gold-level Positive Behavioral Intervention and Supports (PBIS) school, every day we SOAR: Show respect, On task, Accountable and Responsible. Like Kwi’na, adults and young scholars alike strive to be our Eagle best and have a great day on the Eagle campus. We hope you will come and see for yourself this school on a hill where excellence happens every day.Alan Harris, Ph.D.
District Mission StatementOur mission is to inspire, engage, chal-lenge, and support all students to reach their highest level of learning and per-sonal development.
District Vision StatementOur vision is to be an exemplary, student-focused school district that is highly re-garded for the competence and character of our students; the rich connection to our mountain community; and the excellence of our people, programs, and learning environment.
Parental InvolvementFoothill Elementary School has a very active Parent Faculty Association (PFA). PFA annually sponsors fund-raisers, a school carnival, Grandparent’s Day celebration, schoolwide assemblies and several other activities. Efforts have provided funding for computers, classroom materials, field trips, landscaping and playground equipment. We also have parents serving in elected positions on our School Site Council (SSC), who monitor our use of funds and other categorical funds. Meetings are held throughout the year, and all meetings are open to the public. The group Volunteers in Public Service (VIPS) was formed by members of our community to provide all types of volunteers for our school and district. They have helped renovate classrooms, poured concrete, installed bulletin boards, installed sandboxes and other play equipment, and offer classroom sup-port as well. Please contact our office if you are interested in becoming more involved in our children’s education. Parent and guardian volunteers are welcome to participate in the classroom, library and at any PFA activity. For more information on how to become involved, contact the PFA president, Lauri King (559) 855-3551.
School SafetyOur school site has a Safe School Plan that is reviewed and updated annually with completion by March. Plans are reviewed with staff annually. The Foothill Elementary School Site Council approves our Safe School Plan. Emergency drills are conducted to prepare students and staff in the event of an emergency. We strive to maintain a safe, healthful, nurturing and orderly school campus that encourages positive attitudes in stu-dents and staff. A joint effort between students and staff help keep the campus clean and litter-free. Site staff surveys our campus as the first order of business each day. They ensure the campus is clean, any vandalism is corrected, and that the campus is presentable and representative of the priority of the Sierra Unified School Board sets on safety and appearance. This site’s Safe School Plan was reviewed with site staff in August 2017.
Governing BoardRon EldridgeChrissy FalkDon FowlerTom MendenhallNorm SaudeConnie SchlaeferBert Weldon
School Accountability Report Card In accordance with state and federal requirements, the School Accountability Report Card (SARC) is put forth annually by all public schools as a tool for parents and interested parties to stay informed of the school’s progress, test scores and achievements.

SARC Foothill Elementary School 3
2014-15 2015-16 2016-17
GradeNumber of Students
1-20 21-32 33+ 1-20 21-32 33+ 1-20 21-32 33+
K 2 2 2 2 4
1 4 4 4
2 4 1 3 4
3 4 4 4
4 3 3 3
5 2 1 2 1 3
6 3 3 3
Three-Year DataNumber of Classrooms by Size
Suspensions and ExpulsionsThis table shows the school, district, and state suspension and expulsion rates for the most recent three-year period. Note: Students are only counted one time, re-gardless of the number of suspensions.
Foothill ES
14-15 15-16 16-17
Suspension rates 1.9% 3.2% 3.0%
Expulsion rates 0.0% 0.0% 0.0%
Sierra USD
14-15 15-16 16-17
Suspension rates 9.6% 6.3% 5.2%
Expulsion rates 0.0% 0.1% 0.0%
California
14-15 15-16 16-17
Suspension rates 3.8% 3.7% 3.6%
Expulsion rates 0.1% 0.1% 0.1%
Suspension and Expulsion Rates
Enrollment by Student GroupThe total enrollment at the school was 653 students for the 2016-17 school year. The pie chart displays the percentage of students enrolled in each group.
2016-17 School YearDemographics
Socioeconomically disadvantaged 53.30% English
learners 1.70% Students with disabilities 10.40% Foster
youth 0.90%
Hispanic or Latino19.3%
American Indian or Alaska Native
15.6%
Asian0.8%
Filipino1.7%
Black or African-American
0.9%
White60.8%
Two or More Races0.9%
Class Size DistributionThe bar graph displays the three-year data for average class size, and the table displays the three-year data for the number of classrooms by size. The number of classes indicates how many classrooms fall into each size category (a range of total students per classroom). At the secondary school level, this information is reported by subject area rather than grade level.
15-1614-15 16-17
Three-Year DataAverage Class Size
K 1 2 3 4 5 6
2123 22 24
27
32 30
2022 21
2326
3229
2521 22 22
34
26
34
Enrollment by GradeThe bar graph displays the total number of students enrolled in each grade for the 2016-17 school year.
2016-17 Enrollment by Grade
K
1
2
3
4
5
6
117
85
88
87
98
79
99
SARC Foothill Elementary School 4
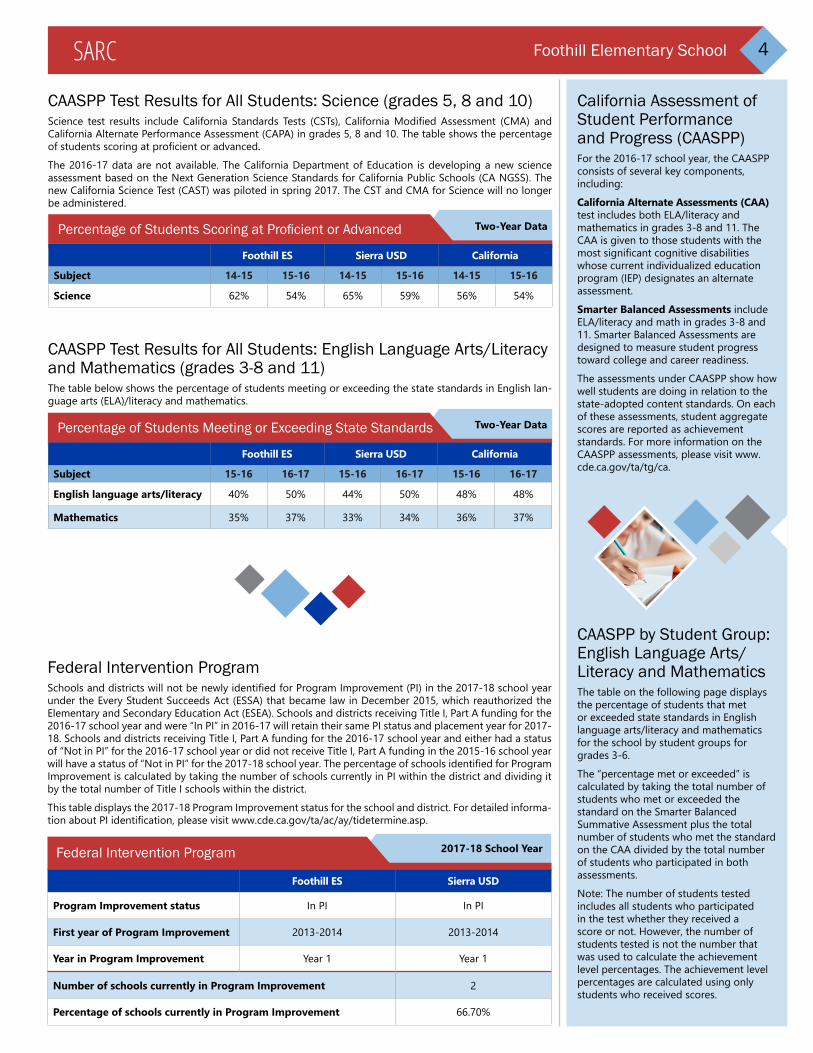
CAASPP by Student Group: English Language Arts/Literacy and MathematicsThe table on the following page displays the percentage of students that met or exceeded state standards in English language arts/literacy and mathematics for the school by student groups for grades 3-6.The “percentage met or exceeded” is calculated by taking the total number of students who met or exceeded the standard on the Smarter Balanced Summative Assessment plus the total number of students who met the standard on the CAA divided by the total number of students who participated in both assessments.Note: The number of students tested includes all students who participated in the test whether they received a score or not. However, the number of students tested is not the number that was used to calculate the achievement level percentages. The achievement level percentages are calculated using only students who received scores.
CAASPP Test Results for All Students: English Language Arts/Literacy and Mathematics (grades 3-8 and 11)The table below shows the percentage of students meeting or exceeding the state standards in English lan-guage arts (ELA)/literacy and mathematics.
Foothill ES Sierra USD California
Subject 15-16 16-17 15-16 16-17 15-16 16-17
English language arts/literacy 40% 50% 44% 50% 48% 48%
Mathematics 35% 37% 33% 34% 36% 37%
Percentage of Students Meeting or Exceeding State Standards Two-Year Data
California Assessment of Student Performance and Progress (CAASPP)For the 2016-17 school year, the CAASPP consists of several key components, including: California Alternate Assessments (CAA) test includes both ELA/literacy and mathematics in grades 3-8 and 11. The CAA is given to those students with the most significant cognitive disabilities whose current individualized education program (IEP) designates an alternate assessment.Smarter Balanced Assessments include ELA/literacy and math in grades 3-8 and 11. Smarter Balanced Assessments are designed to measure student progress toward college and career readiness.
The assessments under CAASPP show how well students are doing in relation to the state-adopted content standards. On each of these assessments, student aggregate scores are reported as achievement standards. For more information on the CAASPP assessments, please visit www.cde.ca.gov/ta/tg/ca.
CAASPP Test Results for All Students: Science (grades 5, 8 and 10)Science test results include California Standards Tests (CSTs), California Modified Assessment (CMA) and California Alternate Performance Assessment (CAPA) in grades 5, 8 and 10. The table shows the percentage of students scoring at proficient or advanced. The 2016-17 data are not available. The California Department of Education is developing a new science assessment based on the Next Generation Science Standards for California Public Schools (CA NGSS). The new California Science Test (CAST) was piloted in spring 2017. The CST and CMA for Science will no longer be administered.
Foothill ES Sierra USD California
Subject 14-15 15-16 14-15 15-16 14-15 15-16
Science 62% 54% 65% 59% 56% 54%
Percentage of Students Scoring at Proficient or Advanced Two-Year Data
Foothill ES Sierra USD
Program Improvement status In PI In PI
First year of Program Improvement 2013-2014 2013-2014
Year in Program Improvement Year 1 Year 1
Number of schools currently in Program Improvement 2
Percentage of schools currently in Program Improvement 66.70%
2017-18 School YearFederal Intervention Program
Federal Intervention ProgramSchools and districts will not be newly identified for Program Improvement (PI) in the 2017-18 school year under the Every Student Succeeds Act (ESSA) that became law in December 2015, which reauthorized the Elementary and Secondary Education Act (ESEA). Schools and districts receiving Title I, Part A funding for the 2016-17 school year and were “In PI” in 2016-17 will retain their same PI status and placement year for 2017-18. Schools and districts receiving Title I, Part A funding for the 2016-17 school year and either had a status of “Not in PI” for the 2016-17 school year or did not receive Title I, Part A funding in the 2015-16 school year will have a status of “Not in PI” for the 2017-18 school year. The percentage of schools identified for Program Improvement is calculated by taking the number of schools currently in PI within the district and dividing it by the total number of Title I schools within the district. This table displays the 2017-18 Program Improvement status for the school and district. For detailed informa-tion about PI identification, please visit www.cde.ca.gov/ta/ac/ay/tidetermine.asp.

SARC Foothill Elementary School 5
CAASPP Results by Student Group: English Language Arts and Mathematics (grades 3-6)
v Scores are not shown when the number of students tested is 10 or fewer, either because the number of students tested in this category is too small for statistical accuracy or to protect student privacy.
English Language Arts
Group Total Enrollment Number Tested Percentage Tested Percentage Met or Exceeded
All students 367 362 98.64% 50.00%
Male 173 170 98.27% 44.12%
Female 194 192 98.97% 55.21%
Black or African-American v v v v
American Indian or Alaska Native 60 59 98.33% 25.42%
Asian v v v v
Filipino v v v v
Hispanic or Latino 74 73 98.65% 42.47%
Native Hawaiian or Pacific Islander v v v v
White 222 219 98.65% 59.36%
Two or more races v v v v
Socioeconomically disadvantaged 195 194 99.49% 36.60%
English learners v v v v
Students with disabilities 51 48 94.12% 8.33%
Students receiving Migrant Education services v v v v
Foster youth v v v v
Mathematics
Group Total Enrollment Number Tested Percentage Tested Percentage Met or Exceeded
All students 365 360 98.63% 36.67%
Male 171 168 98.25% 37.50%
Female 194 192 98.97% 35.94%
Black or African-American v v v v
American Indian or Alaska Native 58 57 98.28% 21.05%
Asian v v v v
Filipino v v v v
Hispanic or Latino 74 73 98.65% 28.77%
Native Hawaiian or Pacific Islander v v v v
White 222 219 98.65% 43.38%
Two or more races v v v v
Socioeconomically disadvantaged 193 192 99.48% 27.60%
English learners v v v v
Students with disabilities 51 48 94.12% 8.33%
Students receiving Migrant Education services v v v v
Foster youth v v v v
Percentage of Students Meeting or Exceeding State Standards 2016-17 School Year

SARC Foothill Elementary School 6
Textbooks and Instructional MaterialsTextbooks are selected by content-area teachers who utilize California Department of Education listings and guides to determine materials that adequately cover the state standards students are expected to master, provide intervention materials for English learners and special education students, are teacher and student friendly, and will work with the Sierra Unified instructional program. A thorough review of the programs is conducted with input from staff, including teaching sample lessons from programs being reviewed. From this process, a recommendation is made to the Board of Education. The Sierra Unified District notifies school site councils and publishes the notification in the regular board agenda of the proposed material adoption and displays the materials publicly for review at the site and district office. Public may comment at the board meeting when adoption is scheduled for approval or leave comments with the site or district office staff.The board votes to approve materials at a regularly scheduled meeting.Each fall, the board reviews textbook and instructional material sufficiency. A hearing is publicly announced and is held during a regularly scheduled board meeting. Public comment is invited via an announcement in the newspaper of the meeting and materials sufficiency hearing.
Quality of TextbooksThe following table outlines the criteria required for choosing textbooks and instructional materials.
Criteria Yes/No
Are the textbooks adopted from the most recent state-approved or local governing-board-approved list? Yes
Are the textbooks consistent with the content and cycles of the curriculum frameworks adopted by the State Board of Education? Yes
Do all students, including English learners, have access to their own textbooks and instructional materials to use in class and to take home? Yes
Quality of Textbooks 2017-18 School Year
Currency of TextbooksThis table displays the date when the most recent hearing was held to adopt a resolution on the sufficiency of instructional materials.
Data collection date 9/11/2017
Currency of Textbooks 2017-18 School Year
Subject Textbook Adopted
English language arts World of Wonders, McGraw-Hill (TK) 2016
English language arts Wonders, McGraw-Hill (K-6) 2016
Mathematics EngageNY 2014
Science Scott Foresman Science 2008
Science Earth Science, Holt 2007
History/social science Social Studies, Harcourt Brace 2000
History/social science Social Studies, McDougal Littell 2006
Textbooks and Instructional Materials List 2017-18 School Year
Types of Services FundedGeneral State of California funding sup-ports overall services to students. In addi-tion, Sierra Unified School District receives state and federal categorical funds for special programs. Categorical or spe-cial funds are provided to Sierra Unified Schools in accordance with the specified criteria of that funding source. Funding, in most instances, is based on attendance.
Availability of Textbooks and Instructional MaterialsThe following lists the percentage of pupils who lack their own assigned text-books and instructional materials.
Percentage of Students Lacking Materials by Subject
2017-18 School Year
Reading/language arts 0%
Mathematics 0%
Science 0%
History/social science 0%
Visual and performing arts 0%
Foreign language ²
Health ²
² Not applicable.

SARC Foothill Elementary School 7
Deficiencies and RepairsThe table lists the repairs required for all deficiencies found during the site inspection. Regardless of each item’s repair status, all deficiencies are listed.
2017-18 School YearDeficiencies and Repairs
Items Inspected Deficiencies and Action Taken or Planned Date of Action
Restrooms/fountainsReplace the drinking fountains on the outside of the multipurpose room. The replacement is scheduled.
12/30/2017
School FacilitiesFoothill Elementary was built in 1994 and has been maintained on a regular basis. There are 33 classrooms, three computer labs, a library media center, multipurpose room/cafeteria, gymnasium with two locker rooms, office complex, and vast playground and sports field space. The school is cleaned on a daily basis, and deep cleaning is scheduled over the summer. There are three night custodians and one who works the day shift. The school is in very good condition overall.Supervision schedules are in place to ensure students are kept safe before, during and after school. Playgrounds are inspected daily by staff and formally inspected at the end of each trimester by the site principal.
School Facility Good Repair Status The table shows the results of the school’s most recent inspection using the Facility Inspection Tool (FIT) or equivalent school form. This inspection determines the school facility’s good repair status using ratings of good condition, fair condition or poor condition. The overall summary of facility conditions uses ratings of exemplary, good, fair or poor.
Items Inspected Repair Status
Systems: Gas leaks, sewer, mechanical systems (heating, ventilation and HVAC) Good
Interior: Interior surfaces (floors, ceilings, walls and window casings) Good
Cleanliness: Pest/vermin control, overall cleanliness Good
Electrical: Electrical systems Good
Restrooms/fountains: Restrooms, sinks and drinking fountains Good
Safety: Fire safety, emergency systems, hazardous materials Good
Structural: Structural condition, roofs Good
External: Windows/doors/gates/fences, playgrounds/school grounds Good
Overall summary of facility conditions Exemplary
Date of the most recent school site inspection 10/11/2017
Date of the most recent completion of the inspection form 10/11/2017
School Facility Good Repair Status 2017-18 School Year
Public Internet AccessInternet access is available at public libraries and other locations that are publicly accessible (e.g., the Califor-nia State Library). Access to the internet at libraries and public locations is generally provided on first-come, first-served basis. Other use restrictions include the hours of operation, the length of time that a workstation may be used (depending on availability), the types of software programs available at a workstation, and the ability to print documents.
California Physical Fitness TestEach spring, all students in grades 5, 7 and 9 are required to participate in the California Physical Fitness Test (PFT). The Fitnessgram is the designated PFT for students in California public schools put forth by the State Board of Education. The PFT measures six key fitness areas:
1. Aerobic Capacity 2. Body Composition3. Flexibility4. Abdominal Strength and Endurance5. Upper Body Strength and Endurance6. Trunk Extensor Strength and
FlexibilityEncouraging and assisting students in establishing lifelong habits of regular physical activity is the primary goal of the Fitnessgram. The table shows the percentage of students meeting the fitness standards of being in the “healthy fitness zone” for the most recent testing period. For more detailed informa-tion on the California PFT, please visit www.cde.ca.gov/ta/tg/pf.
Percentage of Students Meeting Fitness Standards
2016-17 School Year
Grade 5
Four of six standards 16.70%
Five of six standards 15.40%
Six of six standards 55.10%

SARC Foothill Elementary School 8
² Not applicable.
Teacher QualificationsThis table shows information about teacher credentials and teacher qualifications. Teachers without a full cre-dential include teachers with district and university internships, pre-internships, emergency or other permits, and waivers. For more information on teacher credentials, visit www.ctc.ca.gov.
Three-Year Data
Sierra USD Foothill ES
Teachers 17-18 15-16 16-17 17-18
With a full credential 65 33 30 31
Without a full credential 2 0 2 2
Teaching outside subject area of competence (with full credential) 0 0 0 0
Teacher Credential Information
Teacher Misassignments and Vacant Teacher PositionsThis table displays the number of teacher misassignments (positions filled by teachers who lack legal au-thorization to teach that grade level, subject area, student group, etc.) and the number of vacant teacher positions (not filled by a single designated teacher assigned to teach the entire course at the beginning of the school year or semester). Please note that total teacher misassignments includes the number of teacher misassignments of English learners.
Three-Year Data
Foothill ES
Teachers 15-16 16-17 17-18
Teacher misassignments of English learners 0 0 0
Total teacher misassignments 0 0 0
Vacant teacher positions 0 0 0
Teacher Misassignments and Vacant Teacher Positions
Academic Counselors and School Support StaffThis table displays information about aca-demic counselors and support staff at the school and their full-time equivalent (FTE).
Academic Counselors and School Support Staff Data
2016-17 School Year
Academic Counselors
FTE of academic counselors 0.0
Average number of students per academic counselor ²
Support Staff FTE
Social/behavioral counselor 0.0
Career development counselor 0.0
Library media teacher (librarian) 0.0
Library media services staff (paraprofessional) 1.0
Psychologist 1.0
Social worker 0.0
Nurse 0.0
Speech/language/hearing specialist 1.6
Resource specialist (nonteaching) 0.0
Professional DevelopmentAll teachers are provided with five full days of professional development districtwide. In addition, early re-lease days are provided twice a month for collaboration and additional professional development. Outside professional-development opportunities are available based on our students’ and teachers’ needs. Teachers in Sierra Unified have completed professional-training courses designed to support educational priorities and objectives. Staff development days are designed to provide continuous learning opportunities for ad-ministrators, teachers and classified personnel. Sierra Unified uses staff development days and support from site-level coaches to assist teachers in classroom instructional strategies and engagement. The district pro-vided a strong base for English language arts implementation over the last few years through professional development focused on academic vocabulary, content reading and writing, as well as thinking maps. The district will continue to provide extensive math training focused on the mathematical strategies and math standards. Additionally 12 teachers have been trained and received certificate of completion as positive discipline teachers. By the 2019 school year, 100 percent of teachers and instructional assistants will trained in positive discipline methodologies and strategies. New-to-the-profession teachers are also supported through the Beginning Teacher Support and Assessment (BTSA) Induction program. Teachers participating in BTSA receive support from a trained support provider for two years. In addition this year, the district will provide further site-specific safety training.
2015-16 2016-17 2017-18
Foothill ES 4 days 4 days 4 days
Professional Development Days Three-Year Data

Data for this year’s SARC was provided by the California Department of Education and school and district offices. For additional information on California schools and districts and comparisons of the school to the district, the county and the state, please visit DataQuest at http://dq.cde.ca.gov/dataquest. DataQuest is an online resource that provides reports for accountability, test data, enrollment, graduates, dropouts, course enrollments, staffing and data regarding English learners. Per Education Code Section 35256, each school district shall make hard copies of its annually updated report card available, upon request, on or before February 1.All data accurate as of November 2017.
School Accountability Report Card
PUBLISHED BY:
www.sia-us.com | 800.487.9234
SARC Foothill Elementary School 9
Financial Data The financial data displayed in this SARC is from the 2015-16 fiscal year. The most current fiscal information available provided by the state is always two years behind the current school year and one year behind most other data included in this report. For detailed information on school expenditures for all districts in Califor-nia, see the California Department of Education (CDE) Current Expense of Education & Per-pupil Spending web page at www.cde.ca.gov/ds/fd/ec. For information on teacher salaries for all districts in California, see the CDE Certificated Salaries & Benefits web page at www.cde.ca.gov/ds/fd/cs. To look up expenditures and salaries for a specific school district, see the Ed-Data website at www.ed-data.org.
School Financial DataThe following table displays the school’s average teacher salary and a breakdown of the school’s expenditures per pupil from unrestricted and restricted sources.
School Financial Data
2015-16 Fiscal Year
Total expenditures per pupil $6,125
Expenditures per pupil from restricted sources $1,134
Expenditures per pupil from unrestricted sources $4,991
Annual average teacher salary $63,623
Financial Data ComparisonThis table displays the school’s per-pupil expenditures from unrestricted sources and the school’s average teacher salary and compares it to the district and state data.
2015-16 Fiscal Year
Expenditures Per Pupil From
Unrestricted SourcesAnnual Average Teacher Salary
Foothill ES $4,991 $63,623
Sierra USD $10,239 $64,077
California $6,574 $62,381
School and district: percentage difference -51.3% -0.7%
School and California: percentage difference -24.1% +2.0%
Financial Data Comparison Expenditures Per PupilSupplemental/restricted expenditures come from money whose use is controlled by law or by a donor. Money that is desig-nated for specific purposes by the district or governing board is not considered restricted. Basic/unrestricted expenditures are from money whose use, except for general guidelines, is not controlled by law or by a donor.
District Financial DataThis table displays district teacher and administrative salary information and compares the figures to the state averages for districts of the same type and size based on the salary schedule. Note: The district salary data does not include benefits.
2015-16 Fiscal Year
Sierra USD Similar Sized District
Beginning teacher salary $39,557 $41,164
Midrange teacher salary $61,378 $61,818
Highest teacher salary $76,144 $84,567
Average elementary school principal salary $95,200 $96,125
Average middle school principal salary ± $103,336
Average high school principal salary $101,275 $101,955
Superintendent salary $142,310 $126,855
Teacher salaries: percentage of budget 32% 32%
Administrative salaries: percentage of budget 4% 6%
District Salary Data