Embed Size (px)
Citation preview

International Journal of the Physical Sciences Vol. 6 (22), pp. 5153-5165, 2 October, 2011 Available online at http://www.academicjournals.org/IJPS DOI: 10.5897/IJPS11.705 ISSN 1992 - 1950 ©2011 Academic Journals
Full Length Research Paper
Finite element analysis (FEA) modeling on adhesive joint for composite fuselage model
F. Mustapha1, N. W. Sim1 and A. Shahrjerdi2*
1Department of Aerospace Engineering, Universiti Putra Malaysia, 43400 UPM Serdang, Selangor, Malaysia.
2Department of Mechanical Engineering, Malayer University, Iran.
Accepted 7 June, 2011
In this paper, a finite element modeling via ABAQUS/Explicit simulation on a novel fabrication miniature composite fuselage structure is presented. The fuselage structure is modeled as a continuum composite layup that consisted of a woven C-glass fiber/epoxy 200 g/m
2 composite laminated [908] with
the orthotropic elastic material properties and adhesively bonded butt joint. The adhesively bonded joint progression is modeled using cohesive elements technology. For the purpose of FEA modeling, an experiment of double cantilever beam (DCB) according to ASTM standard D5528 is performed to determine the adhesive mode-I critical toughness. The mode-I interlaminar fracture toughness data (GI) are calculated and compared by four different methods according to the ASTM standard: BT, beam theory, MBT, modified beam theory, CC, compliance calibration method and MCC, modified compliance calibration method. The results indicate that ABAQUS/Explicit is able to reproduce satisfactory adhesive joint behavior using cohesive elements and collapse modes under crushing process. Key words: Adhesively bonded joint, composite, fuselage structure, fracture toughness, finite element analysis (FEA).
INTRODUCTION Composite manufacturing process is a well-established branch of research in engineering materials and technology. For the past years, aircraft structures were made usually of aluminium, a material with great capacity for plastic deformation, hence, a natural capability to absorb energy in crash situations. In recent years, composite materials are employed more widely to construct aircraft structures such as control surfaces for aircraft parts. This research focuses on modeling of a novel fabrication technique of a miniature composite fuselage. One of the methods to fabricate fuselage structures is composite manufacturing process of filament winding. However, the disadvantages of this method can be formulated in terms of expensive equipment, long production times and lack of flexibility regarding the shape of the object to be wound (Koussios et al., 2004). Dahdi et al. (2009) have successfully developed a novel fabrication technique of a miniature composite fuselage. The objective of this novel fabrication is to evaluate the *Corresponding author. E-mail: [email protected].
possibility of using combining mould technique to replace the technique of filament winding by integrating woven fiber composite laminated with adhesive butt joint to sustain axial compression impact from debonding failure. The success of the aforementioned novel fabrication technique encouraged the authors to further investigate the potential of this novel fabrication technique to implement in real aerospace world.
Based on Travesa (2006), computer simulations are referred as “virtual mechanical testing” to increase the reliability and to decrease the number of required tests to certify a composite structure. ABAQUS/Explicit was employed in this research as an FEA modeling software. The reliability of ABAQUS in the performance of the non-linear analysis on crushing analysis has been proved from the literatures. Furthermore, ABAQUS offer composite layups to facilitate the composite model set up and cohesive elements technology that allows user to define the material properties in modeling the progressive damage of adhesive bonded joint. There is reasonable amount of crushing simulation work done using ABAQUS. Bisagni (2005) studied the dynamic buckling due to impulsive loading of thin-walled carbon fiber

5154 Int. J. Phys. Sci.
Figure 1. Typical fracture mode of adhesive bonded joint
specimens (Sharifi and Choupani, 2008).
reinforced plastics (CFRP) shell structures under axial compression. The approach adopted is based on the equations of motion, which are numerically solved using a finite element code (ABAQUS/Explicit) and using numerical models validated by experimental static buckling tests. In recent studies by Tafreshi (2006, 2004), modeling of delaminated composite cylindrical shells under axial compression were considered and material was assumed to be linear. An experimental investigation into crushing behaviour of filamanent-wound laminated cone-cone intersection composite shell under uniform axial load and nonlinear finite element analysis using ABAQUS/Explicit on axially crushed cotton fibre composite corrugated tubes were presented (Mahdi et al., 2001, 2006). Tarfaoui et al. (2008) investigated both experimentally and numerically dynamic response and damage modeling of filament wound glass/epoxy tubes. Crush simulation and experimental validation on filament wound C-glass fiber/epoxy 200 g/m
2 miniature fuselage
have been carried out (Yidris and Mokhtar, 2007). In recent studies, the applicability of the cohesive element in predicting failure of adhesive joint has been presented in publications. Cohesive element was implemented for the simulation of delamination in fiber composites and crack propagation in adhesive joints (Fan et al., 2008). The model adopts a bilinear damage evolution law and uses critical energy release rate as the energy required for generating fully damaged unit area via ABAQUS/ Explicit through the user subroutine (VUMAT). The traction-separation law have been employed in the Wimmer et al. (2006) investigation. Interface elements and the traction-separation law described are available in ABAQUS. Damage mechanics of composite laminates was studied via cohesive element and ABAQUS can also be found in Seyed and Tamin’s (2009) research.
In this paper, an FEA model on composite cylindrical structures with adhesively bonded butt joint under axial
compression is proposed to investigate the structures strength and collapse modes. A DCB experimental test according to ASTM standard D5528 is first performed to determine the mode-I critical toughness of adhesive that is required to FEA modeling. It is noted that, the mechanical behavior of the adhesive, and hence, the modeling was designed to avoid extensive deformation of the adherends. Thus, material nonlinearities of intralaminar and interlaminar failure modes for a composite adherend are not taken into account in this research. These studies mainly addressed crushing load and collapse modes and debonding failure between adhesive and adherent on the miniature fuselage model. A progressive failure analysis on adhesive bonded joint has been demonstrated to simulate the damage initiation and evolution from initially uncracked surfaces until final failure in predicting the damage and mechanical strength. Composite element characteristics ABAQUS models a continuum shell composite layup using continuum shell elements that fully discretize an entire three-dimensional body. The thickness is determined from the element nodal geometry. Continuum shell elements have only displacement degrees of freedom. From a modeling point of view, continuum shell elements look like three-dimensional continuum solids, but their kinematic and constitutive behavior is similar to conventional shell elements and based on shell theory. Continuum shell composite layups are composed of plies made of different materials in different orientations. A layup can contain a different number of plies in different regions. Continuum shell composite layups are expected to have a single element through their thickness, and that single element contains multiple plies. The stacking direction of the continuum shell elements in the layup allows ABAQUS to model the through-thickness response more accurately. In addition, continuum shell composite layups take into account a double-sided contact and thickness change, which provides more accurate contact modeling than conventional shell composite layups. Hence, it is used in the proposed modeling.
Cohesive element Adhesive, cohesive and delamination are the three main failure types in adhesively bonded joints (Figure 1). Adhesive failure occurring is mainly due to interfacial cracking (debonding) at geometric boundaries due to stress concentrations caused by separation of adhesives from adherend. Well-bonded joints should fail within the adhesive layer (cohesive failure) or within the adherends (interlaminar failure/delamination) when broken (Sharifi and Choupani, 2008; Kang et al., 2005). The special features of this study are that the cracks are

Figure 2. The three modes of crack loading (Haugen, 1998).
Figure 3. DCB test specimen (Sim, 2010).
modelled by a special type of ‘‘cohesive elements” in the general-purposed finite element analysis package (ABAQUS, 2007). The cohesive elements, only available in ABAQUS version 6.5 or higher, are designed to model bonded interfaces (Yang et al., 2009). Cohesive elements are used to model crack initiation and propagation along a predefined interface. In ABAQUS, the constitutive response of cohesive elements may be based on a continuum description of the material or a traction-separation description of the interface. The continuum description is suitable when the actual thickness of the interface is being modeled. Alternatively, the traction-separation description is suitable when the thickness of the interface can be considered to be zero (if the thickness of the interface is negligibly small as compared to that of the adjoining bodies), and cohesive elements with zero geometric thickness is used in the proposed modeling. In the case of cohesive elements with traction-separation behaviour, the parameters characterizing the traction-separation relationship must be specified, including the initial stiffness, damage initiation threshold, and damage evolution properties. The initial stiffness of cohesive elements defined in terms of traction-separation does not represent a physically measurable quantity and is treated as a penalty parameter. Ideally, the stiffness of the cohesive element should be infinite so that they do
Mustapha et al. 5155 not affect the overall compliance of the model before the damage initiation point; however, a finite value must be used in the finite element context. The damage initiation point corresponds to the peak value of the traction-separation relationship, that is, the strength of the interface. The strength of the interface is a physically measurable quantity, although it may be difficult to measure it experimentally. However, for modeling fracture in many other materials, the strength may be difficult to obtain. Damage evolution The damage evolution of cohesive elements defined in terms of traction separation is described by the fracture toughness of the interface. The fracture toughness (or the critical energy release rate) is usually available in literature or handbooks for many material systems or it can be determined from experiments in conjunction with appropriate analysis of standardized test configuration. A complete definition of the cohesive elements when energy-based damage evolution is used requires at least 9 material parameters for initial stiffness, strength and fracture toughness (that is, mode I, II and III). As shown in Figure 2, mode-I is a pure opening mode, caused by stresses acting normal to the crack plane. Mode-II is an in-plane shear mode, and mode-III is an out-of-plane shearing mode (Haugen, 1998). In addition, when cohesive elements are used in a dynamic analysis the density of the interface must also be specified. If there is mixed-mode dependence in the evolution of damage, one additional parameter for the mode mixity criterion is also required.
It is noted that, simulation of the fuselage needs some adhesively bonded butt joint material properties, such as fracture toughness. It can be extracted by experimental results in the following experiment. Adhesive fracture energy In the following, the bond strength of composite via a fracture toughness test consisted of specimen pre-paration, test procedures and the outputs are discussed. In the experimental parts, the tests were performed on pre-cracked double cantilever beam (DCB) coupons designed to permit fracture toughness determination according to ASTM standard D5528-01 mode-I loading (Benzeggagh and Kenane, 1996; Biel and Stigh, 2007; Mathews and Swanson, 2007). The fracture toughness for mode-II and mode-III are assumed same as mode-I. The DCB geometry used during this experiment is illustrated in Figure 3. Measurements of the crack opening displacement (δ), the applied loading (P) and the crack length (a) were measured. The goal was to assess the critical value of the energy-release rate (G) on mode-I

5156 Int. J. Phys. Sci.
Figure 4. Schematic diagram of the composite samples (Sim, 2010).
Table 1. Dimensions of the samples for delamination testing parameter.
Testing parameter Dimension (mm)
L 127
b 25
a 30
H 3.5
Figure 5. Composite samples.
delamination, which was chosen as the interlaminar fracture toughness. Thus, it can be focused mainly on the experimental procedures rather than the analytical solutions.
METHODOLOGY ASTM D5528-01 (test specimens)
A sample is prepared in the experimental test. The used specimens (C-glass fiber/epoxy 200 g/m
2) were rectangular strips denoted as
DCB having dimensions l × b = (127 × 25) mm (Figure 4).
Figure 6. Side view of a prepared sample. Markings are
spaced 1 mm apart until the 15 mm. After that, they are spaced 5 mm apart.
Figure 7. Chains hinged to loading blocks.
Manufacturing process was according to the specifications of ASTM standard D5528-01 and the dimensions are shown in Table 1. Two specimens of [455] are bonded together with the mixture of epoxy and resin composition in a ration of 2:1. The dashed line in Figure 4 indicates the location of the initial crack between the middle lamina of the composite where the adhesive is not applied. Two hinges that are tabbed on the top of the tip of the specimens perform as a loading block.
Test The edge of specimen was marked every millimetre beyond the initial crack location for the first 15 mm, and then, it was marked every 5 mm for a distance up to 40 mm from the initial crack tip. A side-view schematic of the specimen prior to testing is shown in Figures 5 and 6.
As shown in Figures 7 and 8, chain is hinged to the two loading block, respectively and specimen was then clamped to the instron machine with 10 KN load cell.
Visual observation of the crack tip was found to be challenging at the higher rate tests. The applied loading at a rate between 1 and 5 mm/min was recommended in ASTM 5528-01. Hence, the specimens were tested in a displacement mode with a constant displacement rate of 2 mm/min. The extension of the delamination front ‘a’ was observed and the crack opening displacement (δ) and load (P) corresponding to every 1 mm extension
Mustapha et al. 5157
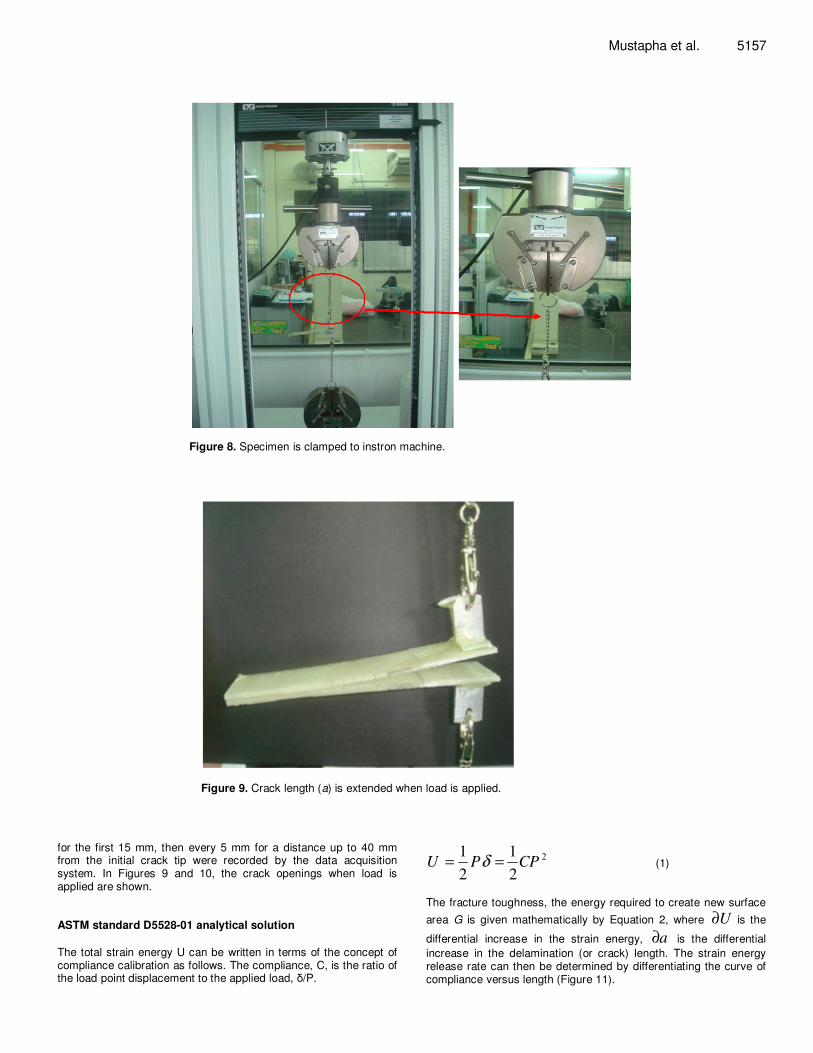
Figure 8. Specimen is clamped to instron machine.
Figure 9. Crack length (a) is extended when load is applied.
for the first 15 mm, then every 5 mm for a distance up to 40 mm from the initial crack tip were recorded by the data acquisition system. In Figures 9 and 10, the crack openings when load is applied are shown. ASTM standard D5528-01 analytical solution
The total strain energy U can be written in terms of the concept of compliance calibration as follows. The compliance, C, is the ratio of the load point displacement to the applied load, δ/P.
21 1
2 2= =U P CPδ (1)
The fracture toughness, the energy required to create new surface
area G is given mathematically by Equation 2, where ∂U is the
differential increase in the strain energy, ∂a is the differential
increase in the delamination (or crack) length. The strain energy release rate can then be determined by differentiating the curve of compliance versus length (Figure 11).

5158 Int. J. Phys. Sci.
Figure 10. Crack opening displacement (δ) is extended when load is applied.
Figure 11. Compliance as a function of crack length.
21
2
∂ ∂= =
∂ ∂
U CG P
a a (2)
The critical value of Gc, is then given as:
21
2=
∂=
∂ cc c a a
CG P
a (3)
For a double-cantilever beam (DCB) specimen, beam theory gives

Mustapha et al. 5159
12
10
8
6
4
2
2 4 6 8 10 12 Displacement (mm)
Lo
ad
ap
plie
d (
N)
Figure 12. DCB Load-displacement curve for test case 1.
the deflection as:
3
2 3=
Pa
EI
δ (4)
where I = bh
3/12. The elastic compliance is shown by Equation 5,
where EI is the bending stiffness.
32
3= =
aC
P EI
δ (5)
The critical strain energy release rate is:
2 22
2
2 3
121 2
2= = c
c c
P aaG P
EI b h E (6)
According to ASTM standard, the mode-I interlaminar fracture toughness GI data were calculated by four different methods: (1) BT: Beam theory; (2) MBT: Modified beam theory; (3) CC: compliance calibration method, and (4) MCC: Modified compliance calibration method. The results of these four models are mentioned subsequently.
RESULTS AND DISCUSSION
The force applied versus crack opening displacement is shown in Figure 12. Prior to propagation of the crack, the stiffness is reflected by the linear relationship between P and δ. The load peaks at 11 N, corresponding to a crack opening displacement of 4.5 mm. Just before the crack advances, the specimen is in an “over-driven” state, which occurs since the initial crack is not ideally sharp.
During this initial crack advance, the load drops abruptly to 7.3 N, then rises slowly with increasing crack opening, reaching a second, much smaller peak of 8.8 N at δ = 6.8 mm. The load drops sharply to 6.3 N and rise to 7.4 N before the specimens fully debonds.
The measured crack opening displacement (δ), crack length (a) and applied load (P) is given in Table 2 and Figure 13, along with the calculated compliance C and each of the three estimates of fracture toughness, G
MBTIc,
Gcc
Ic and GMcc
Ic. Mode-I interlaminar fracture tests of the DCB
composite specimens produced stable crack growth in delamination, which was detected successfully in accordance with ASTM standard, while each of the curves follows the same basic trend. An average overall fracture toughness of GIc = 40 ± 10% J/m
2, where the
uncertainty is given as one standard deviation. This data of GIc = 40 J/m
2 is used in the proposed modeling. There
is no reference data for the fracture energies GIC of glass fiber-reinforced epoxy available in the open literature; therefore, the values were assumed for the numerical computations.
FEA methodology
In general, most composite materials for aerospace applications involved thin-walled structure in the range of 1.8 to 20 mm that can be considered (Dahdi et al., 2009; Yidris and Mokhtar, 2007). In this research, a fuselage structure model consisted of eight-layer composite orthotropic, woven C-glass fiber/epoxy 200 g/m
2 [908]

5160 Int. J. Phys. Sci.
Table 2. Fracture toughness for test case.
Crack length
a(mm)
Crack opening
δ (mm)
Load
P (N)
Compliance
C(mm/N)
1/3C
2/3C Log C Log a a/h MBT CC MCC
-------------J/m2------------------
39 1.775 5.8662 0.3025738 0.6713 0.4507 -0.519 1.5911 9.75 12.2051 14.52563 20.4166
40 2.4698 7.8758 0.3135939 0.6794 0.4616 -0.504 1.6021 10 22.364 26.45762 37.6891
41 3.0107 9.4505 0.3185769 0.683 0.4665 -0.497 1.6128 10.25 32.0971 37.75596 54.8393
42 3.1799 9.5056 0.3345293 0.6942 0.4819 -0.476 1.6232 10.5 33.4696 39.15562 57.3182
43 3.7456 9.6883 0.3866131 0.7285 0.5307 -0.413 1.6335 10.75 39.4532 45.9144 65.5721
44 3.967 9.9508 0.39866131 0.736 0.5417 -0.399 1.6435 11 42.1539 48.81112 70.6042
45 4.3068 10.527 0.409116 0.7424 0.5511 -0.388 1.6532 11.25 47.5689 54.81589 80.3953
46 4.3602 10.633 0.4100721 0.7429 0.552 -0.387 1.6628 11.5 47.8058 54.83362 82.1445
47 4.6993 11.026 0.4262143 0.7526 0.5664 -0.37 1.6721 11.75 52.5235 59.97644 90.6281
48 4.9995 10.646 0.4696093 0.7773 0.6042 -0.328 1.6812 12 53.0591 60.32804 90.1381
49 5.557 7.7264 0.7192291 0.896 0.8027 -0.143 1.6902 12.25 42.1025 47.6726 63.0816
50 5.747 7.9741 0.720709 0.8966 0.8038 -0.142 1.699 12.5 44.2157 49.86596 67.2844
51 6.3845 8.2449 0.7743638 0.9183 0.8433 -0.111 1.7067 12.75 49.9844 56.15521 75.458
52 6.5182 8.0949 0.805223 0.9303 0.8655 -0.094 1.716 13 49.3222 55.20572 74.6579
53 7.265 6.1575 1.1798665 1.0567 1.1166 -0.071 1.7243 13.25 41.1745 45.92108 55.7276
58 7.8584 6.6434 1.1828904 1.0576 1.1185 -0.072 1.7634 14.5 44.6286 48.97117 64.9801
63 8.2034 6.9349 1.1829146 1.0576 1.1185 -0.073 1.7993 15.75 45.398 49.12894 70.8088
68 9.3725 7.5539 1.2407527 1.0746 1.1547 -0.093 1.8325 17 52.9752 56.64548 86.7307
Average 41.8056 47.34114 67.1375
Additional parameter for modified beam theory (MBT): ∆ 1 = 12.18715 mm. Additional parameter for compliance calibration (CC): n = 2.72031. Additional parameter for modified compliance calibration (MCC): A1 = 11.39504.
with total thickness of 3.0 mm (0.375 mm for each ply) is modeled as shown in Figure 14. This proposed model consisted of two deformable parts for two fuselage sections, two adhesive layers and two rigid surfaces as tools (RS1 and RS2). Fuselage sections are bonded with the zero thickness adhesive layers along the fuselage edge. The fuselage sections and adhesive are modeled as deformable parts that can deform under load. Tools are modeled as discrete rigid part, because they were much stiffer than the fuselage section. Discrete rigid part is assumed to be rigid and is used in contact analyses to model bodies that cannot deform. Figure 15 shows the arrangement of the components. RS1 is displaced 80 mm downward at Z-direction to crash toward the fuselage section bonded with adhesive joint; RS2 is fixed to hold in a position during axial. The crushing responses from initial compression loading to final failure under geometrically nonlinear deformations are observed. The load-displacement data is compared with the experimental test.
In finite element modeling, a finer mesh typically results in a more accurate solution. However, as a mesh is made finer, the computation time increases. To determine the best modeling approach to get satisfactorily balances accuracy and computing resources, an attempt has been made at a mesh convergence study (Table 3). Mesh
convergence is studied for mesh size 3, 5 and 8 mm. Mesh size of 3 mm is used in the modeling because it is finer and more accurate and realistic to capture the deformation modes of the structure under compression loading. The agreement of the FEA with experimental results suggests that the mesh used is adequate to predict the overall response accurately (Sim, 2010). Figure 16 shows the mesh used for the fuselage sections and solid cohesive element. FEA results The numerical result obtained by using ABAQUS/Explicit with the cohesive elements for the deformation modes and load-displacement is shown in Figure 17 and Figure 18.
At the beginning of the loading process, the applied load increases linearly up to point 2, where the load maximum is reached, which is 78 kN at 2.4 mmbest modeling approach to get satisfactorily balances accuracy and computing resources, an attempt has been made at a mesh convergence study (Table 3). Mesh displacement. After that, the experimental load-displacement curve and the numerical load-displacement curve drop off sharply to point 4. At point 4, debonding

Mustapha et al. 5161
F
rac
ture
to
ug
hn
es
s (
J/m
2)
39 40 41 42 43 44 45 46 47 47 48 50 51 52 53 58 63 68 Crack length, a (mm)
100
90
80
70
60
50
40
30
20
10
Figure 13. Fracture toughness for test case.
60 mm
160 mm
Figure 14. Sketch of the deformable fuselage section.

5162 Int. J. Phys. Sci.
Figure 15. Component arrangement.
Table 3. Convergence study in mesh size.
Mesh size (mm) Mesh element Peak load (KN)
3 11138 78
5 8316 76
8 3444 81

Mustapha et al. 5163
Figure 16. Fuselage sections and solid cohesive meshing.
13
14
12 11 10 8 9
7
6
5
4
3
2
1
Displacement (mm)
Ax
ial
forc
e (
kN
)
Load displacement curve
10 20 30 40 50 60 70 80 Displacement (mm)
80
70
60
50
40
30
20
10
Ax
ial
fo
rce
(k
N)
Figure 17. Load-displacement diagram from FEA model.
5164 Int. J. Phys. Sci.
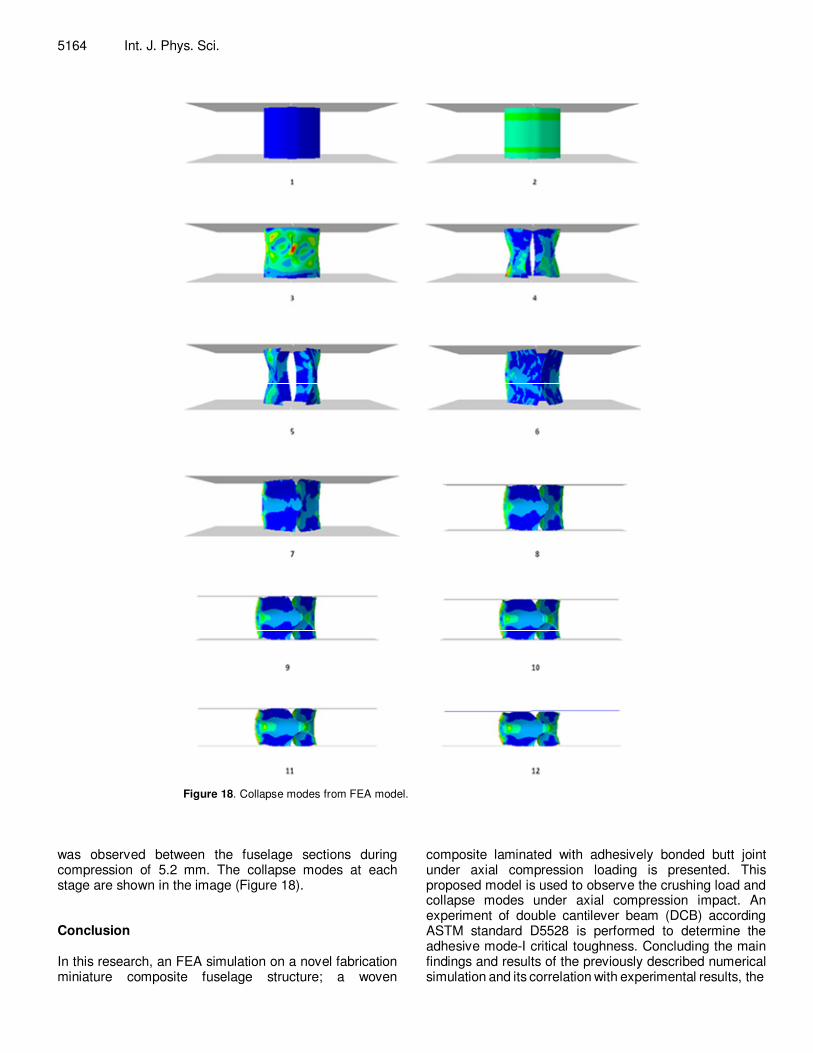
Figure 18. Collapse modes from FEA model.
was observed between the fuselage sections during compression of 5.2 mm. The collapse modes at each stage are shown in the image (Figure 18). Conclusion In this research, an FEA simulation on a novel fabrication miniature composite fuselage structure; a woven
composite laminated with adhesively bonded butt joint under axial compression loading is presented. This proposed model is used to observe the crushing load and collapse modes under axial compression impact. An experiment of double cantilever beam (DCB) according ASTM standard D5528 is performed to determine the adhesive mode-I critical toughness. Concluding the main findings and results of the previously described numerical simulation and its correlation with experimental results, the

following summary may be drawn: 1. Finite element analysis using ABAQUS/Explicit is able to reproduce satisfactory collapse modes under crushing process when compared with the experimental works. 2. Adhesive joint is successfully modeled by using cohesive element to predict adhesive behaviour and strength. 3. ABAQUS/Explicit can be provided with crushing responses from initial compression loading to final failure under geometrically nonlinear deformations. 4. Peak load and crush energy absorption that are extracted by finite element simulation results are reasonable. ACKNOWLEDGEMENT The authors would like to thank the Universiti Putra Malaysia for providing the research grant (FRGS 02-10-10-926FR 5524003) for this research work. REFERENCES Benzeggagh M,Kenane M (1996). Measurement of mixed-mode
delamination fracture toughness of unidirectional glass/epoxy composites with mixed-mode bending apparatus, Compos. Sci. Technol., 56(4): 439-449.
Biel A, Stigh U (2007). An analysis of the evaluation of the fracture energy using the DCB-specimen, Arch. Mech., 59(4-5): 311-327.
Bisagni C (2005). Dynamic buckling of fiber composite shells under impulsive axial compression, Thin-walled struct., 43(3): 499-514.
Dahdi Y, Edi I, Mustapha F, Zahari R (2009). Novel Fabrication for tubular and Frusto Conical Composite Product For Aerospace Application, Conferences Proceeding of Ameritech III Kuala lumpur.
Fan C, Jar PYB, Cheng J (2008). Cohesive zone with continuum damage properties for simulation of delamination development in fibre composites and failure of adhesive joints. Eng. Fracture Mech., 75(13): 3866-3880.
Haugen DJ (1998). ‘Fracture of Skin-stiffner Interactions In Composite Wind Turbine Blade Structures’, Montana State University-bozeman Bozeman, thesis 1-132.
Kang SG, Kim MG, Kim CG (2005). ‘Evaluation of Cryogenic Performance of Adhesives Using Composite-Aluminium Double Lap Joints’, Compos. Struct., 78(3): 305-701.
Koussios S, Bergsma O, Beukers A (2004). Filament winding. Part 1: determination of the wound body related parameters, Composites Part A: Appl. Sci. Manuf., 35(2): 181-195.
Mustapha et al. 5165 Mahdi E, Sahari B, Hamouda A, Khalid Y (2001). An experimental
investigation into crushing behaviour of filament-wound laminated cone-cone intersection composite shell, Compos. Struct., 51(3): 211-219.
Mahdi E, Mokhtar A, Asari N, Elfaki F, Abdullah E (2006). Nonlinear finite element analysis of axially crushed cotton fibre composite corrugated tubes, Compos. Struct., 75(1-4): 39-48.
Mathews MJ, Swanson SR (2007): Characterization of the interlaminar fracture toughness of a laminated carbon/epoxy composite, Compos. Sci. Technol., 67(7-8): 1489-1498.
Seyed SRK, Tamin MN (2009). Damage Mechanics of Composite Laminates under Flexural Loading, South East Asia Abaqus Regional Users' Conference, pp. 23-50.
Sharifi S, Choupani N (2008). Stress Analysis of Adhesively Bonded Double-Lap Joints Subjected to Combined Loading, Proceedings Of World Academy Of Science, Engineering And Technology.
Sim NW (2010). ‘Finite Element Analysis on Cohesive Element For Composite Fuselage Model’, University Putra Malaysia, thesis 1-206.
Tafreshi A (2006). Delamination buckling and postbuckling in composite cylindrical shells under combined axial compression and external pressure, Compos. Struct., 72(4): 401-418.
Tafreshi A (2004). Efficient modelling of delamination buckling in composite cylindrical shells under axial compression, Compos. Struct., 64(3-4): 511-520.
Tarfaoui M, Gning P, Hamitouche L (2008). Dynamic response and damage modeling of glass/epoxy tubular structures: Numerical investigation, Compos Part A: Appl. Sci. Manuf., 39(1): 1-12.
Travesa T (2006). Simulation of delamination in composites under quasi-static and fatigue loading using cohesive zone models, thesis, 1-218.
Wimmer G, Schuecker C, Pettermann HE (2006). ‘Numerical simulation of delamination onset and growth in laminated composites’, Vienna University of Technology, pp. 1-10.
Yang Z, Su X, Chen J, Liu G (2009). Monte Carlo simulation of complex cohesive fracture in random heterogeneous quasi-brittle materials, Int. J. Solids Struct., 46(17): 3222-3234.
Yidris NH, Mokhtar AM (2007). Crush Simulation and Experimental Validation of a Composite Unmmaned Aerial Vehicle Fuselage Section, Universiti Putra Malaysia., Thesis, pp. 1-161.