Embed Size (px)
Citation preview

Developed by the Economist Intelligence Unit
Published by Pearson
2012 REPORTLESSONS IN COUNTRY PERFORMANCE IN EDUCATION

Pearson is the world’s leading learning company. We provide
learning materials and services to educators and students of all ages;
business information through the Financial Times and the world’s
best books and ebooks through Penguin.
www.pearson.com
The Economist Intelligence Unit wrote all sections of this report with the exception
of the Foreword.
The Economist Intelligence Unit (EIU) is the world’s leading resource for economic
and business research, forecasting and analysis. It provides accurate and impartial
intelligence for companies, government agencies, financial institutions and academic
organisations around the globe, inspiring business leaders to act with confidence
since 1946. EIU products include its flagship Country Reports service, providing
political and economic analysis for 195 countries, and a portfolio of subscription-
based data and forecasting services. The company also undertakes bespoke research
and analysis projects on individual markets and business sectors. More information
is available at www.eiu.com or follow us on www.twitter.com/theeiu
Disclosure: The Economist Intelligence Unit is part of The Economist Group.
Pearson owns a 50% stake in The Economist Group.
Learn more, explore the data and join the discussion at The Learning Curve website...
www.thelearningcurve.pearson.com
› Full report online and in PDF
› The Learning Curve databank
› Case studies
› Country profiles
› Video interviews
› Data visualisations

1
ForewordBy Sir Michael Barber, Chief education advisor, Pearson
Overview
Research and analysis
Appendix 1
02
Executive summary A summary of the report’s findings and its conclusions 06
Preface An explanation of the research context, objectives and its contributing experts
04
Education inputs and outputs: it’s complicated Assessing the evidence for correlations between education inputs and outputs as well as socio-economic outcomes
12
The tangible and intangible: income, culture and education outcomes The relevance of wealth and cultural attitudes to education performance
18
Getting teachers who make a difference How does the quality of teaching that children receive affect their future prospects?
22
School choice and accountability: caveat scholacticusWhy expanding choice has positive effects in some circumstances but not others
26
Returns to schooling: education, labour market and social outcomesHighlighting the key personal, social and economic benefits of a better educated population
33
Towards an index of education outputsCreating a comparative index, to identify common factors in countries’ education success
38
Conclusion and recommendations for further studyNext steps, and a call for more research
44
MethodologyMethodology for Quantitative Components of The Learning Curve programme
46Appendix 2 Select bibliography 49
2
Over the last decade, international benchmarking of
education systems has become ever more prevalent.
More importantly, it has become increasingly influential
in shaping education policy at local, regional and
national levels. As studies by OECD-PISA and TIMSS
become more sophisticated and longitudinal time
sequences develop there is ever more to learn about
what successful education systems look like and how
success can be achieved.
In the early days of international benchmarking,
education ministers and other leaders tended to worry
more about the media impact than the implications for
policy. However, once the regular routine of published
PISA results was established, in 2001, this changed.
Germany, for example, found itself much further down
the first PISA rankings than it anticipated. The result was
a profound national debate about the school system,
serious analysis of its flaws and then a policy response
to the challenges that were identified. A decade later,
Germany’s progress up the rankings is visible to all.
Now, in fact, we are beyond the phase of individual
country reactions. Increasingly what we see is a
continuous dialogue among education ministers and
top officials around the world about the evidence from
international benchmarking and the implications for
education reform. Education ministers in places such
as Singapore are constantly monitoring and visiting
other countries to learn what they might do better.
Arne Duncan organised a series of international
Foreword
dialogues with fellow ministers and union leaders
about the future of the teaching profession around the
world. Meanwhile Michael Gove, Secretary of State
for Education in the United Kingdom has shown more
interest in international benchmarking than any of
his predecessors.
The continuous benchmarking series also enables
more sophisticated analysis of what works in education,
which leaders from around the world can draw upon.
I have been involved in a series of three publications
which have explored the lessons in depth. The first of
these, written with colleagues at McKinsey, How the
World’s Best-Performing School Systems Come Out on Top,
examined the lessons from the most successful school
systems, and highlighted the importance of recruiting,
training and developing great teachers.
The second, also written with colleagues at McKinsey,
How the World’s Most Improved School Systems Keep
Getting Better, took a new angle and looked not at
what great systems do, but at how, over time, systems
come to be successful. The third, published earlier
this year with colleagues from Pearson, Oceans of
Innovation, went a step further and asked whether
achieving educational success as measured by PISA and
TIMSS was sufficient to ensure a country was on track
for economic and social success in the 21st century.
The work of Eric Hanushek has likewise connected
PISA and TIMSS outcomes to the wider goals of society,
especially GDP growth. Eric has demonstrated a strong
correlation between the quality of school systems and
economic growth.
The Learning Curve 2012 Foreword

3
His work points directly to the reason we supported the
Economist Intelligence Unit (EIU) in the development
of The Learning Curve. Here we have assembled in
one place a wide range of data sets which will enable
researchers and policymakers to correlate education
outcomes with wider social and economic outcomes
more easily than ever before.
In assembling these data sets we looked at a wide range
of correlations and have been, judiciously I believe,
cautious in interpreting the results. This avoids significant
pitfalls, including, of course, the fact that correlation
does not imply causality. Nevertheless there are some
clear messages. For example, the report highlights the
importance of culture and teacher quality in education.
We should note that even if we can be clear, for
example, that better education leads to less crime,
there is still an issue about how long after the school
system improves we would see the reduction in crime.
And of course the data sets themselves are by no
means perfect. One of the reasons we are making
them available in this format is that we believe this will
encourage those responsible to address the data quality
issues that are raised. Our intention is that the data sets
available through The Learning Curve will be updated as
new data appears. We are therefore making available
an open, living database which we hope will encourage
new research and ultimately enable improved education
policy. In this way, we hope to promote a growing and
welcome trend around the world towards evidence-
informed education policy. The challenge then for
policymakers is less knowing what they should do
than having the courage to act on the evidence.
For example, acting on the clear message that reducing
class size is expensive and has little or no impact on
system performance.
This report includes a number of country rankings.
These always generate interest and should be seen in
the context of the issues raised here about the quality
of data available. This is particularly the case with
graduation rates which for the moment are based
on national data sets involving a range of different
definitions. We hope by publishing this particular ranking
we will generate debate about how to improve data
consistency as well as about the underlying policy issues.
We hope this research programme prompts a
lively conversation on how we learn more about
learning. If you have any comments or reflections on
the issues raised in this report, please visit us online
at thelearningcurve.pearson.com or via email at
Sir Michael Barber, Chief education advisor, Pearson
Pearson plc
Increasingly what we see is a continuous dialogue among education ministers and top officials around the world about the evidence from international benchmarking and the implications for education reform.

4
This report, published by Pearson and written
by the Economist Intelligence Unit, is part of a
wide-ranging programme of quantitative and
qualitative analysis, entitled The Learning Curve. It seeks to further our understanding of what leads to successful educational outcomes – both economic and social. The design and execution of the programme has benefited from the ongoing advice of some of the world’s leading educational scholars.
This report itself outlines the main findings from analysis of a large body of internationally comparable education data – The Learning Curve Data Bank. It also draws on extensive desk research, as well as in-depth interviews conducted with 16 experts in education. The research was conducted entirely by the Economist Intelligence Unit, and the views expressed in the report do not necessarily reflect those of Pearson. The report was written by Dr Paul Kielstra, and edited by Denis McCauley of the Economist Intelligence Unit.
Preface
The Learning Curve 2012 Preface

5
Nahas AngulaPrime Minister of Namibia
Paul CapponFormer President of the Canadian Council on Learning
Claudia CostinMunicipal Secretary of Education, Rio de Janeiro
Chester FinnPresident, Thomas Fordham Institute
Eric HanushekPaul and Jean Hanna Senior Fellow, Stanford University
Lee Sing KongDirector, National Institute of Education Singapore
Anthony MackayChair, Australian Institute for Teaching and School Leadership
Mamadou NdoyeFormer Minister of Basic Education, Senegal
Vibha ParthasarathiEducationalist and former Chair, National Commission for Women, India
Sir Michael BarberChief education advisor, Pearson
Paul CapponFormer President of the Canadian Council on Learning
Eric HanushekPaul and Jean Hanna Senior Fellow, Stanford University
Helen JoyceSão Paulo Bureau Chief and former International Education Editor, The Economist
Vibha ParthasarathiEducationalist and former Chair, National Commission for Women, India
Pamela SammonsProfessor of Education, University of Oxford
Andreas SchleicherDeputy Director for Education, OECD
Sincere thanks go to the interviewees for sharing their insights on this
topic. These include the following individuals:
The Learning Curve programme has additionally benefited from counsel
provided at various stages by an Advisory Panel consisting of prominent
education experts. These include:
William RattereeFormer education sector specialist, International Labour Organisation
Andreas SchleicherDeputy Director for Education, OECD
Robert SchwartzFrancis Keppel Professor of Practice of Educational Policy and Administration, Harvard Graduate School of Education
Brian StecherAssociate Director, RAND Education
James TooleyProfessor of Education Policy, Newcastle University
Ludger WoessmannProfessor of Economics, University of Munich
Yong ZhaoAssociate Dean for Global Education, University of Oregon
Pearson plc

6 The Learning Curve 2012 Executive summary
The goal of improving education today enjoys
great prominence among policymakers and other
stakeholders in societies worldwide. Although they may
not be able to quantify it, governments in most countries
recognise a link between the knowledge and skills with
which young people enter the workforce and long-term
economic competitiveness. For this reason, interest is
intense in research which explores the factors that seem
to lead in some countries to outstanding educational
performance, and ultimately to better qualified
workforces.
Executive summary
This report, and the broader The Learning Curve
programme of which it is part, is aimed at helping
policymakers, educators, academics and other
specialists to identify some of these factors. At its
heart is a significant body of quantitative research.
The Learning Curve Data Bank (LCDB), which is
accessible online, brings together an extensive set of
internationally comparable data on education inputs
and outputs covering over 50 countries. This in turn has
enabled a wide-ranging correlation analysis, conducted
to test the strength of relationships between inputs,
outputs and various socio-economic outcomes. It also
underpins an initiative to create a comparative index
of educational performance which, as will become
apparent, is anything but a straightforward exercise.
Educators might hope that this or other similar bodies of
research would yield the ‘holy grail’: identification of the
input, or set of inputs, that above all else leads to better
educational results wherever it is applied. Alas, if this
report makes nothing else clear, it is that no such magic
bullets exist at an international level – or at least that
they cannot, as yet, be statistically proven. Nonetheless,
our research – which is also based on insights gathered
from experts across the world – provides some definite
signposts. Following are its highlights:
Although they may not be able to quantify it, governments in most countries recognise a link between the knowledge and skills with which young people enter the workforce and long-term economic competitiveness. This report is aimed at helping policymakers, educators, academics and other specialists to identify some of these factors.

7Pearson plc
Strong relationships are few between education
inputs and outputs
The research examined a wide range of education
inputs, both quantitative – such as spending on pupils
and class size – as well as qualitative – such as level of
school choice. It also looked at numerous potential
outcomes, ranging from inculcation of cognitive skills
to GDP growth. A number of inputs show a statistical
link over time with certain outputs, notably between
income and results. These are discussed in the chapters
that follow, but the most striking result of the exercise
is how few correlations there are. Education remains
very much a black box in which inputs are turned into
outputs in ways that are difficult to predict or quantify
consistently. Experts point out that simply pouring
resources into a system is not enough: far more
important are the processes which use these resources.
Income matters, but culture may matter more
On the surface, money and education seem to create
a virtuous circle, with rich countries – and individuals –
buying good education for their children who, in turn,
benefit economically. A closer look, though, indicates
that both higher income levels and better cognitive test
scores are the result of educational strategies adopted,
sometimes years earlier, independently of the income
levels existing at the time. More important than money,
say most experts, is the level of support for education
within the surrounding culture. Although cultural change
is inevitably complex, it can be brought about in order to
promote better educational outcomes.
There is no substitute for good teachers
Good teachers exercise a profound influence: having a
better one is statistically linked not only to higher income
later in life but to a range of social results including lower
chances of teenage pregnancy and a greater tendency to
save for their own retirement. The problem is that there
is no agreed list of traits to define or identify an excellent
teacher, let alone a universal recipe for obtaining them.
That said, successful school systems have a number of
things in common: they find culturally effective ways to
attract the best people to the profession; they provide
relevant, ongoing training; they give teachers a status
similar to that of other respected professions; and the
system sets clear goals and expectations but also lets
teachers get on with meeting these. Higher salaries,
on the other hand, accomplish little by themselves.
When it comes to school choice,
good information is crucial
Recent research indicates that countries with greater
choice of schools have better education outcomes.
Presumably, allowing parents to choose the best
schools rewards higher quality and leads to overall
improvement. In practice, however, finding the
mechanism to make this happen is difficult. Extensive
studies of voucher programmes and charter schools
in the United States indicate that, while both can be
beneficial, neither is a magic formula. On the other
hand, for-profit private education is providing students
in some of the least developed areas of the world
an alternative to poor state provision and showing
the potential benefits of choice and accountability.
Ultimately, as in any market or quasi-market, the real
value of choice comes from people having the right
information to select the option that is truly superior.

8 The Learning Curve 2012 Executive summary
There is no single path to better
labour market outcomes
Education seems to correlate with a host of personal
benefits, from longer life to higher income. At a
national level, too, education and income appear to
go together. Finding the type of education that leads
to the best economic outcomes, however, is far from
straightforward. Different strategies have distinct pros
and cons. For example, some countries – but far from
all – place considerable emphasis on vocational training
as preparation for employment. Similarly, education
systems cannot simply educate for the present: leading
ones look at what skills will be needed in future and how
to inculcate them.
A global index can help highlight
educational strengths and weaknesses
An important output of The Learning Curve programme
is the Global Index of Cognitive Skills and Educational
Attainment. Covering 40 countries, it is based on results
in a variety of international tests of cognitive skills as well
as measures of literacy and graduation rates. The top
performers in the Index are Finland and South Korea.
In some ways, it is hard to imagine two more different
systems: the latter is frequently characterised as test-
driven and rigid, with students putting in extraordinary
work time; the Finnish system is much more relaxed
and flexible. Closer examination, though, shows that
both countries develop high-quality teachers, value
accountability and have a moral mission that underlies
education efforts.
... both countries [at the top of the Index] develop high-quality teachers, value accountability and have a moral mission that underlies education efforts.


11Pearson plc
There are no magic bullets The small number of correlations found in the study shows the poverty of simplistic solutions.
Throwing money at education by itself rarely produces results, and individual changes to
education systems, however sensible, rarely do much on their own. Education requires
long-term, coherent and focused system-wide attention to achieve improvement.
1.
Respect teachers Good teachers are essential to high-quality education. Finding and retaining them is not
necessarily a question of high pay. Instead, teachers need to be treated as the valuable
professionals they are, not as technicians in a huge, educational machine.
2.
Culture can be changedThe cultural assumptions and values surrounding an education system do more to support or
undermine it than the system can do on its own. Using the positive elements of this culture
and, where necessary, seeking to change the negative ones, are important to promoting
successful outcomes.
3.
Parents are neither enemies nor saviours of educationParents want their children to have a good education; pressure from them for change should
not be seen as a sign of hostility but as an indication of something possibly amiss in provision.
On the other hand, parental input and choice do not constitute a panacea. Education systems
should strive to keep parents informed and work with them.
4.
Educate for the future, not just the presentMany of today’s job titles, and the skills needed to fill them, simply did not exist 20 years ago.
Education systems need to consider what skills today’s students will need in future and teach
accordingly.
5.
Five lessons for education policymakers

12
Education has always mixed the local and the global.
The survival of Latin in Europe as a language of learning,
long after its disappearance almost everywhere
else in society, reflected an ideal of the universality
of knowledge. On the other hand, state education
provision has long been closely associated with local
needs and the preservation of local cultures: in many
federal systems, it falls to the state or province rather
than the national government. As currently delivered,
says Andreas Schleicher, the OECD’s Deputy Director
for Education, “education is very inward looking, a very
local activity. A lot of walls exist between countries.”
Since the 1990s, the interaction between the parochial
and the international has taken on a new form.
Comparative tests such as Progress in International
Reading Literacy Study (PIRLS), Trends in International
Mathematics and Science Study (TIMSS), and the
Programme for International Student Assessment
(PISA) manifest a growing emphasis on benchmarking
the performance of different systems and on
understanding what sets apart the highest achievers.
In Professor Schleicher’s words, education debates are
no longer about “improvement by national standards.
Best performing countries now set the tone.”
He also believes that PISA has fundamentally challenged
the idea that education should be valued largely on the
volume of spending and other inputs, and the premise
that more investment is always better. “The shift from
inputs to outcomes [as the focus of study] has been a
significant impact” of the tests, he says. Such research
has also made clear that, for policymakers, more than
children’s grades are at stake: economists have found
a close relationship between economic growth and
certain population-wide outputs of education such as
cognitive skills.1
The Data Bank and what it reveals
The Learning Curve Data Bank (LCDB) – created
by the Economist Intelligence Unit as part of the
broader Learning Curve programme – is an effort
to advance study in this area. It is a purpose-built,
substantial collection of data which includes more
than 60 comparative indicators gathered from over
50 countries. Many of these indicators in turn rely
on multiple pieces of information, so that, even with
some inevitable gaps, the LCDB encompasses over
2,500 individual data points. These go well beyond
traditional education metrics, such as teacher-student
ratios and various spending metrics, to cover a broad
range of educational inputs and possible outputs, from
the degree to which parents demand good results
of schools to the proportion of adults who end up in
jail. The appendix to this report describes the LCDB
and the rest of the Quantitative Component, and the
methodology behind it, in detail.
The Learning Curve 2012 Education inputs and outputs: it’s complicated...
Education inputs and outputs: it’s complicated...
1 Eric A. Hanushek and Ludger Woessmann, “Education and Economic Growth”, in Dominic J. Brewer and Patrick J. McEwan, eds. Economics of Education (2010).

13Pearson plc
Qualitative(school autonomy,
school choice)
SOCIO-ECONOMIC ENVIRONMENT
GDP per capita, income equality, innovation, labour productivity, crime rates, research output
Analyse connections/ correlationsINPUTS OUTPUTS
Quantitative(spend, start age,
pupil-teacher ratios, years in school)
Cognitive skills(PIRLS, TIMSS, PISA)
Educational outcomes
(graduation rates, literacy,
employment)
STRUCTURE OF THE LEARNING CURVE QUANTITATIVE COMPONENT
“The shift from inputs to outcomes [as the focus of study] has been a significant impact of the tests.”
— Andreas Schleicher, Deputy Director for Education, OECD

14
Beyond providing a useful tool for researchers, a
goal of the Quantitative Component and Data Bank
has been to make possible a search for correlations
between inputs and outputs that endure over time.
The ultimate hope is to uncover, where possible, any
interventions which might have a positive effect not only
on the development of cognitive skills and scholastic
achievement, but also on societal outcomes such as
higher employment. The methodology appendix also
describes how these correlations have been sought.
The data suggest a small handful of strong links.
Two correlations show a connection between national
income and aspects of academic success: higher GDP
seems related to better Grade 8 PISA results; and a
better score on the Human Development Index (of
the United Nations Development Program – UNDP)
and its Income Index are associated with higher upper
secondary graduation rates. LCDB data also suggest
a link between more years in school on average and
higher labour productivity in a country. (One apparently
strong link – that the higher a country’s average school
life expectancy, the greater the proportion of students
will graduate – is almost tautological given the time
requirements involved in most diplomas and degrees.)
Still a black box
These findings will be discussed in the chapters that
follow, but the most striking result of the search for
correlations is the overall paucity of clear linkages.
In this, our study is not alone. Ludger Woessmann,
Professor of Economics at the University of Munich,
explains that a lack of “any relationship between inputs
and outputs mirrors the extensive academic literature
on this topic. If you try to go beyond simple correlations,
the general result is nearly always the same.” Chester
Finn, President of the Thomas Fordham Institute, an
education research organisation, and former United
States Assistant Secretary of Education, agrees. “What
works,” he says, “takes place inside a black box that has
inputs coming in and outputs going out; but the inputs
do not predict the results and what goes on in the black
box is hard to quantify.”
The research does, though, at least point to some of
the difficulties of seeing inside the black box. The first,
says Paul Cappon, former President of the Canadian
Council on Learning, is that in the study of education
“we measure just a few things, usually inputs more
than outputs because they are simpler and easier to
measure, not because they are more significant – they
are not.” Vibha Parthasarathi, a distinguished Indian
educationalist, adds that successful outcomes arise
from “the interplay of several factors, some tangible,
others intangible. What I’ve seen in any number of
surveys is you measure what is measurable. The softer
inputs of education get left out.” These inputs, however,
can be crucial, such as the cultural context in which
education occurs.
The Learning Curve 2012 Education inputs and outputs: it’s complicated...


17
Second, straightforward correlations are difficult to
find because education involves complex, interrelated
processes rather than simple activities. Nahas Angula,
Prime Minister of Namibia who, as education minister,
oversaw the post-apartheid reconstruction of that
country’s education system, says that achieving good
outcomes “is not really a question of spending money,
money, money. The question is how to get the most
out of the money you have spent.” Dr Finn agrees:
“Processes, more than inputs, are important. It is like
having a good cook versus a bad one: the ingredients
might be identical, but one produces something worth
eating.” If education itself is so complex, teasing out its
impact on broader societal phenomenon, like economic
growth, is harder still.
This does not mean that education is a complete
mystery. Some key elements are apparent. Professor
Schleicher explains that “We have a good sense of what
makes a good education system. That doesn’t answer
how you do it, but you can say these are the key factors.”
The rest of this study will explore the most important of
those factors, bearing in mind that there is no single best
way to address them in every country. As with cuisine,
a variety of approaches may bring success. For example,
as we will discuss later, education in Finland and South
Korea – two of the world’s top-performing countries in
many benchmarks – seem to have few similarities other
than high academic achievement.
The main message of the lack of strong correlations,
though, should be humility. Brian Stecher, Associate
Director at RAND Education, says: “We use jargon that
seems to explain student behaviour, but we really don’t
understand the way students learn and the complex
mix of inputs – family, community and learning – that
lead to skills and temperaments. If you compare
research in education to research in healthcare, you
see a dramatic difference in our knowledge of cause
and effect.” Claudia Costin, Rio de Janeiro’s Municipal
Secretary of Education, adds that “Reforming education
requires more than figures and analysis. You need to
avoid arrogance and the feeling of having a technocratic
approach.”
Rather than being able to pronounce the last word,
then, education research is still learning how to promote
better outcomes. The Data Bank itself is only one step in
an effort that is hoped to last many years. The discussion
which follows will look at several major issues relating
to successful educational outcomes, including national
income, culture, teaching quality and questions of choice
and accountability. In doing so, it seeks to be part of an
ongoing deepening of knowledge about education, and
to illuminate the key issues meriting further investigation.
GDP per capita (US$PPP) Grade 8 PISA – overall reading literacy Grade 8 PISA
Positive Positive
UN Human Development Index Upper secondary graduation rate Positive
UN Income Index Upper secondary graduation rate Positive
School life expectancy (primary to tertiary)
Overall productivity of labour (GDP at US$PPP per worker)
Positive
Ratio of maximum teacher salary over average gross wage at primary level
Upper secondary graduation rate Negative
Ratio of maximum teacher salary over average gross wage at secondary level
Upper secondary graduation rate Negative
VARIABLE 1 VARIABLE 2 TYPE
Pearson plc
SELECTED STRONG RELATIONSHIPS FROM THE CORRELATION ANALYSIS
Note: Strong correlations, such as those shown here, are above a threshold of 0.65. Correlation tests were conducted between two variables over time (on an annual basis). Each correlation refers to a minimum of 15 countries out of the sample.
Source: Economist Intelligence Unit.

18
Income and test results: a virtuous circle
or common offspring?
Two correlations from the quantitative analysis indicate
a link between a country’s income and its educational
outcomes: higher GDP is associated with better
overall PISA scores, and the UNDP’s Income Index is
a predictor of national secondary school graduation
rates. Similarly, PISA results correlate with national
GDP and Income Index scores in the years following
the tests being administered. In both cases, however,
the causation is not clear. In relation to the second
link, for example, those who were age 15 in 2009 and
2006 have had so little time in the labour force that the
contribution of their skills is unlikely to have had much
effect yet on national income. That said, Professor
Schleicher reports that PISA’s extensive longitudinal data
on test-takers indicates that the test’s predictive power
of ease of transition to work and initial income is high.
On the surface, this suggests a virtuous circle – money
buys good education, which instils higher earning
power. This seems to parallel an often observed link
between socio-economic status and academic results
within countries. If anything, this association is growing
in the United States,2 but it is far from an American
phenomenon. It is present in European countries, such
as the United Kingdom and Italy, as well as, according to
a 1999 study by a World Bank researcher, in 43 largely
developing nations.3
Money, for both countries and individuals, does brings
obvious advantages. As Ms Parthasarathi notes for
families, “wealth gives you access to schools where
you assume there are better teachers, etc, [and] ...
people who don’t have the means miss out on a lot of
opportunities.” The wider link to educational results,
however, is far from straightforward. Ms Parthasarathi
points out that, at the individual level, even something
as basic as student motivation can be greatly affected by
economic background.
More generally, a recent OECD report indicates that a
commitment to equity within an education system can
greatly diminish the correlation between family income
and educational outcomes. It points to Finland, Canada
and South Korea, among others, as examples of success
in this area.4 This is consistent with research conducted
by the Canadian Council on Learning, says Mr Cappon.
“Our composite learning index showed no direct
correlation between the wealth of a community and its
learning environment. It is not a given that you simply get
a higher result with higher income levels.”
Similarly, the tie between GDP per capita and PISA
results is far from linear. For countries with incomes
under $20,000 per person, economic growth appears
to bring rapidly improving educational results. After that
point, however, the gains become much less obvious.5
This type of result is common in economics, appearing
in areas such as the impact of national income on life
expectancy: up to a certain point, the need is so great
that almost any spending brings gains; thereafter the way
that the money is spent becomes much more significant.
The tangible and intangible: income, culture and education outcomes
The Learning Curve 2012 The tangible and intangible: income, culture and education outcomes
2 See Greg J. Duncan and Richard Murnane, eds. Whither Opportunity? Rising Inequality, Schools, and Children’s Life Chances, 2011.
3 Deon Filmer, “Inequalities in Education: International Experience”, in Ismail Sirageldin, Human Development in the Twenty First Century.
4 Equity and Quality in Education: Supporting disadvantaged students and schools, 2012.
5 “Does money buy strong performance in PISA”, PISA in Focus, February 2012.

19Pearson plc
PISA RESULTS AND GDP GROWTH PER HEAD SELECTED COUNTRIES
Eric Hanushek, the Paul and Jean Hanna Senior Fellow
at Stanford University, explains: “It is more important
how resources are used than how much. In some places
school systems and countries seem to know how to
spend wisely, in others they don’t.”
For most experts, however, talking of GDP’s effects on
outcomes reverses causality. Professor Hanushek states
that “it is not quite a chicken-and-egg thing. It doesn’t
look like faster growth leads to higher PISA scores, but
there is substantial evidence to suggest that if you can
find a way to get higher PISA scores you will get higher
growth.” In other words, both current GDP and high
levels of cognitive skills in students are results of the
same education-policy decisions made sometimes many
years earlier. Professor Schleicher agrees, citing the
experiences of South Korea and China which decades
ago, with lower GDPs than many countries, made
strategic decisions to focus investment on education.
They have seen both national incomes and test scores
surpass many others as a result. “It is not a question of
if you are rich, you can afford a good education system,”
he concludes. “You may need to build a 40-year time
gap between investment and economic outcomes,
but the causality of the link is established.”
Note: The overall PISA score is an aggregate of the test scores in reading, mathematics and science literacy. It is calculated by the EIU, utilising OECD data.
Sources: Economist Intelligence Unit and OECD.
Grade 8 overall PISA, 2009
Average GDP growth per head, 2007-11 (%)
Hong Kong 545.57 3.0
Finland 543.49 0.5
Singapore 543.20 2.4
South Korea 541.16 3.1
Japan 529.43 0.1
Canada 526.58 0.1
New Zealand 524.06 0.3
Australia 518.84 0.8
Netherlands 518.82 0.6
Germany 510.16 1.3
Grade 8 overall PISA, 2009
Average GDP growth per head, 2007-11 (%)
Poland 501.12 4.2
United Kingdom 500.10 -0.5
France 496.88 -0.1
United States 496.41 -0.4
Sweden 495.60 0.7
Russia 468.50 3.0
Chile 439.30 2.6
Mexico 419.89 0.3
Brazil 400.99 3.1
Argentina 395.72 5.7

20 The Learning Curve 2012 The tangible and intangible: income, culture and education outcomes
Culture: an unquantifiable essential
Money as a driver of education outcomes has the
advantage of being measurable. Many experts
interviewed for this study, however, identify something
far less concrete as far more important. Robert
Schwartz – Francis Keppel Professor of Practice of
Educational Policy and Administration at the Harvard
Graduate School of Education – underscores a difficulty
in analyses of educational inputs and outputs: “How do
you disentangle deeply embedded cultural values from
social and educational policies?”
The issue of culture is relevant across the world. Dr Finn
says of the US: “The typical young American, upon
turning 18, will have spent 9% of his or her life in school
[assuming perfect attendance]. That can accomplish
a lot, but is relatively weak in terms of overall effect.
If the 91% is co-operating with the 9%, then you have
a good recipe. If there is no positive re-enforcement of
educational achievement taking place outside the school
– if, for example, the larger culture glorifies celebrities
who can barely read – you will have huge trouble.”
In parts of Africa, culture can bring significant challenges,
says Mamadou Ndoye, former Minister of Basic
Education in Senegal. “School as it exists is not a product
of the internal development of Africa,” he explains.
“It was imposed from outside. In many countries, the
community [still] think of school as a foreign object,
which is a problem for local ownership.” In Asia, on
the other hand, the success of schools “has more to
do with society and culture than the school system,”
says Professor Yong Zhao, Associate Dean for Global
Education at the University of Oregon. “In Asian
countries, even if you can’t succeed, you have to hang
in there.” Anthony Mackay, Chair of the Australian
Institute for Teaching and School Leadership, adds:
“In East Asian countries, where learning is held to
be both a moral duty and social duty, you would not
even have the conversation about the need for high
expectations about young people’s learning.” Nor are
national cultures monolithic. Mr Cappon notes that
“in North America, you see that depending on the
culture of origin, there are massive discrepancies. If they
[students’ families] come from Hong Kong or Singapore,
they do well; if from Latin America or Haiti, they don’t.”
If culture is seen as somehow inherent and immutable,
such insights might seem of little value to education
policymakers. Indeed, they would suggest that
educational success is almost predetermined. Culture,
however, is changeable if addressed properly. Respect
for teachers, for example, is ingrained in certain cultures
such as those in Finland and South Korea. However,
it can also be built in a society through policy choices.
Professor Sing Kong Lee, Director of Singapore’s
National Institute of Education, recalls that when
the government wished to attract better teaching
candidates, it realised that the recognition of value of the
profession in the country needed to be strengthened.
This was done through introducing policies such as
setting the salaries of beginning teachers equal to those
of beginning engineers and accountants entering the civil
service, thereby sending out a clear message that the
importance of the teaching profession is equal to that of
other professions.
Another way of addressing the situation, says Professor
Lee, was that “the government recognised the
contribution of teachers by defining their mission: to
mould the future of the nation. What can be more noble
than that?” It also established 1 September as National
Teachers’ Day, on which the President invites teachers
to the Istana (Presidential Office) to recognise those
who do good work with awards. Students usually get
a day off as well. Professor Lee credits such steps with
raising the profile of the profession greatly.
These steps might not work in every country, but they
do show that existing cultures can be changed in a way
that assists educational outcomes. In this the education
system itself has an important role. As Professor Stecher
notes: “Schools are both recipients and creators of
cultural patterns: over the long term they help to shape
norms for the next generations.”
“... If there is no positive re-enforcement of educational achievement taking place outside the school – if, for example, the larger culture glorifies celebrities who can barely read – you will have huge trouble.”
— Dr Chester Finn, President,
Thomas Fordham Institute


22
Teachers matter …
One point of broad agreement in education is that
teachers matter greatly. Students of certain teachers
simply do better in a way that has a marked effect on
social and economic outcomes. For example, a recent
study drawing on data covering about 2.5 million US
children found that, after correcting for other factors,
pupils assigned to teachers identified as delivering better
educational results “are more likely to attend college,
attend higher-ranked colleges, earn higher salaries, live
in higher [socio-economic status] neighbourhoods,
and save more for retirement. They are also less likely
to have children as teenagers.”6 Professor Schwartz
believes that “the single most important input variable
[in education] is the quality of teaching.” However,
teacher quality, notes William Ratteree – until recently,
education sector specialist at the International Labour
Organisation – “is a mix of factors which are difficult to
pin down.”
Much of the research in this area has focused on
what education systems can do to ensure that they
find teachers who add value. Even here, though, says
Professor Hanushek, “the rules tend to be country-
specific.” McKinsey’s 2010 report, How the World’s Most
Improved School Systems Keep Getting Better, argues that
the best interventions even depend on the current
state of the school system. In McKinsey’s view, systems
currently marked by ‘fair’ levels of performance should
focus on teacher accountability, while ‘good’ systems are
likely to benefit more from enhancing the status of the
teaching profession.
… But what matters for getting good teachers?
Despite such variation, a number of insights are
broadly applicable. The first is that teacher pay has
surprisingly little relevance to education results.
In LCDB data, minimum and maximum instructor
salaries at all education levels – measured as a
percentage of average national income – have
no long-term link to the inculcation of cognitive
skills, as measured by standard international tests.
Getting teachers who make a difference
The Learning Curve 2012 Getting teachers who make a difference
6 Raj Chetty, John N. Friedman, Jonah E. Rockoff, The Long-term Impacts of Teachers: Teacher Value-added and Student Outcomes in Adulthood, National Bureau of Economic Research Working Paper 17699, December 2011, http://www.nber.org/papers/w17699.
“... the single most important input variable [in education] is the quality of teaching.”
— Professor Robert Schwartz,
Francis Keppel Professor of
Practice of Educational Policy
and Administration, Harvard
Graduate School of Education

23
Chile
Spain
South Korea
Germany
Italy
Czech Rep
Austria
New Zealand
Canada
Japan
Israel
United States
France
Finland
Australia
Sweden
Norway
2.78
1.76
1.64
1.61
1.31
1.24
1.21
1.05
1.00
0.99
0.95
0.92
0.88
0.87
0.83
0.79
0.62
RATIO OF AVERAGE TEACHER SALARY AT PRIMARY, LOWER AND UPPER SECONDARY
LEVELS OVER THE AVERAGE GROSS WAGE SELECTED COUNTRIES, 2010
Pearson plc
Indeed, the only statistical correlation between pay and
educational outcomes is a tendency of higher maximum
salaries – as a percentage of the national average – at a
number of teaching levels to lead to lower secondary
school graduation results. A closer look at this counter-
intuitive result reveals that – within the data set available
– higher GDP countries do not pay teachers as high a
percentage of the average wage as lower GDP ones.
In other words, as economies grow, teacher salaries do
so at a slower rate. Thus, the implicit correlation actually
reveals again the link between higher GDP and certain
better educational results.
The lack of correlations in this area is consistent with
much detailed research on the link between pay and
results, which is typically found to be weak or non-
existent.7 Performance-based pay is an exception:
it does tend to lead toward better outcomes.8 On the
other hand, in some cases high salaries without quality
differentiation create problems. Mamadou Ndoye
recalls that, when he was Minister of Basic Education in
Senegal, the level of pay made it impossible to hire more
teachers, so he had to engage in difficult negotiations to
be allowed to bring in volunteers to help. Overall, in the
words of Mr Cappon, “Teachers must be reasonably well
paid, but this pales in comparison with other factors.”
Sources: Economist Intelligence Unit and OECD.
7 One notable exception is P. Dolton and O. D. Marcenaro-Gutierrez, “If you pay peanuts do you get monkeys? A cross-country analysis of teacher pay and pupil performance”, Economic Policy (2011) 26: 5–55.
8 David N. Figlio and Lawrence Kenny, Individual Teacher Incentives and Student Performance, National Bureau of Economic Research Working Paper 12627, October 2006, http://www.nber.org/papers/w12627; Ludger Woessmann, “Cross-Country Evidence on Teacher Performance Pay”, Forschungsinstitut zur Zukunft der Arbeit Discussion Paper 5101, July 2010.


25
Experts interviewed for this study repeatedly point
to several of these other factors which are essential in
promoting teacher quality:
› Attracting the best people to the profession: Getting
good teachers begins with recruiting talented individuals.
Finland and South Korea – two perennially cited
examples of education success and the top countries in
our Index – obtain their annual teacher intake from the
top 10% and 5% of graduating students respectively.
The key to such success is the status in which teaching
is held culturally. Here money can have some effect,
not just as a simple inducement but as a signal of status.
The South Korean government uses high levels of
teacher pay in this way both to compensate for large
class sizes and to indicate the importance it accords to
the profession.
› Providing the right training: The training of these new
recruits has to be appropriate to the conditions in which
they will work. This varies by country. The Finnish
system, for example, benefits from teachers having
graduate degrees. On the other hand, Nahas Angula,
Prime Minister of Namibia, points out that his country’s
policy of requiring all teachers to have an undergraduate
degree may be driving up the cost of education when
other training would suffice for primary grades.
Teacher training also needs to be ongoing. This has a
very practical reason – that no teacher’s college course
will maintain complete relevance across decades of
work – but also a demonstrative one. As Mr Cappon
notes, “teachers need to be lifelong learners themselves.
You can’t inculcate a love of learning unless you live
it.” Effective professional development needs to
address not just upgrading the knowledge of teachers –
providing, for example, a better understanding of new
technology and teaching strategies – but also allow them
to advance along their career path into more senior
positions where relevant.
› Treating teachers like professionals: Consistent with the
need to promote the status of teaching is its treatment
as a profession. Mr Ratteree notes that “things like
continual professional development and professional
autonomy can be powerful incentives for better learning
outcomes.” Mr Cappon agrees: “Teachers must be
seen as professionals who exercise judgement, not just
technicians.”
› Implementing clear goals and effective oversight, and
then letting teachers get on with it: Professors Hanushek
and Woessmann both point to this combination
of accountability and independence as consistently
correlated with improved outcomes. Says the latter:
“Education economists emphasise the need to think
about incentives for people in the system to use
resources efficiently. These are mostly framed by the
surroundings of the education system, the accountability
system and whether schools can act autonomously.
There is clear evidence of strong relations between
these and improved outputs.” Professor Schleicher
agrees. High-performing school systems, he says,
combine demanding standards, low tolerance of failure,
and clear articulation of expectations with “a lot of
professional responsibility within a collaborative work
organisation at the front line,” for both teachers and
schools.
None of these on their own is enough. Instead, they
form an overlapping, and mutually supporting, set of
strategies to provide the high-quality teachers that are
so important for education and to use them in the most
effective ways.9
Pearson plc
9 For a similar discussion of the key success factors in teacher development see Michael Barber and Mona Mourshed, How the World’s Best-Performing School Systems Come Out on Top, McKinsey and Co., 2007, pp 15-23.

26
The choice debate
In the English city of Guildford in 2011, every final-year
student in the Royal Grammar School earned at least
three A-levels, the highest secondary-school subject
qualification. The equivalent figure for the city’s Kings
College for the Arts and Technology was just 69%.
Neither figure was a surprise, nor is such variation
exceptional. In most places, it is simply accepted that
specific schools – like individual teachers – have different
results which tend to persist over time. A natural
conclusion is that giving parents, and through them
students, the ability to choose better performing
schools should lead to better outcomes.
Unfortunately, this issue is far more complex and not just
because of the range of systems through which choice
operates across the world – including both publicly
and privately funded options. Whatever their specific
strong and weak points, all these arrangements need
accurate information. Getting it wrong can be harmful.
A study of Beijing parental selection of primary schools
found that excessive optimism about place availability
at better schools led parents to use up application
choices on schools that were already full. Less optimistic
parents snapped up places at the next tier of schools,
leaving only markedly worse ones for the children of
those making the initial mistake.10 On the other hand,
researchers in North Carolina found that better, clearer
information on local schools increased the number of
low-income parents taking advantage of school choice,
and that the children so placed performed better.11
As in any quasi-market, for choice to work, schools
have to reveal how well they are doing: choice and
accountability must go hand-in-hand.
Any accountability system, however, requires some
decision on what should be measured. Demographic
differences between the children in the two Guildford
schools above might explain the gap in results far
better than the education provided. Mr Cappon notes
of Canada: “Social class and school choice tend to go
together.” Indeed, much of the choice and accountability
debate continues because such other issues cloud
the picture.
School choice and accountability: caveat scholacticus
The Learning Curve 2012 School choice and accountability: caveat scholacticus
10 Fang Lai, Elisabeth Sadoulet, Alain de Janvry,
“The Adverse Effects of Parents’ School Selection Errors on Academic Achievement: Evidence from the Beijing Open Enrollment Program”, Economics of Education Review (2009) v28 n4: 485-496.
11 Justine S. Hastings and Jeffrey M. Weinstein, “Information, School Choice, and Academic Achievement: Evidence from Two Experiments”, The Quarterly Journal of Economics, (2008): 1373-1414.

27
Recent research suggests that, at the system-wide
level, the potential for informed choice helps raise
educational outcomes and reduces costs. In particular,
a cross-country comparison of the number of private,
often faith-based, schools – an indication of the degree
of choice – with the 2003 PISA results found that,
even after controlling for other factors, ‘the share of
schools that are privately operated has an economically
and statistically significant positive effect on student
achievement in mathematics, science, and reading.’12
The benefits were greater than average for students
with a lower socio-economic status where such
private schools were publicly funded, as in Belgium and
the Netherlands. Professor Woessmann, one of the
authors, explains: “If there is more choice for parents,
and more non-governmental school operators so that
schools are not managed by one big state monopoly,
countries perform much better.”
Pearson plc
Note: The score, which is on a scale of 0 to 1, is an aggregate of the following indicators: enrolment choices (freedom of enrolment choice at primary and lower secondary education), the level of school choice (percentage of pupils living in an area with more than two schools), parental expectations, and financial choice and information (availability of school vouchers and government responsibility for informing parents on school choices (primary and lower secondary).
Source: Economist Intelligence Unit and OECD.
Singapore
New Zealand
Thailand
Italy
Chile
Argentina
Belgium
United Kingdom
Mexico
Hong Kong
China
Germany
Czech Rep
Netherlands
Australia
Ireland
United States
Japan
Sweden
South Korea
Finland
Switzerland
0.88
0.85
0.79
0.79
0.78
0.67
0.64
0.62
0.59
0.59
0.59
0.54
0.49
0.47
0.44
0.41
0.41
0.23
0.17
0.17
0.09
0.07
SCHOOL CHOICE SELECTED COUNTRIES, AGGREGATED SCORE, 2009
12 Ludger Woessmann and Martin West,
“Competition from private schools boosts performance system-wide”, Vox, http://www.voxeu.org/article/competition-private-schools-boosts-performance-system-wide.
“... the share of schools that are privately operated has an economically and statistically significant positive effect on student achievement in mathematics, science, and reading.”
— Ludger Woessmann and
Martin West, “Competition
from private schools boosts
performance system-wide”

28
How this choice drives the system to better results
in practice, however, is a matter of no little debate.
Indeed, any discussion involving market-like mechanisms
and education inevitably leads to contentious, often
politicised, debate. Unfortunately, the resultant heat has
shed little consistent light.
Vouchers and charter schools
Some of the most investigated choice initiatives operate
in the US. Voucher programmes provide funding –
generally assigned by lottery as the programmes are
almost invariably oversubscribed – that pay for the
private education of underprivileged children. A 2008
review by Patrick Wolf, Professor of School Choice
at the University of Arkansas, looked at the ten best
studies of these programmes and found widely varying
results.13 In general, all or some students who used
vouchers did better academically in certain fields,
especially maths. A more recent study by Mr Wolf of
the long-standing Milwaukee voucher system brought
further variability: voucher students there outdid peers
in reading but underperformed in maths.14
The impact of such programmes on abilities tends to be
unpredictable, but that may not be the point. Parents
almost invariably are satisfied with them, although
perhaps for reasons quite apart from grades. Given
the public options available to some of these students,
physical safety is an issue: one study found no academic
differences for voucher users, but they did have lower
arrest rates.15
Another possible impact of choice is to create
competition so that all schools improve, especially
where they are made to give data on results. Debate on
the extent to which this has taken place and whether
competition was the driver of perceived change is also
ongoing.16 The one clear point is that vouchers, and
choice, do not seem to hurt existing school systems.17
A more widespread US experiment in using choice
and accountability to improve education has been
the growth of charter schools. These autonomous,
privately-run but publicly-funded schools open to all
students – capacity permitting – exist in 41 states.
In return for autonomy, these institutions are made
accountable. Charters are granted with binding
requirements to achieve certain levels of academic
success among students.
As with vouchers, the success of charter schools
as a whole is the focus of intense debate. The largest
review to date of research presents a mixed picture.
The Center for Research on Education Outcomes
looked at research from 15 American states and the
District of Columbia. It found that, on average, students
in these schools tended to do slightly worse than those
in nearby public schools. But the broader message was
variety: 17% of charter schools do better, 46% are just as
good, and 37% do worse. Moreover, the success of the
schools depends on the way they are regulated. Roughly
even numbers of states had schools where students on
average did better than in traditional schools and schools
where students did worse.18
The Learning Curve 2012 School choice and accountability: caveat scholacticus
13 “School Voucher Programs: What the Research
Says About Parental School Choice”, Brigham Young University Law Review, (2008): 415-446.
14 The Comprehensive Longitudinal Evaluation of the Milwaukee Parental Choice Program: Summary of Final Reports, February 2012, http://www.uark.edu/ua/der/SCDP/Research.html.
15 Julie Berry Cullen, Brian A. Jacob, and Steven Levitt, “The Effect of School Choice on Participants: Evidence From Randomized Lotteries”, Econometrica, (2006), 74: 1191–1230.
16 See: Caroline Hoxby, School Choice and School
Productivity: (Or Could School Choice Be A Tide That Lifts All Boats?), 2002, NBER Working Paper 8873, an influential, article advocating this argument, http://www.nber.org/papers/w8873; Greg Forster, A Win-Win Solution: The Empirical Evidence on School Vouchers, 2011; David N. Figlio and Cecilia Elena Rouse, Do Accountability and Voucher Threats Improve Low-performing Schools?, 2005, NBER Working Paper 11597.
17 Research on voucher programmes in Chile have
produced similarly contrasting results to those in America (Francisco Gallego, “School Choice, Incentives, and Academic Outcomes: Evidence for Chile”, paper 39, Econometric Society 2004 Latin American Meetings; Chang-Tai Hsieh and Miguel Urquiola, “The effects of generalized school choice on achievement and stratification: Evidence from Chile’s voucher program”, Journal of Public Economics (2006) 90: 1477–1503).
18 Center for Research on Education Outcomes,
Multiple Choice: Charter School Performance in 16 States, June 2009.

29
China
Netherlands
United Kingdom
Hong Kong
Thailand
Sweden
New Zealand
Japan
Chile
South Korea
United States
Australia
Ireland
Italy
Czech Rep
Singapore
Belgium
Finland
Germany
Switzerland
Argentina
Mexico
1.23
1.17
0.83
0.56
0.52
0.51
0.46
0.44
0.18
0.18
0.10
0.05
-0.21
-0.23
-0.25
-0.26
-0.27
-0.27
-0.39
-0.40
-0.56
-0.65
SCHOOL RESPONSIBILITY AND AUTONOMY AVERAGE SCORE, 2009
Pearson plc
Note: The score is the average of ‘index of school responsibility for resource allocation’ and ‘index of school responsibility for curriculum and assessment’. These indexes have an OECD mean of 0 and a standard deviation of 1. Positive values on these indexes indicate relatively more responsibility for schools than the local, regional or national education authority.
Source: Economist Intelligence Unit and OECD.
welfare of kids, but it is leading to some really interesting
opportunities and models of reform.” He cites Aspire
Public Schools, a California non-profit charter school
system that, even though three-quarters of students
come from impoverished families, had average scores
that exceeded the state’s overall mean by more than 5%.
The broader lesson seems to be an obvious one. In
the words of a study by Harvard academics, “school
choice can improve students’ longer-term life chances
when they can gain access to schools that are better....”19
The key, as in any market situation, is deciding which
ones are: sometimes choice means opting for existing
provision, but this does not negate its value.
Dr Finn believes that greater autonomy and accountability
are needed within US schools, but he also remarks that
“one of the sobering lessons of the last 15 years is that
hanging a sign with the word ‘charter’ in it on the front
door does not make it a better school. In any state,
some of best and worst schools are charter schools,
except perhaps in Massachusetts because it only gave
charters to people who knew what they were doing.”
Indeed, the wide variety is probably a predictable
result of how these schools provide value. According
to Professor Stecher, “the strength of charter schools
seems to be that they permit innovation outside of
bureaucracy, for good or for ill. The movement needs
to be accompanied by careful monitoring to protect the
19 David Deming, Justine Hastings, Thomas Kane,
and Douglas Staiger, School Choice, School Quality and Postsecondary Attainment, 2011, NBER Working Paper 17438.

30
School choice in developing countries
Where such provision is poor, however, choice and
accountability can be essential. James Tooley, Professor
of Education Policy at Newcastle University, has done
extensive research into the huge number of unofficial
private schools used by economically underprivileged
students in developing countries. In many cases, rather
than trusting state provision, families are willing to
spend often a substantial part of their income to send
children to these unregistered schools. The reason is
simple: parents know that education is important but
public provision is sub-standard or illusory. Professor
Tooley ascribes parents’ decisions in this area to their
mistrust of state-school teachers, who are accused of
absenteeism, poor teaching habits and poor attitudes
toward students themselves.
As with any unofficial activity, it is hard to assess its
full scope. Professor Tooley notes that the best data
from India shows around a quarter attending private
schools in rural areas, and other research indicates
around 65–70% do so in urban areas. He therefore
estimates the overall total at around 40% or more –
a figure consistent with his own, less detailed research
in communities in Ghana, Kenya, and Nigeria.20
These schools exist because they provide results:
Professor Tooley’s research in a variety of locations
has found significantly better reading, mathematics,
and English skills. Similarly, World Bank-supported
researchers from the Learning and Educational
Attainment in Punjab Schools (LEAPS) project found
that in that Pakistani state, students in such private
schools were on average 1.5 to 2.5 years ahead of
counterparts in government schools, even though the
latter spent three times as much per pupil.21
What makes these private schools so much more
effective is not immediately clear, says Professor Tooley.
They typically have fewer resources, class sizes vary
widely and often the teachers are not as well trained or
do not have as much teaching experience. He concludes
that “there is a missing ingredient [from public schools
that exists] in private schools. It must be accountability.
The teachers have to teach, otherwise they get
removed; the schools need to please parents.”
The extreme situation faced by these parents gives
the same message as the correlation between PISA
outcomes and private-school numbers: choice and
accountability can have an important impact on results.
On the other hand, the experience of school choice
in the US shows that the way these mechanisms
work are complex, require parents to have as much
information as possible and can penalise wrong choices
as much as reward right ones. Rio de Janeiro’s Ms
Costin points out, however, that the effort needed to
bring in parents is worth it even in the poorest areas:
“They are not second-class citizens. Their opinion is
important. Parents know which school is a good school.
Social pressure for quality can be exerted even by
illiterate parents.”
20 It should be noted for disclosure purposes that
Pearson, who commissioned this report from the Economist Intelligence Unit, is a minority investor in a chain of schools in Ghana co-founded by James Tooley.
21 James Tooley, Yong Bao, Pauline Dixon, John Merrifield, “School Choice and Academic Performance: Some Evidence From Developing Countries,” Journal of School Choice, 2011, 5: 1–39; Baladevan Rangaraju, James Tooley, Pauline Dixon, The Private School Revolution in Bihar: Findings from a survey in Patna Urban, 2012; World Bank, Learning and Educational Achievement in Punjab Schools Report Summary, 2008.
The Learning Curve 2012 School choice and accountability: caveat scholacticus


33
The individual benefits
On a personal level, education is good for you – literally.
In most countries, levels of academic attainment
correlate with life expectancy, and some research
suggests that this link is causal rather than coincidental.22
Other apparent personal benefits statistically related
to time spent in education include, according to one
extensive literature review, promoting better decisions
on “marriage, and parenting. It also improves patience,
making individuals more goal-oriented and less likely
to engage in risky behaviour.”23 For some, learning itself
is fun.
The most researched aspect of personal gains from
education is the economic one, referred to as the
returns to schooling. Since Gary Becker published
Human Capital in the mid-1960s, a host of studies have
calculated the financial benefit in various countries
of time spent in school. These typically reveal a gain
in annual earnings of between 8% and 10% for every
additional year of education.
It is not, however, straightforward to use such insight in
order to improve a country’s average earning potential.
Education may not even be the cause of individual higher
wages: instead it could be that educational success
signals to employers the presence of other valuable
qualities. Moreover, returns to education vary, on
occasion widely, in a number of ways. For one thing
they tend to be higher in less developed countries.
In wealthier nations benefits tend to accrue more
at the tertiary level, while in poorer ones they have
been shifting from the primary to the secondary level.
Time in school beyond that required for the occupation
which the student eventually takes up – known as
‘over-education’ – yields substantially lower returns.
Results also differ by geography, or even city, within
countries, and often also between gender.
Just why these differences appear is not always clear, but
simply keeping everyone in the black box of education
a few years longer will not yield magic results. Above
all, the quality of education matters: one World Bank
study suggested that the apparent decline in the returns
to primary education in developing countries may arise
from the length of time it takes to teach even basic
literacy and numeracy in a number of those countries.24
Getting the best at national level
Good education may, in most cases, help the individuals
being educated, but does it help their society as well?
A substantial literature sees behavioural impacts on
educated individuals that have positive societal impact –
for liberal democracies at least – including, to name just
a few, better health for the relatives of those educated,
lower arrest rates, higher voter participation and even a
greater tendency to support free speech.25
Returns to schooling: education, labour market and social outcomes
Pearson plc
22 Hans van Kippersluis, Owen O’Donnell, and Eddy van Doorslaer, “Long Run Returns to Education: Does Schooling Lead to an Extended Old Age?”, Journal of Human Resources (2009): 1–33.
23 Philip Oreopoulos, Kjell G. Salvanes, How large are returns to schooling? Hint: Money isn’t everything, National Bureau of Economic Research Working Paper 15339, September 2009.
24 Tazeen Fasih, Linking Education Policy to Labor Market Outcomes, World Bank, 2008, see also Tazeen Fasih, et al, Heterogeneous Returns to Education in the Labor Market, World Bank Policy Research Working Paper 6170, August 2012.
25 Thomas S. Dee, Are There Civic Returns to Education? National Bureau of Economic Research Working Paper 9588, March 2003; Craig Riddell, “The Impact of Education on Economic and Social Outcomes: An Overview of Recent Advances in Economics”, Canadian Policy Research Network, 2006.

34
In considering country-level benefits, the more common
area of study has also been economic. On a basic level,
education helps. Our correlation analysis shows a strong
link between average years in school – or school life
expectancy – and labour productivity. This does not
surprise Namibia’s Mr Angula: “A well-educated nation
is likely to be innovative. I don’t think that you have to
go to the statistical evidence to find that. People are
able to use knowledge for economic development.” It is
not simply that better educated people themselves are
more productive. Extensive research has found a spill-
over effect from education, with benefits arising both
from how the educated share their knowledge with
others and how they are better able to pick up new skills
themselves by building on their existing education.
The difficulty for policymakers, though, is deciding what
sort of education works best when so many factors
affect the economy. Predictably, quality appears to
be more important than duration. In one analysis,
Professors Hanushek and Woessmann found that
when cognitive skills, as measured by PISA scores, are
correlated with GDP, then the impact of total years
of schooling becomes irrelevant. In other words,
how long it took to learn was less important than that
learning had occurred.26 This may seem obvious, but it is
directly applicable to decisions such as starting primary
education a year earlier or using the same resources for
teacher training.
Ove
rall
pro
duct
ivit
y o
f lab
our
(GD
P a
t U
S$P
PP p
er
wo
rker)
RELATIONSHIP BETWEEN SCHOOL LIFE EXPECTANCY AND LABOUR PRODUCTIVITY 1990 –2011
1990 1991 1992 1993 1994 1995 1996 1997 1998 1999 2000 2001 2002 2003 2004 2005 2006 2007 2008 2009 2010
1991 0.78 0.80 0.84 0.85 0.87 0.83 0.81 0.79 0.82 0.81 0.80 0.78 0.75 0.74 0.73 0.74 0.74 0.72 0.74 0.70 0.69
1992 0.79 0.80 0.83 0.85 0.86 0.83 0.81 0.80 0.83 0.81 0.80 0.78 0.75 0.73 0.72 0.73 0.74 0.73 0.74 0.70
1993 0.79 0.79 0.83 0.84 0.86 0.83 0.82 0.80 0.83 0.81 0.80 0.78 0.74 0.72 0.72 0.73 0.75 0.72 0.73
1994 0.78 0.79 0.83 0.84 0.86 0.84 0.82 0.80 0.82 0.81 0.80 0.78 0.74 0.72 0.71 0.74 0.74 0.72
1995 0.77 0.78 0.82 0.84 0.86 0.83 0.82 0.80 0.82 0.81 0.79 0.77 0.74 0.71 0.72 0.73 0.73
1996 0.76 0.77 0.82 0.85 0.86 0.84 0.81 0.79 0.82 0.80 0.79 0.77 0.74 0.72 0.71 0.72
1997 0.75 0.77 0.83 0.85 0.86 0.83 0.81 0.79 0.82 0.80 0.78 0.77 0.74 0.71 0.70
1998 0.75 0.78 0.83 0.85 0.86 0.83 0.80 0.78 0.81 0.79 0.78 0.77 0.74 0.70
1999 0.76 0.79 0.84 0.84 0.86 0.82 0.80 0.78 0.81 0.79 0.79 0.78 0.74
2000 0.77 0.79 0.82 0.84 0.85 0.82 0.79 0.78 0.81 0.79 0.79 0.77
2001 0.78 0.77 0.82 0.83 0.85 0.81 0.79 0.78 0.81 0.80 0.79
2002 0.78 0.77 0.81 0.83 0.84 0.81 0.79 0.78 0.82 0.80
2003 0.77 0.77 0.81 0.82 0.84 0.81 0.80 0.79 0.82
2004 0.77 0.76 0.81 0.82 0.84 0.81 0.80 0.79
2005 0.77 0.76 0.80 0.82 0.84 0.82 0.80
2006 0.77 0.76 0.81 0.83 0.85 0.82
2007 0.76 0.77 0.81 0.83 0.85
2008 0.77 0.77 0.81 0.83
2009 0.77 0.77 0.82
2010 0.77 0.77
2011 0.78
The Learning Curve 2012 Returns to schooling: education, labour market and social outcomes
Note: The scatter matrix shows the correlation of school life expectancy for all years against all possible future years for overall productivity of labour. The correlation in each set of years is well above our threshold for “strong” correlations of 0.65.
Source: Economist Intelligence Unit and UNESCO.
26 Eric A. Hanushek and Ludger Woessmann, “Education and Economic Growth”, in Dominic J. Brewer and Patrick J. McEwan, eds. Economics of Education (2010).
School life expectancy (primary to tertiary)

35
More complicated than quality is the question of
what sort of content in an education system will yield
the best labour market and economic outcomes.
For example, some countries prize strong vocational
school programmes while others prefer more unified
systems. One advocate of vocational education is
Professor Schwartz, who says of the US that “having a
system focused entirely on preparing students for four-
year colleges and universities is a major problem. Only
30% of young Americans actually get a four-year degree
by their mid-twenties, and many of those wind up in
jobs that didn’t require a degree. The consequence of
not having a strong post-secondary vocational system
is that most young Americans reach their mid-twenties
without the skills and credentials needed for success in a
technology-driven economy.”
Mr Angula, whose country is looking to bolster its
vocational education system, adds that systems “need to
create linkages between the school and the community,
and the school and the economy, so that education
should have a meaning in the context that it is practised.
Sometimes it is hard for students to apply their
knowledge or skills.” Without seeing any relevance, they
might simply leave education.
INDONESIA
THAILAND
COLOMBIA
ROMANIA
RUSSIA
MEXICO
TURKEY
BULGARIA ARGENTINA
SLOVAKIA
CZECH REPUBLIC
HUNGARYPORTUGAL
KOREA
NEW ZEALAND
AUSTRALIA
BELGIUM
NETHERLANDS
UNITED STATES
NORWAY
AUSTRIAIRELAND
GREECE
JAPAN
CANADA
FINLAND
SWEDEN
SPAIN
GERMANYFRANCE
ITALY
UK
DENMARK
ISRAEL
CHILE
CHINA
School life expectancy (primary to tertiary)
0 2 4 6 8 10 12 14 16 18 20
Ove
rall
pro
duct
ivit
y o
f la
bo
ur
(GD
P a
t U
S$P
PP
per
wo
rker)
100,000
90,000
80,000
70,000
60,000
50,000
40,000
30,000
20,000
10,000
0
RELATIONSHIP BETWEEN SCHOOL LIFE EXPECTANCY ( IN 1995) AND LABOUR PRODUCTIVITY ( IN 2010)
SWITZERLAND
Pearson plc
Note: The scatter chart shows the correlation of school life expectancy in 1995 against overall productivity of labour in 2010 for 37 countries. The correlation is 0.817, well above our threshold for “strong” correlations of 0.65.
Source: Economist Intelligence Unit and UNESCO.
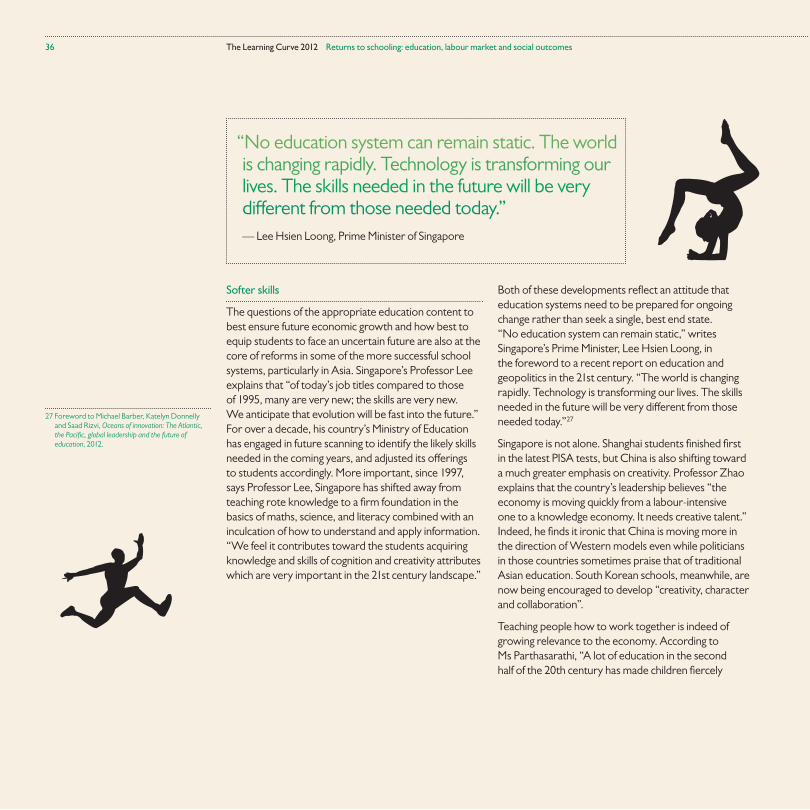
36
Softer skills
The questions of the appropriate education content to
best ensure future economic growth and how best to
equip students to face an uncertain future are also at the
core of reforms in some of the more successful school
systems, particularly in Asia. Singapore’s Professor Lee
explains that “of today’s job titles compared to those
of 1995, many are very new; the skills are very new.
We anticipate that evolution will be fast into the future.”
For over a decade, his country’s Ministry of Education
has engaged in future scanning to identify the likely skills
needed in the coming years, and adjusted its offerings
to students accordingly. More important, since 1997,
says Professor Lee, Singapore has shifted away from
teaching rote knowledge to a firm foundation in the
basics of maths, science, and literacy combined with an
inculcation of how to understand and apply information.
“We feel it contributes toward the students acquiring
knowledge and skills of cognition and creativity attributes
which are very important in the 21st century landscape.”
Both of these developments reflect an attitude that
education systems need to be prepared for ongoing
change rather than seek a single, best end state.
“No education system can remain static,” writes
Singapore’s Prime Minister, Lee Hsien Loong, in
the foreword to a recent report on education and
geopolitics in the 21st century. “The world is changing
rapidly. Technology is transforming our lives. The skills
needed in the future will be very different from those
needed today.”27
Singapore is not alone. Shanghai students finished first
in the latest PISA tests, but China is also shifting toward
a much greater emphasis on creativity. Professor Zhao
explains that the country’s leadership believes “the
economy is moving quickly from a labour-intensive
one to a knowledge economy. It needs creative talent.”
Indeed, he finds it ironic that China is moving more in
the direction of Western models even while politicians
in those countries sometimes praise that of traditional
Asian education. South Korean schools, meanwhile, are
now being encouraged to develop “creativity, character
and collaboration”.
Teaching people how to work together is indeed of
growing relevance to the economy. According to
Ms Parthasarathi, “A lot of education in the second
half of the 20th century has made children fiercely
The Learning Curve 2012 Returns to schooling: education, labour market and social outcomes
27 Foreword to Michael Barber, Katelyn Donnelly and Saad Rizvi, Oceans of innovation: The Atlantic, the Pacific, global leadership and the future of education, 2012.
“No education system can remain static. The world is changing rapidly. Technology is transforming our lives. The skills needed in the future will be very different from those needed today.”
— Lee Hsien Loong, Prime Minister of Singapore

37
individualistic, not good in a team, but these team
skills – an ability to interact with respect with people;
to empathise; to be innovatively adventurous – are
essential for certain types of creativity.” In order to
drive the teaching of collaborative skills, the Assessment
and Teaching of 21st-Century Skills project – a multi-
stakeholder group that includes the education ministries
of the US, Australia, Singapore, Finland, the Netherlands
and Costa Rica – has been seeking to develop metrics to
test such abilities. These will be integrated into the PISA
2015 tests – a sign, Professor Schleicher says, that “the
kinds of skills that matter in life are changing.”
Education can clearly deliver substantial social and
economic outcomes. Understanding how it does so,
however, and maximising those results are still works
in progress for educational leaders. Says Mr Mackay,
Chair of the Australian Institute for Teaching and School
Leadership: “None of the countries you might think
would be complacent are complacent at all: they are
investing in new metrics.”
Australia
Chile
Hong Kong
Finland
France
Germany
Italy
Mexico
New Zealand
Poland
Singapore
Sweden
United Kingdom
Secondary Tertiary
3934
4926
4426
4735
4530
5925
4517
2017
4136
6823
5026
4930
4532
PERCENTAGE OF LABOUR FORCE REACHING SECONDARY AND TERTIARY ATTAINMENT, SELECTED COUNTRIES, 2008 (%)
Pearson plc
Source: International Labour Organization.

38
In addition to the Data Bank, an important goal of
The Learning Curve project has been to create a
comparative index of educational performance –
the Global Index of Cognitive Skills and Educational
Attainment. The results are meant not only to be
interesting in themselves, but to help identify likely
sources of good practice.
First, a caveat
The exercise has not been simple. One hurdle was
determining how to measure performance. While it
would have been desirable to include broader labour
market and social outcomes on which education
arguably has an impact, this proved impossible. Even
were it demonstrably clear that education played a
definite role in these areas, it is impossible to determine
a way – consistent across time and geography – to
isolate and measure the impact of that effect.
While more direct measures of educational results
abound, robust, internationally comparative ones are
rare. PISA, TIMSS and PIRLS testing has had such an
impact in part because of the void it helped to fill.
The Index therefore, through necessity, takes a view of
educational performance based on where reasonably
good data exist. The first such area, drawing on the
results of the aforementioned tests, is the inculcation
of cognitive skills. The second is a broader measure of
educational attainment, which relies on literacy levels
and graduation rates.
This focus does not eliminate data issues. Education
systems are local: international comparability will
never be perfect. Canada’s tertiary graduation rate,
for example, is modest in the calculations for this Index
because they draw on university results. If one includes
graduates from Canada’s community colleges, though
– tertiary type-B institutions to use the international
classification – the graduation rate becomes one of
the highest in the OECD. A lack of data on the results
for type-B colleges, though, makes it impossible to do
so generally. Moreover, metrics selected for the Index
suffer from data lacunae. Singapore’s low educational
attainment score in the Index – 33rd out of 40 –
arises largely from a complete lack of available data
on graduation rates28. Finally, combining results from
different tests in a meaningful way required rebalancing
of the existing data.
Ultimately, these data are inevitably proxies for broader
results, and far from perfect ones. As Dr Finn points
out of graduation rates, “they are complicated. You
can raise your graduation rate by lowering academic
expectations.” On the other hand, such rates, like
literacy levels, do indicate in a rough way the breadth of
education in a country. Similarly, Professor Hanushek
notes that “countries that do well on PISA do well on
tests of deeper knowledge.”
Towards an index of education outputs
The Learning Curve 2012 Towards an index of education outputs
28 Singapore is one of 14 countries in the Index for which internationally comparable graduation data are lacking. (The countries were nonetheless included in the Index because they met all the other data inclusion criteria.) They were thus assigned the mean z-score of the entire country sample for the given graduation rate indicators. This represents an opportunity for further and improved data collection that will be reflected in later versions of The Learning Curve.


40
global index of cognitive skills and educational attainment – overall results
GROUP 1 AT LEAST ONE STANDARD DEVIATION
ABOVE THE MEAN
GROUP 3 WITHIN HALF A STANDARD DEVIATION
ABOVE OR BELOW THE MEAN
GROUP 4 WITHIN HALF TO ONE STANDARD
DEVIATION BELOW THE MEAN
GROUP 2 WITHIN HALF TO ONE STANDARD
DEVIATION ABOVE THE MEAN
GROUP 5 AT LEAST ONE STANDARD DEVIATION
BELOW THE MEAN
COUNTRY Z-SCORE RANK
FINLAND 1.26 1
SOUTH KOREA 1.23 2
COUNTRY Z-SCORE RANK
ROMANIA -0.60 32
CHILE -0.66 33
COUNTRY Z-SCORE RANK
DENMARK 0.50 12
AUSTRALIA 0.46 13
POLAND 0.43 14
GERMANY 0.41 15
BELGIUM 0.35 16
UNITED STATES 0.35 17
HUNGARY 0.33 18
SLOVAKIA 0.32 19
RUSSIA 0.26 20
SWEDEN 0.24 21
CZECH REPUBLIC 0.20 22
AUSTRIA 0.15 23
ITALY 0.14 24
FRANCE 0.13 25
NORWAY 0.11 26
PORTUGAL 0.01 27
SPAIN -0.08 28
ISRAEL -0.15 29
BULGARIA -0.23 30
GREECE -0.31 31
COUNTRY Z-SCORE RANK
HONG KONG–CHINA 0.90 3
JAPAN 0.89 4
SINGAPORE 0.84 5
UNITED KINGDOM 0.60 6
NETHERLANDS 0.59 7
NEW ZEALAND 0.56 8
SWITZERLAND 0.55 9
CANADA 0.54 10
IRELAND 0.53 11
COUNTRY Z-SCORE RANK
TURKEY -1.24 34
ARGENTINA -1.41 35
COLOMBIA -1.46 36
THAILAND -1.46 37
MEXICO -1.60 38
BRAZIL -1.65 39
INDONESIA -2.03 40
The Learning Curve 2012 Towards an index of education outputs
Note: The Index scores are represented as z-scores. The process of normalising all values in the Index into z-scores enables a direct comparison of country performance across all the indicators. A z-score indicates how many standard deviations an observation is above or below the mean of the countries in the Index.
Source: Economist Intelligence Unit.

41
The methodology appendix describes in more detail
the Index’s construction and relevant data issues.
The broader message of this lengthy disclaimer is that
the Index is very much a first step. We hope that, as
understanding of the outcomes of education grows,
the Index will become more complex and nuanced as
well as be populated with more robust and varied data.
For now, however, it is better to light a candle than curse
the statistical darkness.
What the leaders have – and don’t have – in common
Given the attention paid to the results of international
education tests, the leading countries in the cognitive
skills category of the Index come as no surprise.
The top five – Finland, Singapore, Hong Kong,
South Korea and Japan – all score more than one
standard deviation above the norm in this part of the
Index. The educational attainment category, based on
literacy and graduation rates, tells a slightly different
story. Here South Korea leads, followed by the UK,
Finland, Poland and Ireland, with Japan, Hong Kong
and Singapore further down the table. Because of their
strength in both measures, then, Finland and South
Korea are the clear overall leaders of the Index.
These results mirror the conventional wisdom: already
in 2007, the BBC referred to the two countries as
‘among the superpowers of education.’28 But what do
these have in common that might help to identify the
keys to educational success? On the face of it, there is
remarkably little.
In many ways, it is hard to find two education systems
more different. South Korea’s schools are frequently
described as test-driven, with a rigid curriculum and an
emphasis on rote learning. Most striking is the amount of
time spent in study. Once the formal school day is over,
the majority of students go to private crammer schools,
or hagwons. According to OECD data, of 15-year-old
students for whom data was available in 2009, 68%
engaged in private study of the Korean language, 77% in
mathematics, 57% in science and 67% in other subjects.
In later years, students typically do far more privately.
The government has become so worried about the
extent of these studies that it has banned hagwons
from being open after 10pm, but still needs to send
out patrols to shut down those which mask illegal,
after-hour teaching by posing as self-study libraries.
On the other hand Finland, in the words of Professor
Schwartz, “is a wonderful case study. Kids start school
later; school hours are shorter than most others; they
don’t assign homework; their teachers are in front of
kids less. By one estimate, Italians go to school three
years longer.” The PISA data shows that very few Finns
take out-of-school lessons either, and those who do
typically do worse on standardised tests, suggesting
that this is largely remedial help. Finally, the system
has a reputation for being focused on helping children
understand and apply knowledge, not merely repeat it.
The existing data also paint a picture of two distinct
approaches. In some cases, the systems are widely
different: average teacher salaries in South Korea are
over twice the national average, while those in Finland
are almost exactly average; pupil-teacher ratios, on the
other hand, are much higher in South Korea. Where
the two systems are similar, they are usually near the
average for all countries in the Index. The only difference
is school choice, where both are highly restrictive.
That said, the vast amount of after-school private
education in South Korea brings into question the
relevance of that metric.
The two systems, though, do share some important
aspects when examined closely. “When you look
at both, you find nothing in common at first,” says
Professor Schleicher, “but then find they are very similar
in outlook.” One element of this is the importance
assigned to teaching and the efforts put into teacher
recruitment and training. As discussed above, the
practices of the two countries differ markedly, but the
status which teaching achieves and the resultant high
quality of instruction are similar. Professor Schleicher
adds that both systems also have a high level of ambition
for students and a strong sense of accountability, but
again these are “articulated differently. In South Korea,
accountability is exam driven; in Finland, it is peer
accountability, but the impact is very similar.”
Pearson plc
28 “Finland stays top of global class”, 4 December
2007, http://news.bbc.co.uk/1/hi/7126562.stm


43
Finally, there are cultural parallels. The two societies
are highly supportive of both the school system itself
and of education in general. Of course, other countries
are also highly supportive of education, but what may
set Finland and South Korea apart is that in both, ideas
about education have also been shaped by a significant
underlying moral purpose.
Although discussions of Korean attitudes to education
frequently reference Confucian ideals, under a quarter
of South Koreans were even literate by the end of the
Korean War. In the decades that followed, education
was not just about self-improvement: it was a way to
build the country, especially as the Japanese colonial
power had restricted the access of ethnic Koreans
to schooling. The immediate cause of this drive has
disappeared, but it has helped inculcate a lasting ethic
of education which only strengthened the more
widespread attitude in Asia that learning is a moral duty
to the family and society as well as a necessary means of
individual advancement.
In Finland, the ethos is different but no less powerful.
As Mr Mackay explains, that country has made
“a commitment as a nation to invest in learning as a
way of lifting its commitment to equity. They wish
to lift the learning of all people: it is about a moral
purpose that comes from both a deeper cultural
level and a commitment at a political-social level.”
In other words, education is seen as an act of
social justice.
Both of these moral purposes can cause difficulties in
different ways. The high expectations and pressure
mean that studies regularly find South Korean teenagers
to be the least happy in the OECD. In Finland, the
egalitarian system seems less effective at helping highly
talented students to perform to the best of their
ability than at making sure average results are high.
Nevertheless, the power of these attitudes in shaping
cultural norms and political decisions in ways that help
education attainment overall are undeniable. Mr Angula,
after many years as a teacher, Minister of Education,
and Prime Minister, believes that “the key ingredient
[in creating a successful education system] is for
everybody to be committed and to understand that
they are doing a public good.”
Pearson plc
The two societies [that score highest] are highly supportive of both the school system itself and of education in general.

44
The lessons of the Index broadly reflect much which
comes out of this study. The understanding of what
inputs lead to the best educational outcomes is
still basic, which is not surprising given that robust
international benchmarking figures are few and often of
recent date. Moreover, education remains an art, and
much of what engenders quality is difficult to quantify.
General lessons to be drawn, then, are often still basic as
well. Dr Finn says of studies looking at high-performing
school systems, “I don’t detect many similarities other
than high standards, solid curriculum, competent
teachers and a supportive culture that is education-
minded.” Other research might point to the importance
of school choice and school autonomy.
These insights are valuable, but only up to a point.
Education systems are local; so too are their problems
and solutions. What Professor Hanushek says of
improving autonomy and choice applies generally:
“Local countries and institutions are extraordinarily
important. Each country has its own system. It is difficult
to take any of the specifics and apply them elsewhere.”
In seeking those solutions, officials also need a dose of
humility, remembering that formal education can do
only so much. As Professor Woessmann notes, “a lot of
these things [determinants of academic success] are not
amenable to government action. They are really within
families and how society operates.” Moreover, as the
differing approaches of Finland and South Korea show,
there are diverse paths to success.
While the local matters greatly, the universal still has
an important contribution to make. This study, like
others, ends with an appeal for more research. Both
relatively straightforward work and more complex
tasks lie ahead. The former includes the generation of
basic information on inputs and outcomes in a number
of countries; the assessment of a wider range of skills
using standardised tests; and finding appropriate
ways to compare dissimilar educational systems in
various countries. The more complex challenges
involve assessing the impact of culture on education
and the value of different means of changing cultures;
determining the attributes of those teachers that add
the most value; and understanding in more detail how
accountability and choice can interact in positive ways.
Such studies might involve innovative new metrics,
new approaches or both.
The other important plea is that what is known not be
ignored. Too often, the world’s innumerable education
reforms draw on assumptions and ideology rather
than solid information. International comparisons of
educational inputs and outputs have already awakened
countries to their own strengths and deficiencies, as well
as pointing toward possibly fruitful sources of solutions.
The LCDB and Index are offered as tools toward
furthering this understanding. It is hoped that they will
be useful as researchers and analysts seek deeper and
more nuanced insight in the years to come.
Conclusion and recommendations for further study
The Learning Curve 2012 Conclusion and recommendations for further study
“I don’t detect many similarities other than high standards, solid curriculum, competent teachers and a supportive culture that is education-minded.”
— Dr Chester Finn, President,
Thomas Fordham Institute


46
As part of The Learning Curve programme, the Economist Intelligence Unit (EIU) undertook a substantial quantitative exercise to analyse nations’ educational systems’ performance in a global context. The EIU set two main objectives for this work: to collate and compare international data on national school systems’ outputs in a comprehensive and accessible way, and for the results to help set the editorial agenda for The Learning Curve programme.
The EIU was aided by an Advisory Panel of education experts from around the world. The Panel provided advice on the aims, approach, methodology and outputs of The Learning Curve’s quantitative component. Feedback from the Panel was fed into the research in order to ensure the highest level of quality.
The EIU developed three outputs as part of the quantitative component of The Learning Curve. These are an exhaustive data bank of high quality national education statistics, an index measuring national cognitive skills and educational attainment, and research on correlations between educational inputs, outputs and wider society. Each is described in more detail below.
The Learning Curve Data Bank
The Learning Curve Data Bank (LCDB) provides a large, transparent and easily accessible database of annual education inputs and outputs and socio-economic
indicators on 50 countries (and one region – Hong Kong) going back to 1990 when possible. It is unique in that its aim is to include data that are internationally comparable. The user can sort and display the data in various ways via the website that accompanies this report.
Country selection
Country selection to the Data Bank was on the basis of available education input, output and socio-economic data at an internationally comparable level. A particularly important criterion was participation in the international PISA and/or TIMSS tests. Forty countries (and Hong Kong) were included as ‘comprehensive-data’ countries within the Data Bank, and ten countries as ‘partial-data’ countries, according to availability of data.
Indicator selection
The EIU’s aim was to include only internationally comparable data. Wherever possible, OECD data or data from international organisations was used to ensure comparability. For the vast majority of indicators, the EIU refrained from using national data sources, and when possible, used inter- and extrapolations in order to fill missing data points. Different methods for estimations were used, including regression when found to be statistically significant, linear estimation, averages between regions, and deductions based on other research. The source for each and every data point is cited in the Data Bank. The data were last collected and/or calculated in September 2012.
Over 60 indicators are included, structured in three sections: inputs to education (such as education spending, school entrance age, pupil teacher ratio, school life expectancy, teacher salaries, among others), outputs of education (such as cognitive skills measured by international tests such as PISA, literacy rates, graduation rates, unemployment by educational attainment, labour market productivity, among others) and socio-economic environment indicators (social inequality, crime rates, GDP per capita, unemployment, among others). The Data Bank’s indicators were used to create the Index and conduct a correlations exercise.
Global Index of Cognitive Skills and Educational Attainment
The Global Index of Cognitive Skills and Educational Attainment compares the performance of 39 countries and one region (Hong Kong is used as a proxy for China due to the lack of test results at a national level) on two categories of education, cognitive skills and educational attainment. The Index provides a snapshot of the relative performance of countries based on their education outputs.
Country and indicator selection
For data availability purposes, country selection to the Index was based on whether a country was a ‘comprehensive-data’ country within the Data Bank. Guided by the Advisory Panel, the EIU’s goal in selecting indicators for the Index was to establish criteria by which to measure countries’ output performance in education.
Initial questions included: What level of cognitive skills are national education systems equipping students with, and how are students performing on internationally comparable tests at different ages? What are levels of reading, maths and science in these countries? How successful are national education systems at attaining a high level of literacy in the population? How successful are national education systems at educating students to secondary and tertiary degree level?
Based on this set of questions, the EIU chose objective quantitative indicators, grouping them into two groups: cognitive skills and educational attainment. For cognitive skills, the Index uses the latest reading, maths and science scores from PISA (Grade 8 level), TIMSS (Grade 4 and 8) and PIRLS (Grade 4). For educational attainment, the Index uses the latest literacy rate and graduation rates at the upper secondary and tertiary level. Data for some countries were more recent than others; when the latest available data point was five years older than the latest, the EIU chose not to include it, although this was very rarely found to be an issue.
The EIU made estimations when no internationally comparable data were available. For example, a number of countries’ Grade 8 TIMSS Science scores were estimated by regression with PISA Science scores, when the regression was found to be statistically significant. In addition, when OECD data were not available for graduation rates,
Appendix 1: Methodology for the Quantitative Component of The Learning Curve
The Learning Curve 2012 Appendix 1: Methodology for the Quantitative Component of The Learning Curve

47
national ministry or statistics bureau data were sanity-checked and then used if deemed internationally comparable.
Calculating scores and weightings
In order to make indicators directly comparable across all countries in the Index, all values were normalised into z-scores. This process enables the comparison and aggregation of different data sets (on different scales), and also the scoring of countries on the basis of their comparative performance. A z-score indicates how many standard deviations an observation is above or below the mean. To compute the z-score, the EIU first calculated each indicator’s mean and standard deviation using the data for the countries in the Index, and then the distance of the observation from the mean in terms of standard deviations.
The overall Index score is the weighted sum of the underlying two category scores. Likewise, the category scores are the weighted sum of the underlying indicator scores. As recommended by the Advisory Panel, the default weight for the Index is two-thirds to cognitive skills and one-third to educational attainment. Within the cognitive skills category, the Grade 8 tests’ score accounts for 60% while the Grade 4 tests’ score accounts for 40% (Reading, Maths and Science all account for equal weights). Within the educational attainment category, the literacy rate and graduation rates account for equal weights. The user can, however, change the weightings and recalculate scores according to personal preference via the website that accompanies this report.
Areas for caution
Because indexes aggregate different data sets on different scales from different sources, building them invariably requires making a number of subjective decisions. This index is no different. Each ‘area for caution’ is described below.
Z-scores for PISA, TIMSS and PIRLS
It is important to note that, strictly speaking, the z-scores for PISA, TIMSS and PIRLS are not directly comparable. The methodology applied both by the OECD and the International Association for the Evaluation of Educational Achievement (IEA) to calculate the performance of the participating countries consists of comparing the performance of the participating countries to the respective mean performance. (The countries’ ‘raw’ test scores before normalisation are not published; just their scores in comparison to the other participants.) Thus, which countries participate in each test and how well they perform in comparison to the other participants has a direct impact on the resulting final scores. Given that the sample of countries that take the PISA, TIMSS and PIRLS tests are not exactly the same, there are limitations to the comparability of their scores.
The EIU has chosen not to change these scores to account for this lack of direct comparability; however, it did consider other options along the way. The main alternative suggestion from the Advisory Panel was to use a pivot country in order to transform the z-scores of other countries in comparison to that pivot
country’s z-score. Although this method is used in some studies, after substantial consideration, the EIU decided not to employ this method for the purpose of an index. The resulting z-scores after transformation depend heavily on the choice of pivot country; choosing one country as a pivot over another affects countries’ z-scores quite substantially. The EIU did not feel it was in a position to make such a choice. Despite these limitations to test scores’ direct comparability, the EIU believes that the applied methodology is the least invasive and most appropriate to aggregate these scores.
Graduation rate data
Some members of the Advisory Panel questioned the use of graduation rates in the Index in that it is not clear whether they add value as a comparative indicator of education performance. Unlike test results and literacy rates, standards to gaining an upper secondary and tertiary degree do differ across countries. Notwithstanding, the EIU believes that graduation rates do add value in evaluating a national educational system’s performance, as there is common acceptance that national education systems should aim for their citizens to gain educational qualifications, especially at the secondary level. Including graduation rate data in the Index therefore awards countries that have put this aim into practice, albeit at varying levels of quality.
Because of the variation in how countries measure graduation rates, the EIU followed the Panel’s suggestion in using
OECD graduation rate data, which use one main definition. When OECD data were not available, national ministry or statistics bureau data were sanity-checked and then used if deemed comparable. In some cases, no data on graduation rates were available. In this case, the EIU awarded the country the mean score for this indicator. One disadvantage of giving a country the mean score is that if in reality it performs worse than the average in this indicator, the Index boosts its score, and vice versa.
The EIU used the most recent data available. Because graduation rates are based on the pattern of graduation existing at the time, they are sensitive to changes in the educational system, such as the addition of new programmes or a change in programme duration. As an extreme example, Portugal’s upper secondary graduation rate increased from a range between 50% and 65% in the early 2000s to 2008, to 104% in 2010, as a result of the government’s ‘New Opportunities’ programme, launched to provide a second chance for those individuals who left school early without a secondary diploma. In order to treat countries consistently, the Index takes the 2010 figure. Although this inflates Portugal’s score in this indicator, this inflation should eventually fall out of the Index should it be updated on an annual or bi-annual basis. Given the limitations of graduation rate data, the EIU followed the Panel’s suggestion of giving a smaller weighting (one-third) to educational attainment.
Pearson plc

48
It is also important to note that the tertiary graduation rate indicator covers only tertiary-type A programmes. Tertiary-type B programmes are not included. This methodology was chosen largely because not all countries collect data and organise their education systems along the lines of A and B. As per the OECD, tertiary-type A programmes are largely theory-based and are designed to provide qualifications for entry into advanced research programmes and professions with high requirements in knowledge and skills. These programmes are typically delivered by universities, and their duration ranges from three to five years, or more at times. Tertiary-type B programmes are classified at the same academic level as those of type A, but are often shorter in duration (usually two to three years). They are generally not intended to lead to further university-level degrees, but rather to lead directly to the labour market.
Although excluding tertiary-type B programmes makes for a more relevant comparison among countries, it also slightly disadvantages a number of countries that have particularly high type B graduation rates (as these rates are not included). These countries are Canada, Ireland, Japan and New Zealand. Nonetheless, this exclusion has a limited impact on these countries’ ranking in the Index.
Other indicators
The EIU had wanted to include other education performance indicators in the Index, such as how well national education systems prepare students for the labour market and the performance of vocational studies. However, data availability was a limiting factor. The EIU found that sufficient data were not available that isolates educational attainment within labour market outcomes; and internationally comparable data on vocational studies covering all countries in the Index were not readily available either.
Correlations
With the ‘comprehensive-data’ countries data from the Data Bank, a correlations exercise was undertaken in order to test relationships across countries between education inputs, outputs and wider society. The EIU tested for correlations between the inputs to and outputs of education, the inputs to education and socio-economic environment indicators (as a proxy for wider society), and the outputs of education and socio-economic environment indicators.
Definition of a correlation and thresholds used
The correlation coefficient is a measure of the degree of linear relationship between two variables. While in regression the emphasis is on predicting one variable from the other, in correlation the emphasis is on the degree to which a linear model may describe the relationship between two
variables. Importantly, the presence of a correlation does not imply causality.
In order to ensure that relationships being found were indeed strong, the EIU looked for at least a 0.65 level of correlation (the higher it is, the stronger the relationship). It is important to acknowledge that some social science research uses a lower level of correlation, but the EIU wished to maintain a high level to avoid finding relationships between indicators that might not be significant.
Calculating correlations
Correlation tests were conducted on an indicator-by-indicator basis, between two variables over time (on an annual basis) and at three-year growth rates (for example, the three-year growth rate of 1999 (1996–99) against the three-year growth rate of 2007 (2004–07)). For the latter tests, adjustments were made to include TIMSS and PIRLS tests even though these are not taken every three years (they are taken every four and five years respectively). The EIU used the same time lags across countries on the same indicator, as per the Panel’s suggestions.
When looking for evidence of a strong correlation, the EIU sought a strong relationship over time. For example, although there may have been evidence of a strong correlation between one input variable in 1990 and an output variable in 2005; a strong level of correlation would also need to be found
for 1991 and 2006, 1992 and 2007, and so on, for at least a number of years. In addition, correlation tests were only run if there were at least 15 countries with relevant data for both of the indicators being assessed.
Factors affecting the correlations
The EIU did not find a great number of strong relationships. Given the complexity of education, this was not totally surprising. However, other factors may also account for the lack of correlations. For one, not all indicators were available going back 15–20 years in time. There was also a lack of data availability for some countries (some of this due to the Data Bank’s focus on ensuring that data being used were internationally comparable). Finally, other qualitative factors that are difficult to measure, such as culture and the quality of teaching, were not included in the Data Bank. These factors may have a significant impact on education outputs, but the EIU was not able to take these into account within the correlations exercise.
The Learning Curve 2012 Appendix 1: Methodology for the Quantitative Component of The Learning Curve

49
Barber, Michael, Katelyn Donnelly and Saad
Rizvi. Oceans of innovation: The Atlantic, the
Pacific, global leadership and the future of
education, 2012.
Barber, Michael and Mona Mourshed.
How the World’s Best Performing School Systems
Come Out on Top, McKinsey and Co., 2007.
Berry Cullen, Julie, Brian A. Jacob and Steven
Levitt. “The Effect of School Choice on
Participants: Evidence From Randomized
Lotteries”, Econometrica, (2006), 74:
1191–1230.
Center for Research on Education Outcomes,
Multiple Choice: Charter School Performance in
16 States, June 2009.
Chetty, Raj, John N. Friedman and Jonah E.
Rockoff. The Long-term Impacts of Teachers:
Teacher Value-added and Student Outcomes
in Adulthood, National Bureau of Economic
Research Working Paper 17699, December
2011.
Dee, Thomas S. Are There Civic Returns to
Education? National Bureau of Economic
Research Working Paper 9588, March 2003.
Deming, David, Justine Hastings, Thomas
Kane and Douglas Staiger. School Choice,
School Quality and Postsecondary Attainment,
2011, NBER Working Paper 17438.
Dolton, P., and O. D. Marcenaro-Gutierrez.
“If you pay peanuts do you get monkeys?
A cross-country analysis of teacher pay and
pupil performance”, Economic Policy (2011)
26: 5–55.
Duncan, Greg J., and Richard Murnane, eds.
Whither Opportunity? Rising Inequality, Schools,
and Children’s Life Chances, 2011.
Fasih, Tazeen. Linking Education Policy to Labor
Market Outcomes, World Bank, 2008.
Fasih, Tazeen, et al. Heterogeneous Returns to
Education in the Labor Market, World Bank
Policy Research Working Paper 6170, August
2012.
Figlio, David N., and Cecilia Elena Rouse.
Do Accountability and Voucher Threats Improve
Low-performing Schools?, 2005, NBER Working
Paper 11597.
Figlio, David N., and Lawrence Kenny.
Individual Teacher Incentives and Student
Performance, National Bureau of Economic
Research Working Paper 12627, October
2006.
Filmer, Deon. “Inequalities in Education:
International Experience”, in Ismail Sirageldin,
Human Development in the Twenty First Century.
Forster, Greg. A Win-Win Solution:
The Empirical Evidence on School Vouchers, 2011.
Gallego, Francisco. “School Choice,
Incentives, and Academic Outcomes:
Evidence for Chile”, paper 39, Econometric
Society 2004 Latin American Meetings.
Hanushek, Eric A., and Ludger Woessmann.
“Education and Economic Growth”, in
Dominic J. Brewer and Patrick J. McEwan, eds.
Economics of Education (2010).
Hastings, Justine S., and Jeffrey M.
Weinstein. “Information, School Choice,
and Academic Achievement: Evidence from
Two Experiments”, The Quarterly Journal of
Economics, (2008): 1373–1414.
Hoxby, Caroline. School Choice and School
Productivity: (Or Could School Choice Be A Tide
That Lifts All Boats?), 2002, NBER Working
Paper 8873.
Hsieh, Chang-Tai, and Miguel Urquiola.
“The effects of generalized school choice on
achievement and stratification: Evidence from
Chile’s voucher program”, Journal of Public
Economics (2006) 90: 1477–1503).
Lai, Fang, Elisabeth Sadoulet and Alain de
Janvry. “The Adverse Effects of Parents’
School Selection Errors on Academic
Achievement: Evidence from the Beijing Open
Enrollment Program”, Economics of Education
Review (2009) v28 n4: 485–496.
Mourshed Mona, Chinezi Chijioke and
Michael Barber. How the World’s Most
Improved School Systems Keep Getting Better,
McKinsey and Co., 2010.
OECD. “School autonomy and accountability:
Are they related to student performance?”,
PISA in Focus, October 2011.
Oreopoulos, Philip, and Kjell G. Salvanes.
“How large are returns to schooling? Hint:
Money isn’t everything”, National Bureau of
Economic Research Working Paper 15339,
September 2009.
Rangaraju, Baladevan, James Tooley
and Pauline Dixon. The Private School
Revolution in Bihar: Findings from a survey in
Patna Urban, 2012.
Riddell, Craig. “The Impact of Education
on Economic and Social Outcomes: An
Overview of Recent Advances in Economics”,
Canadian Policy Research Network, 2006.
“School Voucher Programs: What the
Research Says About Parental School
Choice”, Brigham Young University Law Review,
(2008): 415–446.
The Comprehensive Longitudinal Evaluation
of the Milwaukee Parental Choice Program:
Summary of Final Reports, February 2012.
Tooley, James, Yong Bao, Pauline Dixon
and John Merrifield. “School Choice and
Academic Performance: Some Evidence
From Developing Countries,” Journal of School
Choice, 2011, 5: 1–39.
Van Kippersluis, Hans, Owen O’Donnell
and Eddy van Doorslaer. “Long Run Returns
to Education: Does Schooling Lead to an
Extended Old Age?”, Journal of Human
Resources (2009): 1–33.
Woessmann, Ludger. “Cross-Country
Evidence on Teacher Performance Pay”,
Forschungsinstitut zur Zukunft der Arbeit
Discussion Paper 5101, July 2010.
Woessmann, Ludger, and Martin West.
“Competition from private schools boosts
performance system-wide”, Vox.
World Bank, Learning and Educational
Achievement in Punjab Schools Report Summary,
2008.
Appendix 2: Select bibliography
Appendix 2: Select bibliography

Learn more at www.thelearningcurve.pearson.com
Pearson plc
80 Strand
London
WC2R 0RL
T +44 (0)20 7010 2000
F +44 (0)20 7010 6060
Design and Production: Radley Yeldar (London) ry.comPrint: Pureprint Group
This report has been printed on Edixion Challenger Offset which is FSC® certified and made from 100% Elemental Chlorine Free (ECF) pulp. The mill and the printer are both certified to ISO 14001 environmental management system and registered to EMAS the eco management Audit Scheme. The report was printed using vegetable based inks by a CarbonNeutral® printer.


](https://img.dokumen.tips/doc/110x75/5852bcca1a28abfa398dfdfb/regulamento-taxi-versao-final-20131226-final2.jpg)