Embed Size (px)
Citation preview
FINAL REPORT
1
Understanding the Risk to European Protected Species (bats) at Onshore
Wind Turbine Sites to inform Risk Management
Final Report
Fiona Mathews, Suzanne Richardson, Paul Lintott, David Hosken

FINAL REPORT
2
Contents
page number
Executive Summary 3
Section 1: Context 13
Section 2: Bat Activity and Casualty Rates at British Wind Farms 23
Section 3: Prediction of bat fatalities 53
Section 4: Design of acoustic surveys for wind energy facilities 86
References 98
Section 5: Priorities for future research 104
Appendix 1: Bat range and distribution maps for the UK (as classified by JNCC 3rd Report under Article 17)
105
Appendix 2: Bat activity recorded on transect routes at sites surveyed in 2013
111
Appendix 3: Additional figures showing the proportion of nights correctly classified as low medium or high activity for soprano pipistrelle and noctule bats at ground and height
112
Appendix 4: Effectiveness of search dogs compared with human observers in locating bat carcasses at wind turbine sites
114 (also see attached pdf)
Appendix 5: A rapid PCR based test for identification of fifteen species of British bats
115

FINAL REPORT
3
Understanding the Risk to European Protected Species (bats) at Onshore
Wind Turbine Sites to inform Risk Management
EXECUTIVE SUMMARY
Aims and objectives This study aimed to provide information on the extent of any hazards posed by onshore wind turbines
to British bats and to supply evidence that could potentially assist in managing any such risk.
Primary objectives
(a) To assess whether bats in Great Britain are killed by wind turbines.
(b) If bats are being killed, to estimate casualty rates with acceptable precision.
Secondary objectives
(a) To explore the relationships between bat mortality and potential risk factors.
(b) To assess the relationship between the intensity of bat activity at wind turbines, as measured
using acoustic techniques, and potential risk factors.
Rationale
Evidence that wind turbines potentially pose a collision threat to bats has been available from the
USA and some European countries since the early 2000s. However the scale of any risk in the UK
was unknown. The Department for Environment, Food and Rural Affairs, Department of Energy and
Climate Change, Natural Resources Wales, Scottish Natural Heritage, Natural England and
RenewableUK therefore commissioned this research project in 2010. It is the first attempt,
anywhere in the world, to assess the impact of wind turbines on bats at a national scale through the
systematic survey of a representative sample of wind energy facilities.
The study methodology reflects the primary objective of establishing whether bats are killed by wind
turbines in the UK and, if they are, estimating the likely casualty rates. The project therefore

FINAL REPORT
4
focused on late summer and early autumn, which is the period identified elsewhere in the published
literature as the time of peak collision risk. It is possible that in the UK there are additional periods
of high risk, and these would not have been detected in this project. Because the expected numbers
of casualties was unknown, and because substantial variation between sites and regions were
anticipated, a large-scale survey was used that would allow even low casualty rates to be detected
with statistical rigour. It was not possible to make robust assessments of the different risks posed by
all possible types of wind energy installations, and therefore the project focused strategically on
large-scale commercial wind farms. Specifically, all the sites in the project had at least 5 turbines
and towers of 31-81m to hub (most were >50m): it is therefore accepted that risk estimates may not
apply to small-medium wind energy installations; to sites with only small numbers of turbines; or to
those with unconventional rotors e.g. vertical axis designs. It is also accepted that the use of a
relatively short survey window (c. 1 month) at each site means that it is impossible to detect
seasonal trends within sites.
Methods
Surveys were conducted at 46 commercial wind turbine sites, approximately equally distributed
across England, Wales and Scotland, from 2011 to 2013 inclusive. A wide range of habitats were
included, and the distribution of sites approximated their availability across Britain. In response to
the practical difficulties of locating bat carcasses in sites with dense habitat, a formal trial was
undertaken of alternative survey methodologies, and the use of trained search dogs was selected as
the most efficient and cost-effective approach. Surveys took place between July and October, and at
each site, carcass searches were conducted at 6-8 turbines on multiple occasions for approximately
one month. The average interval between searches was 2.5 days, with the aim of minimising the
extent to which bats were removed by predators and therefore the errors associated with
estimating casualty rates. This interval is considerably shorter than most other wind-turbine studies.
It is therefore likely that most carcasses would have been available for detection by our search dog

FINAL REPORT
5
teams. Because the species and sex of the bat carcases were not always readily apparent (due to
the nature of injuries, decay and/or partial predation), confirmatory analyses were conducted using
a multiplex polymerase chain reaction (PCR) developed for this project. This technique is cheaper
and quicker than other available approaches, and will be applicable to future studies of wind turbine
casualties.
Nightly acoustic surveys were conducted at both nacelle (the housing at the top of the turbine tower
that covers the generating components of the wind turbine) and at ground level at 3 of these
turbines at each site to provide an index of bat activity throughout the study period. To gain an
insight into bat activity in the absence of turbines, which could potentially aid with the
interpretation of pre-construction surveys at new wind farm sites, an additional acoustic survey was
conducted at the study sites in similar habitat but away from the turbine. In this report, as in other
studies using acoustic surveys of bats, it is not possible to determine the precise link between bat
activity recorded by the detectors and the absolute abundance of bats, since a given individual may
be recorded multiple times. Rather, we use bat activity as an index, and explore its links with
casualty risks.
The numbers of casualties found at each site is likely to be a subset of the total number of animals
killed because, even with good survey techniques, it is unlikely that all casualties will be found and a
proportion are also likely to be taken by predators. Therefore, following international conventions,
the true casualty rate has been estimated by taking these factors into account statistically. The
necessary information for this procedure was generated by conducting trials at each study site of the
rates at which dead bats were removed by predators and the proportions that were overlooked – in
the habitats present at that particular site – by the dog-handler teams. The bats used in these trials
were animals that had died of natural causes and which were supplied to the study by bat
rehabilitators

FINAL REPORT
6
Results and interpretation
In total, 120 bat carcasses were retrieved. No casualties were identified at a third of sites, but it is
important to note that zero observations does not necessarily imply that no casualties occurred.
Most fatalities were common pipistrelle bats (Pipistrellus pipistrellus), soprano pipistrelle bats (P.
pygmaeus) and noctule bats (Nyctalus noctula). In addition, single carcasses of Brown long-eared
bat (Plecotus auritus), Nathusius’ pipistrelle bat (P. nathusii) and Natterer’s bat (Myotis nattereri)
were found – the latter is the European first record of a fatality at a wind turbine site. The numbers
of casualties found at the study sites, and the species involved, are compatible with reports from
elsewhere in Northern Europe.
The estimated casualty rates, which correct for predator removals and the efficiency of the searches,
ranged from 0 to 5.25 bats per turbine per month, and from 0-77 bats per site per month, during the
period of the survey. There was considerable variability between sites, but within sites there was
little evidence of clustering of casualties at particular turbines (though it must be noted that since all
turbines were not surveyed at each site, it is possible that geographical clustering of casualties
within a particular region of the wind farm has been overlooked). The percentages of soprano
pipistrelle bat, common pipistrelle bat and noctule bat casualties were 40.6%, 48.6% and 10.7%. For
soprano pipistrelle and noctule bats, these proportions are higher than their estimated relative
national abundance. They are also higher than the relative proportions of their calls recorded in
ground-level acoustic surveys, where only 16% of recorded calls were soprano pipistrelle and 4%
were noctule, but are more similar to the species distributions found in recordings made at the
nacelle.
Approximately equal numbers of male and female casualties were found, and there was no evidence
for an excess of juveniles. It therefore does not appear that young bats are more at risk of collision

FINAL REPORT
7
during July-October, perhaps due to poorer navigational abilities, as has sometimes been suggested.
When considering the impacts on populations, this finding is important as population modelling on a
wide range of bat species has indicated that whilst juvenile survival rates have little impact on the
viability of populations, the adult survivorship is extremely important (Schorcht et al. 2009).
However, we caution that the sample size was relatively low for this analysis, and therefore type II
error (failing to detect a true association when one exists) is a possibility. In addition, different
results may be obtained where wind turbines are sited close to maternity roosts.
The risk to bats from wind farms increased with the number of turbines: there was no evidence to
suggest that the risk from an individual turbine at a large site was any different from that at a small
site. There was also an increasing risk to bats with larger rotor sizes: each metre increase in blade
length was associated with an increase of approximately 18% (95% confidence intervals 5% to 32%)
in the probability of a casualty (of any species) occurring. Similar relationships were apparent for the
numbers of bat casualties. In contrast, the height of the nacelle, and the period for which the wind
farm had been operational were not independently linked with the risk to bats.
Weather conditions were also linked with bat fatalities, as had been expected from previous
research in other countries. Most nights where casualties occurred (81.5%, 95% Confidence
Interval* 69.2, 89.6) had low mean wind speeds (≤5 m/s measured at the ground) and maximum
night-time temperatures of >10°C. It is possible to be confident that most nights with wind speeds
>5m/s will have no casualties: formally, we can estimate that 95.3% (95% CI 91.5, 97.4) of nights
with mean wind speeds >5m/s will have no casualties. However, it must be noted that most nights
in the study had low wind speeds, and only 3.6% (95% CI 2.7-4.8) of these had casualties. It can
* The 95% confidence interval gives the boundaries within which the estimate would be expected to fall 95% of the time were the project repeated multiple times. Wide confidence limits therefore indicate a high degree of uncertainty about the size of the effect, whereas narrow confidence limits indicate that the mean has been estimated with high precision.

FINAL REPORT
8
therefore be concluded that whilst curtailing wind turbines in low winds would be extremely
effective in minimising the collision risk to bats, it would also mean that turbines would be curtailed
on most nights and, on average, only 3.6% of these nights would present a risk to bats. It may
therefore be necessary to apply additional measures to identify that a substantial risk exists at a
particular site or during a particular time-period (for example by finding casualties during post-
construction monitoring) before considering curtailment as a mitigation strategy. A simple strategy
that should be considered at all sites where technically feasible is to restrict the rotation of turbine
blades as much as possible below the cut-in speed (e.g. by feathering the blades). This will have a
positive outcome for bats, as the amount of time the blades are turning at low wind speeds will be
reduced, whilst also involving no loss of energy generation.
For all bats collectively, the number of bat casualties declined with the area of broad-leaf woodland
within a 1.5km radius of the centre of the wind farm, possibly through the provision of alternative
foraging habitat. This relationship was also evident when soprano pipistrelle bats were analysed
individually (p = 0.108 and p = 0.002 respectively). For common pipistrelle and noctule bats, the
associations were in the same direction, but were not statistically significant (p=0.108 and p=0.336
respectively). In contrast, the total area of coniferous woodland (including recent clear-fell) was
associated with increased risks to noctules (p<0.001). At a smaller spatial scale, sites with broadleaf
and mixed woodland within a 200m buffer had an 86% probability of no soprano pipistrelle
casualties. In contrast, sites without broadleaved and mixed woodland in a 500m radius had a 94%
probability of no noctule bat casualties (coniferous woodland gave similar results to those for
broadleaved and mixed woodland). However, whilst woodland was a good predictor of where
casualties would not occur, it was of much less value in predicting where fatalities were likely: most
sites without woodland had no pipistrelle casualties, and most sites with woodland had no noctule
casualties. The presence or absence of woodland is therefore most likely to be useful as a means of

FINAL REPORT
9
“ruling in” areas potentially suitable for wind farms (the direction of this association depending on
species) rather than for identifying areas likely to be problematic.
As expected there were also positive associations between bat activity indices and casualty rates.
These were present for both ground and height recordings, but for soprano pipistrelles, the
confidence intervals were wide, possibly because their activity patterns were much more variable
than for common pipistrelles. Sites were categorised according to whether the activity of all
pipistrelles at ground level was high, medium or low (the maximum pass rate recorded across the
site each night was averaged across all survey nights and divided into thirds). Those sites in the
lowest third had significantly fewer casualties than those in the upper two thirds. However, it is
important to note that none of the models explained most of the variability in collision risk, and
there is considerable uncertainty associated with the estimates. This partly reflects the difficulties of
modelling rare events, but also appears to reflect a high level of inherent variability in collision risk
that is not explained by bat activity or the other features we explored. For example, sites studied in
more than one year had different fatality patterns in each year; and whilst many fatalities occurred
at sites with high activity levels, some occurred at sites with very low bat activity rates.
Bat activity at control locations (away from turbines) was also examined as an index of background
bat activity at the site. This measure will be similar to pre-construction survey data in that there are
no repellent or attractive effects from turbines. However it is clearly not an exact equivalent as our
control data are collected contemporaneously with fatality monitoring, whereas pre-construction
data are temporally separated and would therefore be expected to predict fatalities less well.
Activity at the control locations was not a useful predictor of the number of bat casualties, but it was
a predictor of whether or not any casualties occurred (i.e. a binary yes/no categorisation). Sites in
the highest third of pipistrelle bat activity at control sites had a 75% probability (95% CI 46.8, 91.1) of
pipistrelle casualties, though only approximately a third of sites in the top third of overall bat activity

FINAL REPORT
10
had bat casualties of any species (33.5%; 95% CI 19.7, 57.0). Nevertheless, bat activity may be useful
in identifying sites at low risk: 93.3% (95% CI 70.2, 98.8) of sites classified as having low-medium bat
activity at control sites had no casualties. In addition, it may be valuable in identifying sites with
unusually high levels of bat activity where the development of wind farms would be best avoided.
Consideration must now be given to whether classifying a site as being simply at risk of any
casualties is useful, or whether predictions must be better able to quantify the scale of risk in order
to be useful. If it is, then further species-specific research, preferably using preconstruction data, is
warranted.
This research project has identified standardised methodologies which could be applied to future
surveys of wind turbine sites. Specifically we have found that bat activity is highly variable and an
increase in the duration of static surveys would provide more robust assessments of bat activity.
Our data are derived from post-construction surveys, but data from the control locations (away from
turbines) also suggest that it is likely that the same variability would be present in preconstruction
data. Although ground-based monitoring alone is likely to detect whether species at risk of collision
are present at a site, caution is warranted in interpreting indices of abundance. Our surveys show
that that the relative abundance of noctule and soprano pipistrelle bats varies between acoustic
recordings made simultaneously at the ground and at the nacelle. Use of the ground-level data
alone would underestimate the relative abundance of these species, presumably because some bat
passes from these species are made only at heights beyond the acoustic range of the ground-based
detector. Given that both noctule and soprano pipistrelle bats are at risk of collision with wind
turbines, consideration should be given to the use of acoustic monitoring at height.
Conclusions
1. This study has shown that bat casualties occur at British wind energy installations at rates
similar to those reported elsewhere in Europe. The collision rate per turbine ranged from 0

FINAL REPORT
11
to 5.25 bats turbine-1 month-1 during the survey period (July-October). At a third of sites, no
casualties were found, and at 15% of sites, the rate exceeded 1 bat tubine-1 month-1. From
this project it is not possible to conclude whether or not there is an impact on local or
national bat populations.
2. The species identified as being at highest risk of collision are common pipistrelle, soprano
pipistrelle and noctule bats. This finding also aligns with evidence collected elsewhere in
Europe. Single casualties of Nathusius’ pipistrelle, brown long-eared and Natterer’s bats
were also found. Because our work was not conducted within its strongholds, it is difficult
to make inferences about the scale of the risk to Nathusius’ pipistrelle bat. For the same
reason, the lack of casualties of greater or lesser horseshoe bats, barbastelle or Leisler’s bats
in this project, also does not imply an absence of localised risk. Some areas have high
concentrations of Myotis bat activity during swarming periods, and any risk associated with
movements to these sites would not have been captured during this project.
3. Casualty rates are highly variable. Most of this variability appears to be due to site-specific
factors, and is not simply explained by differences in bat activity levels. Collision risk is
generally lowest at locations with low bat activity, but risks rise very rapidly with increasing
activity, and not all sites with high risk had high bat activity. Further work is required to
determine whether preconstruction surveys can usefully predict future risk of collision at
wind turbine sites: initial evidence from this study using data collected away from turbines
suggests that low bat activity may be useful in identifying low risk sites, but that high bat
activity does not necessarily indicate high collision risk. Nevertheless, the precautionary
principle would indicate that sites with unusually high levels of bat activity would be best
avoided as sites for wind energy installations.
4. The size of the wind energy installation had no link with the per-turbine casualty rate. This
means that there is a simple increase in risk for each additional turbine. Turbine number

FINAL REPORT
12
had a greater effect on the risk a site posed to bats than any other feature identified in the
project.
5. Turbines with larger blade lengths pose an increased risk to bats, and this is a stronger
predictor than the height of the nacelle.
6. Most fatalities occur on nights of relatively low mean wind speed (≤5m/s at ground level).
However, most turbines that are operational on nights of mean low wind speed have no bat
casualties. The link between ground and rotor-level wind speed is difficult to model, but
may equate to a speed of 7-9 m/s, based on the broad relationship between average wind
speeds observed at ground and height for a subset of 27 sites were paired data were
available. Using the subset of 18 sites where wind speed data from the nacelle were
available and where casualties were considered fresh, all casualties occurred on nights with
mean wind speed <10m/s.
7. The presence of woodland within a 1500m radius of wind farms in the vicinity of wind
turbines appears to reduce the risk to pipistrelles but increase the risk to noctule bats.
However, noctule bat casualties are relatively uncommon events and therefore most of the
sites with woodland within this radius will experience no casualties.
8. Trained search dog and handler teams are the most effective and efficient way of identifying
dead bats at wind turbine sites.
9. Acoustic recordings made at the ground and nacelle give different estimates of the relative
abundance of species on site, with ground-level recordings underestimating the abundance
of soprano pipistrelle and noctule bats within the ‘at risk’ zone of the turbine rotor sweep.
10. Bat activity shows extremely high variability. The day-to-day variation in bat passes is similar
to that observed between different sites, and in some cases – notably for common
pipistrelle, soprano pipistrelle and Myotis bat activity at height – can even exceed it. Much
longer monitoring periods than are currently used as standard practice are therefore
required for robust estimation of bat activity.

FINAL REPORT
13
SECTION 1: CONTEXT
Overview of Wind Energy Development
Great Britain has some of the most favourable conditions for wind energy generation in the world
(Asif and Muneer 2007). In the UK, installed onshore wind capacity at the end of 2014 was
7,994MW, with a further installed capacity of 4,049MW offshore (RenewableUK 2015), making the
UK the third largest European generator of wind power (European Wind Energy Association 2015,
Figure 1.1). At the end of 2014, there were 692 onshore wind projects (with a total of 4,812
turbines) in operation across the UK; and three of the five largest wind farms in Europe have been
built, or are under construction, in the UK (as reported mid-2013, (European Wind Energy
Association 2013). In contrast to many other European countries, economic conditions appear to
have had less of a restrictive effect on wind energy expansion in recent years (Table 1.1)(European
Wind Energy Association 2015): in 2014, 59.5% of all new installed capacity was in Germany and the
UK (European Wind Energy Association 2015).
Figure 1.1. Contribution of EU member states to total installed onshore and offshore wind energy capacity (2014).(European Wind Energy Association 2015)
Germany 34%
Spain 20%
UK 11%
France 8%
Italy 7%
Sweden 5%
Portugal 4%
Denmark 4%
Poland 3%
Romania 2%
Netherlands 2%

FINAL REPORT
14
Table 1.1. Newly installed and total capacity in the UK (onshore and offshore) compared with the
other leading generators of wind energy in Europe (European Wind Energy Association and 2014,
European Wind Energy Association 2015)
Newly Installed
2012 (MW)
Newly Installed
2013 (MW)
Newly installed
2014 (MW)
Total Installed
Capacity (MW)
UK 2,064 1,883 1,736 12,440
Spain 1,110 175 27.5 22,987
Germany 2,297 3,238 5,279 39,165
France 814 631 1,042 9,285
Italy 1,239 444 108 8,663
Potential for conflict between wind turbines and bats
Bat casualties have been identified at European wind farms for more than a decade (for summary
see Table 1.2) (Rydell et al. 2010b). Although 27 species have been identified, the majority have
been common pipistrelle (Pipistrellus pipistrellus, 18%), noctule (Nyctalus noctula, 14%), Nathusius’
pipistrelle (P. nathusii, 13%), soprano/common pipistrelle (P. pipistrellus/pygmaeus, 11%) and
Leisler’s bats (N. leisleri, 8%)(EUROBATS 2014a). These data cannot be taken to represent directly
the actual relative mortality risks across species, as the data were not derived from systematic
survey effort. Nevertheless, they suggest that species in the Pipistrellus genus and Nyctalus genus
are likely to be most at risk from wind turbines. It is difficult to draw inferences for rare species such
as barbastelle (Barbastella barbastellus) or greater horseshoe bats (Rhinolophus ferrumequinum), as
encounter rates would be expected to be very low and further research is needed within areas
which are their strongholds: some such sites are currently in the planning system. It is notable that
very few casualties have been found of common and widespread species such as Brown long-eared
bats (0.09%) or of all Myotis spp. (0.6%).(EUROBATS 2014a). It would therefore be reasonable to
conclude that these species are at lower risk than species in the Nyctalus and Pipistrellus genus, at
least within the open environments from which most of the data are derived. However, as

FINAL REPORT
15
recommended by EUROBATS, further work is warranted for wind turbines ‘key-holed’ into
woodlands (EUROBATS 2014).
Table 1.2. Reported bat fatalities in Europe 2003-11 (EUROBATS 2014a)
Species AT BE CH CR CZ DE ES EE FI FR GR IT LV NL NO PT PL SE UK Total
Nyctalus noctula 24 3 716 1 12 10 1 5 1 773
N. lasiopterus 21 6 1 8 36
N. leisleri 1 1 108 15 39 58 2 206 430
Nyctalu spp. 2 16 18 Eptesicus serotinus 7 43 2 14 1 1 3 71
E. isabellinus 117 1 118 E. serotinus / isabellinus 11 16 27
E. nilssonii 3 2 6 13 1 1 8 34 Vespertilio murinus 5 2 89 6 1 1 3 1 108
Myotis myotis 2 2 2 6
M. blythii 4 4
M. dasycneme 3 3
M. daubentonii 5 2 7
M. bechsteinii 1 1 M. emarginatus 1 1 2
M. brandtii 1 1
M. mystacinus 2 2 4
Myotis spp. 1 3 4 Pipistrellus pipistrellus 5 3 431 73 278 1 14 243 1 1 1050
P. nathusii 2 2 565 87 34 2 23 7 12 5 739
P. pygmaeus 46 121 1 31 1 1 1 202 P. pipistrellus/ pygmaeus 1 483 24 54 35 1 598
P. kuhlii 51 44 81 37 213 P. pipistrellus/ kuhlii 19 19
Pipistrellus spp. 13 2 36 20 85 2 2 85 3 248
Hypsugo savii 24 1 44 30 28 10 43 180 Basbastella basbastellus 1 1 2 4
Plecotus austriacus 1 6 7
Pl. auritus 5 5 Tadarida teniotis 23 1 22 46
Miniopterus schreibersii 2 4 3 9
Rhinolophus ferrumequinum 1 1
R. mehelyi 1 1
Chiroptera spp. 1 46 46 320 1 189 8 1 102 2 30 7 753
Total 27 6 2 139 20 2110 1191 3 6 983 199 16 40 22 1 870 29 47 11 5722

FINAL REPORT
16
The potential for wind turbines to cause substantial numbers of bat casualties and affect the local
population, has been highlighted in both Europe and the USA (Arnett et al. 2008, Rydell et al. 2010b,
Hayes 2013, Hedenström and Rydell 2013). Concern has also been raised about the potential of
wind turbine casualties to influence populations outside their national boundaries, due to effects on
migrating bats (Voigt et al. 2012, Lehnert et al. 2014). However, no scientific study has ever
established the actual impact of wind-turbine linked deaths on local populations (EUROBATS 2014a).
This does not imply that no effect exists, but rather that estimation of the proportion of the
population of bats killed is extremely problematic: baseline data on population size and structure are
frequently lacking (EUROBATS 2014a, Huso and Dalthorp 2014). Even where local population data
are available, it is very difficult to disentangle the effects of the wind turbine from those of other
impacts such as alterations in land use, loss of daytime roosts or climatic fluctuations (EUROBATS
2014a, Huso and Dalthorp 2014).
Why bats are killed at wind turbines
Several hypotheses have been proposed to explain why bats are killed by wind turbines (Kunz et al.
2007, Cryan and Barclay 2009, Rydell et al. 2010a). These include: accidental encounter, particularly
by migrating or juvenile animals; deliberate foraging around the blades; and deliberate use of tall
structures as display sites by bats in the breeding season. In North America, casualties of migrating
and tree-dwelling species are of primary concern (Jameson and Willis 2014). Recent research has
shown that migrating bats preferentially visit tall structures in the landscape, potentially explaining
their high turbine collision rates (Jameson and Willis 2014). In addition, the use of thermal imaging
has shown tree-dwelling bats preferentially orientating towards turbines and approaching turbines
from the leeward side (Cryan et al. 2014). It has been suggested that tree bats use streams of air
flowing downwind from wind turbines while searching for roosts and insect prey, similar to those
produced around trees at night (Cryan et al. 2014).

FINAL REPORT
17
In North America, an excess risk to breeding males has been reported, possibly resulting from males
investigating tall structures in the landscape for use as display sites (Cryan et al. 2012). However,
this pattern is not apparent among casualties in Europe (Rydell et al. 2010b). In contrast with N.
America, peak fatality periods in Europe do not correspond with peak migration times, and in
addition, there is no evidence that species which use trees as day-roosts or mating sites are at higher
risk (Rydell et al. 2010b). It has therefore been suggested that in Europe fatality risks are more likely
to be linked with foraging behaviour rather than migration (Rydell et al. 2010a). Nevertheless, it is
clear that at least some species in Europe are killed during migration, and therefore the impacts of
turbine-induced fatalities may extend beyond the immediate local population (Voigt et al. 2012,
Lehnert et al. 2014).
In addition to direct collision with moving turbine blades, a significant proportion of fatalities may be
due to barotrauma (Baerwald et al. 2008), that is, damage to tissues, particularly in the lungs and
ears, by the rapid changes in air pressure near turbine blades. The relative importance of these two
mechanisms is unclear; recent research suggests that most bats with barotrauma also have evidence
of direct collision (Rollins et al. 2012). It is likely that the numbers of bats affected by barotrauma is
under-recorded, due to (1) bats killed as a results of barotrauma need to be examined by post-
mortem immediately after death (Rollins et al. 2012) and (2) if there is a delay between an
encounter with the turbine and fatality the casualty may not be located under the turbine (which
has been noted with some large raptors which continue to soar even after collision). This could
affect overall estimates of casualty rates. However, further research into the effect of this is
extremely difficult due to the cost and practicalities of increasing the search area and searching
turbines daily, first thing in the morning.

FINAL REPORT
18
History of work on bat-wind turbine conflicts and legal context for the UK
The first commercial wind farm in the UK opened in 1991. However, little attention was paid to the
potential impacts on bats until 2008, when, amid concerns about bat fatalities reported in the USA,
Germany and elsewhere, parties to the EUROBATS Agreement were urged to draw up national
monitoring strategies (Rodrigues et al. 2008). In the European Union, the Environmental Impact
Assessment (EIA) Directive 85/337/EEC legally requires an assessment to be carried out for all wind
farms with 5 or more turbines, or which are over 5MW capacity. Also, all member states are
required to restore or maintain their bat populations in favourable conservation status (Council
Directive 92/43/EEC); translation of the directive into domestic legislation† makes it an offence to
deliberately (‘recklessly’ in Scotland) kill or injure a bat; or to deliberately (‘intentionally or
recklessly’ in Scotland) disturb bats in a way that would (significantly in England Wales and Scotland)
affect their local distribution or abundance. A scoping report was therefore commissioned jointly by
the British government and the industry body (RenewableUK) (Jones et al. 2009). This reported two
cases where bat casualties had been found (n=8 in total; all pipistrelles), and suggested that a formal
study was required.
Interim guidance was issued by the Statutory Nature Conservation Organisations in 2009, with minor
updates being published in 2012 and 2014 (Natural England 2009, 2012, 2014). This guidance
categorises likely risks to different bat species as ‘high’, ‘medium’ or ‘low’ according to flight and
foraging characteristics. Additionally, population risks are evaluated by joint consideration of
collision risk and estimates of population sizes (Table 1.3). The EUROBATS guidance proposes that
turbines should not be placed closer than 200m to woodland (Rodrigues et al. 2008), whereas the
current recommendations for the UK are that the blade tips should be at least 50m from woodland
† In England and Wales, the relevant legislation is the Wildlife and Countryside Act (1981) (as amended); the Countryside and Rights of Way Act, 2000; the Natural Environment and Rural Communities Act (NERC, 2006); and by the Conservation of Habitats and Species Regulations (2010). In Scotland, the key legislation is the Conservation (Natural Habitats &c.) Regulations 1994 (as amended). In Northern Ireland, bats are listed under Schedule 2 of the Conservation (Natural Habitats &c.) Regulations (Northern Ireland) 1995.

FINAL REPORT
19
or hedgerows (EUROBATS stand-off distances may be used in some circumstances). It is argued that
a smaller buffer size is acceptable in the UK, because the activity of bats found here tends to decline
rapidly with increasing distance from linear landscape features and woodlands.
Table 1.3. Assessments of collision risk and likely impacts on the conservation status of bat populations found in the UK (Natural England 2009, 2014).
Risk of collision Low Medium High
Myotis species Long-eared bats (Plecotus spp.) Horseshoe bats
(Rhinolophus spp.)
Common pipistrelle (Pipistrellus pipistrellus)
Soprano pipistrelle (P. pygmaeus)
Serotine (Eptesicus serotinus)
Barbastelle (Barbastella barbastellus)
Noctule (Nyctalus noctula)
Leisler’s (Nyctalus leisleri)
Nathusius’s pipistrelle (P. nathusii)
Risk to populations Low Medium High
Myotis species (Myotis spp.)
Long-eared bats (Plecotus spp.) Horseshoe bats
(Rhinolophus spp.) Common pipistrelle
(P. pipistrellus) Soprano pipistrelle
(P. pygmaeus)
Serotine (E. serotinus) Barbastelle
(B. barbastellus)
Noctule (N. noctula)
Leisler’s (N. leisleri)
Nathusius’s pipistrelle (P. nathusii)
It is acknowledged that risk assessments for UK bats are restricted by a lack of evidence in crucial
areas (Natural England 2014). Population estimates are uncertain, therefore even if collision rates
are known inferences about the impact of turbine collisions on population viability, are also
uncertain. Evidence is also lacking on the behaviour of bats around turbines. It might be anticipated
that species which tend to fly at low heights and close to vegetation, such as brown long-eared bats
(P. auritus) would be at lower risk than those which regularly fly in the open and at greater heights,
such as noctules (N. noctula). These differences are reflected in the current classifications of risk
(Table 1.3). However, it is unclear whether the presence of a turbine would alter bat behaviour.
Such alterations could either be attractive or repellent. Work on very small wind turbines in the UK

FINAL REPORT
20
has suggested that bats avoid areas with turbines (Minderman et al. 2012), whilst other authors
have suggested that turbines could be attractive (Kunz et al. 2007, Cryan et al. 2014).
Migratory activity, a known risk factor for wind turbine collisions, particularly North America, was,
until very recently, thought to be absent among bats in Britain and Ireland. However, evidence of
bats occurring mid-way between Plymouth and Roscoff (from recordings made on cross-channel
ferries) (Mathews pers. obs), new banding data (Hargreaves and Mathews pers. obs. 2013), and
seasonal peaks in acoustic records (Russ et al. 2001) now provide evidence that at least some of the
British Pipistrellus nathusii population migrates. This species appears to be expanding its range into
the UK (Lundy et al. 2010) and further work on its migratory habits is currently being undertaken by
The Bat Conservation Trust, The University of Exeter, and The Vincent Wildlife Trust using
approaches including stable isotope analysis and acoustic surveys.
At present, most work on wind turbines and bats is focused on preconstruction assessments: the
principle is that accurate assessment of risk will minimise conflicts as high risk sites will be avoided
and/ or appropriate mitigation will be initiated. Proposed wind energy developments are therefore
required to assess the likely risks posed to bats. The use of the site by bats must be evaluated, with
a focus on identifying whether the site is used by significant numbers of bats, especially those
species identified as being at high risk. Emphasis is also placed on identifying bat roosts on, or
adjacent to, the site; and on determining whether flight paths currently used by bats are likely to
place them at risk of collision. However, there is no standardised prescriptive guidance on survey
methods. Therefore surveys range from desk studies of historical records, to roost searches and
acoustic surveys. The amount of effort deployed is roughly guided by the size of the development
and the risk of significant numbers of bats using the site (Table 1.4). In practice, most sites proposed
for the generation of more than >500kW are subject to a combination of these strategies, with at
least one acoustic survey per month between April and October. Separate ‘Good Practice’ guidance

FINAL REPORT
21
produced by The Bat Conservation Trust (Hundt 2012), and followed by most ecologists within the
Chartered Institute of Ecology and Environmental Management (CIEEM) recommends:
• investigating roost sites (of high/medium risk species or of district importance and above); • transect surveys seasonally (low risk sites), monthly (medium risk sites) or twice a month
(high risk sites); • static surveying for five consecutive nights in each season (low risk), five consecutive nights
per month (medium risk sites) or two lots of five consecutive nights per month (high risk sites);
• survey at height where justified.
Updated bat survey guidance has been produced, but pending the results of this project, has not
specifically included recommendations for wind energy sites. However, for assessing the impact of
other types of development, it recommends up to 5 consecutive nights of survey, with repetition
frequency (per season or per month) depending on habitat suitability (Collins 2016).
Table 1.4. Criteria for pre-construction survey effort at site (adapted from Hundt 2012)
Quality of habitat and number of habitat
features likely to affect bat mortality rates if
altered by development
Species likely to use site
Importance of roosts, of species likely to use site, which may be affected
by development
Potential risk level of development
No potential habitat for roosting, foraging or
commuting bats None Local Lowest
Low number, single slow risk species
High number, several low risk species
Parish Low
Low number, medium risk species
High number, medium risk species
District
County Medium
High foraging and/or roosting potential. Good
connectivity within landscape
High number, single high risk species
High number, several
high risk species High number, all high
risk species
National
International
High
Standardised post-construction monitoring, including acoustic and carcass surveys, is recommended
for sites identified as ‘high risk’ (Natural England 2014). In reality, little post-construction monitoring

FINAL REPORT
22
occurs. This is at least partly because responsibility for requiring and enforcing survey conditions lies
with Local Planning Authorities and other Competent Authorities, which are reluctant to impose
conditions that could potentially be open to legal challenge. A further particular difficulty is that
while generic guidance on survey designs is available, the lack of standardised methodology makes it
extremely difficult to judge whether a particular level of reported bat activity would place a site as
being in a ‘high risk’ category: this point has already been raised by at least one Planning Inspector at
Public Enquiry (2009 Planning Appeal re. Hempnall, Norfolk; appeal reference no.
APP/L2630/A/08/2084443). Further, there has been no assessment of the relationship between pre-
construction and post-construction acoustic surveys (or collision risk). It is therefore unclear how
pre-construction data can be used to predict post-construction risk. A final difficulty for Local
Authorities is that the legal basis of bat protection relates to the conservation status of local
populations (except potentially in Scotland, where recklessly killing a bat is also an offence). Given
that local population sizes are very poorly characterised, it is unclear how or whether mitigation
(such as specifying turbine cut-in speeds) could be triggered on the basis of reduced bat activity or
bat fatalities.
Current research
To address some of the identified knowledge shortfalls, a large project funded by The Department
for Environment, Food and Rural Affairs (Defra), The Department of Energy and Climate Change
(DECC), Scottish Natural Heritage, Natural Resources Wales, Natural England, and the industry body
RenewableUK was commissioned in 2010. The primary aims were to:
1. Determine whether bats are killed by wind turbines in the Great Britain.
2. Establish the species and sex distribution of any bat casualties at wind turbines.
3. Assess the relationships between casualty rates and bat activity (acoustic data), habitat and
local weather in order to improve future mitigation strategies.

FINAL REPORT
23
SECTION 2: BAT ACTIVITY AND CASUALTY RATES AT BRITISH WIND
FARMS
Introduction
EUROBATS Resolution 7.5 (Eurobats 2014b), recognises the need for standardised survey
methodologies and risk assessments when studying the risk to bats from wind turbines. However,
most assessments have been based on either incidental casualty reports (Rydell et al. 2010b,
EUROBATS 2014a), or from detailed longitudinal studies of individual or small numbers of wind
farms conducted as part of legal obligations (e.g. (Brinkmann 2005, Barclay et al. 2007, Niermann et
al. 2007, Arnett et al. 2008, Bach et al. 2013, Bio3 2013). Whilst these approaches have provided
useful data, they also have significant limitations. The sites studied are therefore not a
representative sample of all those available, making extrapolations about national or regional
fatality rates problematic. In addition, it is difficult to separate out the effect of predictors, such as
turbine height, from potential confounding variables such as turbine age or local habitat. Finally,
differences in observer effort and monitoring protocols at different facilities make it difficult to
combine data from different study sites. The current study is the first attempt, anywhere in the
world, to assess the impact of wind turbines on bats at a national scale through the systematic
survey of a representative sample of wind energy facilities.
Given that the primary objective of the research was to establish the extent and nature of fatalities
occurring at British wind farms, rather than to assess temporal variations in casualty rates at
particular focal sites, the project used a cross-sectional sampling of large numbers of wind farms.
Recognising the difficulties likely to be encountered with identifying potentially small numbers of bat
carcasses, particularly in moorland and arable habitats, where vegetative cover is likely to conceal

FINAL REPORT
24
carcasses, attention was given to identifying a robust methodology that could be applied
consistently at all sites. Consideration was given to the use of search dogs, a method found to be
successful on a small scale in the USA (Arnett 2006), given that improvement of search conditions by
habitat removal were unlikely to be acceptable. We conducted a large, blinded, randomised trial
and found that search dogs were considerably more effective in finding carcasses, identifying 73% of
carcasses compared with 20% for human observers. In addition, search dog-handler teams were
considerably more efficient, completing searches in approximately 40 minutes, which was less than a
quarter of the time taken by humans (Mathews et al. 2013). Therefore, a team of 5 search dogs and
handlers were specifically trained to undertake this project (full details are provided in Section 4). In
addition to developing a novel approach to carcass identification, attention was also paid to the
choice of technique for the acoustic monitoring of bat activity. Static detectors able to record in
real-time for prolonged periods were used because of their ability to provide continuous information
from the study turbines. We selected Songmeter2 (SM2 and later newer versions, SM2+) detectors
(Wildlife Acoustics USA) on the basis of their omni-directional microphone, longer acoustic range,
greater reliability and ease of deployment compared with other similarly-priced passive detectors:
this project was their first use in the UK. Whilst more sensitive bat detectors are available (for
example Avisoft Ultrasound Gate, Avisoft Bioacoustics and Batlogger (Elekon AG) (Adams et al.
2012), they would have been prohibitively expensive for this project where the application of a
consistent methodology at a large number of sites was a primary consideration.

FINAL REPORT
25
Methods
Study sites
The primary aim of the project was to establish, with a reasonable degree of confidence, whether or
not bats were being killed at wind energy installations in the UK: this was not known at the start of
the project and other research questions were of lower priority. We therefore conducted power
calculations to establish a robust sampling protocol for the project. These calculations indicated that
a cross-sectional sample size of 46 sites would allow us to distinguish whether casualties occurred at
3% or more of wind energy installations (compared with a null-hypothesis of casualties occurring at
0.01% of sites, a level considered to be of negligible importance) with a power‡ of 0.8 and the
significance level set at 0.05. We accepted from the outset that the power to detect links between
potential risk factors and collision rates would be somewhat lower, and that some potential risk
factors such as seasonality would be better addressed with a different type of study design (for
example, longitudinal versus cross-sectional monitoring). To avoid bias in the sample, randomised
sampling, stratified by country/region (Scotland, Northern England, Southern England and Wales)
and habitat type (arable, Upland/Moorland, and mixed) was conducted to identify an initial target
list of wind energy installations to include in the project. To be eligible for inclusion, sites had to
have at least 6 operational turbines with towers of at least 50m tall (9 exceptions were made due to
local unavailability of sites with towers >49m). Participation in the project was voluntary and,
particularly in the early years, many sites were not made available for study.
‡The threshold number of installations with casualties set as being important (here 3.3%) is necessarily arbitrary. In this case, we aimed to detect even low casualty rates, and therefore set the cut-off point to a small value. A power of 0.8 indicates that the test has the ability to detect differences as large as this (or larger) 80% of the time. It therefore follows that a sample size of 46 would have a 20% chance of failing to detect casualties even though they in fact occurred at 3.3% of sites.

FINAL REPORT
26
The number of turbines searched per site ranged from 6-8, with the exception of site 41 where
access was available to only 5 turbines. Most sites were studied for approximately one month in a
single year. Data from Europe and North America indicate seasonality in fatality risks (Brinkmann et
al. 2006, Niermann et al. 2007, Arnett et al. 2008, Rydell et al. 2010a). The survey window was
therefore set as 1st July – 18th October, to coincide with periods of peak mortality reported
elsewhere in Europe (Rydell et al. 2010). The precise survey periods were 18th July-21st October
2011; 9th July – 13th October 2012; and 1st July-18th October 2013. One site (Site 9) was studied in all
three years of the project, and three sites were studied in 2012 and 2013 (Sites 20, 26, 33) following
discussions with the project Steering Committee, to provide additional information about the
temporal variation in casualty rates. With the exception of site 26, which was included due to being
in very close proximity to site 33, these sites had particularly high fatality rates in the first year of
study. The frequency of survey at these repeated sites was increased in 2013, so that the mean
inter-search interval was < 2 days.
The extent of different habitats around the wind farms were quantified in ArcMap 10.1 ((ESRI) using
the CEH Land Cover Map 2007 (Morton et al. 2011). Two spatial scales were examined: a buffer of
1500m and a buffer of 2500m, centred on the middle of the turbine site. The same procedure then
repeated but using the outside edge of the wind farm, rather than the centre, as the start of the
buffer. The features examined were: total broadleaf and yew woodland (hereafter ‘broadleaf’), total
coniferous woodland, total woodland, recent clear-fell (within 10 years), improved grassland, and
total dwarf shrub heath (km2 areas in each case). It is accepted that some habitat types may have
changed between the time the Land Cover Map was created, and the time of the survey. This may
particularly affect new clear-fell areas of woodland. However, resource constraints meant it was not
possible to perform new habitat surveys across the entirety of each study site (though the habitat
beneath each turbine was mapped).

FINAL REPORT
27
Casualty surveys
The turbines included in the project were randomly selected from the operational turbines available
at each site, subject to any constraints imposed by landowners. A 100mx100m search area, centred
on the turbine was marked out (encompassing the rotor-swept area). The habitat beneath each
turbine was recorded on a standard pro-forma (available on request). An automated weather
station (Wireless Weather Station N25FR, Maplins, UK) was set up at one turbine per site. The
analyses shown here present night-time weather data only.
The turbines were searched using trained dogs according to a methodology developed specifically
for this study (see Section 4). The surveys began early in the morning in an effort to minimise
carcass removal rates by diurnal scavengers (notably corvids). The location and condition of any
carcasses found were recorded, the carcass was photographed, and an estimate of the date of death
was made where possible. Wing samples were taken and stored in 90% ethanol for subsequent
genetic examination. Fur samples were also taken and stored for potential future analysis of stable
isotope composition, which could provide evidence of whether the casualties were migratory. The
remainder of the specimen was stored in neutral buffered formalin (in 2011 and 2012) and in 90%
ethanol (2013) to permit subsequent post-mortem examination. On their return to the laboratory,
post-mortem examinations of the casualties were conducted. Presumptive species identifications
were made on the basis of morphometric characteristics, and the carcass condition, together with
the sex and age (adult or juvenile) of the animal was noted. Molecular methods were developed to
identify the species and sex of the carcass and were used to validate the post-mortem examination
results (see Section 5). In 12 cases, species identifications were available only by genetic means
because the carcass was decayed or damaged beyond recognition. There were 39 cases where sex

FINAL REPORT
28
identification was based on genetic analysis only (this higher number reflected the fact that
predators frequently removed the body cavity contents and genitals first).
Predator removal and observer efficiency trials
As in most studies of wind turbine casualties, it was not possible to conduct surveys daily, and
instead searches were conducted at 2-3 day intervals (mean 2.5). Whether conducted by dogs, as in
this case, or by humans, the number of individuals found will be a minimum estimate of the true
casualty rate. This is primarily due to two factors: observer efficiency (the probability that the
observer finds a carcass if it is present); and carcass removal (by scavengers, decay and weather if
the carcass if washed away or covered by blown debris). In our survey, the entire search area was
usually surveyed by the dogs, and therefore there was no need to adjust the estimates for the
proportion of the target area surveyed. However, estimates of casualty-rates at the scale of the
whole wind farm, rather than the turbine, accounted for the proportion of turbines that were
searched. The degree of influence exerted by carcass removals and observed efficiency will vary
between sites, and across time, and will be influenced by environmental conditions such as
topography, vegetation cover, and local weather conditions. The need to account for these sources
of error when estimating true casualty rates is now well-recognised. Approaches range from
relatively simple adjustments (e.g. (Johnson et al. 2003), to more sophisticated models (e.g. (Bispo et
al. 2010, Floud et al. 2011, Huso 2011), including some which account for the persistence of
undetected carcasses between subsequent surveys (e.g. (Erickson et al. 2004, Korner-Nievergelt et
al. 2011). A difficulty with all of these adjustment techniques is that it is unlikely that carcass
removal rates and observer efficiency are consistent for the duration of a study.
At each study site, dead bats supplied to the project by bat carers were used for observer efficiency
and carcass-removal trials. These were performed at a control turbine that was not part of the main

FINAL REPORT
29
areas surveyed: if there were no additional turbines, then the trial was conducted in a nearby area of
similar habitat. An independent observer placed between 3 and 14 bats in positions beneath the
turbine randomly selected from a grid. The carcasses were dropped rather than placed to simulate
as closely as possible field conditions, and the carcasses were handled with gloves and/or forceps to
avoid introducing fresh human scent. The bats were of a range of species, but were predominately
pipistrelles, and most had been frozen prior to use. The field worker, blinded to their locations, as
well as to the total number of bats used, then attempted to locate the carcasses with the aid of their
search dog. After the completion of the observer efficiency trial, the carcasses were left in position
and the field worker recorded whether they remained on each visit to the site. Observations
stopped only if all carcasses were removed, or when the project finished at a particular site. Care
was taken to ensure that location markers were placed away from the carcass itself, in order to
avoid artificially drawing the attention of predators to the carcass.
For the purposes of our analyses, we used the carcass removal rate trials to produce empirical
estimates of carcass loss specific to each site. The actual number of bats found was therefore
multiplied by the removal rate observed for the mean inter-search interval at the particular site.
This figure was then adjusted for observer efficiency. It is recognised that the possibility of recording
false zero carcass observations is present, this will reflect a combination of true zeros (no dead bats
were present) and false zeros (bats were present but were removed by predators, missed by
observers, or fell outside the survey area). This is a difficulty that affects all similar studies, and it
must be recognised that there is currently no accepted way of adjusting zeros to produce a more
realistic estimate of casualty rates (Huso 2011), though Bayesian approaches have recently been
developed (Huso et al. 2014). In this project we were able to conduct only single predator
removal/observer efficiency surveys at each site due to the cross-sectional design of the project.
Further, we had limited availability of bat carcasses with which to evaluate predator removals and
observer efficiency. This makes it difficult to apply the more sophisticated casualty estimators

FINAL REPORT
30
currently available (Bispo et al. 2010, Korner-Nievergelt et al. 2015), as the sample sizes were
relatively low and repeated trials of predator removal/observer efficiency were not possible.
However, we are working with one of the developers of these modelling procedures (Fraenzi Korner-
Nievergelt) to explore new methods of adjustments, and will report these values, and the associated
credibility intervals, in due course. In the interim, we can be confident that the current estimates
are sufficiently robust for decision-making, since the project had high levels of observer efficiency,
all of the search area beneath the turbines was usually accessible for searching, and the inter-search
interval was short. Therefore whilst there may be some under-estimation of true casualty rate, it is
unlikely that the revised estimates will be sufficiently different from those reported here to
materially change the conclusions of the report.
Acoustic Surveys
Full spectrum acoustic recorders for bats (SongMeter2 (SM2 and SM2+), Wildlife Acoustics USA,
hereafter referred to as SM2s), equipped with a minimum of 32GB SD cards were set up at the base
of 3 turbines per site, usually on the steps leading up to the tower, or occasionally on 2-metre high
tripods. The SMX-US omnidirectional microphones were orientated horizontally. In addition,
recorders were installed in the nacelle of the same turbines. For these ‘at height’ recordings, the
microphone was protruded from the nacelle by approximately 1.5 metres on an extension cable, and
was held in position with plastic conduit tubing. This procedure reduced the amount of non-target
noise from the nacelle that was recorded by the SM2 detector. Logistical constraints on the timing
of installations at height meant that at some sites there were slightly shorter recording periods at
height than at the ground. At 4 sites, it was not possible to make recordings at the nacelle because
turbine technicians were not available to install the equipment. Each detector was programmed to
make daily automatic recordings from 30 minutes before sunset until 30 minutes after dawn. Bat
activity was monitored for an average of 27 (±SD 8) continuous nights at each site. Recordings were

FINAL REPORT
31
stored when triggered by the signal to noise ratio exceeding a pre-set threshold (here: 36db in year 1
and 2; 48db in year 3, with the increase in threshold reflecting revised advice from the
manufacturer). Only sounds above 16kHz were recorded, and once triggered, the recording
continued until the threshold was not reached for a period of at least two seconds. Preliminary
tests in the field (using bats in the hand and an ultrasonic sound generator) suggested a detection
distance of approximately 30m for pipistrelle bats under conditions of low wind and no rain. This is
compatible with sensitivity tests reported elsewhere (Adams et al. 2012), and it should be noted that
it is somewhat less than the length of many turbine blades. Each recording was tagged with a time-
stamp. The clocks of all SM2s were set to within a second of each other, initially synchronised with
the world clock, and resynchronised at the start of each new site. SM2s were programmed to save
continuous acoustic data as compressed Wildlife Acoustic Compression (WAC) files and saved every
hour to an SD card, thereby minimising data loss in the event of technical failures. Data were
downloaded from the SD cards at weekly intervals for the ground-level detectors. For the nacelle-
level detectors, data were usually downloaded only at the completion of the survey and it was
extremely difficult to check for any technical difficulties during the recording period. New
microphones were used at each study site to minimise the loss of sensitivity over time.
The data were transferred to the University of Exeter and duplicate back-up copies were made onto
2 dedicated NAS-RAID drives. Checks of the data were made for evidence of microphone failure or
other technical difficulties. Data were excluded where this occurred, except for 5 locations where
data would have been lost for whole nights (4 cases in the nacelle, 1 case at ground level) by this
approach, and so all available data were included. Comparisons were made of models obtained with
and without the inclusion of these data: there was no evidence that their inclusion affected the
results.
FINAL REPORT
32
At each site, an SM2 bat detector was also installed at ground level at a control location in similar
habitat to, but away from, the turbines. These control locations were between 173 and 1939m away
from the nearest ‘matched’ turbine and were within the land to which the turbine company had
access (the ‘red line’ of the site). In 2013, additional surveys were conducted at the request of the
project Steering Committee to reflect the data collection strategies frequently used by ecological
consultants working at potential wind turbine sites. At each study site, an additional SM2 detector
was also placed at a linear feature close to a turbine (distances ranged from 55-608m) , and 3
transect surveys were conducted at approximately weekly intervals at each study site with bat
activity being recorded for approximately 2 hours from sunset using full-spectrum EM3 bat detectors
(Wildlife Acoustics, USA).
The compressed WAC files were later converted to Waveform Audio Format (WAV) files using the
Kaleidoscope Pro (KPro) programme (version 1.2.0, Wildlife Acoustics, Maynard, USA). During this
process, the triggered events were extracted from the hour-long files, and non-bat (noise) signals
were filtered out. Further noise was filtered out by selecting only triggered events which had
individual pulse durations of between 2 and 500ms, and with a minimum of 2 pulses per triggered
event. The advanced signal enhancement was also selected, as per the manufacturer
recommendations (see Wildlife Acoustics http://www.wildlifeacoustics.com/), and the signals were
either allocated to a species, or to a no-identification category, using the programme’s automated
algorithm.
Following extensive preliminary trialling, the acoustic data were analysed using Kaleidoscope Pro
software (Wildlife Acoustics, USA). Automated recognisers were used to identify potential bat
sounds, and all calls were then subsequently analysed manually using KPro viewer using the
parameters described by Russ (Russ 2012). The manual check also enabled more than one pass per
file to be detected, which would otherwise have been missed by the automatic recognition system.

FINAL REPORT
33
A pass was defined as a continuous run of pulses separated by gaps of less than one second (Fenton
et al. 1973), and bat activity is defined in terms of passes throughout this report (in contrast to some
reports which use a ‘file’ as equivalent to a bat pass).
For a random sample of 21 sites (42% of all sites), all passes were counted. In all other cases multiple
passes were recorded as 'two or more passes' for each species, to reduce analysis time. Whilst this
slightly under-recorded the actual number of passes, it represents only a very small proportion (4%)
of all files manually identified (4%). The total number of passes for sites where each pass was
counted was only 2% higher compared to counting only the first two, and therefore we assume that
our methods give a reasonable approximation of true bat pass rates. Note that it is not possible to
infer the numbers of bat present at a site on the basis of acoustic recordings, since a given individual
may be recorded once or many times. However, it is valid to compare the relative activity levels,
and to use the index as a potential predictor of casualty risk.
All bats were identified to species with the exception of Myotis spp. which were identified to genus
because of the similarity of the calls of many species and because previous research has not
identified Myotis spp. as being at appreciable risk from wind turbines (Rydell et al. 2010c). Screening
of noise files also showed that a very small proportion (<0.1%) contained bat calls, and these were
generally of poor quality: no formal analysis of the noise files has therefore been conducted. In total
240,344 call files were screened, identifying 180,062 passes from the study turbines.
Statistical Analysis
All analyses were undertaken using R (v.3.1.1) (R Development Core Team 2013) and CIA (Bryant
2011). Comparisons of bat activity were made between control sites (no turbine but in similar
habitat) and the nearest turbine; and in 2013 between a recorder placed at a linear feature and the
nearest turbine. Very strong over-dispersion was detected and therefore these data were modelled
FINAL REPORT
34
using a negative-binomial model with a random variable for site (using the R package GLMMADMB)
(Skaug et al. 2012).
Comparison of assessments of bat activity at ground and height
Since bat activity is usually monitored from ground level, we compared recorded activity at ground
with paired recorded activity at height. The probability of detecting a species at height but not at
ground level was assessed using presence/absence data for species with sufficient data to make
meaningful comparisons (pipistrelle and noctule bats) using a Generalised Linear Mixed Model
(GLMM) with a binomial error structure and logit link function. Sites were included for the analysis
of a particular species only if they were within the species’ geographical range (IUCN 2008); and only
nights which had activity at either ground or height were considered. Site and night were specified
as random effects in order to account for spatial and temporal autocorrelation. In addition to using
height/ground as a binomial predictor, we included the height of the detector above the ground (m)
(for the detector in the nacelle) a fixed effect to test whether there was any change in recorded bat
activity as distance to the ground increased.
To assess whether bat activity differed between paired ground and height detectors, we modelled
total nightly species activity per detector using a GLMM with a Poisson error structure and a log-link
function. Data that were unpaired (due to technical issues with the detector at either height or
ground) were excluded. We fitted site and night as random effects, and also added a random
variable with a distinct level for each observation in the dataset to account for over-dispersion in the
data (Bolker et al. 2009). An interaction term between height (a fixed factor with 2 levels: ground
and height) and species (a fixed factor with 6 levels: common pipistrelle; soprano pipistrelle;
Nathusius’ pipistrelle, long-eared, noctule and Myotis bats, excluding species with no or insufficient
data at height to enable model convergence) was fitted. Due to the significant interaction between
FINAL REPORT
35
species and height (χ2 = 394.53, n = 5, P < 0.001), the analyses were then repeated for each species
separately.
To assess whether the ratio of activity at ground compared to height was consistent between
species for which sufficient data were available (pipistrelle and noctule bats), the nightly ground to
height ratio was modelled using a GLMM. The ability to predict total activity at height, using the
total activity measured at ground level, was then investigated for each species. Because the activity
of bats measured at the nacelle is likely to depend in part on the height of the nacelle, an interaction
between the height of the nacelle and ground level activity was included in the models. Site was
not included as a random effect since all turbines within site were the same height, therefore, site
and detector height were confounded. The fit of the fixed terms in the models was evaluated by
calculating marginal R2 (R2GLMM(m)) and the combined fixed and random terms by calculating
conditional R2 (R2GLMM(c)) (Nakagawa and Schielzeth 2013).
Results
Site Characteristics
Forty six wind farms out of the 204 operational wind farms in Great Britain were included in the
project. These were operated by 10 different companies. The distribution of sites by country is
given in Table 2.1. The schematic map (Fig. 2.1a) shows the kernel densities (based on 50km buffers)
of wind farms included in the project alongside a comparable kernel density map of all operational
onshore wind farms in Great Britain (data derived from RenewableUK website database, 2014).
Figure 2.1b shows the current distribution of operational wind farms in the UK (RenewableUK
website database, 2016). The study succeeded in being broadly representative of the distribution of
turbines within each country, with the possible exception of the Scottish Borders and West
Yorkshire/East Lancashire, which were under-represented. However, the study sites in year 1 (and

FINAL REPORT
36
to a much lesser extent in years 2 and 3) deviated substantially from the original randomised
selection. The extent and implications of any resulting bias is extremely difficult to quantify.
Table 2.1 Numbers of sites studied by country.
2011 2012 2013 Total
Scotland 6 5 5 16
Wales 2 3 4 9
England 6 5 10 21
TOTAL 14 13 19 46

FINAL REPORT
37
Fig 2.1a. Kernel density maps of (a) wind farms included in the study, and (b) density of operational wind farms meeting the selection criteria at the time of the study. Black indicates absence of wind farm and lighter shades indicate areas with highest density. Map based on wind farm densities within 100km study site densities within 100km zones.
Fig 2.1b. Distribution of operational wind farms in the UK (Feb 2016, RenewableUK).
a b
FINAL REPORT
38
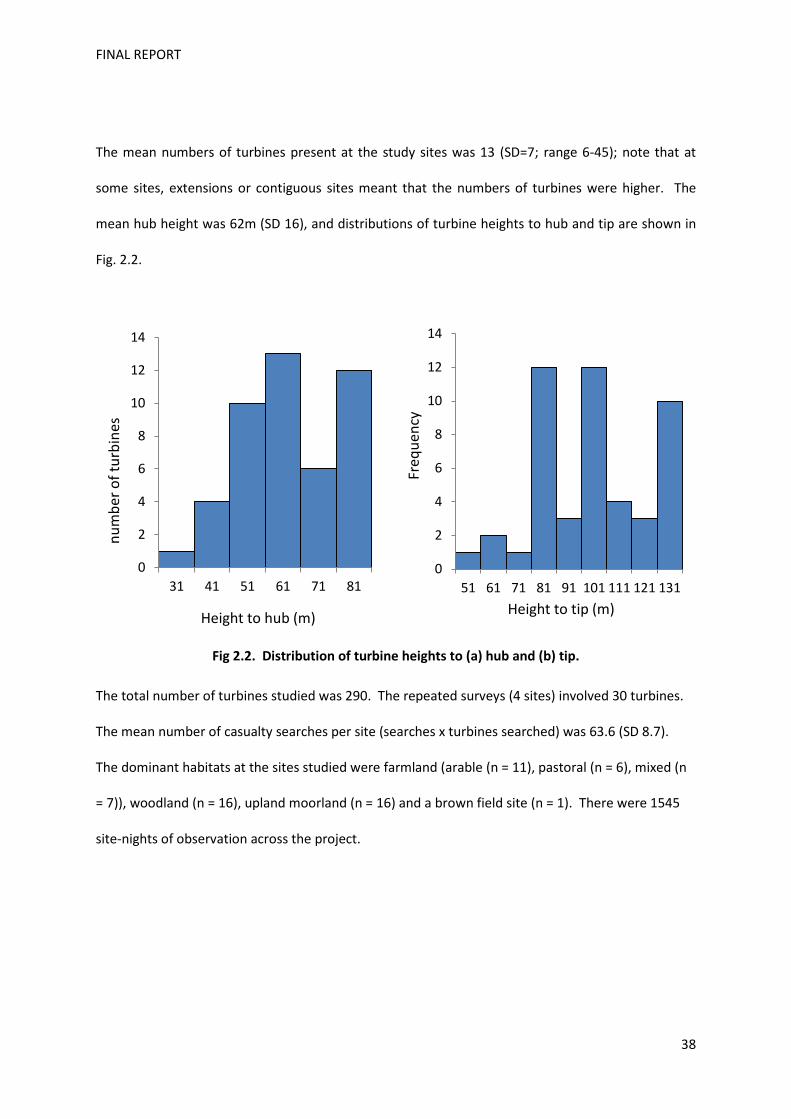
The mean numbers of turbines present at the study sites was 13 (SD=7; range 6-45); note that at
some sites, extensions or contiguous sites meant that the numbers of turbines were higher. The
mean hub height was 62m (SD 16), and distributions of turbine heights to hub and tip are shown in
Fig. 2.2.
Fig 2.2. Distribution of turbine heights to (a) hub and (b) tip.
The total number of turbines studied was 290. The repeated surveys (4 sites) involved 30 turbines.
The mean number of casualty searches per site (searches x turbines searched) was 63.6 (SD 8.7).
The dominant habitats at the sites studied were farmland (arable (n = 11), pastoral (n = 6), mixed (n
= 7)), woodland (n = 16), upland moorland (n = 16) and a brown field site (n = 1). There were 1545
site-nights of observation across the project.
0
2
4
6
8
10
12
14
31 41 51 61 71 81
num
ber o
f tur
bine
s
Height to hub (m)
0
2
4
6
8
10
12
14
51 61 71 81 91 101 111 121 131
Freq
uenc
y
Height to tip (m)

FINAL REPORT
39
Description of casualties: species, sex, age-structure and distribution across sites
In total, 120 bat carcasses were found, and most were within 30m of the turbine tower (Fig 2.3).
The distribution of species is shown in Fig 2.4. Noctule bat casualties were found at 7 sites: of these,
1 site had 3 casualties, 2 sites had 2 casualties, and the remainder had 1. Single fatality cases were
found for Natterer’s bat (the first record for Europe), Brown long-eared bat and Nathusius’s
pipistrelle bat. The Natterer’s bat was found at a site which also had common and soprano
pipistrelle casualties; and the Brown long-eared bat was found at a site which also had common
pipistrelle casualties. The Nathusius’ pipistrelle was the only casualty found at the site.
Fig 2.3. Distance between the casualties and the turbine towers.
0
5
10
15
20
25
30
35
40
0-9 10-19 20-29 30-39 >=40
num
ber o
f ca
rcas
ses
Distance from turbine (m)

FINAL REPORT
40
Fig 2.4. Frequency distribution of the observed bat casualties by species (numbers shown above each bar).
Although there was considerable variability in the numbers of bat casualties retrieved at each site,
there was no indication that casualties were clustered at particular turbines within sites. Twelve of
the 29 sites with casualties had 3 or more fatalities observed within a year (one of these sites was
visited three times, giving a total of 14 occasions on which clustering could be explored). The
expected number of searched turbines with zero casualties, given the total number of casualties
observed at the site, was calculated: in no case did this number exceed that expected by chance
(Fisher’s Exact Test, p>0.182 in each case). Further analyses to explore potential clustering of
fatalities relative to key topographical features, such as hill-crests, are ongoing. It is important to
recognise that the study had low statistical power to detect clustering effects. The deposition of
data on the location of casualties to a central data storage facility in future monitoring work would
permit more detailed analysis in the future.
46
51
1
8 11
1 1 1
0
10
20
30
40
50
60
Com
mon
pip
istre
lle
Sopr
ano
pipi
stre
lle
Nat
husiu
s's p
ipist
relle
Pipi
stre
llus s
p.
Noc
tule
Brow
n lo
ng-e
ared
Nat
tere
r's
Unk
now
n
Morphology only
Confirmed by DNA

FINAL REPORT
41
The sex distribution of casualties is shown in Table 2.2. For common and soprano pipistrelles, the
only species for which sample sizes permitted formal exploration, there was no evidence that the
sex ratio deviated from 1:1 (common pipistrelle male proportion mean = 0.57 (95% CI Wilson
Method 0.42-0.70; soprano pipistrelle male proportion mean = 0.44 (95% CI 0.31-0.59). Most of the
bats were adults (mean proportion 0.84, 95% CI 0.75-0.89, age unknown for n = 14). It is reasonable
to expect that the behaviour of predators and observers would not differ for bats of different sexes
or age classes, and therefore that the observed casualties reflect the true proportions in each class.
However, it is possible that the assumption may be violated for differences between size-classes of
bats. For example, larger species, may be more attractive to vertebrate predators than smaller ones,
and therefore be removed more quickly; but conversely, it may take longer for larger carcasses to
disappear through other processes, such as decay or being buried by invertebrates. In our study, the
supply of carcasses for the predator removal trials was heavily weighted towards pipistrelle bats, as
these are the species most commonly received by bat carers. We therefore have insufficient data to
permit exploration of potential biases in removal rates. Other studies elsewhere have found that
the probability of carcass removal is influenced by the guild of predators present and weather
conditions (Paula et al. 2015); but we are not aware of any work examining the relative removal
rates of bats of different sizes. Observer efficiency does not appear to vary between bat species
(Mathews et al. 2013).
Table 2.2. Distribution of casualties by sex
P. pipistrellus
P. pygmaeus
P. nathusii
Pipistrellus sp.
N. noctula
M. nattereri
Pl. auritus Unknown TOTAL
Male 25 20
6
51
Female 19 25 1
4 1 1
51
Unknown 2 6
8 1
1 18 Grand Total 46 51 1 8 11 1 1 1 120

FINAL REPORT
42
Carcass detection rates across Europe are reported to range from 0 to 0.11 bats turbine-1 day-1
(these are raw data, with no adjustments for observer efficiency or carcass removals) (Rydell et al.
2010b). Our raw data are consistent with this range (0-0.18 observed bats turbine-1 day-1).
No casualties were found at approximately a third of the study sites (17/46). However, it is
important to emphasise that zero observations does not necessarily imply zero casualties; and it is
difficult to produce estimates of true rates for sites where no carcasses were found. The 95%
confidence intervals§ for the proportion of wind farms with observed casualties are 48.6%-75.5%. At
sites where at least one casualty was found, the casualty rates were variable: estimated total bat
casualty rates (adjusted for predator removal and observer efficiency) ranged from 0 to 5.25 bats
turbine-1 standard month-1, and from 0 to 77 bats site-1 standard month-1. At 15% (7/46) of sites,
rates exceeded 1 bat turbine-1 standard month-1. The estimated total casualty rates per turbine are
shown in Fig 2.5a, and the estimated total rates per site are shown in Fig 2.5b. In sites studied in
more than one-year, casualty rates were not consistent across time (Table 2.3). The estimates for
each of the primary species affected are shown, for each country separately, in Fig 2.5c (expressed
as casualties-1turbine-1standard month-1). Across all study sites, the relative percentage occurrence
of soprano pipistrelle, common pipistrelle and noctule casualties was 40.6%, 48.6% and 10.7%.
§ Wilson Method
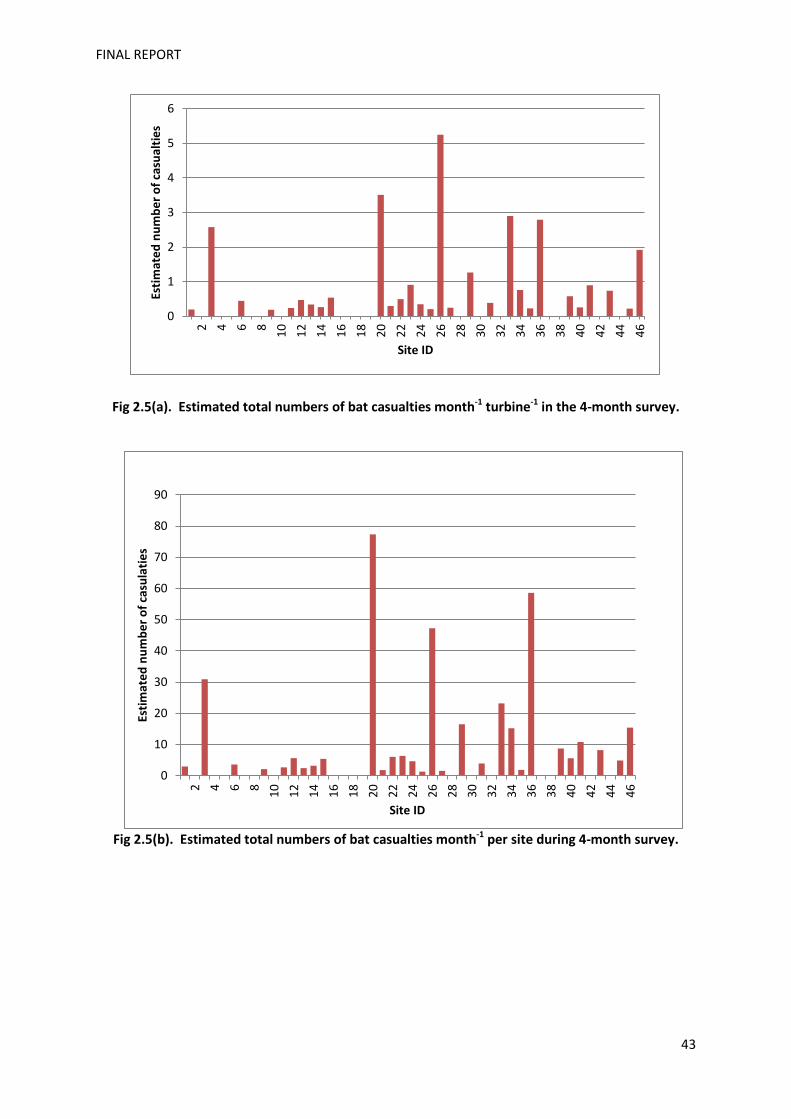
FINAL REPORT
43
Fig 2.5(a). Estimated total numbers of bat casualties month-1 turbine-1 in the 4-month survey.
Fig 2.5(b). Estimated total numbers of bat casualties month-1 per site during 4-month survey.
0
1
2
3
4
5
6
2 4 6 8 10 12 14 16 18 20 22 24 26 28 30 32 34 36 38 40 42 44 46
Estim
ated
num
ber o
f cas
ualti
es
Site ID
0
10
20
30
40
50
60
70
80
90
2 4 6 8 10 12 14 16 18 20 22 24 26 28 30 32 34 36 38 40 42 44 46
Estim
ated
num
ber o
f cas
ulat
ies
Site ID

FINAL REPORT
44
Fig 2.5(c). Estimated casualty rates month-1 turbine-1 shown separately by country. The category ‘all pipistrelles’ includes pipistrelle bats identified to genus only. Numbers on the x-axis are the site ID numbers.
Table 2.3. Estimated casualty rates for sites studied in more than one year.
turbine-1month-1 site-1month-1
Site ID 2011 2012 2013 2011 2012 2013
9 2.6 3.3 0.39 30.9 40.1 4.7
20 no survey 3.5 0.24 no survey 77.3 5.4
26 no survey 0.91 0 no survey 6.3 0
33 no survey 5.3 0 no survey 47.3 0
The geographical ranges and known distributions of bats in the UK are presented in Appendix 1. It is
acknowledged to be extremely difficult to determine risks to rare species (for example the bats listed
on Annexe II of the Habitats Directive) because the low probability of encounter means that error
rates are extremely large. However, even small numbers of casualties may have very significant
0
1
2
3
4
5
64 5 8 12 14 19 20 21 22 24 26 27 33 34 37 38 39 42 43 45 46 2 3 6 7 10 13 15 16 18 23 25 29 32 40 41 44 1 9 11 17 28 30 31 35 36
England Scotland Wales
Estim
ated
cas
ualty
rate
turb
ine-
1 m
onth
-1
Min of allpips_killfm_m_tMin of spips_killfm_m_tMin of cpips_killfm_m_tMin of nocs_killfm_m_t
All pipistrelles
soprano pipistrelles
common pipistrelles
noctules

FINAL REPORT
45
effects on local populations (Huso 2011, Huso et al. in press). It therefore cannot be concluded for
rare species that a zero recorded collision rate in this study implies a zero or negligible risk.
This relative distribution of casualties may be compared with estimates of the relative abundance of
species in Great Britain (Fig. 2.6 and Table 2.4; see also Appendix 1). Whilst some caution must be
exercised when interpreting absolute population estimates, since these are widely acknowledged to
be poor, there is more confidence in the accuracy of relative measures. Both soprano pipistrelle and
noctule bat casualties appear more frequent than expected from their relative population estimates,
whereas Brown long-eared bat casualties are less frequent.
Fig 2.6. Best available estimates of bat abundance in Great Britain (based on (Harris et al. 1995) op cit (Battersby 2005). Figure is designed to illustrate relative abundance rather than absolute population size.
common pipistrelle, 1,280,000
soprano pipistrelle,
720,000
Natterer's, 100,000
serotine, 15,000
noctule, 50,000 Leisler's, 10,000 Brown long-
eared, 200,000

FINAL REPORT
46
Table 2.4. Summary of the number of sites within the IUCN (2008) range of each British bat species, and the number of sites that the species was detected. Total population estimates for Great Britain derived from (Harris et al. 1995) with updates where available (Battersby 2005).
Species Number of sites within a species’
range
Number (and %) of sites species detected
GB population estimate*
common pipistrelle 46 44 (96) 1,280,000 soprano pipistrelle 44 42 (95) 720,000 Nathusius’ pipistrelle
39 35 (90) 4,000
noctule 35 30 (86) 50,000 Leislers' 31 6 (19) 10,000 serotine 10 4 (40) 15,000 Myotis spp. 46 40 (87) 291,500 long eared spp. 46 37 (80) 200,000 barbastelle 26 8 (31) 5,000 lesser horseshoe 12 5 (42) 18,000 greater horseshoe 12 1 (8) 6,600 *figures are provided to illustrate relative abundance rather than absolute population size
Bat activity
Distribution of bat activity across the sites
Bat activity levels were highly variable at both turbines and the two types of control examined
(similar habitat control, and linear feature control) (Fig. 2.7). Overall, there was no difference in
total mean bat activity at the similar habitat control and turbine sites (estimate 0.146, z=0.13,
n=1816 observations, 41 sites, p=0.26). However, it was much greater at the linear features
compared with the similar habitat control (estimate -1.607, z=-6.19, n=484 observations, 14 sites, p
< 0.001).

FINAL REPORT
47
Figure 2.7. Yearly comparison of bat activity at wind turbines, open habitat (2011, 2012, 2013a), and linear features (2013b). Note that only one detector per site was deployed in ‘open habitat’ and ‘linear feature’. Therefore to permit fair comparisons, data from only one turbine per site (that most closely matching the ‘open habitat’) are shown. The upper and lower hinges (ends of rectangles) correspond to the first and third quartiles, whereas the upper and lower whiskers extend to the value that is within 1.5 times of the interquartile range of the hinge. Outlying values are shown as dots.

FINAL REPORT
48
The transect surveys also revealed variable activity patterns, with some sites having high levels of
activity close to turbines whereas the opposite was true at other sites (see Appendix 2 for table).
Bat activity at height and ground level
At both ground and nacelle, most calls were from common pipistrelle, soprano pipistrelle and
noctule bats (Fig 2.8). However much higher levels of bat activity were recorded at ground level
compared with the nacelle for all species (Fig 2.9), despite it being likely that a greater amount of 3-
dimensional space was surveyed at height (at ground, the omnidirectional microphone would be
limited to detecting in a hemisphere, compared with a sphere at height). Data for each species, at
ground and height, are shown separately for each country in Table 2.5.
Figure 2.8. Overall distribution of bat activity
0%
10%
20%
30%
40%
50%
60%
70%
80%
90%
100%
Ground Nacelle Total
Rela
tive
perc
enta
ge o
f spe
cies
ac
tivity
acr
oss a
ll sit
es
Common Pipistrelle
Soprano Pipistrelle
Noctule
Myotis Spp.
Nathusius Pipistrelle

FINAL REPORT
49
Figure 2.9. Total number of bat passes by species/genus recorded across all sites. A paired design is used, matching the numbers of detectors and survey nights at ground and height for each site, so that survey effort is equal in both locations.

FINAL REPORT
50
Among the low flying specialists, horseshoe bats were only detected at ground level and Myotis spp.
and long-eared bats were rarely detected at height. For bats considered to fly at medium height,
barbastelles were only detected at ground level, whereas Pipistrellus species and high flying
specialists were frequently detected at higher elevations. Further consideration of the implications
of varying detection probabilities at height and ground is provided in Section 4.

FINAL REPORT
51
Table 2.5. Total recorded calls (%) at ground and height by country
England Scotland Wales TOTAL
SPECIES ground nacelle ground nacelle ground nacelle
barbastelle 88 (0) 0 (0) 0 (0) 0 (0) 1 (0) 0 (0) 89
Myotis spp.
1473 (0.01)
18 (0)
396 (0.03)
2 (0)
1341 (0.03)
0 (0) 3,230
long-eared 341 (0)
12 (0)
154 (0.01)
5 (0)
194 (0)
0 (0) 706
serotine 11 (0) 1 (0) 0 (0) 0 (0) 95 (0) 6 (0) 113
noctule 2443 (0.02)
1260 (0.11)
185 (0.01)
196 (0.19)
3841 (0.07)
1082 (0.35) 9,007
Leisler's 52 (0) 4 (0) 5 (0) 20 (0.02) 7 (0) 0 (0) 88
Nathusius' pipistrelle
725 (0.01)
140 (0.01)
81 0.01)
9 (0.01)
349 (0.01)
32 (0.01)
1,336
common pipistrelle
92873 (0.85)
5797 (0.49)
6860 (0.47)
322 (0.32)
37258 (0.7)
1345 (0.44) 144,455
soprano pipistrelle
10009 (0.09)
4457 (0.38)
6646 (0.45)
352 (0.35)
9574 (0.18)
573 (0.19) 31,611
greater horseshoe 6 (0) 0 (0) 0 (0) 0 (0) 0 (0) 0 (0) 6
lesser horseshoe 5 (0) 0 (0) 0 (0) 0 (0) 5 (0) 0 (0) 10
TOTAL* 108,957 11,689 14,327 906 52,655 3,038 190,651
*Total includes calls which could only be identified to genus, and therefore the species shown do not sum exactly to the total.

FINAL REPORT
52
Discussion
The project achieved its intended aim of undertaking a systematic survey of bat activity and casualty rates at
a representative sample of wind farms in Great Britain. It is the largest survey of its kind in the world, and
provides a unified assessment of the risks to bats across sites of different sizes and in varying habitat
conditions.
Whilst the overall casualty rates fall within the ranges reported elsewhere in Europe (Rydell et al. 2010b,
EUROBATS 2014a), there is clearly considerable variation between sites. Whilst approximately a third had
no observed casualties, there are also a significant number where casualty rates are high. As with studies
elsewhere in the world, it is currently difficult to draw inferences about risks to local or national populations,
and further research is urgently required to resolve this issue. For marginal populations, even relatively low
casualty rates may present a significant threat, whereas in core areas (central to range, where recolonization
is more likely and/or where population sizes are higher), it is possible that populations may be robust to
higher casualty rates.
The overall picture is one of considerable variability in casualty rates. Within each country, at least one of
the study sites had high casualty rates (>40 bats per month, during the period of peak risk), but there are
also many sites where casualty rates are low. The limited data available from the sites visited in more than
one year emphasise this variability. However, it is unclear whether the lower casualty rates observed in
2013 among the sites with repeated monitoring reflect changes in risk factors, alterations in the local
population, or variation due to unknown causes.

FINAL REPORT
53
Section 3: Prediction of bat fatalities
Introduction
Minimising the risk to bats from wind energy installations relies on two principles: (1) avoidance of risk by,
for example, placing turbines in low risk areas or avoiding turbine characteristics linked with bat fatalities;
and (2) implementation of mitigation strategies should the risks remain above acceptable levels.
Perhaps the most intuitive predictor of future risk at a potential wind turbine site is the amount of bat
activity. In the UK and elsewhere, considerable effort is therefore put into preconstruction acoustic surveys
for bats. However, bat activity is highly variable, both spatially and temporally (see also Section 4), and it is
currently unclear whether measurements repeated at the same site in subsequent years are strongly
related, even if other features of the site remain constant. The erection of a wind turbine per se could also
alter bat behaviour, further reducing the link between pre- and post-construction measurements. There has
been only one study to date investigating the potential value of assessing bat activity as a means of
predicting the risk to bats from future wind turbines. This was conducted using data from 12 wind farm sites
in the USA (Hein et al. 2013) where pre-and post-construction data were available, albeit with inconsistent
methodologies. Although there was a slight trend towards higher fatalities at sites with greater bat activity,
this relationship was not significant and explained only a low proportion of the variability in the data (Hein et
al. 2013). The authors concluded that current evidence did not support the use of preconstruction data to
predict future risk, however, more research is warranted as the original data were of variable quality.
It has also been suggested that characteristics of the turbine may be important predictors of the risk to bats:
fatality rates have been reported to increase with the height of the turbine tower, raising concerns about the
trend towards the use of taller turbines in repowering operations (Barclay et al. 2007, Rydell et al. 2010b);
and a positive link with the rotor diameter has been reported in Europe (Rydell et al. 2010b) but not North
America (Barclay et al. 2007). Habitat features may also be linked with risk, but there are no available
studies with a sufficiently large sampling frame to have a reasonable probability of separating the effects of

FINAL REPORT
54
habitat from other factors. In Portugal, in the absence of direct evidence, habitat suitability modelling was
used for the species most at risk from turbines in that country (Hypsugo savii, Nyctalus leisleri, P. kuhlii and
P. pipistrellus) to develop predictive models of the locations likely to be most at risk (sites in humid areas
with mild temperatures, <5km to forest and within 600m of steep slopes) (Santos et al. 2013). Using a non-
random sample, (Rydell et al. 2010b) noted that mortality rates in North-western Europe appear to be
lowest in flat arable areas, higher in more complex agricultural landscapes, and highest in forested regions
and close to coasts, though sample sizes did not permit formal statistical analysis.
The current study was designed to allow some analysis of potential predictor variables. However, as
recognised from the outset of the project, a sample of 46 sites gives limited statistical power, particularly in
the context of the very large numbers of potential predictors, and the information presented here should
therefore be considered exploratory. This project was not designed to assess pre-construction activity.
Whilst some insights into the likely behaviour of bats in the absence of wind turbines can be derived from
the ‘control’ site surveys, further work in this area is urgently required.
The mitigation strategies considered to reduce the risk from operational wind farms include the reduction in
turbine activity during low wind speeds (curtailment), the use of acoustic deterrents (Arnett et al. 2013b)
and radar (Nicholls and Racey 2009). However, the latter two strategies have not yet proven effective and
there are concerns about non-target effects on other wildlife (Amorim et al. 2012), and therefore the current
focus is on the use of curtailment. This is achieved through alteration of the cut-in speed, or by feathering
the blades (pitched 90° and positioned parallel to the wind so that the turbine is prevented from
freewheeling, or spins at only a very low rate – generally below 1 revolution per minute). A recent review of
10 operational mitigation studies in North America concluded that increasing the cut-in speed by 1.5m/s
above the manufacturers cut-in speed generally reduced fatalities by at least 50% (Arnett et al. 2013a).
There are also several examples of curtailment strategies being used in Europe (EUROBATS 2014a). To
minimise economic loss, it may be possible to undertake focused curtailment when the risk of collision has

FINAL REPORT
55
been shown to be highest, for example in warm weather, at low wind speeds, during migratory periods
and/or when bat activity levels are high (Arnett et al. 2011, Arnett et al. 2013a, Korner-Nievergelt et al.
2013). Seasonal variation in risk, with a peak in fatalities in late summer and early autumn, is consistently
reported in both Europe and North America (e.g. (Niermann et al. 2007, Arnett et al. 2008, Rydell et al.
2010b), with a smaller peak sometimes being reported in late spring (Rydell et al. 2010b), and mitigation
strategies therefore usually focus curtailment in these periods. In Germany and France, automated systems
have been trialled where bat detectors housed in the turbine nacelle trigger curtailment once activity levels
pass particular thresholds (using an algorithm which includes weather variables and site-specific data on
activity) (Behr et al. 2011, Lagrange et al. 2013). These systems are reliant on detailed longitudinal
monitoring of bat activity at individual sites to establish activity patterns: it is important to note that data of
this kind were not collected in the present study.
In exploring the prediction of bat fatalities, it is important to distinguish two, operationally different,
scenarios. In the first, the aim is to draw conclusions about the value of alternative variables in predicting
risks for the entire ‘population’ of wind farms. This scenario is relevant in drawing up guidance about
minimising the risk to bats through better siting of future wind energy facilities, avoiding turbines with
features that increase risk, or drawing up general rules about curtailment to be applied to all wind energy
facilities. In the second, the aim is to identify the features strongly linked with risk at individual sites where a
substantial risk to bats has already been established, in order to develop a maximally efficient curtailment
strategy. Hence, the ‘Chriotech ©’ automated turbine switch-off system has been developed at French sites
known to have extremely high fatality rates (Lagrange et al. 2013). In Germany, the killing of individual bats
is considered illegal and therefore operators must reduce the risk to below a low threshold (usually taken as
1 bat per species per wind turbine per year), and therefore single fatalities at a site are sufficient to trigger
detailed site-specific monitoring of activity and casualty levels. In these situations, the sensitivity of the
predictions – that is their usefulness in preventing further collisions – is of primary concern. In contrast,
when drawing up a priori guidance for wind turbines more generally, there is a trade-off between model

FINAL REPORT
56
sensitivity and specificity (their usefulness in keeping turbines operational when the risk to bats is low). For
example, a particular model indicating that turbines should be switched off at winds of below 6m/s would
have good sensitivity if this prevented 99% of collisions. However, if the model also meant that the turbines
would be switched off on 95% of summer nights, even though casualties would only occur on two nights
were the turbines operational, then it would have poor specificity. Where the balance between sensitivity
and specificity is placed depends on the legislative context of the country (so in Germany, models with high
sensitivity and low specificity are acceptable), and also on the conservation status and local population size
of the species.
In the current study, the value of turbine characteristics, region, local habitat, weather and bat activity in
predicting the risk to bats across wind turbine sites generally is explored. In addition, the sensitivity and
specificity of alternative thresholds for key risk factors are examined. No information on seasonality in risk is
available due to the cross-sectional design of the survey. The project was intended as a representative
survey of Great Britain and therefore deliberately focused on surveying a large number of sites for a limited
period, over the months likely to have the highest bat activity and therefore potential risk to bats. The
creation of site-specific algorithms, comparable with those used in France and Germany, was therefore also
not possible because this study did not gather the detailed longitudinal data necessary to establish site-
specific activity patterns at each site.
Methods
Analysis of risk factors across wind farms generally
Casualties that were found incidentally or during the follow up surveys to a subset of sites (see p 24) were
excluded (the true casualty rate could not be estimated for the former; and the latter were not comparable
with the rest of the project due to differing search intervals). A sample of 98 bats was therefore available for
analysis. Models were first constructed for all species collectively. Recognising that the behaviour and

FINAL REPORT
57
casualty risk is likely to vary between species, we also conducted separate species-specific analyses. The
statistical power of these species-level analyses is much lower than those based on all species collectively,
due to the relatively low numbers of replicates (both in terms of sites, and in terms of casualties per site):
the lack of significant effects should therefore not be taken to imply the lack of biologically important
relationships with the predictor variables. Insufficient data were available to permit the analysis of Brown
long-eared, Natterer’s or Nathusius’ pipistrelle bats separately.
Following initial exploration of the data, generalised linear models were built to examine the links between
casualty rates and potential predictor** variables. The presence or absence of casualties at a site overall, or
on a particular day, was modelled by logistic regression. The estimated numbers of casualties per site per
standard 30-day month were modelled as counts in generalised linear models (GLMs) with a Poisson error
structure. The results were compared to those achieved from the same models but which included an offset
to account for the size of the wind farm (defined as loge (total number turbines)): there were no material
differences in the results from the two approaches, and the latter are presented here (essentially giving
casualty rates per month per turbine as the outcome measure). As a final check to ensure that there were
no unexpected relationships between wind farm size and the per turbine risk of collision which might
compromise the logic of using a simple offset – such as might be generated if multiple turbines induced
greater behavioural alterations in bats than single turbines ̶ the relationship was plotted, and a model was
constructed using a the per-turbine casualty rate (rounded to an integer) as the outcome and the number of
turbines as the site as a predictor. Temporal variables and turbine characteristics were also included as
covariates (see Table 3.1 below). The fit of all models was assessed by inspection of the residuals and
comparison of the residual deviance and degrees of freedom. For species other than noctule bats, over-
dispersion was detected and standard errors were therefore corrected using a quasi-GLM model where the
** In this report, ‘predictor’ is considered synonymous with ‘explanatory’. It is important to recognise that the relationships are derived from associative analysis of observational data, and may therefore the relationships modelled may be affected by unknown confounding factors. However, in the absence of experimental evidence (which in the case of many features, such as habitat and weather would be impossible to gather) the approach offers the best opportunity of understanding the risk factors for bat collisions with wind turbines.

FINAL REPORT
58
variance is given by Ø x μ, where μ is the mean and Ø is the dispersion parameter. For turbine-level analyses
binomial mixed effects models were fitted (see (3) below for full details).
To keep the numbers of predictors included in the models within reasonable limits, each predictor type
(weather, turbine characteristics etc.) was initially modelled separately, before more complex analyses were
conducted. Correlation matrices were examined and variables with very high collinearity were not included
within the same model (e.g. rotor sweep and blade length): instead the variable that made the greatest
change to the model’s AIC value was included for further analysis. Model selection for binomial models was
based on examination of the deviances and AICc values. Starting with full models (see details below of the
variables included in each section of the analysis), terms were removed backwards stepwise until the
minimum adequate model was achieved (Zuur et al. 2009). For the logistic regression analyses, an
Information Theoretic approach to model selection was used (Burnham and Anderson 2002, Burnham et al.
2011), using the R package MuMin (Barton 2014), and averaged results for the top-ranking models (ΔAICc<4)
are presented. For the quasi-Poisson GLMs, this approach was not used because AICc values are not reliable
on their own, as an approach to model ranking, and therefore backwards sequential deletion was used
(models with and without the target variable were compared using an F test with an empirical scale
parameter, and those variables for which p<0.05 were removed (Crawley 2012)).
A hierarchical approach was taken to the data analysis:
1. Site-level analyses across whole survey period. Estimated casualty numbers were derived for the
entire site across the whole survey period.
The predictor variables were tested in sets encompassing similar kinds of predictors (e.g.
turbine characteristics, wind speed etc.) as shown below. All the variables listed within the set
were included in a global model, unless stated otherwise. As a second step, the duration of the
survey period at each site, and the numbers of turbines searched were added to each of the
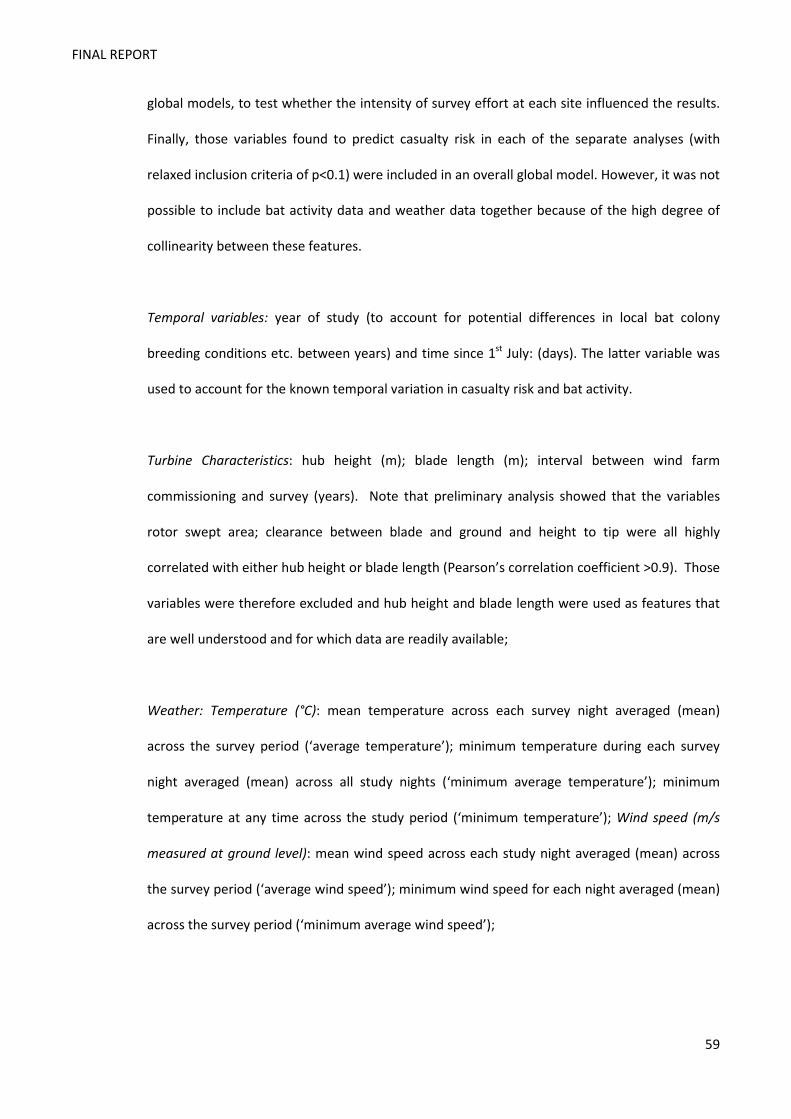
FINAL REPORT
59
global models, to test whether the intensity of survey effort at each site influenced the results.
Finally, those variables found to predict casualty risk in each of the separate analyses (with
relaxed inclusion criteria of p<0.1) were included in an overall global model. However, it was not
possible to include bat activity data and weather data together because of the high degree of
collinearity between these features.
Temporal variables: year of study (to account for potential differences in local bat colony
breeding conditions etc. between years) and time since 1st July: (days). The latter variable was
used to account for the known temporal variation in casualty risk and bat activity.
Turbine Characteristics: hub height (m); blade length (m); interval between wind farm
commissioning and survey (years). Note that preliminary analysis showed that the variables
rotor swept area; clearance between blade and ground and height to tip were all highly
correlated with either hub height or blade length (Pearson’s correlation coefficient >0.9). Those
variables were therefore excluded and hub height and blade length were used as features that
are well understood and for which data are readily available;
Weather: Temperature (°C): mean temperature across each survey night averaged (mean)
across the survey period (‘average temperature’); minimum temperature during each survey
night averaged (mean) across all study nights (‘minimum average temperature’); minimum
temperature at any time across the study period (‘minimum temperature’); Wind speed (m/s
measured at ground level): mean wind speed across each study night averaged (mean) across
the survey period (‘average wind speed’); minimum wind speed for each night averaged (mean)
across the survey period (‘minimum average wind speed’);

FINAL REPORT
60
Bat activity: mean number of passes per night across nights and the three study turbines
(‘average passes’)††. Each of these variables was computed for ground-level and nacelle-level
activity data for each of the following species and groups: total bats (all species); all pipistrelle
species; common pipistrelle; soprano pipistrelle; all Nyctalus species; and all big bats (Nyctaloid
i.e. noctule, Leisler’s and serotine). The bat activity data were modelled in relation to the
relevant fatality data (i.e. casualties of all species were compared with activity of all species;
casualties of all pipistrelles were compared with activity of all pipistrelles etc.). Separate models
were built for each species and at ground and height (as missing data would prevent valid
comparison of models). In addition, the maximum pass rate across all turbines and nights was
analysed for all bat species combined (the maximum pass rate was not explored for each
species/species group separately to reduce the statistical issues associated with conducting
multiple significance tests). The mean nightly pass rate for all species combined at the control
sites (in similar habitat but away from turbines) was examined to give some insight into the
likely behaviour of bats in the absence of turbines. The four sites without acoustic data at
height were excluded from analyses involving height-level data, and no control site data were
available for 9 sites.
Habitat: habitat composition (% cover) within 1500m, 2500m and 5000m buffers of the centre
of the wind farm was extracted from the CEH land-cover map (Morton et al. 2011) using
ArcMap 10.1 (ESRI). Analyses included the following categories: conifer; clear-felled conifer;
new clear-felled conifer; total conifer; broad-leaf woodland (includes subclasses deciduous,
mixed and scrub); total arable; improved grassland; rough grassland; and inland water (includes
standing water and larger moving water bodies, but under-records small features such as
streams).
†† A bat pass defined as a continuous run of pulses recorded on an acoustic recorder that are separated by gaps of less than one second

FINAL REPORT
61
A second analysis was conducted using the proportions of each habitat within buffers of 1km,
2.5km and 5.0km from the edge, rather than the centre, of the wind farm. The minimum
adequate model derived from this analysis was compared with that obtained above (in terms of
model fit and parameter estimates) to check whether the results differed materially. A separate
analysis was then conducted to assess the potential importance of distance (km) between
possible risk factors and the centre of the wind farm. The features included were total
woodland, broadleaf woodland, inland water, buildings and coast. To investigate the
importance of features at a smaller spatial scale, the presence/ absence of these feature within
buffers of 200m, 500m and 1500m of the wind farm were also investigated in a separate model.
Table 3.1. Summary of models tested for site-level analyses Predictor type Variables included in global models1 Temporal year; time since 1st July (days) Turbine characteristics
Hub height (m), blade length (m), operational time (years)
Weather average temp (°C), minimum average temp (°C); minimum temp (°C); average wind speed (m/s), minimum average wind speed (m/s)
Bat activity2
Ground: mean activity across turbines and nights (passes): total bats (all species); all pipistrelle species; common pipistrelle; soprano pipistrelle; all Nyctalus species; and all big bats (Nyctaloid) Height: mean activity across turbines and nights (passes): total bats (all species); all pipistrelle species; common pipistrelle; soprano pipistrelle; all Nyctalus species; and all big bats (Nyctaloid) Maximum pass rate (Ground, all species) across nights and turbines Mean pass rate (all species) at control sites
Habitat 1500m buffer from centre of wind farm (% cover): conifer; clear-felled conifer; new clear-felled conifer; total conifer; broad-leaf woodland (includes subclasses deciduous, mixed and scrub); total arable; improved grassland; rough grassland; and inland water. 2500m buffer from centre of wind farm (% cover) (variables as above) 5000m buffer from centre of wind farm (% cover) (variables as above) Distance (km) to nearest patch of: total woodland; broadleaf woodland; inland water; buildings; coast Presence/absence of features within 200m buffer of centre of wind farm: total woodland; broadleaf woodland; inland water; buildings; coast Presence/absence of the features within a 500m buffer of centre of wind farm: (variables as for 200m buffer) Presence/absence of the features within a 1500m buffer of centre of wind farm: (variables as for 200m buffer)
1 Italics indicate that separate models were built using subsets (variables shown in plain type) within each predictor type. 2 Separate models were built for each species.

FINAL REPORT
62
2. Site-level analyses across short observation periods. The predictor variables examined were as
described for (1) with the following modifications. The date of collection for each casualty was
identified, and the weather and acoustic data for the preceding three nights, rather than the whole
survey period, were summed across the whole site. The features of these summarised nights were
then compared with those where no bat fatalities were detected using multiple logistic regression.
This period was slightly longer than the average inter-search interval, and therefore reflects the fact
that the precise date of death is unknown and the fatality could therefore have occurred on any of
the previous three nights. Searcher-efficiency in the project was approximately 70% and therefore
there is a small chance that the casualty actually occurred earlier but was missed by previous
searches. This would tend to weaken any observed associations with activity or weather patterns
rather than generate spurious relationships, and is ignored for the purpose of analysis. If fatalities
were found on the second day of survey at a site, then the predictor mean of the predictor variables
were computed from the first two days of observation. Fatalities found on the first day of
observation were excluded as relevant data for the predictors were not available.
Because of the very small numbers of individual fatalities within each observation period, and the
fact that specific data on scavenger removal rates within each study period were not available, raw
data rather than casualty rates adjusted for observer-efficiency and predator removals were used for
these analyses. It should also be noted that the numbers of turbines searched for casualties was
greater than the numbers surveyed acoustically (6-8 casualty searches per site, versus 3 acoustic
surveys). The power of the analysis was maximised by comparing the numbers of casualties
observed across the whole site with bat activity at height summarised across the 3 study turbines.
However, a disadvantage of the approach is that the models were not able to link local variability in
bat activity within a site to casualty events at a particular turbine. The predictors used were mean
bat activity at height (per 3 turbines), maximum activity, habitat and weather. The acoustic data

FINAL REPORT
63
were logged to reduce the leverage of outlying values. Total bat passes from all species were used in
the analysis of total casualty rates (of all species), whereas species-specific activity levels were used
in the analysis of individual species. All analyses were repeated using nacelle and ground-level
activity data separately. Mixed effects regression models (LMERs) were used, which included a
random effect to account for the repeated measures (multiple nights of observation) within sites.
3. Turbine-level analyses across short observation periods. These analyses made use of information on
the location of the casualties within a site. Models were based on a subset of carcasses where the
date of death could be estimated with reasonable accuracy using the condition of the carcass
(general condition, invertebrate infestation, state of eyes) and the date of the preceding casualty
search. As in the previous analysis, carcasses found on the first day of the survey were excluded.
Acoustic data were derived from the same turbine (or where the turbine did not have acoustic data,
from the nearest turbine). In addition, because of uncertainty in this estimate, the averaged
acoustic data from each period between searches was used. Binomial mixed models were fitted,
assigning a value of one if at least one fatality occurred on a night and zero where no fatality
occurred. This avoided problems with over-dispersion which is a common problem when modelling
rare events. Due to a very low number of nights with multiple fatalities (13% of nights when
considering the dataset with the fatality night estimated and the nearest turbine used) this should
not have biased results. In all models site was entered as a random effect with varying intercept to
account for the spatial autocorrelation in the data. In addition the proportion of the night for which
the turbine was turning and the number of turbines searched (or number of turbine nights
depending on the dataset) was also entered into the model. As with the previous analyses, the
fatalities were linked with the relevant acoustic data (common pipistrelle fatalities were examined in
relation to total nightly common pipistrelle activity etc.). For these analyses there were too few
casualties to allow meaningful separate analyses of noctule, long-eared or Natterer’s bat fatalities.

FINAL REPORT
64
The high correlation between weather conditions and bat activity also means that it is not possible
to explore separately the influence of weather conditions.
Finally, the ability of different variables to predict casualties in ways useful to stakeholders was explored by
cross-tabulating the presence or absence of casualties occurring under different conditions. The positive
predictive value‡‡ and negative predictive value§§ of the these binary categories were examined using CIA
(Bryant 2011). The approach is more simplistic than analyses modelling exposures as continuous variables or
more than one variable; nevertheless they can provide useful insights into whether simple ‘rules of thumb’
might be available.
The analyses of habitat used site as a replicate, with the presence or absence of deciduous and mixed
woodland within 1500m, 500m and 200m buffers being used as predictors of fatalities. For weather
variables, each night was considered a replicate, and casualties were only included if they were considered
likely to have occurred within 2 days of the search (very few casualties were judged to have occurred with
certainty on the night before the search). There was no material difference to the findings according to
whether averaged weather conditions over the previous two nights were used, or, as presented here, the
weather on the night preceding the search.
Data on wind speed at the nacelle was not available from many of the turbine operators. Unfortunately,
prediction of nacelle-level speeds from our equipment based at ground level is not straightforward because
of the influence of local topography and habitat features, and so varies between sites. Nevertheless,
because international discussions on wind speed in relation to curtailment usually report speeds at nacelle-
‡‡ The chance that casualties occur among sites/nights where the test is positive §§ The chance that casualties do not occur among sites/nights where the test is negative
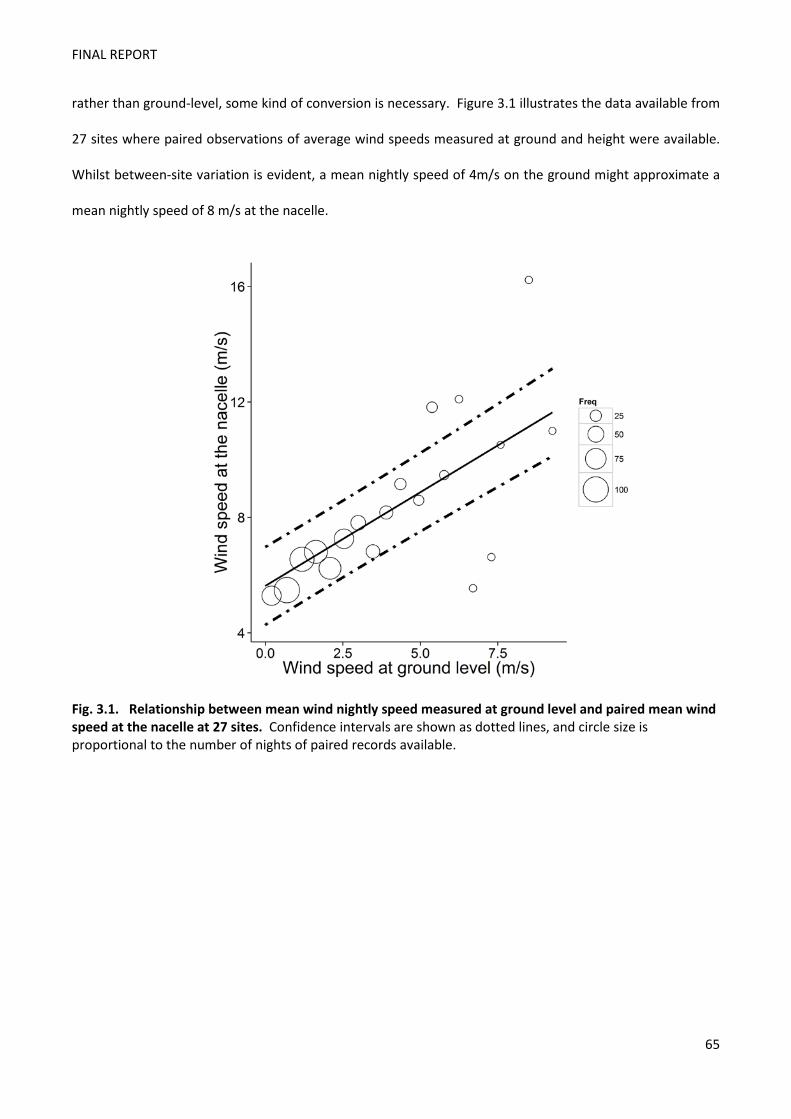
FINAL REPORT
65
rather than ground-level, some kind of conversion is necessary. Figure 3.1 illustrates the data available from
27 sites where paired observations of average wind speeds measured at ground and height were available.
Whilst between-site variation is evident, a mean nightly speed of 4m/s on the ground might approximate a
mean nightly speed of 8 m/s at the nacelle.
Fig. 3.1. Relationship between mean wind nightly speed measured at ground level and paired mean wind speed at the nacelle at 27 sites. Confidence intervals are shown as dotted lines, and circle size is proportional to the number of nights of paired records available.

FINAL REPORT
66
Results
1. Site level analyses
Turbine characteristics and Timing
Analyses were first conducted for all bat species combined and considered simply whether casualties were
absent or present at a site (rather than their number). Increasing time since 1st July (Importance index*** I=
1.0), but not the year of the project, was linked with a greater probability of bat casualties. Subsequent
analyses in this section therefore include the timing of the surveys in the models. There was a highly
significant increase in the probability of casualties being present as blade lengths increased: each metre
increase in length being associated with an increase in risk of approximately 18% (Importance index††† I= 1.0;
odds ratio (OR)‡‡‡ 1.18, 95% CI§§§ 1.05, 1.32). The height of the nacelle, the year of study, date of study (days
since 1st July), number of searches at the site, or the duration of the wind farm’s operation did not add any
further useful information. Essentially the same results were found for all pipistrelle species collectively
(blade length, I=1, OR=1.19, 95% CI 1.06, 1.34). When separate analyses were conducted for each species,
similar patterns with blade length were seen for common and soprano pipistrelle bats, though the
associations were now of borderline statistical significance, probably reflecting the smaller sample size
(common pipistrelle bats I=0.66, OR 1.046, 95% CI 0.99, 1.17; soprano pipistrelle bats (I=0.58, OR 1.036, 95%
CI 0.98, 1.15). No link with blade length was evident for noctule bats (I=0.19, OR 1.01, 95% CI 0.91, 1.16).
The duration of wind farm operation and hub height were not important predictors of fatalities for any
******The importance index, I, ranges from 0 to 1; 1 indicates the variable occurred in all the top-ranking models. ††††††The importance index, I, ranges from 0 to 1; 1 indicates the variable occurred in all the top-ranking models. ‡‡‡ The odds ratio (OR) can be interpreted as the change in probability of a fatality occurring for each unit increase in the predictor variable. An OR of 2.0 would represent a doubling of risk, an OR of 1.0 would mean no change in risk, and an OR of 0.5 would mean that the risk halved. In other words, the coefficients can be roughly interpreted as indicating the % change in odds of a casualty, if all other predictors are held constant: a coefficient of 1.1 indicates a 10% increase in risk; 1.5 a 50% increase in risk, and 2.0 a 200% increase in risk. For this project, all of the coefficients are close to 1, indicating small changes in risk are associated with each unit increase in the predictors. §§§ The confidence intervals indicate the range of values within which the estimate would be expected to fall 95% of the time were the work repeated multiple times: where the confidence intervals exclude zero, the result is considered ‘statistically significant’, p<0.05. Wider intervals indicate increasing uncertainty.

FINAL REPORT
67
species; and nor did the inclusion of the survey duration and the number of turbines searched alter any of
the findings.
The analyses were repeated to assess the links with the numbers of bats killed, rather than simply whether
sites were classified as having at least one casualty or none. The relationships were similar to those obtained
for the presence/absence of casualties. The total casualty rate increased with the length of the turbine
blades (OR=1.05, 95% CI 1.00, 1.11), but was not influenced by the other turbine characteristics. The results
for all pipistrelles collectively, and for the species individually were also virtually identical to the results for
the presence/absence of bat casualties (all pipistrelle bats OR 1.05, 95% CI 1.00, 1.11; common pipistrelle
bats OR 1.05, 95% CI 1.0, 1.12; soprano pipistrelle bats OR 1.04, 95% CI 0.97, 1.12; noctule bats OR 1.05, 95%
CI 1.00, 1.09).
There was no relationship apparent between the number of turbines present at a site and the casualty rate
per turbine (Fig 3.2, F=2.07, p=0.158). Further, whilst the relationship between the number of casualties per
site and the number of turbines was, as expected, positive and highly significant (F=13.27, p<0.001) there
was no evidence of any non-linearity in this relationship (i.e quadratic terms were not significant). It is
therefore reasonable to conclude that there is a simple relationship of increasing risk from a wind farm as
the number of turbines increases. The use of a simple offset function when modelling the casualty rate per
turbine is therefore justified.

FINAL REPORT
68
Fig 3.2. Relationship between the number of casualties per turbine and the number of turbines present at each wind farm.
Weather
No associations were seen between the presence/absence of casualties and the weather variables
examined. This was also true for when the numbers of bats killed was used as the outcome measure. The
only exception was for the number of noctule bats killed. For these bats, the minimum adequate model
included the average temperature, where the risk increased by approximately 62% for each 1°C increase in
average temperature (OR 1.62, 95% CI 1.29, 2.04) and a non-significant negative relationship with minimum
nightly wind speed.

FINAL REPORT
69
Bat activity measured at the turbines
No links were found between total casualty rates and total bat activity levels. However, at a species-specific
level, recordings made at ground level were linked with bat casualties (Table 3.3). There were also positive
associations between bat activity at height and fatality rates, but these had larger confidence intervals,
probably reflecting the smaller numbers of recordings made at height. It should be noted that the detection
distance of the microphone is unlikely to encompass the entire rotor-swept area, and therefore bats may
still be within the zone of risk despite having not been recorded on the detector.
Table 3.3. Relationship between acoustic indices of bat activity and bat casualties.
Species presence/absence casualties number of casualties
Odds Ratio 95% Confidence Interval
Odds Ratio 95% Confidence Interval
GROUND noctule 1.39 1.10, 2.27 1.15 1.09, 1.20
common pipistrelle 1.01 1.10, 1.03 1.01 1.0, 1.02
soprano pipistrelle 1.15 1.04, 1.33 1.05 1.03,1.07
HEIGHT noctule 1.35 0.93, 1.93 1.29 1.07, 1.47
common pipistrelle 1.01 0.95, 2.09 1.46 1.19, 1.78
soprano pipistrelle 1.17 1.15, 15.14 1.86 0.93, 3.19
Bat activity at the control sites
There was a positive link between the total number of passes recorded at the open control sites (all of which
were ground level) and probability of any casualties occurring. However, the confidence limits were very
wide (Figure 3.3), and the relationship was of borderline statistical significance (OR=1.01, p=0.064). No
relationship was apparent between total pipistrelle passes and the presence/absence of pipistrelle bat
casualties. There were also no links between the number of bat passes and the number of bat casualties.

FINAL REPORT
70
Figure 3.3. Relationship between total bat passes per night at control sites (away from turbines) and the
probability of a casualty occurring (all species). 95% Confidence intervals are shown as grey bars.
Habitat
Analyses were conducted separately for the land cover data at the 1500m and 2500m buffer scales. For all
bats collectively, and also for individual species, there were no significant associations between the
presence/absence of casualties and any habitat variable. There were also no links with the habitat
composition of the buffers of 1km, 2.5km or 5km constructed from the edge of the wind farm. Considering
the number, rather than the presence/absence of casualties, the minimum adequate model for all species

FINAL REPORT
71
contained the category “broadleaved and mixed woodland” only. For all bats collectively, there was a
negative relationship with the number of individuals killed for the 1500m scale buffer: each % increase in the
cover of broadleaved and mixed woodland was associated with a 14% fall in risk (OR 0.86, 95% CI 0.66, 1.00),
with a trend in the same direction for the 2500m scale (OR 0.88, 95% CI 0.73, 1.02). For common pipistrelles
there was a similar (non-significant) association (OR 0.89, 95% CI 0.66, 1.05). The trend was particularly
marked for soprano pipistrelles (OR 0.65, 95% CI 0.29, 0.93). For noctule bats, the minimum adequate
model contained only the total amount of coniferous woodland (including clearfell), and this relationship
was positive (OR 1.04, 95% CI 1.02, 1.06). The addition of turbine characteristics made no improvement to
any model that included habitat.
Further analyses were then conducted at a greater spatial resolution for features considered likely to
present a risk. The presence of inland water within buffers of 200, 500 and 1500m had no significant
associations with the presence of bat casualties (all bats, common pipistrelle, soprano pipistrelle or noctule
bats), with the exception of noctule bats where there was a positive significant association at the 200m level
(p=0.00235). There was a non-significant positive tendency of the presence of water to be linked with
fatalities of noctule bats at the other spatial resolutions, and also for all bats collectively; for pipistrelles, the
trend was reversed. There was no association between distance to the coast, or whether the site was
considered ‘coastal’ or not, and fatality risks for any bats.
2. Site-level analyses across short observation periods.
The night that the fatality occurred was estimated for 91 of the 98 fatalities (93%), of which 42 (43%)
occurred at the same turbine that the acoustic data was gathered.

FINAL REPORT
72
Weather
There was no significant association between temperature and either the probability of a casualty or the
number of casualties occurring. This was true for all species combined, as well as for the groups separately.
However, there was a small inverse relationship between minimum wind speed and casualty risk. For
casualties of any species, the risk of a casualty occurring declined by approximately 6% for each 1 m/s
increase in wind speed (OR=0.94, 95% CI 0.88, 0.99). Similar results were obtained when the number of
casualties was used as the outcome measure. This link was also demonstrated for common pipistrelles
(OR=0.94, 95% CI 0.90, 0.99) but not for other species or groups individually, probably reflecting the lower
statistical power available for other comparisons.
Bat activity
There was a significant positive association between the presence of a bat casualty (any species) and total
bat activity recorded at the nacelle (loge mean passes per night) (OR 1.54, 95% CI 1.20, 1.96). There was a
similar relationship for the number of all pipistrelle casualties and the (loge) activity of all pipistrelle bats
recorded at the nacelle (OR 1.43, 95% CI 1.19. 1.71); and also for the number of common pipistrelle bat
casualties and mean common pipistrelle bat activity (OR 1.54, 95% CI 1.20, 1.96). However, there were no
associations detected for noctule or soprano pipistrelle bats, possibly due to a lack of statistical power.
3. Turbine level analysis across short time periods
The average number of nights that a fatality was estimated to have occurred previous to the search was 2.62
(±SE 0.18 range 1 to 8 nights), counting the night previous to a search as 1.
Total activity was a significant predictor of the risk of a casualty (any species) occurring. Soprano pipistrelle
activity was a significant predictor of soprano pipistrelle fatalities, but common pipistrelle species models
were often not significant. However, in most models the conditional R2 values were low (Table 3.3), showing

FINAL REPORT
73
that activity is a poor predictor for fatalities at the turbine and nightly level. An exception was models where
activity was averaged across each search period and acoustically monitored turbines. Using this dataset,
most models were significant and R2 values were higher for common pipistrelle fatalities using acoustic data
from both ground and nacelle, and for total fatalities and soprano pipistrelle fatalities when using activity
data measured at the nacelle. Predictions are not shown for models derived from activity recorded at height
because these have higher conditional R2 values than those derived from ground-level data. Caution needs
to be taken in using these models as many of the R2 values are low and most variability in fatality is explained
by individual characteristics of the site as opposed to the number of bat passes.

FINAL REPORT
74
Table 3.3. Results of models predicting the probability of a casualty occurring of any species (all), common pipistrelle (C pipistrelle), or soprano pipistrelle (S pipistrelle). Models shown in light type have poor fit, and are considered unlikely to be reliable.
Species Method1 Turbine2 Height Estimate3 Marginal R2
(%)4 Conditional R2
(%)5 all estimated nearest ground Int*† 15 40 all estimated nearest nacelle 0.105** 3 29 C pipistrelle estimated nearest ground 0.086 NA NA C pipistrelle estimated nearest nacelle 0.010 NA NA S pipistrelle estimated nearest ground 0.229** 18 49 S pipistrelle estimated nearest nacelle 0.236* 4 43 all estimated averaged ground Int*** 29 48 all estimated averaged nacelle 0.087* 3 24 C pipistrelle estimated averaged ground 0.152* 8 51 C pipistrelle estimated averaged nacelle 0.022 NA NA S pipistrelle estimated averaged ground Int** 16 38 S pipistrelle estimated averaged nacelle 0.275*** 12 53 all SP nearest ground 0.096† NA NA all SP nearest nacelle 0.037† NA NA C pipistrelle SP nearest ground 0.174*† 10 54 C pipistrelle SP nearest nacelle 0.117† NA NA S pipistrelle SP nearest ground 0.408*** 41 62 S pipistrelle SP nearest nacelle 0.247** 6 69 all SP averaged ground 0.163† 8 33 all SP averaged nacelle Int*† 45 56 C pipistrelle SP averaged ground 0.350† 38 56 C pipistrelle SP averaged nacelle 0.183† 8 30 S pipistrelle SP averaged ground Int* 2 43 S pipistrelle SP averaged nacelle Int* 18 73
1. Indicates whether the date of death was estimated or whether the whole search period was used. 2. Indicates whether acoustic data were derived from the turbine where the casualty occurred (or the nearest
turbine), or averaged across all three turbines. 3. Estimate is the regression coefficient linking bat activity with the probability of a casualty. Larger coefficients
indicate a greater increase in the casualty probability for each unit increase in bat activity. ‘Int’ shows that the interaction between activity and the proportion of the time the turbine was turning was significant i.e. the effect of bat activity on the risk of collision varies depending on the proportion of the night for which the turbine was operational. Significance levels are shown as *** (p <0.001), ** (p <0.01) and * (p <0.05). †indicates the number of turbines (or turbine nights) searched was also a significant predictor in the model.
4. Marginal R2 gives an estimate of model fit (higher % indicating better fit) based on fixed factors only. 5. Conditional R2 gives an estimate of model fit based on fixed and random effects (i.e. accounting for variability

FINAL REPORT
75
4. Prediction of casualty rates by categories of bat activity (high/medium/low) measured at
the similar habitat control sites
Simple explorations of the potentially non-linear relationships between fatalities and bat activity, models
were conducted by splitting bat activity into three categories. Figure 3.4 shows for all bats collectively, and
also for all pipistrelles, the proportion of sites with low, medium or high levels of activity at their control sites
that also have at least one casualty (cut-off points were defined as the following number of passes per night
low <3; medium 3-49; high ≥50 which split the data into three equally sized groups****). A statistically
significant positive association was found between the probability of a bat casualty occurring at the site and
average activity levels (recorded as a continuous variable) of all species recorded at the control site (OR 1.01,
95% CI 1.002, 1.03; 37 sites with control data available for analysis). However this acoustic measure was not a
significant predictor of the numbers of casualties occurring. Further analyses of non-linear patterns in the
data (using generalised additive models) may be warranted for each species individually.
Fig. 3.4. Proportion of sites with casualties by bat activity at control site. Blue bars show mean activity of all bats; red bars show mean activity of all pipistrelle bats. Bars show standard errors.
**** Note that the cut-off points used in Section 4 to divide the data from the whole project into three equally sized groups were not useful here as none of the 37 control sites would have been defined as having ‘high bat activity’.
0
0.1
0.2
0.3
0.4
0.5
0.6
0.7
0.8
0.9
1
low medium high
Prop
ortio
n of
site
s with
cas
ulat
ies
Mean activity at control site split at tertiles

FINAL REPORT
76
5. Positive and negative predictive values
The presence of broad-leaf woodland (hereafter referred to simply as woodland) close to the turbine site was
linked statistically with casualty risk in the models presented earlier. Sites with noctule bat casualties more
commonly had woodland present than absent within the buffers examined (true for all buffer distances),
whereas the reverse was true for sites with common pipistrelle or soprano pipistrelle bat casualties.
Therefore in the exploration of the value of woodland as a predictor, the presence of woodland is treated as a
positive risk factor for noctule bats, whereas the absence of woodland is treated as a risk factor for
pipistrelles.
For noctule bats, 17 out of the 18 sites without deciduous or mixed woodland within a 1500m radius had no
casualties, and the negative predictive value (i.e. the % of sites without nearby woodland that also had no
casualties) was therefore very good; however noctule casualties were rare events (only 9 were found during
the main part of this project) whereas the presence of woodland within a 1500m radius of a wind farm site is
not. Hence only 18% of sites with woodland within this radius had casualties in this project, meaning that the
presence of woodland cannot necessarily be interpreted as risky (Table 3.4). For common and soprano
pipistrelle bats, the apparent protective effect of woodland was particularly apparent at the smallest spatial
resolution: 13 out of the 16 sites with common pipistrelle casualties, and 13 out of the 15 sites with soprano
pipistrelle casualties, had no woodland within 200m. The sensitivity of ‘woodland absence’ as a predictive test
was therefore high (86%). The negative predictive value was again high, particularly for soprano pipistrelles at
close proximity: 86% of sites with woodland within a 200m buffer had no casualties. However, around a third
of sites that had woodland also had casualties: the presence of woodland therefore clearly does not preclude
collisions.

FINAL REPORT
77
Table 3.4. Positive and negative predictive value of using presence/absence of broad-leaf woodland at distances of 1500m, 500m and 200m from the wind farm as a predictor of fatality risk. Note that these analyses treat the presence of woodland within each buffer area as a risk factor for noctule bat, whereas the absence of woodland is considered a risk factor for pipistrelle bats. Positive predictive value %
(95% CI) Negative predictive value %
(95% CI) 1500m noctule 17.9 (7.9, 35.6) 94.4 (74.2, 99.0) common pipistrelle 32.1 (17.9, 50.7) 44.4 (24.6, 66.3) soprano pipistrelle 25.0 (12.7, 43.4) 50.0 (29.0, 71.0) 500m noctule 13.3 (3.7, 37.9) 93.9 (80.4, 98.3) common pipistrelle 27.3 (15.1, 44.2) 60.0 (35.7, 80.2) soprano pipistrelle 30.3 (17.4, 47.3) 73.3 (48.0, 89.1) 200m noctule common pipistrelle 31.7 (19.6, 47.0) 71.4 (35.9, 91.8) soprano pipistrelle 31.7 (19.6, 47.0) 85.7 (48.7, 97.4)
In contrast to habitat variables, which are not readily modified post-construction even should important
numbers of casualties be found, weather and bat activity variables are used in other countries to trigger
curtailment. The distribution of total fatalities relative to weather conditions were therefore explored (Table
3.5). Most nights where casualties occurred (81.5%, 95% CI 69.2, 89.6††††) had low mean wind speeds (≤5 m/s
measured at the ground). However, low wind speeds occurred on the majority of nights. The negative
predictive value of the test was therefore very good (95.3%; 95% CI 91.5, 97.4) – meaning that most nights
with mean wind speeds >5m/s had no casualties – but the positive predictive value was only 3.6% (95% CI 2.7-
4.8) since most nights with lower wind speeds had no casualties. Temperature at dusk yielded similar results.
Most nights where casualties occurred (94.4%‡‡‡‡, 95% CI 81.9, 98.5) had dusk temperatures >10°C. However,
most nights fell within this category. The negative predictive value was therefore high (98.6%,95% CI 95.1,
99.6), but the positive predictive value was poor (3.8%, 95% CI 2.7, 5.2) since most nights with warm dusk
temperatures had no fatalities.
†††† Also known as the sensitivity of the test (44 fatalities on nights with low wind speed/54 nights with fatalities) ‡‡‡‡ Also known as the sensitivity of the test (34 fatalities on nights with warm dusk temp/36 nights with fatalities)

FINAL REPORT
78
Table 3.5. Number of nights and proportion of fatalities which occur on nights under a range of weather conditions. Fatalities were only included if they were estimated to have occurred in either of the previous two nights before a search. Note that wind speeds are measured at ground level.
Mean Rain mm/hr 0 >0≤2.5 >2.5≤7.5 >7.5 Totals*
Fatalities 91.84% 0.00% 0.00% 8.16% 49 No.nights 50.98% 33.03% 3.71% 12.27% 1,320
Mean Wind m/s ≤4 >4≤5 >5≤6 >6≤7 >7
Fatalities 66.67% 14.81% 9.26% 7.41% 1.85% 54 No.nights 77.45% 7.79% 6.96% 3.27% 4.52% 1437
Min. Wind m/s ≤4 >4≤5 >5≤6 >6≤7 >7
Fatalities 85.96% 14.04% 0.00% 0.00% 0.00% 57 No.nights 93.74% 3.95% 1.58% 0.33% 0.40% 1,518
Max. Wind m/s ≤4 >4≤5 >5≤6 >6≤7 >7
Fatalities 38.60% 12.28% 8.77% 8.77% 31.58% 57 No.nights 50.13% 13.70% 9.22% 8.37% 18.58% 1,518
Mean Temp Dusk °C ≤5 >5≤10 >10≤15 >15
Fatalities 2.78% 2.78% 63.89% 30.56% 36 No.nights 0.19% 13.69% 59.79% 25.67% 1052
* Totals are not equal due to missing weather data on some nights.
These data are also illustrated by plotting the wind and temperature conditions for the nights on which
fatalities were estimated to have occurred (each point represents one bat fatality) (Fig 3.4a &b). In the cases
where the date of death could be estimated with reasonable precision, it can be seen that fatalities occurred
across a range of wind speeds, but always less than 6 m/s (ground level), whereas there was considerable
spread in temperature ranges, and no suggestion that different wind-speed thresholds might be appropriate
for curtailment depending on temperature. Wind speed data were available from the nacelle at a subset of
14 sites where fresh casualties were found. No night prior to finding a casualty had mean wind speeds
>10m/s at the nacelle, but all had mean wind speeds >6m/s (Fig 3.5).

FINAL REPORT
79
Fig 3.4. Distribution of bat fatalities according to the combination of (a) maximum night-time temperature and (b) mean night-time temperature and wind-speed.
0
1
2
3
4
5
6
7
0 5 10 15 20 25 30
Mea
n w
ind
spee
d (m
/s)
Maximum night-time temperature (°C)
a
0
1
2
3
4
5
6
7
0 5 10 15 20 25
Mea
n w
ind
spee
d (m
/s)
Mean night-time temperature (°C)
b
a

FINAL REPORT
80
Fig 3.5. Weather conditions (mean temperature (°C) and mean wind speed (m/s) on the night preceding a
fresh casualty being located. Small circles indicate one casualty; large circles indicate 3 casualties.
The possibility of using ground-level data from control sites to create simple predictions of whether a site
would have fatalities was also explored. Categorising sites as ‘high activity’ (top third) had reasonably good
positive predictive value for all pipistrelles (75%; 95% CI 46.8, 91.1), but a relatively poor negative predictive
value:only 52% (95% CI 33.5-70.0%) of low-medium activity sites had no pipistrelle casualties. However, for
all bats collectively the positive predictive value was much poorer (36%; 95% CI 19.7; 57.0), meaning that only
a third of sites with high activity also had a bat casualty. Nevertheless, the negative predictive value was
good:

FINAL REPORT
81
14 of the 15 sites that were classified as having low-medium bat activity had no casualties of any species
(93.3%; 95% CI 70.2, 98.8).
The overall distribution of pipistrelle fatalities in relation to the combination of ground-level wind speed and
recorded activity are illustrated in Fig 3.6a and b. The data do not suggest that lower wind speed thresholds
might be appropriate when recorded pipistrelle activity is low.
Fig 3.6. Distribution of bat fatalities according to the combination of (a) mean ground-level wind speed and (b) mean ground-level wind speed with passes at ground truncated at 100 per night.
0.00
1.00
2.00
3.00
4.00
5.00
6.00
0 100 200 300 400 500 600 700 800
Mea
n w
ind
spee
d (m
/s)
Mean (total nightly) Pipistrellus passes ground
a
0.00
1.00
2.00
3.00
4.00
5.00
6.00
0 20 40 60 80 100
Mea
n w
ind
spee
d (m
/s)
Mean (total nightly) pipistrellus passes ground
Truncated at 100passes b
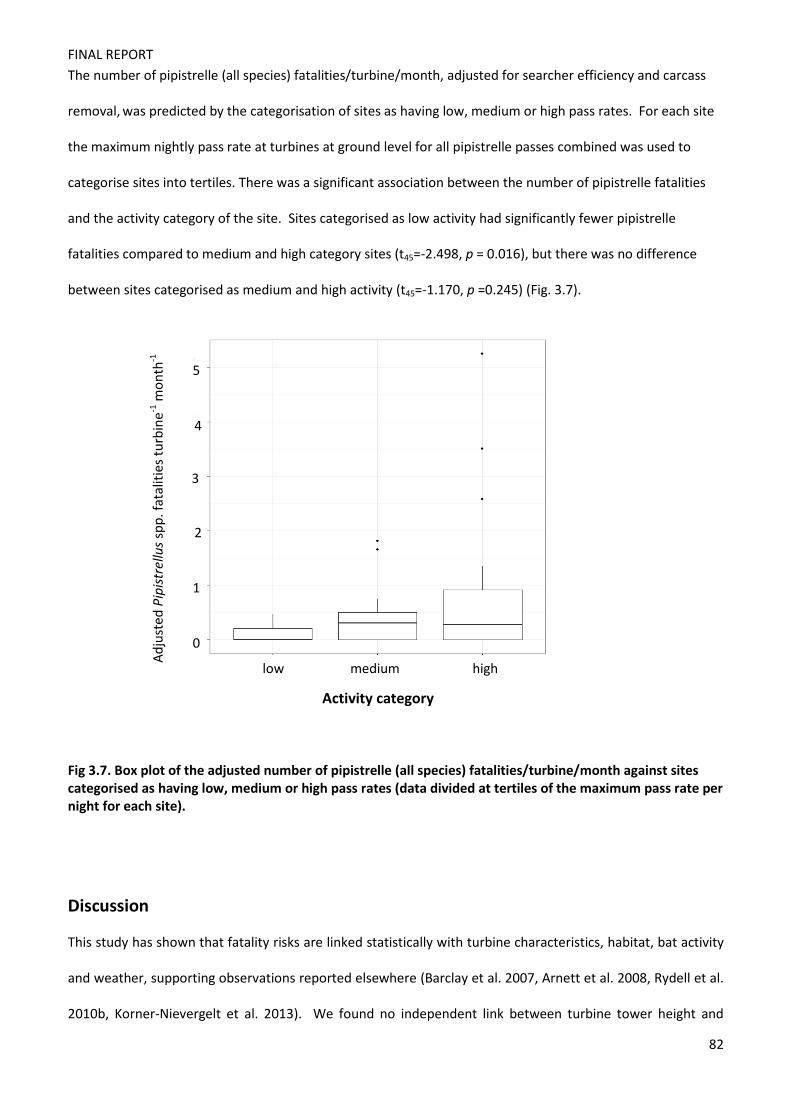
FINAL REPORT
82
The number of pipistrelle (all species) fatalities/turbine/month, adjusted for searcher efficiency and carcass
removal, was predicted by the categorisation of sites as having low, medium or high pass rates. For each site
the maximum nightly pass rate at turbines at ground level for all pipistrelle passes combined was used to
categorise sites into tertiles. There was a significant association between the number of pipistrelle fatalities
and the activity category of the site. Sites categorised as low activity had significantly fewer pipistrelle
fatalities compared to medium and high category sites (t45=-2.498, p = 0.016), but there was no difference
between sites categorised as medium and high activity (t45=-1.170, p =0.245) (Fig. 3.7).
Fig 3.7. Box plot of the adjusted number of pipistrelle (all species) fatalities/turbine/month against sites categorised as having low, medium or high pass rates (data divided at tertiles of the maximum pass rate per night for each site).
Discussion
This study has shown that fatality risks are linked statistically with turbine characteristics, habitat, bat activity
and weather, supporting observations reported elsewhere (Barclay et al. 2007, Arnett et al. 2008, Rydell et al.
2010b, Korner-Nievergelt et al. 2013). We found no independent link between turbine tower height and
low medium high
Activity category
5
4
3
2
1
0
Adju
sted
Pip
istre
llus s
pp. f
atal
ities
turb
ine-1
mon
th-1

FINAL REPORT
83
casualty rates unlike some previous reports ((Barclay et al. 2007, Rydell et al. 2010b) and the reasons for this
are unclear. Height is to some extent confounded with the duration of operation (modern turbines tend to be
larger), and these two previous review papers were not based on systematic surveys of a representative
sample of turbine heights, so there may have been confounding effects. We did, like (Rydell et al. 2010b) but
not (Barclay et al. 2007) find that casualties increased with rotor size, and this could have important practical
applications in assessing future risks.
It is also evident that the prediction of fatalities with precision is extremely difficult. This is for several
reasons. First, each individual fatality is a rare event, and modelling the occurrence of rare events within
reasonable confidence limits is inherently challenging (Zuur et al. 2009). Second, there is clustering of the
predictor variables – most study nights have rather similar weather conditions; and within each site, turbines
are the same make and model, and the landscape context is constant. This makes it more difficult to observe
associations than where there is good replication across a wide range of values. Finally, there are inherent
errors associated with the outcome measures (casualty rates). Whilst it was possible to adjust for observer-
error and carcass removal rates for analyses conducted at the site-level (sections 1 and 2), analyses based on
observations of individual bats (section 3) could not be corrected in the same way. It was also not possible to
adjust zero observation: the consequent presence of false-negative results in the dataset will have been a
particular difficulty for those analyses based on the presence/absence of casualties. Finally, it appears that
casualty patterns are inherently very variable. For example, sites studied in more than one year (n = 4), had
different fatality patterns in consecutive years, however, replication was low. Whilst many fatalities do occur
at sites with high bat activity rates, fatalities are also recorded at sites where bat activity was low; and in
addition, some sites had high bat activity rates but few or no fatalities.
It has not been possible, to date, to identify features that could be used easily to minimise the risk to bats a
priori through, for example, the better siting of turbines. In particular, it is notable that bat activity at control
sites (the nearest proxy available to preconstruction bat activity surveys), did not predict the number of
fatalities. However, there was some support for high pipistrelle bat activity being positively linked with the

FINAL REPORT
84
risk of a site having any casualties; and sites with low-medium activity rates were unlikely to have casualties of
all species combined. Stakeholders must now assess whether the simple classification of a site as being at risk
of having at least one casualty is useful in practice, or whether more refined risk estimates are required in
practice. We recommend further analysis of these relationships using more sophisticated generalised
additive modelling that would allow non-linear patterns in the data to be explored more thoroughly. We also
emphasise that the assessments of the positive and negative predictive value of bat activity are intended as
simple univariate guides, and do not take into account the complexities of collision risks that may affect a
particular site (for example, they do not adjust for the increased risks associated with larger blade lengths).
The influence of habitat appears complex, with the direction of association with broad-leaf woodland varying
between pipistrelle and noctule bats. The apparent protective effect of woodland may be because this
habitat is preferred by pipistrelles foraging, whereas if no woodland or other suitable linear features are
present then the bats are instead attracted to the turbine. In contrast, woodland may be associated with
increased risk of noctule casualties because it provides roosting opportunities (and hence affects population
density) without any corresponding attractiveness during foraging because the species is adapted to open-
space feeding. Given that this study provides some evidence that pipistrelle casualties are more frequent at
sites where woodland is absent, consideration may need to be given to revising the current guidance on this
issue. It would also be valuable to conduct further analysis investigating the links between casualty risk and
distance to other features associated with bat activity such as hedgerows and watercourses. However, it
must be emphasised that whilst the negative predictive power of the habitat features were promising
(absence of the feature predicts absence of casualties), the positive predictive value was fairly weak: most
sites with the features also did not have casualties.
Bat activity measured at the turbines (and also at control sites) had some relationship with fatality risk, but
there was much variability and hence confidence intervals are very wide. We conclude that most of the
variability in bat fatalities was due to site-specific factors rather than to overall activity levels. At present
therefore, the main management option that can be suggested by this project is standardised post-

FINAL REPORT
85
construction surveys (using the techniques developed in this work), followed by curtailment based on wind
speed should problems be identified. Given that this remains a relatively crude approach, and for most nights
where output is lost, there would have been no risk to bats from operational turbines, it would be
proportionate only where risks to bats have been identified with certainty. Our work to improve the
prediction of risk is ongoing, but we strongly encourage further research using daily sampling of turbines to
assess the link between weather, bat activity and fatality risk more precisely.

FINAL REPORT
86
Section 4: Design of acoustic surveys for wind energy facilities
Introduction
The acoustic monitoring of bat activity at wind farms is a fundamental component of pre- and post-
construction ecological assessments. Recent technological advances mean that acoustic detectors are readily
available, and therefore transect surveys and static detector deployment at ground level are now
commonplace. Different species have different probabilities of detection because higher frequency calls
attenuate more rapidly in space (Griffin 1971), and species with highly directional calls are more likely to be
under-recorded. Seasonal variability in bat activity patterns is also well known (Catto et al. 1995, Russ 1999,
Russ et al. 2003). However, very few studies have assessed how the altitudinal distribution of bats, or the
temporal variability in activity within seasons affects the ability to estimate accurately species composition
and relative abundance. One exception is Collins and Jones (2009) who recorded bat activity at seven sites
over an average of five nights. Generally, they found significantly higher bat activity at ground level (~ 2m)
compared to 30m above ground (measured from bat detectors attached to mobile phone and research
masts). Although the total activity of open-high flying specialists (Nyctalus and Eptesicus species) did not vary
significantly with monitor height, the calls were heard at different times illustrating that the same individuals
were not being recorded simultaneously on both detectors. In addition, their proportions relative to other
species did vary with detector height. Recently Bach et al. (Bach et al. 2013) showed that although there was a
link between the activity levels measured at ground and wind turbine-nacelles for Pipistrellus spp. and
noctules, these relationships were not consistent over time. In spring and autumn bats appeared to fly either
at height or close to the ground, whereas in late summer they used the whole airspace. In other studies
conducted in woodland or tropical forests, activity was generally greatest above the forest canopy,
particularly for open flying bats (Kalcounis et al. 1999, Menzel et al. 2005). However, it is not clear how
transferable these findings are to other habitats. For bats which fly in more cluttered environments the
findings are less consistent between studies. For example Kalcounis et al. (1999) found that activity did not
differ significantly within and above the forest canopy, but this finding was not replicated in other studies
(Hayes and Gruver 2000, Menzel et al. 2005). Recently, work in Germany has indicated that pipistrelles, which

FINAL REPORT
87
are generally considered to fly at low-mid heights forage regularly above the forest canopy, potentially
explaining their risk from wind turbines (Müller et al. 2013).
In addition to the survey problems caused by altitudinal spatial variability, temporal variability in activity also
represents a major potential problem for effective monitoring. Previous assessments of temporal variability in
activity within sites are very limited, and studies that have estimated the number of survey nights required to
determine accurately species composition and relative abundance have only been conducted at single sites
(Hayes 1997, Broders 2003). Here, bat activity varied by a factor of 6 over four nights, and the number of
surveys nights required to portray mean activity accurately for Myotis lucifugus was suggested to be more
than 20 nights.
The UK has some of the most detailed guidelines for surveying bats (Hundt 2012). Europe has some of the
highest levels of protection for bats (Directive 1992), where all species and their roosts are legally protected
(translated into domestic legislation in the UK via the Natural Environment and Rural Communities Act 2006,
Conservation of Species and Habitats Regulations 2010), and this is reflected in the survey guidelines. These
guidelines state “bat detectors can be installed at height, in order to quantify the amount of bat activity in
specific locations. This method is normally only employed in specific circumstances such as at high risk wind
turbine sites.” They advise a static detector survey effort of 5 consecutive nights per survey location per site
per season for low risk sites, and 5 consecutive nights per month per site for moderate and high risk locations,
and advise surveyors to consider the size of the survey area and the quality of the habitat; proximity to
protected sites; and proximity to buildings or features providing potential roosting sites in determining the
appropriate level of survey effort (Collins 2016).
In section 2 of this report, we have described the difference in bat activity patterns recorded at ground level
and from the nacelle of wind turbines in this project. We now assess the number of nights needed to detect
species composition and relative abundance at ground and height with acceptable accuracy.

FINAL REPORT
88
Methods
Analyses were conducted separately for each species, and only sites that fell within the conventionally-
defined geographical range for the target species (according to IUCN International Union for the Conservation
of Nature, (IUCN 2008)) were considered. The analysis therefore does not consider cases where occasional
passes were recorded from rare or vagrant animals. The species considered were: common pipistrelle,
soprano pipistrelle, Nathusius’ pipistrelle, noctule, Leisler’s, and serotine (Eptesicus serotinus) bats. All
statistical analyses were conducted in the programme R (version 3.0.3) (R Development Core Team 2013).
Data collected at ground and height were analysed separately to reflect the fact that most bat surveys are
conducted at ground level – so separate results would be more useful to practitioners – and also because the
measurements made at ground and height differ substantially. A Monte-Carlo approach was used to assess
the minimum number of nights required to determine accurately activity levels for relative abundance
estimates. The dataset was restricted to only nights which met minimum weather conditions for bats;
minimum temperature of 10°C at dusk (Hundt 2012), maximum ground-level wind speed of 8 ms-1, and
average rainfall less than 2.5mm hr-1, and the analyses for each species only included sites where the target
species had been detected during the study. The maximum recorded nightly pass rate (across all detectors)
was computed for each site during the total survey period. This approach was used as opposed to using other
measures such as median or mean pass rates, because most median and mean values were zero, and the
highest pass rate across the survey period is likely to be the time when bats are most at risk from wind
turbines, and so represents the worst-case scenario. A single randomly selected survey night was then
sampled from a randomly selected site (without replacement). From this sample, the maximum nightly pass
rate was determined. We then replaced the data and repeated the process 1000 times. This process was
repeated for an increasing number of consecutive nights (1 to 16 nights), comparing the maximum pass rate
within each site and night combination to the overall maximum pass rate for the site. For each species, the
proportion of the 1000 repeated samples, for each survey night, which fell within 10% of the maximum pass
rate for the site, was then computed, along with the standard errors. The proportion of the samples that fell

FINAL REPORT
89
into the categories of ‘high’, ‘medium’ and ‘low’ bat activity was also calculated. (In the absence of any
agreed functional definition of what constitutes ‘high’, ‘medium’ or ‘low’ activity, the cut-off points are simply
based on taking the maximum night of activity for each site/species combination and splitting the data
impartially into three equally-sized groups for the whole of Great Britain – see Section 2). To assess the
ability of surveys to detect the presence of a species, the same analyses were also conducted using
presence/absence data, including all sites within range for 1 to 14 nights. Comparisons of the between-site
and between-night (within site) variability in bat activity were made using the outputs of GLMMs (with a
negative binomial error distribution) predicting pass rates from a model with turbine specified as a fixed
effect, site as a random effect, and night as a random effect nested within site. We performed all statistics
with R (v.3.0.3), using the packages lme4 (v.1.1.7) and GLMMADMB to fit GLMMs.
Results
The data considered here relate to monitoring 138 turbines at ground and 105 turbines at height for 1,367
nights and 1,258 nights respectively). This differs slightly from the data presented in Section 2 since unpaired
data (due to technical issues with a detector at either ground or height) are excluded and data from nights of
good weather for bats (as previously described) are used unless otherwise stated. 97% of passes were
identified to species level and the remainder to genus (Table 4.1). There were 992 passes for bats in the genus
Nyctalus which could not be identified to species, and 219 passes where it was not possible to distinguish
between Eptesicus and Nyctalus.
Species presence/absence
Over the full survey period at each site, all species detected were recorded at ground level, except for noctule,
Leisler’s and long-eared bats where, at one site each, detection occurred only at height rather than at ground.
Table 4.1 summarises the data from paired detectors at height and ground, showing the relative distribution
of species activity. Because our study was extensive in terms of time, we were also able to assess the
probability of detecting at height only on a nightly basis. Species differed in the probability of being detected
only at height and not at ground (χ23 = 61.536, p < 0.001), and the height of the nacelle also affected the

FINAL REPORT
90
probability of a species being detected (χ21 = 4.604, p = 0.0319). The likelihood of only detecting a species at
height and not ground was highest for noctule, where the probability varied between 0.02 and 0.19
depending on turbine height. The probability of recording Nathusius’ pipistrelle at height and not at ground
was 0.05. The rates for common and soprano pipistrelle were 0.03 and 0.02 respectively. When considering
only elevations between 30m and 50m, the probability of not detecting Nathusius’ pipistrelle and noctule bats
at ground level increased to 14% and 21%, respectively. Therefore, monitoring at ground level only would
under record the presence of Nathusius pipistrelle and noctule bats.
The number of survey nights needed to detect the presence of species at 80% of sites (equivalent to the
generally accepted level of power, (Cohen 1988)) was one night for common pipistrelle and ten nights for
barbastelle bats, both at ground level (Table 4.2, Fig 4.1). After 5 survey nights, barbastelle and Nathusius’s
pipistrelle bats would not have been detected at ground level at 45% and 28% of sites respectively (Fig. 4.1).
Therefore to detect the full composition of species at ground level, at least six nights of surveys are required
for more common species and ten nights for less common species.
Table 4.1. Summary of number of sites surveyed in each species’ range and recorded passes.*
Species Mean nightly
passes per site
(±SE)
Total passes Number of
passes at
height (%)
barbastelle 0.03 (0.02) 89 0 (0)
lesser horseshoe <0.001 (NA) 5 0 ( 0)
greater horseshoe 0.003 (0.003) 11 0 (0)
Myotis spp. 0.52 (0.10) 3,120 20 (0.64)
long-eared 0.11 (0.03) 678 17 (2)
common pipistrelle 21.66 (4.55) 138,409 6,744 (5)
soprano pipistrelle 5.16 (1.67) 30,969 5,037 (16)
Nathusius’ pipistrelle 0.22 (0.05) 1,254 158 (13)
serotine 0.01 (0.003) 9 2 (22)
Leisler’s 0.02 (0.02) 75 16 (21)
noctule 1.56 (0.53) 8,228 2,096 (25)
*Excluding nights with no activity and including only paired ground and height nights.

FINAL REPORT
91
Table 4.2. Results from resampling data over increasing survey nights, showing the number of nights needed to detect species at 80% of sites and the percentage of sites where each species was detected after 5 nights of surveying at ground and height level.
80% sites species detected
% sites species detected after 5
nights (±SE)
80% sites within 10% max. relative
abundance
% sites within 10% max. activity index after 5 nights (±SE)
Species Ground Height Ground Height Ground Height Ground Height barbastelle 10 - 54.5
(0.16) - 13 - 34.0
(0.05) -
Myotis spp. 3 4 93.4 (0.19)
89.5 (0.21)
13 13 48.0 (0.72)
49.1 (0.12)
long-eared 6 6 77.0 (0.17)
74.8 (0.19)
12 12 51.4 (0.12)
52.6 (0.14)
common pipistrelle 1 1 99.9 (0.20)
99.7 (0.22)
16 14 38.7 (0.09)
42.2 (0.11)
soprano pipistrelle 2 3 92.5 (0.19)
92.5 (0.22)
13 13 44.3 (0.10)
47.0 (0.12)
Nathusius’ pipistrelle 6 7 72.5 (0.16)
70.9 (0.17)
16 13 37.9 (0.09)
46.4 (0.12)
noctule 3 5 90.8 (0.21)
81.6 (0.22)
16 14 37.5 (0.10)
41.5 (0.13)
Figure 4.3. Comparison of using 1, 2 or 3 detectors placed at ground or height in order to detect species presence with varying degrees of precision.

FINAL REPORT
92
Relative abundance
The maximum pass rate (per turbine per night) was highly variable, and this variability was particularly
marked for common and soprano pipistrelles. The maximum nightly pass rates in each category were highest
when all nights were included compared to when only nights which met minimum weather conditions were
included: for noctules, and common and soprano pipistrelles, the highest pass rates occurred on nights which
were not classified as having favourable weather conditions for bats.
Across all sites, pipistrelles were the most frequently recorded bats (94%), with common pipistrelle being the
most abundant (mean 22 ± SE 5 passes per night). Activity was always significantly higher at ground
compared to height for each species (Table 4.3). This difference between species in abundance at height was
significant (χ23 = 3734.4, P < 0.001); and the height of the nacelle also predicted abundance (χ2
1 = 4.913, P =
0.027). A lack of consistency in relative abundance at ground compared to height positively biases abundance
estimates of low flying specialists and common pipistrelles, and negatively biases abundance of the medium
flying specialist soprano pipistrelle and the higher flying specialist noctule bats if monitoring occurs only at
ground level.
Table 4.3. Relationship of total nightly activity at ground to that at height (Model 1), and prediction of total nightly activity at height by ground-level activity and the nacelle height (Model 2). Table shows z scores and associated significance values *** p<0.001; ** p<0.01; * p<0.05
Model 1 Model 2 Species Ground vs Height Ground Elevation of
detector at height R2
GLMM(m)
Myotis spp. -16.499*** 1.41 -0.80 NA long-eared -4.77*** 1.25 -0.28 NA common pipistrelle -35.77*** 2.29* -2.96** 0.8% soprano pipistrelle -27.63*** 7.17*** -1.98* 2.4% Nathusius’ pipistrelle -3.81*** 1.38 -1.04 NA noctule -10.92*** -2.00* 6.90*** 2.3%
Under ideal weather conditions, between 13 and 16 survey nights are required to give an 80% probability that
surveys will be within 10% of the maximum recorded bat abundance at height. (The range of 13 to 16 is due

FINAL REPORT
93
to a variation in detector height and species sampled (Table 4.2)). Only a third of the sites we studied would
detect a relative abundance within 10% of the maximum recorded activity using five survey nights.
The number of nights of monitoring required to classify bat activity with acceptable accuracy into ‘high’,
‘medium’ and ‘low’ activity classes (based on maximum recorded activity as defined in Table 4.4) was also
explored (Table 4.5). The number of nights required for ground level recordings were slightly higher than
those required to classify the maximum pass rate within 10%; whilst for recordings made at height,
approximately 3 weeks of survey effort were required.
Table 4.4. The lower and upper limits for the maximum nightly pass rates used to categorise sites using data from 1, 2 and 3 turbines. Sites were separated into tertiles based on their maximum nightly pass rates within the survey period.
.
Ground Height Species No.
turbines Low Medium High Low Medium High
B. barbastellus 1 0 na 1-6 0 na na Myotis spp. 1 0-1 2-3 4-88 0 na 1-4 N. noctula 1 0-1 2-7 8-271 0 1-21 23-396 Nyctalus/Eptesicus 1 0 1-5 6-272 0 1-2 3-405 P. nathusii 1 0 1 2-47 0 na 1-20 P. pipistrellus 1 0-15 16-162 232-3,324 0 1-8 12-682 P. pygmaeus 1 0-2 3-30 31-813 0 1-2 3-802 Plecotus spp. 1 0 na 1-16 0 na 1 B. barbastellus 2 0 na 1-6 0 na na Myotis spp. 2 0-2 3 4-88 0 na 1-4 N. noctula 2 0-1 2-12 13-271 0 1-2 3-396 Nyctalus/Eptesicus 2 0 1-8 9-272 0 1-2 3-405 P. nathusii 2 0-1 2-3 4-47 0 na 1-20 P. pipistrellus 2 0-34 35-387 388-3,324 0 1-7 8-682 P. pygmaeus 2 0-3 4-45 46-813 0 1-2 3-802 Plecotus spp. 2 0 1 2-16 0 na 1-3 B. barbastellus 3 0 na 1-6 0 na na Myotis spp. 3 0-2 3-6 7-88 0 na 1-4 N. noctula 3 0-2 3-12 13-272 0 1-9 10-396 Nyctalus/Eptesicus 3 0 1-8 9-271 0 1-2 3-405 P. nathusii 3 0-1 2-5 6-91 0 na 1-20 P. pipistrellus 3 0-47 48-454 455-3,324 0 1-8 9-682 P. pygmaeus 3 0-7 8-46 47-813 0 1-2 3-802 Plecotus spp. 3 0-1 2 3-27 0 na 1-3

FINAL REPORT
94
Table 4.5. The minimum number of nights to categorise 80% of sites correctly as having maximum activity rates that fell into low, medium or high categories (defined by maximum nightly activity).
All data (ground)
All data (height)
Good weather (ground)
Good weather (height)
common pipistrelle 15 20 12 12 soprano pipistrelle 12 19 10 9 Nathusius’ pipistrelle
15 21 12 14
noctule 15 21 11 19
In summary, when considering all the ‘at risk’ species, and restricting nights to only those that met the
minimum weather conditions, a minimum of 12 nights at ground and 19 nights at height should be considered
for static monitoring.
We also explored the effect of varying the numbers of detectors used at each site. Our survey protocol
surveyed 3 turbines per site, and therefore it was possible to assess the impact of using 1, 2 or 3 detectors on
the duration of survey effort required. In general, increasing the number of detectors from 1 to 2 increased
survey precision, but increases from 2 to 3 made little improvement if the surveys were of short duration. It
therefore appears that increasing the number of detectors is unlikely to compensate for short survey effort,
primarily because of the very high night-to-night variability in bat activity.
Predicting activity at height
Recent high bat fatalities at wind farm sites have highlighted the need to record accurately bat abundance
indices within the rotor sweep area. This area is often well beyond the maximum recording range for
detectors used at ground level. Detector height and total nightly ground level activity were significant
predictors for determining total nightly activity at height for common and soprano pipistrelle and for noctule
bats, but these predictors only explained between 0.8% and 2.4% of the variability in recorded activity (Table
4.3). However, the R2 value for the combined fixed and random terms explained between 83.9% and 86.8% of
the variability, highlighting the considerable amount of random variability between sites. There were no clear
linear relationships between the elevation of the detector and the ratio of passes recorded (ground to height),
and there was considerable variability between sites (Fig 4.4).

FINAL REPORT
95
Figure 4.4. Nightly paired ratio of total passes at height compared to ground for each site (±SE) against detector elevation for (a) common pipistrelle bats, (b) soprano pipistrelle bats, (c) Nathusius’ pipistrelle bats and (d) noctule bats.
Comparison of variability between sites and nights
There was considerable variability between nights at the same site in bat activity. Frequently the between-
night SD was of similar magnitude to that between sites. It was also notable that for the recordings made at
height for common pipistrelle, soprano pipistrelle and Myotis bats, the between night variability was greater
than that between sites (Table 4.5).
0
0.1
0.2
0.3
0.4
0.5
0.6
0.7
0.8
30 50 70
Ratio
of p
asse
s at h
eigh
t to
grou
nd
Detector elevation at height
00.20.40.60.8
11.21.41.61.8
2
30 50 70Ra
tio o
f pas
ses a
t hei
ght t
o gr
ound
Detector elevation at height
0
0.5
1
1.5
2
2.5
30 50 70
Ratio
of p
asse
s at h
eigh
t to
grou
nd
Detector elevation at height
c
0
0.2
0.4
0.6
0.8
1
1.2
1.4
1.6
30 50 70 90
Ratio
of p
asse
s at h
eigh
t to
grou
nd
Detector elevation at height
d
a b

FINAL REPORT
96
Table 4.5. SDs for night and site measured at ground and height for different species
Ground Height
Site Night Site Night common pipistrelle 2.42 2.00 0.25 7.83 soprano pipistrelle 1.94 1.94 0.71 8.58 Nathusius’ pipistrelle 1.35 1.53 1.95 0.01 noctule 2.14 1.61 3.02 2.08 Nyctalus & Eptesicus spp. 2.77 1.58 3.48 2.19 Myotis spp. 1.58 1.13 1.90 10.95 long-eared 1.43 1.43 NA NA
Discussion
Species composition and relative abundance were not consistent between ground and height level. When
monitoring is only conducted at ground level there is probability of between 0.02 (2%) and 0.19 (19%) of not
detecting noctule bats (depending on turbine height) and a probability of 0.05 (5%) of not detecting
Nathusius’ pipistrelle bats. This increased to 0.21 (21%) and 0.14 (14%) respectively when the analysis was
restricted to include only elevations of 30m-50m in the ‘height’ category. However, there was only very low
chance of not detecting common and soprano pipistrelles if they were truly present at a site. Barbastelle and
horseshoe bats were only detected at ground level (although the number of sites where these species were
detected was low (n = 9 and n = 7, respectively) and within these sites, encounter rates were low.
Estimates of the activity levels of common bat species was significantly positively biased towards common
and Nathusius’ pipistrelle bats and negatively biased towards soprano pipistrelle and noctule bats, when using
monitoring data from ground level. This therefore raises concerns about assessments of the relative
abundance of some medium and high flying specialists if monitoring is conducted only at ground level. In
addition further bias may be introduced as a result of bat surveys being too short in duration. Excluding those
species not expected to be detected in more open environments such as horseshoe species, our study shows
there is high night-to-night variability in bat activity, and that at least a third of surveys conducted to current

FINAL REPORT
97
specifications are not detecting the full composition of species at a site. Their estimates of activity levels are
even poorer.
The conservation of threatened populations is based on accurate recordings of distributions and population
sizes and the ability to detect their changes (Yoccoz et al. 2001; Lancia et al. 2005). Due to the high temporal
variability in measured activity levels within seasons, and the under-recording of medium and high flying
species, care is needed in interpreting data on abundance and distribution. Our research shows that ground
level monitoring is not able to predict accurately activity within the full rotor sweep area for all species.
Acoustic monitoring at height in addition to ground at wind farm sites is therefore recommended, especially
for sites within the distribution range of high-flying specialists, such as noctule bats. Combining these results
with the models predicting fatality, we cannot confirm that monitoring at height is a better predictor of
fatality for higher flying specialists (noctule bats), due to low fatalities for this species, however, activity data
shows that detection and relative abundance would be less accurate when only monitoring at ground. Ground
level monitoring may be sufficient when only common and soprano pipistrelles are at risk, because activity at
ground rather than height was a better predictor of fatality.

FINAL REPORT
98
References
Adams, A. M., M. K. Jantzen, R. M. Hamilton, and M. B. Fenton. 2012. Do you hear what I hear? Implications of detector selection for acoustic monitoring of bats. Methods in Ecology and Evolution 3:992-998.
Amorim, F., H. Rebelo, and L. Rodrigues. 2012. Factors influencing bat activity and mortality at a wind farm in the Mediterranean region. Acta Chiropterologica 14:439-457.
Arnett, E., G. Johnson, W. Erickson, and C. Hein. 2013a. A synthesis of operational mitigation studies to reduce bat fatalities at wind energy facilities in North America. A report submitted to the National Renewable Energy Laboratory. Bat Conservation International. Austin, Texas, USA. The National Renewable Energy Laboratory. Austin, Texas, USA: Bat Conservation International.
Arnett, E. B. 2006. A prelimary evaluation on the use of dogs to recover bat fatatlities at wind energy facilities. Wildlife Society Bulletin 34:1440-1445.
Arnett, E. B., W. Brown, W. P. Erickson, J. K. Fiedler, B. L. Hamilton, T. H. Henry, A. Jain, G. D. Johnson, J. Kerns, and R. R. Koford. 2008. Patterns of bat fatalities at wind energy facilities in North America. The Journal of Wildlife Management 72:61-78.
Arnett, E. B., C. D. Hein, M. R. Schirmacher, M. M. Huso, and J. M. Szewczak. 2013b. Evaluating the effectiveness of an ultrasonic acoustic deterrent for reducing bat fatalities at wind turbines. PLoS One 8:e65794.
Arnett, E. B., M. M. P. Huso, M. R. Schirmacher, and J. P. Hayes. 2011. Altering turbine speed reduces bat mortality at wind-energy facilities. Frontiers in Ecology and the Environment 9:209-214.
Asif, M., and T. Muneer. 2007. Energy supply, its demand and security issues for developed and emerging economies. Renewable and Sustainable Energy Reviews 11:1388-1413.
Bach, L., P. Bach, K. Eckschmitt, K. Frey, and U. Gerhardt. 2013. Bat fatalities at different wind facilities in northwest Germany. CWE2013, Stockholm, Sweden.
Baerwald, E. F., G. H. D'Amours, B. J. Klug, and R. M. R. Barclay. 2008. Barotrauma is a significant cause of bat fatalities at wind turbines. Current Biology 18:695-696.
Barclay, R. M. R., E. F. Baerwald, and J. C. Gruver. 2007. Variation in bat and bird fatalities at wind energy facilities: assessing the effects of rotor size and tower height. Canadian Journal of Zoology 85:381-387.
Barratt, E. M., R. Deaville, T. M. Burland, M. W. Bruford, G. Jones, P. A. Racey, and R. K. Wayne. 1997. DNA answers the call of pipistrelle bat species. Nature 387:138-139.
Barton, K. 2014. Package ‘MuMIn’: multi-model inference. R package version 1.9. 13. Battersby, J. 2005. UK mammals: Species status and population trends. JNCC/Tracking Mammals Partnership.3
November 2006. Behr, O., R. Brinkmann, I. Niermann, and F. Korner-Nievergelt. 2011. Fledermausfreundliche
Betreibsalgorithm fur Windenergieanlagen Pages 354-383 in R. Brinkmann, O. Behr, I. Niermann, and M. Reich, editors. Entwicklung von Methoden zur Untersuchung und Reduktion des Kollsionsrisikos van Fledermäusen an Onshore-Windenergieanlagen. Umwelt und Raum, Cuvillier Verlag, Göttingen.
Bilgin, R., E. Coraman, A. Karatas, and J. C. Morales. 2009. Phylogeography of the greater horseshoe bat, Rhinolophus ferrumequinum (Chiroptera: Rhinolophidae), in southeastern Europe and Anatolia, with a specific focus on whether the Sea of Marmara is a barrier to gene flow. Acta Chiropterologica 11:53-60.
Bio3. 2013. Monitorização da Comunidade de Quirópteros do Parque Eólico de Meroicinha II. Relatório II (Fase de exploração). . Portugal.
Bispo, R., G. Palminha, J. Bernardino, T. Marques, and D. Pestana. 2010. A new statistical method and a web-based application for the evaluation of the scavenging removal correction factor.in Proceedings of the VIII Wind Wildlife Research Meeting, Denver, EUA.
Bogdanowicz, W., K. Piksa, and A. Tereba. 2012. Hybridization Hotspots at Bat Swarming Sites. PLoS ONE 7. Bolker, B. M., M. E. Brooks, C. J. Clark, S. W. Geange, J. R. Poulsen, M. H. H. Stevens, and J.-S. S. White. 2009.
Generalized linear mixed models: a practical guide for ecology and evolution. Trends in Ecology and Evolution 24:127-135.
Boston, E. S. M., N. Hanrahan, S. J. Puechmaille, M. Ruedi, D. J. Buckley, M. G. Lundy, D. D. Scott, P. A. Prodoehl, W. I. Montgomery, and E. C. Teeling. 2011. A rapid PCR-based assay for identification of

FINAL REPORT
99
cryptic Myotis spp. (M. mystacinus, M. brandtii and M. alcathoe). Conservation Genetics Resources 3:557-563.
Brinkmann, R. 2005. Survey of possible operational impacts on bats by wind facilities in Southern Germany. Final report submitted by the Administrative District of Freiburg, Department of Conservation and Landscape Management and supported by the foundation Naturschutzfonds Baden-Württemberg. Brinkmann Ecological Consultancy. Gundelfingen/Freiburg, Germany.
Brinkmann, R., H. Schauer-Weisshahn, and F. Bontadina. 2006. Survey of possible operational impacts on bats by wind facilities in Southern Germany. Final report submitted by the Administrative District of Freiburg, Department of Conservation and Landscape Management and supported by Naturschutzfonds Baden-WÃrttemberg. Brinkmann Ecological Consultancy, Gundelfingen/Freiburg229.
Broders, H. G. 2003. Another quantitative measure of bat species activity and sampling intensity considerations for the design of ultrasonic monitoring studies. Acta Chiropterologica 5:235-241.
Bryant, T. 2011. Confidence Interval Analysis (CIA) Software, version 2.2.0. BMJ Publishing Group, Southampton.
Bryja, J., and A. Konecny. 2003. Fast sex identification in wild mammals using PCR amplification of the Sry gene. Folia Zoologica 52:269-274.
Burnham, K. P., and D. R. Anderson. 2002. Model Selection and Multimodel Inference. 2nd edition. Springer-Verlag, New York.
Burnham, K. P., D. R. Anderson, and K. Huyvaert. 2011. AIC model selection and multimodel inference in behavioral ecology: some background, observations, and comparisons. Behavioural Ecology and Sociobiology 65:23-35.
Catto, C., P. Racey, and P. Stephenson. 1995. Activity patterns of the serotine bat (Eptesicus serotinus) at a roost in southern England. Journal of Zoology 235:635-644.
Cohen, J. 1988. The concepts of power analysis. Statistical power analysis for the behavioral sciences:1-17. Collins, J., and G. Jones. 2009. Differences in bat activity in relation to bat detector height: implications for bat
surveys at proposed windfarm sites. Acta Chiropterologica 11:343-350. Collins J. (Editor) 2016. Bat Surveys for Professional Ecologists - Good Practice Guidelines, 3rd edition. The Bat
Conservation Trust, London. Coraman, E., A. Furman, A. Karatas, and R. Bilgin. 2013. Phylogeographic analysis of Anatolian bats highlights
the importance of the region for preserving the Chiropteran mitochondrial genetic diversity in the Western Palaearctic. Conservation Genetics 14:1205-1216.
Crawley, M. J. 2012. The R book. John Wiley & Sons. Cryan, P. M., and R. M. Barclay. 2009. Causes of bat fatalities at wind turbines: hypotheses and predictions.
Journal of Mammalogy 90:1330-1340. Cryan, P. M., P. M. Gorresen, C. D. Hein, M. R. Schirmacher, R. H. Diehl, M. M. Huso, D. T. Hayman, P. D.
Fricker, F. J. Bonaccorso, and D. H. Johnson. 2014. Behavior of bats at wind turbines. Proceedings of the National Academy of Sciences 111:15126-15131.
Cryan, P. M., J. W. Jameson, E. F. Baerwald, C. K. Willis, R. M. Barclay, E. A. Snider, and E. G. Crichton. 2012. Evidence of late-summer mating readiness and early sexual maturation in migratory tree-roosting bats found dead at wind turbines. PLoS One 7:e47586.
Directive, H. 1992. Council Directive 92/43/EEC of 21 May 1992 on the conservation of natural habitats and of wild fauna and flora. Brussels, Belgium.
Dool, S. E., S. J. Puechmaille, C. Dietz, J. Juste, C. Ibanez, P. Hulva, S. G. Roue, E. J. Petit, G. Jones, D. Russo, R. Toffoli, A. Viglino, A. Martinoli, S. J. Rossiter, and E. C. Teeling. 2013. Phylogeography and postglacial recolonization of Europe by Rhinolophus hipposideros: evidence from multiple genetic markers. Molecular Ecology 22:4055-4070.
Erickson, W., K. Kronner, and B. Gritski. 2004. Stateline Wind Project wildlife monitoring final report: July 2001–December 2003. Final Report. Oregon.
ESRI. ArcMap. ESRI, USA. EUROBATS. 2014a. Report of the Intersessional Working Group on Wind Turbines and Bat Populations.
Doc.EUROBATS.StC9-AC19.12. Heraklion, Greece, 7-10th April 2014. Eurobats. 2014b. Resolution 7.5 Wind Turbines and Bat Populations. Brussels, Belgium. European Wind Energy Association. 2013. Ten biggest wind farms in Europe.

FINAL REPORT
100
European Wind Energy Association. 2015. Wind in Power. 2014 European Statistics. European Wind Energy Association, and 2014. 2014 Wind in Power. 2013 European Statistics. Fenton, M., S. Jacobson, and R. Stone. 1973. An automatic ultrasonic sensing system for monitoring the
activity of some bats. Canadian Journal of Zoology 51:291-299. Floud, R., R. W. Fogel, B. Harris, and S. C. Hong. 2011. The Changing Body. Health, Nutrition, and Human
Development in the Western World since 1700. Cambridge University Press, Cambridge. Fooks, A. R., L. M. McElhinney, D. J. Pounder, C. J. Finnegan, K. Mansfield, N. Johnson, S. M. Brookes, G.
Parsons, K. White, P. G. McIntyre, and D. Nathwani. 2003. Case report: Isolation of a European bat lyssavirus type 2a from a fatal human case of rabies encephalitis. Journal of Medical Virology 71:281-289.
Frick, W. F., J. F. Pollock, A. C. Hicks, K. E. Langwig, D. S. Reynolds, G. G. Turner, C. M. Butchkoski, and T. H. Kunz. 2010. An emerging disease causes regional population collapse of a common North American bat species. Science 329:679-682.
Garcia-Mudarra, J. L., C. Ibanez, and J. Juste. 2009. The Straits of Gibraltar: barrier or bridge to Ibero-Moroccan bat diversity? Biological Journal of the Linnean Society 96:434-450.
Gilbert, M. T. P., L. Menez, R. C. Janaway, D. J. Tobin, A. Cooper, and A. S. Wilson. 2006. Resistance of degraded hair shafts to contaminant DNA. Forensic Science International 156:208-212.
Griffin, D. R. 1971. The importance of atmospheric attenuation for the echolocation of bats (Chiroptera). Animal Behaviour 19:55-61.
Hall, T. A. 1999. BioEdit: a user-friendly biological sequence alignment editor and analysis program for Windows 95/98/NT. Nucleic Acids Symposium Series 41:95-98.
Hamilton, P. B., and C. R. Tyler. 2008. Identification of microsatellite loci for parentage analysis in roach Rutilus rutilus and 8 other cyprinid fish by cross-species amplification, and a novel test for detecting hybrids between roach and other cyprinids. Molecular Ecology Resources 8:462-465
Harris, S., P. Morris, S. Wray, and D. Yalden. 1995. A review of British mammals: population estimates and conservation status of British. JNCC, Peterborough.
Hayes, J. P. 1997. Temporal variation in activity of bats and the design of echolocation-monitoring studies. Journal of Mammalogy:514-524.
Hayes, J. P., and J. C. Gruver. 2000. Vertical stratification of bat activity in an old-growth forest in western Washington.
Hayes, M. A. 2013. Bats killed in large numbers at United States wind energy facilities. BioScience 63:975-979. Hedenström, A., and J. Rydell. 2013. Effect of wind turbine mortality on bat populations in Sweden:
predictions from a simple population model. CWE 2013, Stockholm. Hein, C., J. Gruver, and E. Arnett. 2013. Relating pre-construction bat activity and post-construction bat
fatality to predict risk at wind energy facilities: a synthesis. A report submitted to the National Renewable Energy Laboratory. Bat Conservation International, Austin, TX, USA.
Hulva, P., P. Benda, V. Hanak, A. Evin, and I. Horacek. 2007. New mitochondrial lineages within the Pipistrellus pipistrellus complex from Mediterranean Europe. Folia Zoologica 56:378-388.
Hundt. 2012. Bat Surveys: Good Practice Guidelines, 2nd edition, Bat Conservation Trust. Huso, M. M. 2011. An estimator of wildlife fatality from observed carcasses. Environmetrics 22:318-329. Huso, M. M., and D. Dalthorp. 2014. A Comment on “Bats Killed in Large Numbers at United States Wind
Energy Facilities”. BioScience 64:546-547. Huso, M. M., D. H. Dalthorp, D. A. Dail, and L. J. Madsen. 2014. Estimating wind-turbine caused bird and bat
fatality when zero carcasses are observed. Ecological Applications. Huso, M. M., D. H. Dalthorp, D. A. Dail, and L. J. Madsen. in press. Estimating wind-turbine caused bird and bat
fatality when zero carcasses are observed. Ecological Applications. Ibanez, C., J. L. Garcia-Mudarra, M. Ruedi, B. Stadelmann, and J. Juste. 2006. The Iberian contribution to
cryptic diversity in European bats. Acta Chiropterologica 8:277-297. IUCN. 2008. Conservation International, Arizona State University, Texas A&M University, University of Rome,
University of Virginia, Zoological Society London. . An Analysis of Mammals on the 2008 IUCN Red List <www.iucnredlist.org/mammals>. Downloaded on 9 October 2008.
Jameson, J. W., and C. K. Willis. 2014. Activity of tree bats at anthropogenic tall structures: Implications for mortality of bats at wind turbines. Animal Behaviour 97:145-152.

FINAL REPORT
101
Johnson, G. D., W. P. Erickson, M. Dale Strickland, M. F. Shepherd, D. A. Shepherd, and S. A. Sarappo. 2003. Mortality of bats at a large-scale wind power development at Buffalo Ridge, Minnesota. The American Midland Naturalist 150:332-342.
Jones, G., R. Cooper-Bohannon, K. Barlow, and K. Parsons. 2009. Scoping and method development report: determining the potential ecological impact of wind turbines on bat populations in Britain.
Juste, J., C. Ibanez, J. Munoz, D. Trujillo, P. Benda, A. Karatas, and M. Ruedi. 2004. Mitochondrial phylogeography of the long-eared bats (Plecotus) in the Mediterranean Palaearctic and Atlantic Islands. Molecular Phylogenetics and Evolution 31:1114-1126.
Kalcounis, M., K. Hobson, R. Brigham, and K. Hecker. 1999. Bat activity in the boreal forest: importance of stand type and vertical strata. Journal of Mammalogy:673-682.
Kanuch, P., P. Hajkova, Z. Rehak, and J. Bryja. 2007. A rapid PCR-based test for species identification of two cryptic bats Pipistrellus pipistrellus and P. pygmaeus and its application on museum and dropping samples. Acta Chiropterologica 9:277-282.
Kawai, K., M. Nikaido, M. Harada, S. Matsumura, L. K. Lin, Y. Wu, M. Hasegawa, and N. Okada. 2004. The status of the Japanese and East Asian bats of the genus Myotis (Vespertilionidae) based on mitochondrial sequences (vol 28, pg 297, 2003). Molecular Phylogenetics and Evolution 30:259-259.
Kerth, G., B. Petrov, A. Conti, D. Anastasov, M. Weishaar, S. Gazaryan, J. Jaquiery, B. Koenig, N. Perrin, and N. Bruyndonckx. 2008. Communally breeding Bechstein's bats have a stable social system that is independent from the postglacial history and location of the populations. Molecular Ecology 17:2368-2381.
Kiefer, A., F. Mayer, J. Kosuch, O. von Helversen, and A. Veith. 2002. Conflicting molecular phylogenies of European long-eared bats (Plecotus) can be explained by cryptic diversity. Molecular Phylogenetics and Evolution 25:557-566.
Korner-Nievergelt, F., O. Behr, R. Brinkmann, M. A. Etterson, M. M. Huso, D. Dalthorp, P. Korner-Nievergelt, T. Roth, and I. Niermann. 2015. Mortality estimation from carcass searches using the R-package carcass-a tutorial. Wildlife Biology 21:30-43.
Korner-Nievergelt, F., R. Brinkmann, I. Niermann, and O. Behr. 2013. Estimating bat and bird mortality occurring at wind energy turbines from covariates and carcass searches using mixture models. PLoS One 8:e67997.
Korner-Nievergelt, F., P. Korner-Nievergelt, O. Behr, I. Niermann, R. Brinkmann, and B. Hellriegel. 2011. A new method to determine bird and bat fatality at wind energy turbines from carcass searches. Wildlife Biology 17:350-363.
Korstian, J. M., A. M. Hale, V. J. Bennett, and D. A. Williams. 2013. Advances in sex determination in bats and its utility in wind-wildlife studies. Molecular Ecology Resources 13:776-780.
Kunz, T. H., E. B. Arnett, W. P. Erickson, A. R. Hoar, G. D. Johnson, R. P. Larkin, M. D. Strickland, R. W. Thresher, and M. D. Tuttle. 2007. Ecological impacts of wind energy development on bats; questions, research needs, and hypotheses. Frontiers in Ecology and the Environment 5:315-324.
Lagrange, H., P. Rico, Y. Bas, A.-L. Ughetto, F. Melki, and C. Kerbiriou. 2013. Mitigating bat fatalities from wind-power plants through targeted curtailment:results from 4 years of testing of CHIROTECH©. CWE, Stockholm, Sweden.
Lehnert, L. S., S. Kramer-Schadt, S. Schönborn, O. Lindecke, I. Niermann, and C. C. Voigt. 2014. Wind Farm Facilities in Germany Kill Noctule Bats from Near and Far. PLoS One 9:e103106.
Li, G., G. Jones, S. J. Rossiter, S.-F. Chen, S. Parsons, and S. Zhang. 2006. Phylogenetics of small horseshoe bats from east Asia based on mitochondrial DNA sequence variation. Journal of Mammalogy 87:1234-1240.
Lumio, J., M. Hillbom, R. Roine, L. Ketonen, M. Haltia, M. Valle, E. Neuvonen, and J. Lahdevirta. 1986. Human rabies of bat origin in Europe. Lancet 1:378-378.
Lundy, M., I. Montgomery, and J. Russ. 2010. Climate change-linked range expansion of Nathusius’ pipistrelle bat, Pipistrellus nathusii (Keyserling & Blasius, 1839). Journal of Biogeography 37:2232-2242.
Mathews, F., M. Swindells, R. Goodhead, T. A. August, P. Hardman, D. M. Linton, and D. J. Hosken. 2013. Effectiveness of search dogs compared with human observers in locating bat carcasses at wind-turbine sites: A blinded randomized trial. Wildlife Society Bulletin 37:34-40.
Mayer, F., C. Dietz, and A. Kiefer. 2007. Molecular species identification boosts bat diversity. Frontiers in zoology 4:4-4.
FINAL REPORT
102
Mayer, F., and O. von Helversen. 2001a. Cryptic diversity in European bats. Proceedings of the Royal Society B-Biological Sciences 268:1825-1832.
Mayer, F., and O. Von Helversen. 2001b. Sympatric distribution of two cryptic bat species across Europe. Biological Journal of the Linnean Society 74:365-374.
Medinas, D., J. T. Marques, and A. Mira. 2013. Assessing road effects on bats: the role of landscape, road features, and bat activity on road-kills. Ecological Research 28:227-237.
Menzel, J. M., M. A. Menzel, j. C. Kilgo, W. M. Ford, J. W. Edwards, and G. F. McCracken. 2005. Effect of habitat foraging height on bat activity in the coastal plain of South Carolina. Journal of Wildlife Management 69:235-245.
Minderman, J., C. J. Pendlebury, J. W. Pearce-Higgins, and K. J. Park. 2012. Experimental evidence for the effect of small wind turbine proximity and operation on bird and bat activity. PLoS One 7:e41177.
Mollgaard, S. 1985. Bat-rabies in Denmark. . Rabies Bulletin Europe 4:11-13. Morton, D., C. Rowland, C. Wood, L. Meek, C. Marston, G. Smith, R. Wadsworth, and I. Simpson. 2011. Final
Report for LCM2007-the new UK land cover map. Countryside Survey Technical Report No 11/07. Moussy, C., D. J. Hosken, F. Mathews, G. C. Smith, J. N. Aegerter, and S. Bearhop. 2013. Migration and
dispersal patterns of bats and their influence on genetic structure. Mammal Review 43:183-195. Müller, J., R. Brandl, J. Buchner, H. Pretzsch, S. Seifert, C. Strätz, M. Veith, and B. Fenton. 2013. From ground
to above canopy—Bat activity in mature forests is driven by vegetation density and height. Forest Ecology and Management 306:179-184.
Nakagawa, S., and H. Schielzeth. 2013. A general and simple method for obtaining R2 from generalized linear mixed-effects models. Methods in Ecology and Evolution 4:133-142.
Natural England. 2009. Natural England Technical Information Note TIN051. Bats and onshore wind turbines. Natural England. 2012. Natural England Technical Information Note TIN051. Bats and onshore wind turbines. Natural England. 2014. Natural England Technical Information Note TIN051. Bats and onshore wind turbines. Nicholls, B., and P. A. Racey. 2009. The aversive effect of electromagnetic radiation on foraging bats—a
possible means of discouraging bats from approaching wind turbines. PLoS One 4:e6246. Niermann, I., O. Behr, and R. Brinkmann. 2007. Bat fatalities at wind energy facilities in Germany. Bat
Research News 48:273. Paula, J. J., R. M. Bispo, A. H. Leite, P. G. Pereira, H. M. Costa, C. M. Fonseca, M. R. Mascarenhas, and J. L.
Bernardino. 2015. Camera-trapping as a methodology to assess the persistence of wildlife carcasses resulting from collisions with human-made structures. Wildlife Research 41:717-725.
Puechmaille, S. J., G. Wibbelt, V. Korn, H. Fuller, F. Forget, K. Muehldorfer, A. Kurth, W. Bogdanowicz, C. Borel, T. Bosch, T. Cherezy, M. Drebet, T. Goerfoel, A.-J. Haarsma, F. Herhaus, G. Hallart, M. Hammer, C. Jungmann, Y. Le Bris, L. Lutsar, M. Masing, B. Mulkens, K. Passior, M. Starrach, A. Wojtaszewski, U. Zoephel, and E. C. Teeling. 2011. Pan-European distribution of white-nose syndrome fungus (Geomyces destructans) not associated with mass mortality. PLoS ONE 6.
R Development Core Team. 2013. R: A language and environment for statistical computing. R Foundation for Statistical Computing, Vienna.
Rodrigues, L., L. Bach, M. Dubourg-Savage, J. Goodwin, and C. Harbusch. 2008. Guidelines for consideration of bats in wind farm projects. Page 51. UNEP/EUROBATS Secretariat, Bonn, Germany.
Rollins, K. E., D. K. Meyerholz, G. D. Johnson, A. P. Capparella, and S. S. Loew. 2012. A forensic investigation into the etiology of bat mortality at a wind farm: barotrauma or traumatic injury? Veterinary Pathology Online 49:362-371.
Russ, J. 1999. The bats of Britain and Ireland. Echolocation calls, sound analysis and species identification. Powys: Alana Books.
Russ, J. 2012. British Bat Calls: A Guide to Species Identifitication. Pelagic Publishing, Exeter, UK. Russ, J., M. Briffa, and W. Montgomery. 2003. Seasonal patterns in activity and habitat use by bats
(Pipistrellus spp. and Nyctalus leisleri) in Northern Ireland, determined using a driven transect. Journal of Zoology 259:289-299.
Russ, J., A. Hutson, W. Montgomery, P. Racey, and J. Speakman. 2001. The status of Nathusius' pipistrelle (Pipistrellus nathusii Keyserling & Blasius, 1839) in the British Isles. Journal of Zoology 254:91-100.
Rydell, Bach, Dubourg-Savage, Green, Rodrigues, and Hedenstrom. 2010a. Mortality of bats at wind turbines links to nocturnal insect migration? European Journal of Wildlife Research.

FINAL REPORT
103
Rydell, J., L. Bach, M. Dubourg-Savage, M. Green, L. Rodrigues, and A. Hendenström. 2010b. Bat mortality at wind turbines in northwestern Europe. Acta Chiroptirologica 12:261-274.
Rydell, J., L. Bach, M. J. Dubourg-Savage, M. Green, L. Rodrigues, and A. Hedenström. 2010c. Bat mortality at wind turbines in northwestern Europe. Acta Chiropterologica 12:261-274.
Salgueiro, P., M. Ruedi, M. M. Coelho, and J. M. Palmeirim. 2007. Genetic divergence and phylogeography in the genus Nyctalus (Mammalia, Chiroptera): implications for population history of the insular bat Nyctalus azoreum. Genetica 130:169-181.
Santos, H., L. Rodrigues, G. Jones, and H. Rebelo. 2013. Using species distribution modelling to predict bat fatality risk at wind farms. Biological Conservation 157:178-186.
Schatz, J., A. R. Fooks, L. McElhinney, D. Horton, J. Echevarria, S. Vazquez-Moron, E. A. Kooi, T. B. Rasmussen, T. Mueller, and C. M. Freuling. 2013. Bat Rabies Surveillance in Europe. Zoonoses and Public Health 60:22-34.
Schorcht, W., F. Bontadina, and M. Schaub. 2009. Variation of adult survival drives population dynamics in a migrating forest bat. Journal of Animal Ecology 78:1182-1190.
Skaug, H., D. Fournier, A. Nielsen, A. Magnusson, and B. Bolker. 2012. glmmADMB: Generalized linear mixed models using AD Model Builder. Vienna.
Spitzenberger, F., E. Haring, and N. Tvrtkovic. 2002. Plecotus microdontus (Mammalia, Vespertilionidae), a new bat species from Austria. Natura Croatica 11:1-18.
Spitzenberger, F., J. Pialek, and E. Haring. 2001. Systematics of the genus Plecotus (Mammalia, Vespertilionidae) in Austria based on morphometric and molecular investigations. Folia Zoologica 50:161-172.
Stadelmann, B., L. G. Herrera, J. Arroyo-Cabrales, J. J. Flores-Martinez, B. P. May, and M. Ruedi. 2004. Molecular systematics of the fishing bat Myotis (Pizonyx) vivesi. Journal of Mammalogy 85:133-139.
Thompson, J. D., T. J. Gibson, F. Plewniak, F. Jeanmougin, and D. G. Higgins. 1997. The CLUSTAL_X windows interface: flexible strategies for multiple sequence alignment aided by quality analysis tools. Nucleic Acids Research 25:4876-4882.
Truett, G. E., P. Heeger, R. L. Mynatt, A. A. Truett, J. A. Walker, and M. L. Warman. 2000. Preparation of PCR-quality mouse genomic DNA with hot sodium hydroxide and tris (HotSHOT). Biotechniques 29:52, 54.
Voigt, C. C., A. G. Popa-Lisseanu, I. Niermann, and S. Kramer-Schadt. 2012. The catchment area of wind farms for European bats: A plea for international regulations. Biological Conservation 153:80-86.
Wibbelt, G., A. Kurth, D. Hellmann, M. Weishaar, A. Barlow, M. Veith, J. Prueger, T. Goerfoel, L. Grosche, F. Bontadina, U. Zoephel, H.-P. Seidl, P. M. Cryan, and D. S. Blehert. 2010. White-nose syndrome fungus (Geomyces destructans) in Bats, Europe. Emerging Infectious Diseases 16:1237-1243.
Wilkinson, G. S., F. Mayer, G. Kerth, and B. Petri. 1997. Evolution of Repeated Sequence Arrays in the D-Loop Region of Bat Mitochondrial DNA. Genetics 146:1035-1048.
Zuur, A., E. N. Ieno, N. Walker, A. A. Saveliev, and G. M. Smith. 2009. Mixed effects models and extensions in ecology with R. Springer.

FINAL REPORT
104
SECTION 5: PRIORITIES FOR FUTURE RESEARCH
In approximate order of urgency:
1. Assessment of the risk to bats from turbines key-holed into woodland, or placed very close to woodland.
2. Quantification of the risk to bats from turbines in coastal and offshore environments. 3. Assessment of the risk to rare bats from turbines placed in the vicinity of known roosts or swarming
sites. 4. Assessment of the risk to bats from single or double turbine installations, particularly in areas of high
habitat suitability for bats. 5. Investigation of the predictive value of preconstruction surveys in identifying sites of high collision risk
for bats. 6. Construction of a central repository for data (acoustic monitoring and carcass surveys) collected in
future monitoring of wind turbines. It is critical that these surveys are conducted using standardised methodologies. The repository will allow data synthesis and facilitate the future investigation of risk factors for collision and seasonality of collision risk.
7. Assessment of the effectiveness of curtailment as a means of minimising the risk to bats in the UK, including site-specific identification of cut-off speeds; and review the applicability of automated curtailment systems used elsewhere in the world for use in the UK.
8. Quantification of local and national bat population sizes in order to permit a sensible assessment of the likely impact on local populations.
9. Assessment of the cumulative impacts of turbines and other development pressures on local populations.
10. Characterisation of behavioural characteristics of noctule bats likely to place them in conflict with turbines (including identification of home range size).

FINAL REPORT
105
APPENDIX 1. Bat range and distribution maps for the UK.
Maps for 1) bat species that were found during carcass searches at wind turbines, and 2) rare species that are unlikely to have been detected in this study. Range maps (left) indicate the geographical limits, whereas distribution maps (right) show locations where species has been recorded. Maps from Joint Nature Conservation Committee 2013. Third Report by the UK under Article 17 on the implementation of the Habitats Directive from January 2007 to December 2012. Peterborough: JNCC. www.jncc.gov.uk/article17
1a) Pipistrellus pipistrellus – Common pipistrelle (JNCC species code: S1309)
1b) Pipistrellus pygmaeus – Soprano pipistrelle (JNCC species code: S5009)

FINAL REPORT
106
1c) Pipistrellus nathusii – Nathusius’ pipistrelle (JNCC species code: S1317)
1d) Nyctalus noctula – Noctule (JNCC species code: S1312)

FINAL REPORT
107
1e) Plecotus auritus – Brown long eared bat (JNCC species code: S1326)
1f) Myotis nattereri – Natterer’s bat (JNCC species code: S1322)

FINAL REPORT
108
2a) Rhinolophus ferrumequinum – Greater horseshoe bat (JNCC species code: S1304)
2b) Rhinolophus hipposideros – Lesser horseshoe bat (JNCC species code: S1303)
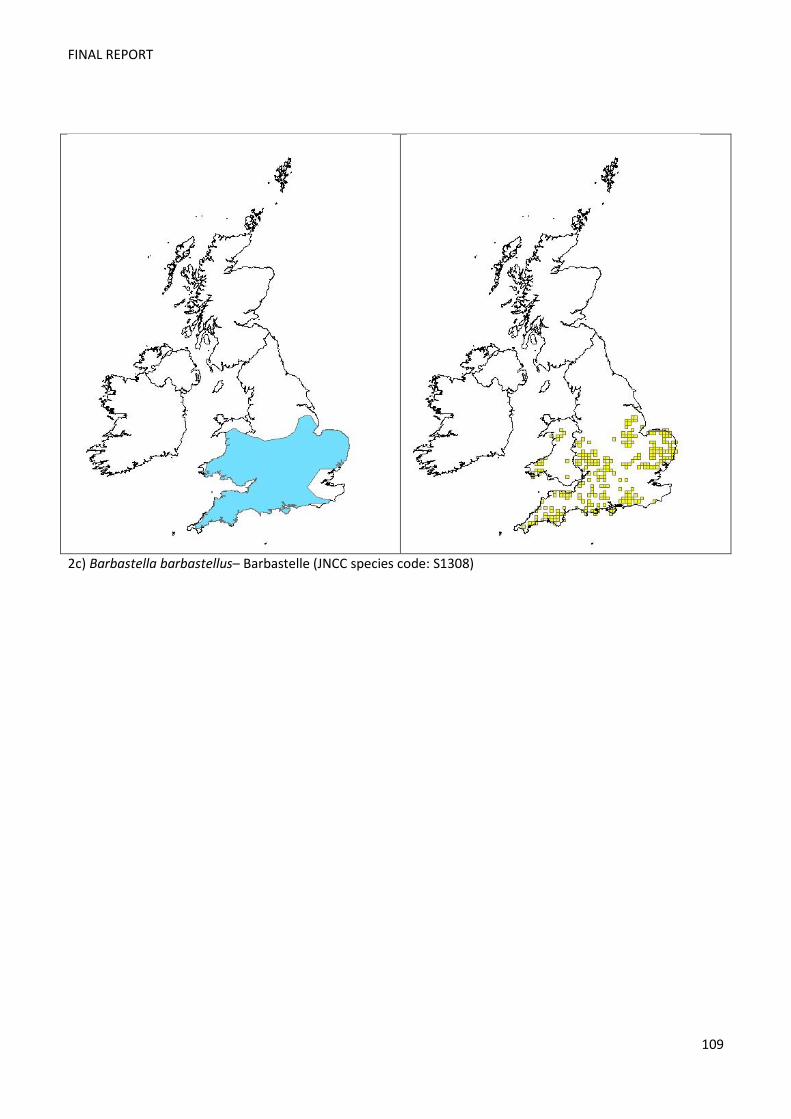
FINAL REPORT
109
2c) Barbastella barbastellus– Barbastelle (JNCC species code: S1308)

FINAL REPORT
110
2d) Eptesicus serotinus– Serotine (JNCC species code: S1327)

FINAL REPORT
111
APPENDIX 2: Bat activity recorded on transect routes at sites surveyed in 2013.
Site ID Distance from turbine (m)
Total Passes
Count of 10m points
Proportion with bats
2 50 2 974 0.002 2 100 0 504 0.000 2 150 0 363 0.000 2 200 0 158 0.000 5 50 37 741 0.050 5 100 4 775 0.005 5 150 6 568 0.011 5 200 9 598 0.015 8 50 10 314 0.032 8 100 0 136 0.000 8 150 17 254 0.067 8 200 10 361 0.028 9 50 13 1068 0.012 9 100 3 1041 0.003 9 150 5 756 0.007 9 200 19 808 0.024
11 50 10 854 0.012 11 100 9 822 0.011 11 150 4 824 0.005 11 200 15 400 0.038 14 50 1 753 0.001 14 100 45 994 0.045 14 150 35 533 0.066 14 200 29 271 0.107 16 50 43 1131 0.038 16 100 13 711 0.018 16 150 22 627 0.035 16 200 3 294 0.010 20 50 10 546 0.018 20 100 24 862 0.028 20 150 63 1448 0.044 20 200 49 1214 0.040 21 50 8 544 0.015 21 100 38 364 0.104 21 150 11 521 0.021 21 200 1 652 0.002 26 50 4 454 0.009 26 100 21 410 0.051 26 150 37 323 0.115 26 200 31 239 0.130 30 50 8 385 0.021 30 100 12 216 0.056 30 150 48 169 0.284 30 200 58 175 0.331 31 50 10 42 0.238 31 100 8 37 0.216 31 150 14 82 0.171 31 200 11 100 0.110 35 50 8 1417 0.006

FINAL REPORT
112
35 100 7 710 0.010 35 150 16 654 0.024 35 200 7 646 0.011 37 50 0 1010 0.000 37 100 1 667 0.001 37 150 3 665 0.005 37 200 2 639 0.003 38 50 5 920 0.005 38 100 9 364 0.025 38 150 11 294 0.037 38 200 3 376 0.008 39 50 2 184 0.011 39 100 12 443 0.027 39 150 24 471 0.051 39 200 22 570 0.039 40 50 3 1022 0.003 40 100 5 679 0.007 40 150 12 365 0.033 40 200 3 150 0.020 42 50 7 988 0.007 42 100 10 763 0.013 42 150 5 538 0.009 42 200 15 393 0.038 46 50 6 238 0.025 46 100 22 518 0.042 46 150 15 772 0.019 46 200 50 773 0.065

FINAL REPORT
113
APPENDIX 3: Proportion of sites correctly categorised as low, medium or high activity, based on tertiles of sites, using the maximum nightly pass rate across 3 detectors. All nights and only sites where a species was detected at a site were included.
Ground Height Soprano pipistrelle
Noctule

FINAL REPORT
114
APPENDIX 4: Effectiveness of Search Dogs Compared With Human Observers in Locating Bat Carcasses at Wind-Turbine Sites: A Blinded Randomized Trial (see attached pdf for full text)
Wildlife Society Bulletin 37(1):34-40, 2013; DOI 10.1002/wsb.256

FINAL REPORT
115
APPENDIX 5: A rapid PCR based test for identification of fifteen species of British bats
Hamilton, P.B., Uren Webster. T.M., Basiewicz, M., Kennedy, E., De-Bastos E.S.R.,
Mathews, F.
University of Exeter, Biosciences, College of Life and Environmental Sciences, Exeter, UK
Abstract
The development of a rapid method for identification of fifteen species of British bat is described. These are:
Barbastella barbastellus, Eptesicus serotinus, Myotis bechsteinii, Myotis daubentonii, Myotis mystacinus,
Myotis nattereri, Nyctalus leisleri, Nyctalus noctula, Plecotus auritus, Pipistrellus nathusii, Pipistrellus
pipistrellus, Pipistrellus pygmaeus, Plecotus austriacus, Rhinolophus ferrumequinum and Rhinolophus
hipposideros. A multiplex of 5 fluorescently-tagged primers and 15 species-specific primers designed to
regions of mitochondrial control region, cytochrome b and NADH dehydrogenase produces clear peaks when
visualised on a DNA sequencer. The multiplex also includes primers to test for DNA quality and primers
specific for the Y-chromosome as a test for sex. This method will aid high throughput species identification of
British bats, and will particularly aid work involving partial or decomposing specimens, such as casualties from
vehicle or wind turbine collision, or those submitted for rabies screening.
Keywords: Chiroptera, control region, cytochrome b, mtDNA, Cryptic species, Myotis,

FINAL REPORT
116
Introduction
Bats are given strict legal protection across Europe and efforts are being made to reverse their historical
population declines. Nevertheless, they face numerous anthropogenic challenges, ranging from habitat loss to
direct mortality from vehicle and wind turbine collisions and domestic cat predation. Infectious disease poses
additional threats: in North America, White Nose Syndrome (WNS) has decimated populations (Frick et al.
2010). The causal pathogen for WNS has also been isolated in a number of European species, though to date
without any records of mass mortality (Wibbelt et al. 2010, Puechmaille et al. 2011). Human health may also
be endangered by infectious agents of bats such as the lyssaviruses (rabies) (Lumio et al. 1986, Fooks et al.
2003, Mollgaard 1985)). Whether initiated by a concern for public health or for bat conservation, accurate
species identification of specimens is crucial if research and management are to be meaningful: bats are a
diverse group, and this is reflected in their ecology and epidemiology. For example, sympatric Myotis species
have marked differences in their social structures (August et al. subm.) and prevalence of lyssaviruses (Schatz
et al. 2013); and while Nathusius’s pipistrelle (Pipistrellus nathusii) is known to be a long-distance migrant,
common and soprano pipistrelles (P. pipistrellus and P. pygmaeus) are sedentary (Moussy et al. 2013).
Species identification is usually based on morphological characteristics. However, there are a number of
similar and cryptic species, particularly in the genera Pipistrellus and Myotis, and identification frequently
depends on simultaneous assessment of a range of characteristics, none of which is individually diagnostic.
In addition, when samples are degraded or incomplete (for example dead specimens submitted for disease
screening), morphological identification is not always possible. Therefore it has become commonplace to use
genetic identification methods to complement morphological identification. One approach is to sequence
regions of mitochondrial DNA followed by BLAST analysis or phylogenetic analysis of the sequence (Barratt et
al. 1997, Mayer et al. 2007). However this can be time consuming when sample numbers are high. Another
approach is to use the polymerase chain reaction (PCR) with species-specific primers; a technique that has
been used, for example for differentiating Myotis mystacinus, M. brandtii and M. alcathoe based on the NADH
dehydrogenase (ND1) gene (Boston et al. 2011), and Pipistrellus pipistrellus and P. pygmaeus based on the
cytochrome b gene (Kanuch et al. 2007).

FINAL REPORT
117
Our aim was to design a rapid PCR-based test to distinguish between all common species of British bats. To
do this we designed and tested a range of species-specific primers for the mitochondrial control region, and
also included primers previously designed for species of Myotis and Pipistrellus (Kanuch et al. 2007, Boston et
al. 2011).
Methods
DNA extraction
Genomic DNA was extracted from the wing tissue of 64 bats belonging to 15 different British species. The
number of individuals sampled for each species, and their geographical origins are given in Table 1. The
HotSHOT method (Truett et al. 2000) was used, but was modified by the addition of an initial digestion step
with 10 µl 20 mg/ml proteinase K at 56 °C for 1 hour in the lysis buffer.
Control region sequencing
Primers were designed for PCR amplification mitochondrial control region from an alignment of complete
mitochondrial genomes from five diverse bat species (Artibeus jamaicensis, accession no. AF061340;
Pipistrellus abramus, AB061528; Plecotus auritus, HM164052; Mystacina tuberculata, AY960981; Rhinolophus
formosae, EU166918). All alignments in this study were made using Clustal W (Thompson et al. 1997) in
BioEdit, version 7.2.3 (Hall 1999). The control region of several species was amplified and sequenced
(Beckman Genomics UK) in both directions using various combinations of the forward primers CR3f,
CYRCCHTCARCACCCAAAGCTG; CR9f, GGTCTTGTAAACCRRMRAAGGG and reverse primers CR2r,
ATGGGCTGATTAGTCATKAAYCCATCG; CR3r, ATGYSKCGGCATGGGCTGATTAGTC and CR9r,
CCTGAAGHAAGAACCAGATGYCGTTTAC. The PCR conditions for the reaction consisted of 10 µl multiplex Type-
it Microsatellite PCR Kit (Qiagen) with 0.15 µM of each primers and 1 µl DNA, made up with water to give a
total volume of 20 µl per reaction. PCR was conducted using a ‘Touchdown’ protocol with a successively
reducing annealing temperature, consisting of 5 mins at 95 °C followed by 35 cycles of 30s at 95 °C, 30s at the
annealing temperature (5 cycles each at 62, 58, 55, 53, 51, 49 °C) and 1 min at 72 °C, then 1 min at 72 °C and
35 mins at 60 °C (modified from Hamilton and Tyler 2008). Products from five independent reactions were

FINAL REPORT
118
pooled for sequencing. Consensus sequences for each species were assembled from electropherogram
alignments using DNABASER (http://www.dnabaser.com/home.html). Accession numbers for new sequences
obtained in this study are Plecotus auritus (KJ150736), Myotis bechsteinii (KJ150730), Myotis nattereri
(KJ150733), Nyctalus noctula (KJ150734) and Rhinolophus hipposideros (KJ150732).
Species-specific primer design
Alignments of DNA sequences obtained in this study and those from other published studies obtained from
National Center for Biotechnology Information (NCBI) (see Table 2) were used to design a suite of species
specific primers (Table 3). Other species-specific primers used in this study have been published previously
(Kanuch et al. 2007, Boston et al. 2011) or were modified from them (Table 3). For each species, the PCR
product(s) were produced using one specific primer and another fluorescently labelled primer, which in some
cases was common to several species. To determine the exact size of the PCR product, PCR products were run
on a DNA sequencer (CEQ 8000 Genetic Analysis System, Beckman Coulter) and fragment sizes were
determined using CEQ 8000 Genetic Analysis System, Version 9.0 (Beckman Coulter). We aimed for PCR
products to be less than 400bp, to aid identification in cases where DNA is degraded.
Species-specific primers were designed from DNA sequence alignments to regions that are conserved within
the species, but differ from closely related species. Sequences from up to five individuals (if available) from
each species were included, originating from different geographic locations and representing different
haplotypes (see Table 2). Primer specificity was confirmed by Blastn. Primers for M. bechsteinii, M. nattereri,
N. noctula, P. auritus, P. austriacus, and R. ferrumequinum were designed from control region alignments. For
the control region, each species-specific primer produced two products with two fluorescently labelled
universal reverse primers (CR2r, CR9r) resulting in two distinct (green and black in Figure 1) fragments
differing in size by approximately 75 bp. The exception was R. hipposideros for which a single primer pair was
used.
For Pipistrellus species, the published species-specific primers for amplification of the cytb gene in P.
pipistrellus and P. pygmaeus (Kanuch et al. 2007) were used. A new specific primer for P. nathusii and a new

FINAL REPORT
119
universal primer were designed to reduce the sizes of the amplification products. The remaining primers were
designed to the ND1 region, using a combination of published primers (Boston et al. 2011) and primers
designed in this study. PCR conditions were as described above except 10µl reaction volumes were used with
0.15 µM (0.015 µl) of each species-specific primer, 1.2 µM (0.12 µl) of the Zfx primers, 1.8 µM (0.18 µl) of the
Zfy primers. The multiplex was then tested with multiple individuals for each species that had been visually
identified (see Table 1). To test for the presence of PCR-amplifiable bat DNA, primers for amplification of a
zinc finger gene present on the X chromosome (Zfx) was used by (Bryja and Konecny 2003), were also
included in the multiplex mix.
Primers for identification of sex (Korstian et al. 2013) were incorporated within multiplex, designed to amplify
the Zfy gene present on the Y chromosome (details on species) . The presence/absence of Y chromosome-
related fragments was analysed for 8 known male and female individuals. The Y chromosome test was also
conducted, using the PCR conditions specified by (Korstian et al. 2013), and analysed using agarose gel
electrophoresis.
Results
Species identification
Our new test was able to identify all 15 species of British bat we aimed to identify (Tables 1 and 3). All
species-specific primer sets produced peaks which were unique to each species in the range of 129-382 bp.
Examples of pictures are shown in Figure 1 and size ranges are provided in Table 3. The primer pair for Zfx
gave a band peak at 234-235 bp for all species, serving as a positive control for amplifiable DNA.
Sex identification
The primers for identification of sex (Korstian et al. 2013) gave bands of the expected size when included
within the multiplex, but also introduced a blue peak at 167 bp. There was a good correlation between the
strength of bands visualised on the gel and the peak intensity of sequence fragments obtained from the

FINAL REPORT
120
multiplex mix for 50 individuals of undetermined sex for a range of species. However, small sequence
fragments were present in the size range expected for the Y chromosome test in females as well as males.
Small peaks also occurred in water controls so are likely a PCR artefact, but contamination of the tissue
samples can also not be ruled out. Therefore while some individuals were clearly identified some males due to
the intensity of the peak there were also cases where it was difficult to clearly identify sex. The bleaching
protocol prior to DNA extraction of may aid removal of surface contamination (Gilbert et al. 2006), but also
new primers outside the range of the background peaks would also be required for unequivocal sex
determination.

FINAL REPORT
121
Discussion
This method will provide a fast and accurate method for identification of British bats including cryptic species
and some that are difficult to differentiate morphologically. It will be particularly useful with dead specimens,
which are commonly difficult to identify at post-mortem, either because the preservation method obscures
key features, or because the carcasses are incomplete or degraded. As the PCR products are relatively small,
the method has potential for identification of droppings, and was able to identified 3 Myotis nattereri using
DNA isolated from faeces, but will need to be tested using a wider range of species. The test does not include
primers for M. brandtii and M. alcathoe. However species specific ND1 primers have been designed
previously for these species (Boston et al. 2011) and these are potentially compatible with this multiplex as
they are predicted to give peaks within the detectable range that do not overlap with the other species.
There is also potential to expand the method to include to all European species. The primer sets could also be
used individually using standard PCR and agarose gel electrophoresis.
Table 1. Details of the origin of individual bats used in this study to test the sensitivity and specificity of primers for each species.
Species Common name No. verified (matching visual id)
Origin
Barbastella barbastellus Barbastelle 1 Devon
Eptesicus serotinus Serotine 4 Wiltshire, Devon, Cornwall
Myotis bechsteinii Bechstein’s 4 Devon
Myotis daubentonii Daubenton’s 3 Devon
Myotis mystacinus Whiskered 2 Devon
Myotis nattereri Natterer’s 4 Devon
Nyctalus leisleri Leisler’s 1 Bristol
Nyctalus noctula Noctule 5 Devon, Cornwall
Plecotus auritus Brown long eared 2 Devon
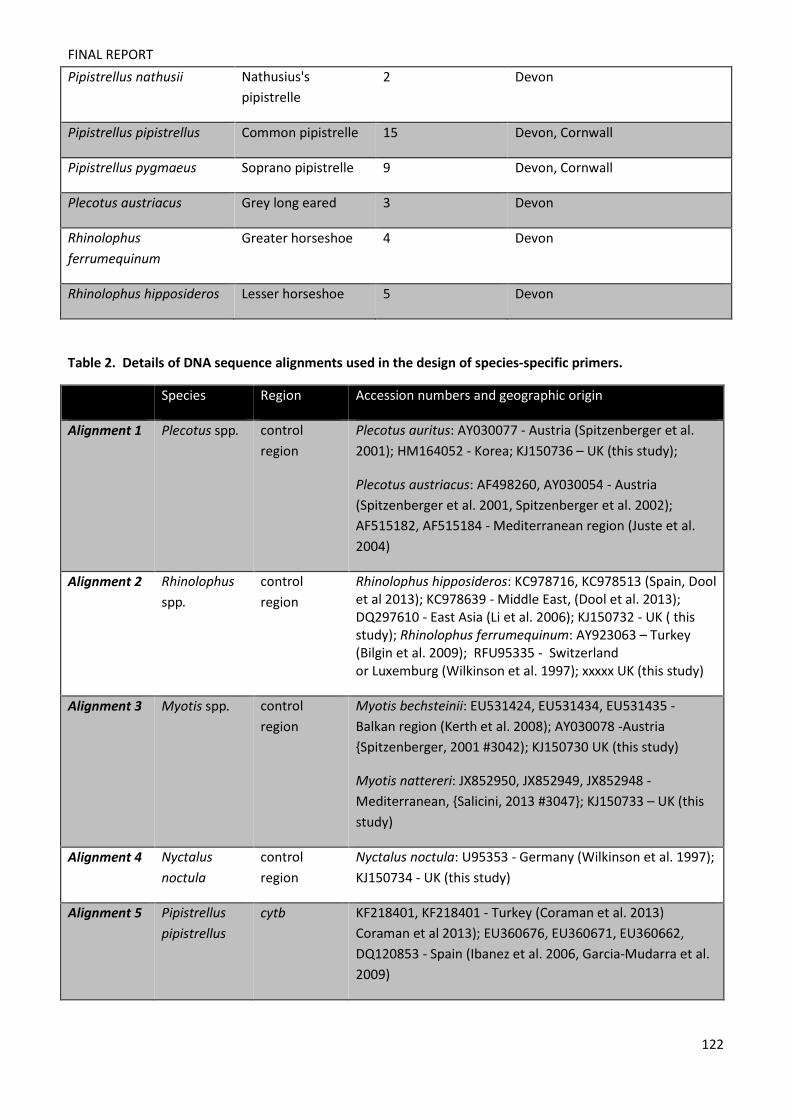
FINAL REPORT
122
Pipistrellus nathusii Nathusius's pipistrelle
2 Devon
Pipistrellus pipistrellus Common pipistrelle 15 Devon, Cornwall
Pipistrellus pygmaeus Soprano pipistrelle 9 Devon, Cornwall
Plecotus austriacus Grey long eared 3 Devon
Rhinolophus ferrumequinum
Greater horseshoe 4 Devon
Rhinolophus hipposideros Lesser horseshoe 5 Devon
Table 2. Details of DNA sequence alignments used in the design of species-specific primers.
Species Region Accession numbers and geographic origin
Alignment 1 Plecotus spp. control region
Plecotus auritus: AY030077 - Austria (Spitzenberger et al. 2001); HM164052 - Korea; KJ150736 – UK (this study);
Plecotus austriacus: AF498260, AY030054 - Austria (Spitzenberger et al. 2001, Spitzenberger et al. 2002); AF515182, AF515184 - Mediterranean region (Juste et al. 2004)
Alignment 2 Rhinolophus spp.
control region
Rhinolophus hipposideros: KC978716, KC978513 (Spain, Dool et al 2013); KC978639 - Middle East, (Dool et al. 2013); DQ297610 - East Asia (Li et al. 2006); KJ150732 - UK ( this study); Rhinolophus ferrumequinum: AY923063 – Turkey (Bilgin et al. 2009); RFU95335 - Switzerland or Luxemburg (Wilkinson et al. 1997); xxxxx UK (this study)
Alignment 3 Myotis spp. control region
Myotis bechsteinii: EU531424, EU531434, EU531435 - Balkan region (Kerth et al. 2008); AY030078 -Austria {Spitzenberger, 2001 #3042); KJ150730 UK (this study)
Myotis nattereri: JX852950, JX852949, JX852948 -Mediterranean, {Salicini, 2013 #3047}; KJ150733 – UK (this study)
Alignment 4 Nyctalus noctula
control region
Nyctalus noctula: U95353 - Germany (Wilkinson et al. 1997); KJ150734 - UK (this study)
Alignment 5 Pipistrellus pipistrellus
cytb KF218401, KF218401 - Turkey (Coraman et al. 2013) Coraman et al 2013); EU360676, EU360671, EU360662, DQ120853 - Spain (Ibanez et al. 2006, Garcia-Mudarra et al. 2009)

FINAL REPORT
123
“ Pipistrellus pygmaeus
cytb JX566938, JX566929 - Portugal (Medinas et al. 2013); EU084884 - Cyprus (Hulva et al. 2007); EU084882 - Iran (Hulva et al. 2007)
“ Pipistrellus nathusii
cytb EU084883 - Cyprus (Hulva et al. 2007); DQ120850, DQ120849 - Spain (Ibanez et al. 2006); U95510, U95509 - UK (Barratt et al. 1997); AJ504446 - Switzerland (Stadelmann et al. 2004)
Alignment 6 Barbastella barbastellus
ND1 KF218432, KF218431 - Turkey (Coraman et al. 2013); DQ915032 - Greece (Mayer et al. 2007); DQ915031 - Hungary (Mayer et al. 2007)
“ Myotis mystacinus
ND1 AF401376 - Germany (Kiefer et al. 2002)), AB106583 - Japan (Kawai et al. 2004); KF218482 - Turkey, (Coraman et al. 2013); JX645318, JX645316 - Poland (Bogdanowicz et al. 2012))
“ Myotis daubentonii
ND1 KF218481 - Turkey (Coraman et al. 2013); HQ657356, HQ657354, HQ657328 - UK; AF401452 - Germany (Mayer et al. 2007)
“ Nyctalus leisleri
ND1 DQ915046 - Spain, (Mayer et al. 2007), KF218487 - Turkey (Coraman et al. 2013); DQ915013, DQ915012 - Greece, (Mayer et al. 2007); DQ887582 - Switzerland (Salgueiro et al. 2007))
“ Eptesicus serotinus
ND1 DQ887580 - Morocco, (Salgueiro et al. 2007); KF218441 - Turkey (Coraman et al. 2013); DQ915024 - Greece, (Mayer et al. 2007); AF401472 - Germany, (Mayer and Von Helversen 2001b, a); EU786984 - Spain (Juste et al. 2004)

FINAL REPORT
124
Table 3. Primers used in this study
Species Common name
Region amplified
Forward primers (primer code)
Reverse primers (primer code)
Product size 2
Reverse primer
Product size 1
Plecotus auritus
Brown long eared
Mt. control region
TAGATCTAAGAATTCAGCT
†D2CCTGAAGHAAGAACCAGATGYCGTTTAC (CR9r)
129-132
†D3ATGGGCTGATTAGTCATKAAYCCATCG (CR2r)
204-207
Myotis bechsteinii
Bechstein’s Mt. control region
CGACCAATGGAAATCCCATGATCTA
“ 138-141
“ 213-216ǁ
Myotis nattereri
Natterer’s Mt. control region
TAAGTCAAACAATATCCAGTCAAC
“ 176-179ǂ
“ 251-254ǂ
Nyctalus noctula
Noctule Mt. control region
CATAATACATCTAATGCGTA
“ 213-216
“ 289-292
Plecotus austriacus
Grey long eared
Mt. control region
TGGAATGTTTATATTACATAGT
“ 225-228
“ 299-302
Rhinolophus ferrumequinum
Greater horseshoe
Mt. control region
GAATCAAGAAATTACATAAGAC
“ 305-308
“ 380-382
Rhinolophus hipposideros
Lesser horseshoe
Mt. control region
†D4: GGTCTTGTAAACCR
RMRAAGGG
(CR9f)
ATTACATAGGGGCGGAGGGTTG
173-186*
Pipistrellus pipistrellus
Common pipistrelle
Mt. CytB TCGAGATGTGAATTACGGATG1 (Ppip-
F2)
†D3CRGCRAATAGTARRATAACYCC
156-158#
Pipistrellus nathusii
Nathusius's pipistrelle
Mt. CytB TCCTCGCTATACATTATACATC
“ 214-218
Pipistrellus pygmaeus
Soprano pipistrelle
Mt. CytB CTGTCTAGGGCTGCAAAT1 (Ppyg-F)
“ 250-253
Myotis daubentonii
Daubenton’s Mt. ND1 ACGCTTTAATTGGGGCCCTACG
†D2GTWGAGATRAATCATATTAT
189-190
Eptesicus Serotine Mt. ND1 CGCCATTATATGAT “ 225-

FINAL REPORT
125
† universal fluorescent primer colours as follows: D2=black, D3= green, D4=blue; * multiple peaks in this range of size fragments; ǂ minor peaks often present at b143 and g 218; # minor peaks sometimes present at b214 and g290; ǁ green peak not always present 1 (Kanuch et al. 2007), 2 (Boston et al. 2011). 3 (Bryja and Konecny 2003). The published species specific ND1 primers (Boston et al. 2011) are predicted to give peaks with the labelled reverse primer, but were not tested in this study: M. brandtii (ND1Bra02_F: ACGAAGTAACCCTGGCCATC) predicted size = 143 bp and and M. alcathoe (ND1Alc01f, GCCCTAACCTTGGCTCTCAT and ND1Alc06_f: AGCCGTATACGCTATCTTATGGTC ) predicted sizes = 336 and 234 bp respectively. The other primer from this study for M.mystacinus is included and the predicted size of 335 bp and therefore matches the sequencer-determined size.
serotinus CAGGATGAGCC 228
Nyctalus leisleri
Leisler’s Mt. ND1 GAATTTAAGTGTTTTGTTTATA
“ 273-275
Barbastella barbastellus
Barbastelle Mt. ND1 CGCACCCACTGGTAAACATAA
“ 293-295
Myotis mystacinus
Whiskered Mt. ND1 CCCTAACYCTAGCCCTAACAA2
(ND1Mys04_f)
“ 332-336
All species (positive control) Zfx gene †D4AGTCAAGGGRTGTCCATCR3
GTTTGYASACCAGGTTCCTC
234-235
All species (sex test) Zfy gene GGTRAGDGCACAYRAGTTCCACA
†D3TGCYATTACAAAACCTTTRTAGA
TAC
85-90*

FINAL REPORT
126
Figure Legends
Figure 1. Example electropherograms from each species of bat used in this study. Small red peaks are size standard. Numbers above peaks are sizes (bp). Letters above peaks indicate the gene primer set giving rise to the peak. X = peak given by primers for a region to the X chromosome, that serves as a positive control for PCR-amplifiable DNA.

FINAL REPORT
127


![BENZO[ ]PRYRENE (BaP) - Defra, UKrandd.defra.gov.uk/Document.aspx?Document=10310_TGS_BaP... · hplc 45 Table 1: Summary of sampling and analytical strategies for BaP data sets explored](https://img.dokumen.tips/doc/110x75/60ca05fb3710b966442c3ba8/benzo-pryrene-bap-defra-hplc-45-table-1-summary-of-sampling-and-analytical.jpg)