Embed Size (px)
Citation preview

AERIAL SURVEYS OFWATERBIRDS IN STRATEGICWIND FARM AREAS:
2005/06 Final Report
SEPTEMBER 2007

This project was completed in association withthe following contributors (in alphabetical order):-
• Barrow Offshore Wind Ltd• Centrica Renewable Energy Limited,• Countryside Council for Wales• Department for Business Enterprise and Regulatory Reform• Department for Environment, Food and Rural Affairs• DONG Walney (UK) Limited• Dudgeon Offshore Wind Ltd• E.On UK Renewables Ltd• Greater Gabbard Offshore Winds Limited• Gunfleet Sands Ltd, Kentish Flats Limited• Joint Nature Conservation Committee• Kentish Flats Limited• Natural England• Npower Renewables Limited• Ormonde Energy Limited• Scira Offshore Energy Limited• Scottish Power plc• SeaScape Energy Limited• Thanet Offshore Wind Limited.• Wildfowl & Wetlands Trust• WWT Consulting

Aerial Surveys of Waterbirdsin Strategic Wind Farm Areas:
2005/06 Final Report

2 Aerial Surveys of Waterbirds in Strategic Wind Farm Areas: 2005/06 Final Report
The “Aerial Surveys of Waterbirds in Strategic Wind Farm Areas: 2005/06 FinalReport” has been produced by the Department for Business Enterprise &Regulatory Reform (BERR). We are indebted to WWT Consulting who did anexcellent job in undertaking the aerial surveys and prepared this report. Expertadvice on when and where to undertake surveys was received from thesteering group, chaired by Mark Tasker and comprising of representatives fromJoint Nature Conservation Committee (JNCC), Natural England (NE),Countryside Council for Wales (CCW) and Department for Environment, Foodand Rural Affairs (DEFRA). The preparation of this report has been coordinatedby a Steering Group, comprising Wildfowl & Wetlands Trust (WWT)Consulting; Hartley Anderson, Philip Bloor (BERR project manager) and AngelaWratten (BERR). Additionally, we would like to thank those that helped fundthe project, including BERR, Barrow Offshore Wind Ltd, Centrica RenewableEnergy Limited, CCW, DEFRA, DONG Walney (UK) Limited, Dudgeon OffshoreWind Ltd, E.On UK Renewables Ltd, Greater Gabbard Offshore Winds Limited,Gunfleet Sands Ltd, Kentish Flats Limited, Npower Renewables Limited,Ormonde Energy Limited, Scira Offshore Energy Limited, Scottish Power plc,SeaScape Energy Limited and Thanet Offshore Wind Limited.
Acknowledgements

Aerial Surveys of Waterbirds in Strategic Wind Farm Areas: 2005/06 Final Report 3
1. Introduction......................................................................................................15
2. Methods.............................................................................................................16Aerial survey........................................................................................................16Survey area..........................................................................................................19Coverage ..............................................................................................................20Analysis and map production ............................................................................22Analytical methods for population assessment ...............................................22
3. Results................................................................................................................23Overall numbers and distribution......................................................................23Common scoter ...................................................................................................25Divers....................................................................................................................26Little gull...............................................................................................................28Eider......................................................................................................................29Manx shearwater.................................................................................................30Gannet ..................................................................................................................30Cormorant and shag ...........................................................................................31Gulls......................................................................................................................31Kittiwake...............................................................................................................33Terns .....................................................................................................................34Auks ......................................................................................................................35
4. Discussion .........................................................................................................37Overall summary.................................................................................................37Common scoter ...................................................................................................38Red-throated diver...............................................................................................40Little gull...............................................................................................................42Other species .......................................................................................................43Changes between years......................................................................................45
5. References.........................................................................................................48
Figures................................................................................................................51Tables................................................................................................................146Erratum to the 2004/05 final report ......................................................177
Contents

4 Aerial Surveys of Waterbirds in Strategic Wind Farm Areas: 2005/06 Final Report
Figure i – Distance bands used for aerial survey (not to scale)...........................17
Figure ii – Survey blocks .........................................................................................20
Figure 1 - Observations of birds in the North West OWFStrategic Area during aerial surveys, winter 2005/06...........................................52
Figure 2 - Observations of birds in the North West OWFStrategic Area during aerial surveys, summer 2006 ............................................53
Figure 3 - Observations of birds in the Greater Wash OWFStrategic Area during aerial surveys, winter 2005/06 ..........................................54
Figure 4 - Observations of birds in the Greater Wash OWFStrategic Area during aerial surveys, summer 2006 ...........................................55
Figure 5 - Observations of birds in the Thames OWFStrategic Area during aerial surveys, winter 2005/06 ..........................................56
Figure 6 - Observations of birds in the Thames OWFStrategic Area during aerial surveys, summer 2006 ...........................................57
Figure 7 - Relative density of birds recorded in North WestOWF Strategic Area during aerial surveys, winter 2005/06 ................................58
Figure 8 - Relative density of birds recorded in North WestOWF Strategic Area during aerial surveys, summer 2006 ..................................59
Figure 9 - Relative density of birds recorded in Greater WashOWF Strategic Area during aerial surveys, winter 2005/06 ................................60
Figure 10 - Relative density of birds recorded in Greater WashOWF Strategic Area during aerial surveys, summer 2006 ..................................61
Figure 11 - Relative density of birds recorded in Thames OWFStrategic Area during aerial surveys, winter 2005/06 ..........................................62
Figures

Aerial Surveys of Waterbirds in Strategic Wind Farm Areas: 2005/06 Final Report 5
Figure 12 - Relative density of birds recorded in Thames OWFStrategic Area during aerial surveys, summer 2006 ...........................................63
Figure 13 - Relative density of common scoters Melanitta nigrarecorded in North West OWF Strategic Area during aerial surveys,Period 1.....................................................................................................................64
Figure 14 - Relative density of common scoters Melanitta nigrarecorded in North West OWF Strategic Area during aerial surveys,Period 2 ....................................................................................................................65
Figure 15 - Relative density of common scoters Melanitta nigrarecorded in North West OWF Strategic Area during aerial surveys,Period 3 ....................................................................................................................66
Figure 16 - Relative density of common scoters Melanitta nigrarecorded in North West OWF Strategic Area during aerial surveys,Period 4 ....................................................................................................................67
Figure 17 - Relative density of common scoters Melanitta nigrarecorded in North West OWF Strategic Area during aerial surveys,Period 6 ....................................................................................................................68
Figure 18 - Relative density of common scoters Melanitta nigrarecorded in North West OWF Strategic Area during aerial surveys,Period 7 ....................................................................................................................69
Figure 19 - Relative density of common scoters Melanitta nigrarecorded in Greater Wash OWF Strategic Area during aerial surveys,Period 1 ....................................................................................................................70
Figure 20 - Relative density of common scoters Melanitta nigrarecorded in Greater Wash OWF Strategic Area during aerial surveys,Period 2 ....................................................................................................................71
Figure 21 - Relative density of common scoters Melanitta nigrarecorded in Greater Wash OWF Strategic Area during aerial surveys,Period 3 ....................................................................................................................72
Figure 22 - Relative density of common scoters Melanitta nigrarecorded in Greater Wash OWF Strategic Area during aerial surveys,Period 4 ....................................................................................................................73
Figure 23 - Relative density of common scoters Melanitta nigrarecorded in Thames OWF Strategic Area during aerial surveys,winter 2005/06 .........................................................................................................74

6 Aerial Surveys of Waterbirds in Strategic Wind Farm Areas: 2005/06 Final Report
Figure 24 - Relative density of divers Gavia spp. recorded inNorth West OWF Strategic Area during aerial surveys,Period 1 ....................................................................................................................75
Figure 25 - Relative density of divers Gavia spp. recorded inNorth West OWF Strategic Area during aerial surveys,Period 2 ....................................................................................................................76
Figure 26 - Relative density of divers Gavia spp. recorded inNorth West OWF Strategic Area during aerial surveys,Period 3 ....................................................................................................................77
Figure 27 - Relative density of divers Gavia spp. recorded inNorth West OWF Strategic Area during aerial surveys,Period 4 ....................................................................................................................78
Figure 28 - Relative density of divers Gavia spp. recordedin Greater Wash OWF Strategic Area during aerial surveys,Period 1 ....................................................................................................................79
Figure 29 - Relative density of divers Gavia spp. recordedin Greater Wash OWF Strategic Area during aerial surveys,Period 2 ....................................................................................................................80
Figure 30 - Relative density of divers Gavia spp. recordedin Greater Wash OWF Strategic Area during aerial surveys,Period 3 ....................................................................................................................81
Figure 31 - Relative density of divers Gavia spp. recordedin Greater Wash OWF Strategic Area during aerial surveys,Period 4 ....................................................................................................................82
Figure 32 - Relative density of divers Gavia spp. recordedin Thames OWF Strategic Area during aerial surveys,Period 1 ....................................................................................................................83
Figure 33 - Relative density of divers Gavia spp. recordedin Thames OWF Strategic Area during aerial surveys,Period 2 ....................................................................................................................84
Figure 34 - Relative density of divers Gavia spp. recordedin Thames OWF Strategic Area during aerial surveys,Period 3 ....................................................................................................................85
Figure 35 - Relative density of divers Gavia spp. recordedin Thames OWF Strategic Area during aerial surveys,Period 4 ....................................................................................................................86

Aerial Surveys of Waterbirds in Strategic Wind Farm Areas: 2005/06 Final Report 7
Figure 36 - Relative density of little gulls Larus minutusrecorded in North West OWF Strategic Area during aerial surveys,winter 2005/06 .........................................................................................................87
Figure 37 - Relative density of little gulls Larus minutusrecorded in Greater Wash OWF Strategic Area during aerialsurveys, winter 2005/06...........................................................................................88
Figure 38 - Relative density of eiders Somateria mollissimarecorded in Greater Wash OWF Strategic Area during aerialsurveys, winter 2005/06 ..........................................................................................89
Figure 39 - Relative density of eiders Somateria mollissimarecorded in North West OWF Strategic Area during aerialsurveys, winter 2005/06 ..........................................................................................90
Figure 40 - Relative density of Manx shearwaters Puffinuspuffinus recorded in North West OWF Strategic Area duringaerial surveys, summer 2006 .................................................................................91
Figure 41 - Relative density of gannets Morus bassanusrecorded in Thames OWF Strategic Area during aerial surveys,winter 2005/06 .........................................................................................................92
Figure 42 - Relative density of gannets Morus bassanusrecorded in North West OWF Strategic Area during aerialsurveys, summer 2006 ...........................................................................................93
Figure 43 - Relative density of cormorants Phalacrocorax spp.recorded in North West OWF Strategic Area during aerialsurveys, winter 2005/06 ..........................................................................................94
Figure 44 - Relative density of cormorants Phalacrocorax spp.recorded in North West OWF Strategic Area during aerial surveys,summer 2006 ...........................................................................................................95
Figure 45 - Relative density of gulls Larus spp. recorded inNorth West OWF Strategic Area during aerial surveys,Period 1 ....................................................................................................................96
Figure 46 - Relative density of gulls Larus spp. recorded inNorth West OWF Strategic Area during aerial surveys,Period 2 ....................................................................................................................97
Figure 47 - Relative density of gulls Larus spp. recorded inNorth West OWF Strategic Area during aerial surveys,Period 3 ....................................................................................................................98

8 Aerial Surveys of Waterbirds in Strategic Wind Farm Areas: 2005/06 Final Report
Figure 48 - Relative density of gulls Larus spp. recordedin North West OWF Strategic Area during aerial surveys,Period 4 ....................................................................................................................99
Figure 49 - Relative density of gulls Larus spp. recordedin North West OWF Strategic Area during aerial surveys,Period 5 ..................................................................................................................100
Figure 50 - Relative density of gulls Larus spp. recordedin North West OWF Strategic Area during aerial surveys,Period 6 ..................................................................................................................101
Figure 51 - Relative density of gulls Larus spp. recordedin North West OWF Strategic Area during aerial surveys,Period 7 ..................................................................................................................102
Figure 52 - Relative density of gulls Larus spp. recordedin Greater Wash OWF Strategic Area during aerial surveys,Period 1 ..................................................................................................................103
Figure 53 - Relative density of gulls Larus spp. recordedin Greater Wash OWF Strategic Area during aerial surveys,Period 2 ..................................................................................................................104
Figure 54 - Relative density of gulls Larus spp. recordedin Greater Wash OWF Strategic Area during aerial surveys,Period 3 ..................................................................................................................105
Figure 55 - Relative density of gulls Larus spp. recordedin Greater Wash OWF Strategic Area during aerial surveys,Period 4 ..................................................................................................................106
Figure 56 - Relative density of gulls Larus spp. recordedin Greater Wash OWF Strategic Area during aerial surveys,Period 5 ..................................................................................................................107
Figure 57 - Relative density of gulls Larus spp. recordedin Greater Wash OWF Strategic Area during aerial surveys,Period 6 ..................................................................................................................108
Figure 58 - Relative density of gulls Larus spp. recordedin Greater Wash OWF Strategic Area during aerial surveys,Period 7 ..................................................................................................................109
Figure 59 - Relative density of gulls Larus spp. recordedin Thames OWF Strategic Area during aerial surveys,Period 1 ..................................................................................................................110
Aerial Surveys of Waterbirds in Strategic Wind Farm Areas: 2005/06 Final Report 9
Figure 60 - Relative density of gulls Larus spp. recordedin Thames OWF Strategic Area during aerial surveys,Period 2 ..................................................................................................................111
Figure 61 - Relative density of gulls Larus spp. recordedin Thames OWF Strategic Area during aerial surveys,Period 3 ..................................................................................................................112
Figure 62 - Relative density of gulls Larus spp. recordedin Thames OWF Strategic Area during aerial surveys,Period 4 ..................................................................................................................113
Figure 63 - Relative density of gulls Larus spp. recordedin Thames OWF Strategic Area during aerial surveys,Period 5 ..................................................................................................................114
Figure 64 - Relative density of gulls Larus spp. recordedin Thames OWF Strategic Area during aerial surveys,Period 6 ..................................................................................................................115
Figure 65 - Relative density of gulls Larus spp. recordedin Thames OWF Strategic Area during aerial surveys,Period 7 ..................................................................................................................116
Figure 66 - Relative density of kittiwakes Rissa tridactylarecorded in North West OWF Strategic Area during aerialsurveys, winter 2005/06 ........................................................................................117
Figure 67 - Relative density of kittiwakes Rissa tridactylarecorded in North West OWF Strategic Area during aerialsurveys, summer 2006 .........................................................................................118
Figure 68 - Relative density of kittiwakes Rissa tridactylarecorded in Greater Wash OWF Strategic Area during aerialsurveys, winter 2005/06 .......................................................................................119
Figure 69 - Relative density of kittiwakes Rissa tridactylarecorded in Greater Wash OWF Strategic Area during aerialsurveys, summer 2006 .........................................................................................120
Figure 70 - Relative density of Kittiwakes Rissa tridactylarecorded in Thames OWF Strategic Area during aerialsurveys, winter 2005/06 ........................................................................................121
Figure 71 - Relative density of kittiwakes Rissa tridactylarecorded in Thames OWF Strategic Area during aerial surveys,summer 2006 .........................................................................................................122

10 Aerial Surveys of Waterbirds in Strategic Wind Farm Areas: 2005/06 Final Report
Figure 72 - Relative density of terns Sterna spp. recordedin Greater Wash OWF Strategic Area during aerial surveys,summer 2005 ........................................................................................................123
Figure 73 - Relative density of terns Sterna spp. recordedin North West OWF Strategic Area during aerial surveys,summer 2006 .........................................................................................................124
Figure 74 - Relative density of terns Sterna spp recordedin Thames OWF Strategic Area during aerial surveys,summer 2006 .........................................................................................................125
Figure 75 - Relative density of auks Uria/Alca/Fratercula spp.recorded in North West OWF Strategic Area during aerialsurveys, Period 1 ...................................................................................................126
Figure 76 - Relative density of auks Uria/Alca/Fratercula spp.recorded in North West OWF Strategic Area during aerialsurveys, Period 2 ...................................................................................................127
Figure 77 - Relative density of auks Uria/Alca/Fratercula spp.recorded in North West OWF Strategic Area during aerialsurveys, Period 3 ...................................................................................................128
Figure 78 - Relative density of auks Uria/Alca/Fratercula spp.recorded in North West OWF Strategic Area during aerialsurveys, Period 4 ...................................................................................................129
Figure 79 - Relative density of auks Uria/Alca/Fratercula spp.recorded in North West OWF Strategic Area during aerialsurveys, Period 5 ...................................................................................................130
Figure 80 - Relative density of auks Uria/Alca/Fratercula spp.recorded in North West OWF Strategic Area during aerialsurveys, Period 6 ...................................................................................................131
Figure 81 - Relative density of auks Uria/Alca/Fratercula spp.recorded in North West OWF Strategic Area during aerialsurveys, Period 7 ...................................................................................................132
Figure 82 - Relative density of auks Uria/Alca/Fratercula spp.recorded in Greater Wash OWF Strategic Area during aerialsurveys, Period 1 ...................................................................................................133
Figure 83 - Relative density of auks Uria/Alca/Fratercula spp.recorded in Greater Wash OWF Strategic Area during aerialsurveys, Period 2 ...................................................................................................134
Aerial Surveys of Waterbirds in Strategic Wind Farm Areas: 2005/06 Final Report 11
Figure 84 - Relative density of auks Uria/Alca/Fratercula spp.recorded in Greater Wash OWF Strategic Area during aerialsurveys, Period 3 ...................................................................................................135
Figure 85 - Relative density of auks Uria/Alca/Fratercula spp.recorded in Greater Wash OWF Strategic Area during aerialsurveys, Period 4 ...................................................................................................136
Figure 86 - Relative density of auks Uria/Alca/Fratercula spp.recorded in Greater Wash OWF Strategic Area during aerialsurveys, Period 5 ...................................................................................................137
Figure 87 - Relative density of auks Uria/Alca/Fratercula spp.recorded in Greater Wash OWF Strategic Area during aerialsurveys, Period 6 ...................................................................................................138
Figure 88 - Relative density of auks Uria/Alca/Fratercula spp.recorded in Greater Wash OWF Strategic Area during aerialsurveys, Period 7 ...................................................................................................139
Figure 89 - Relative density of auks Uria/Alca/Fratercula spp.recorded in Thames OWF Strategic Area during aerialsurveys, Period 1 ...................................................................................................140
Figure 90 - Relative density of auks Uria/Alca/Fratercula spp.recorded in Thames OWF Strategic Area during aerialsurveys, Period 2 ...................................................................................................141
Figure 91 - Relative density of auks Uria/Alca/Fratercula spp.recorded in Thames OWF Strategic Area during aerialsurveys, Period 3 ...................................................................................................142
Figure 92 - Relative density of auks Uria/Alca/Fratercula spp.recorded in Thames OWF Strategic Area during aerialsurveys, Period 4 ...................................................................................................143
Figure 93 - Relative density of auks Uria/Alca/Fratercula spp.recorded in Thames OWF Strategic Area during aerialsurveys, Period 5 ...................................................................................................144
Figure 94 - Relative density of auks Uria/Alca/Fratercula spp.recorded in Thames OWF Strategic Area during aerialsurveys, Period 7 ...................................................................................................145

Table 1 - Survey periods used for aerial surveys in 2005/06 ............................147
Table 2 - Dates of survey flights in the North WestStrategic Area, Periods 1-7 ..................................................................................147
Table 3 - Dates of survey flights in the Greater WashStrategic Area, Periods 1-7 ..................................................................................148
Table 4 – Dates of survey flights in the Thames StrategicArea, Periods 1-7 ...................................................................................................148
Table 5 - Totals numbers of all species in the North WestStrategic Area, Periods 1-7 ..................................................................................149
Table 6 - Total number of all species in the Greater WashStrategic Area, Periods 1-7 ..................................................................................150
Table 7 - Total numbers of all species in the ThamesStrategic Area, Periods 1-7 ..................................................................................151
Table 8 - Numbers of common scoter recorded inPeriods 1-7 (“-” indicates no coverage) ..............................................................152
Table 9 - Estimates of common scoter numbers(with 95% bootstrap confidence intervals) for each periodoff the East coast and West coast .......................................................................153
Table 10 - Numbers of divers recorded in Periods 1-7(“-” indicates no coverage) ..................................................................................154
Table 11 - Estimates of diver numbers (with 95% bootstrapconfidence intervals) for each period off the East coast andWest coast .............................................................................................................155
Table 12 - Number of little gulls recorded in Periods 1-7(“-” indicates no coverage) ..................................................................................156
Tables
12 Aerial Surveys of Waterbirds in Strategic Wind Farm Areas: 2005/06 Final Report

Aerial Surveys of Waterbirds in Strategic Wind Farm Areas: 2005/06 Final Report 13
Table 13 - Number of birds counted during aerialsurvey of the North West survey blocks, Period 1 ............................................157
Table 14 - Number of birds counted during aerialsurvey of the North West survey blocks, Period 2 ............................................158
Table 15 - Number of birds counted during aerialsurvey of the North West survey blocks, Period 3 ............................................159
Table 16 - Number of birds counted during aerialsurvey of the North West survey blocks, Period 4 ............................................160
Table 17 - Number of birds counted during aerialsurvey of the North West survey blocks, Period 5 ............................................161
Table 18 - Number of birds counted during aerialsurvey of the North West survey blocks, Period 6 ............................................162
Table 19 - Number of birds counted during aerialsurvey of the North West survey blocks, Period 7 ............................................163
Table 20 - Number of birds counted during aerialsurvey of the Greater Wash survey blocks, Period 1 ........................................164
Table 21 - Number of birds counted during aerialsurvey of the Greater Wash survey blocks, Period 2 ........................................165
Table 22 - Number of birds counted during aerialsurvey of the Greater Wash survey blocks, Period 3 ........................................166
Table 23 - Number of birds counted during aerialsurvey of the Greater Wash survey blocks, Period 4 ........................................167
Table 24 - Number of birds counted during aerialsurvey of the Greater Wash survey blocks, Period 5 ........................................168
Table 25 - Number of birds counted during aerialsurvey of the Greater Wash survey blocks, Period 6 ........................................169
Table 26 - Number of birds counted during aerialsurvey of the Greater Wash survey blocks, Period 7 ........................................170
Table 27 - Number of birds counted during aerialsurvey of the Thames survey blocks, Period 1 ..................................................171
Table 28 - Number of birds counted during aerialsurvey of the Thames survey blocks, Period 2 ..................................................172

Table 29 - Number of birds counted during aerialsurvey of the Thames survey blocks, Period 3 ..................................................173
Table 30 - Number of birds counted during aerialsurvey of the Thames survey blocks, Period 4 ..................................................174
Table 31 - Number of birds counted during aerialsurvey of the Thames survey blocks, Period 5 ..................................................175
Table 32 - Number of birds counted during aerialsurvey of the Thames survey blocks, Period 6 ..................................................176
Table 33 - Number of birds counted during aerialsurvey of the Thames survey blocks, Period 7 ..................................................176
14 Aerial Surveys of Waterbirds in Strategic Wind Farm Areas: 2005/06 Final Report
Aerial Surveys of Waterbirds in Strategic Wind Farm Areas: 2005/06 Final Report 15
1.1 Data on the numbers and distribution of waterbirds and seabirds in UKinshore waters are required for a variety of purposes, including StrategicEnvironmental Assessment for the second round of offshore wind farm(OWF) development, the Environmental Impact Assessments required byRound 2 wind farms, compliance with licence conditions for constructedRound 1 wind farms, for monitoring of waterbirds numbers anddistribution in inshore waters, and identification of Special ProtectionAreas (SPAs).
1.2 Only limited data on the abundance or distribution of birds are availablefor many nearshore waters in England and Wales (eg Cranswick et al 2003,Wetlands Advisory Service 2003, Cranswick et al 2004). Consequently, theDepartment of Trade and Industry, supported by other governmentdepartments, agencies and industry, commissioned large-scale survey ofstrategic areas identified for the second round of OWF development, plusadjoining areas identified as potentially important for birds.
1.3 A programme of aerial surveys has been undertaken by Wildfowl &Wetlands Trust (WWT) Consulting. The first comprehensive survey wasundertaken by WWT Consulting in 2004/05. A second season of surveyshas been conducted in winter 2005/06 through to summer 2006. This willprovide large-scale survey data covering the nearshore waters inNorthwest England (from Anglesey to the Solway Firth), in the GreaterWash and in the Thames (from Flamborough Head, Yorkshire, to SandwichBay, Kent). These data will inform the environmental impact assessmentsof OWFs and aid marine SPA identification (Johnstone et al 2002).
1.4 This report provides final results from aerial surveys undertaken betweenOctober 2005 and August 2006. Numbers of birds encountered areprovided, and estimates of total numbers calculated ‘distance analysis’are provided for the more numerous species of conservation importance.Maps are provided showing the large-scale distribution in each of thethree strategic wind farm areas. Brief comparisons are made with theresults of previous surveys.
Introduction

16 Aerial Surveys of Waterbirds in Strategic Wind Farm Areas: 2005/06 Final Report
Aerial survey
2.1 Aerial surveys used for this report were undertaken using a methodologydeveloped in Denmark by the National Environment Research Institute(NERI) (Kahlert et al 2000; see also Camphuysen et al 2004). This involveda ‘distance sampling’ approach (see Buckland et al 2001), whereby thedistance to each bird/flock of birds was recorded. Because birds furtherfrom the observer will be more difficult to detect, recording of distanceallows the number of missed birds to be estimated. This approach allowsstatistical analyses of the data (eg confidence limits to be calculated forestimates of numbers) that are not possible with data collected usingprevious aerial survey methods. Further, using a combination of the timeat which birds were encountered and the track flown by the plane(recorded using a Global Positioning System (GPS)), the locations ofobserved birds can be calculated with considerable accuracy (in mostcases, to within a few hundred metres).
2.2 Aerial surveys were undertaken by WWT Consulting using experiencedobservers who have undertaken aerial surveys previously for many ofthe OWF sites and to identify sites for potential classification as SPAs inthe UK in 2001/02, 2002/03, 2003/04 and 2004/05.
2.3 A number of Partenavia PN68 aircraft were used, flying at an altitude of76 m and at a speed of approximately 200 kmh-1. The location of theplane was recorded every five seconds using a GPS.
2.4 A series of transects spaced 2 km apart was designed to cover nearshorewaters. Ideal survey design is for transects to be orientated perpendicularto major environmental gradients (primarily sea depth). Transects that runnorth-south reduce the effect of glare during the survey and aid thedetectability and identification of birds. Any transects used in previouslarge-scale or regional surveys were retained to enable comparison of datawith previous results. Consequently, transects in areas covered for the firsttime during this project were created by extension of those already in usein Liverpool Bay, in the Thames and off the north Norfolk coast. North-south transects were used throughout the strategic areas and, for ease ofanalysis, followed northings of the GB Ordnance Survey grid.
Methods

Aerial Surveys of Waterbirds in Strategic Wind Farm Areas: 2005/06 Final Report 17
2.5 For each bird or flock of birds, the species, number, behaviour, distanceband and the time at which it was perpendicular to the flight path of theplane were recorded using a dictaphone. Using a clinometer, birds werelocated in one of four distance bands covering an area from 44 m to 1,000m either side of the plane (Figure i); birds beyond 1,000 m from the flightpath of the plane were not recorded. The survey method assumes that allbirds in distance Band A were detected, and effort was concentrated on thisband. Inevitably, birds further from the plane in other bands are missedowing to their distance from the plane and the need for the observers toconcentrate observation on the area of sea nearest the flight line.
Figure i – Distance bands used for aerial survey (not to scale)
2.6 Surveys were generally made during a four-hour period centred on middayGMT to minimise the effects of glare on counts. Surveys were undertakenin good weather conditions, generally with winds of 15 knots or less.
2.7 Survey was suspended during the turns between the end of one transectand the start of the next, though significant observations, eg cetaceansor large flocks of birds, were sometimes recorded on an ad hoc basis.
2.8 A cautionary approach was taken with regard to species identification,such that only those individuals that were observed clearly wereidentified to species level; otherwise, birds were identified as being in aspecies group. Many divers and gulls can be identified to species, butauks are very difficult to distinguish except using binoculars. Binocularsare not used during aerial surveys.
2.9 Scoters at large distances are not easily identifiable as common scoterMelanitta nigra, as they are virtually indistinguishable from velvet scoterMelanitta fusca at range, particularly within mixed flocks. The vastmajority of birds in Bands A and B can, however, be identified to species– and any velvet scoter in flight in band C would be readilydistinguished. As only very small numbers of velvet scoters wererecorded during aerial surveys in 2005/06, it has been assumed that thevast majority of scoters present were common scoters.
1000 m 426 m 282 m 163 m 44 m
76 m
4.5O
15O
10O
25O
60O
D C B A
1000m 426m
D C B A282m 44m
76m
4.5o 10o 15o 25o 60o
163m

18 Aerial Surveys of Waterbirds in Strategic Wind Farm Areas: 2005/06 Final Report
2.10 Divers (Gavia spp.) not identified to species level were recorded as ‘diverspp’. The vast majority of diver species recorded were considered to bered-throated divers Gavia stellata. Considerable caution is exercisedgiven the possibility of confusion with black-throated diver Gavia arcticaand the inexperience of the observers with observations of this speciesfrom the air; however, only very small numbers have been recorded onaerial survey, even among those birds close to the plane. Great northerndivers Gavia immer are readily separated from both red-throated andblack-throated divers and very few if any will have been overlookedwithin those birds recorded as ‘diver spp’.
2.11 Gulls not identified to species level were identified as being in one of thefollowing species groups: ‘grey gull’ (common gull Larus canus orherring gull Larus argentatus), ‘black-backed gull’ (lesser black-backedgull Larus fuscus or great black-backed gull Larus marinus), ‘large gull’(herring gull, lesser black-backed gull or great black-backed gull), ‘smallgull’ (black-headed gull Larus ridibundus, common gull, little gull Larusminutus or kittiwake Rissa tridactyla) or gull (Larus spp. or kittiwake).
2.12 Terns (Sterna spp) not identified to species level were recorded as ‘ternspp’. Common terns Sterna hirundo and Arctic terns Sterna paradisaea,are not easily separated from each other, and the majority ofobservations of these species are recorded as ‘commic tern’(common/Arctic). Little terns Sterna albifrons and Sandwich terns Sternasandvicensis are distinguishable from ‘commic terns’; although usuallyonly birds seen in Band A, and to a lesser extent Band B, are readilyidentifiable to species.
2.13 Auks are not readily identified to species level during aerial survey andmost observations are recorded as ‘auk spp’. The majority of auksencountered during the survey are believed to have been guillemots Uriaaalge and razorbills Alca torda. Whilst very few puffins Fratercula arcticaand no little auks Alle alle were specifically identified, a very smallproportion of observations were suspected to be of these species.
2.14 Cormorants Phalacrocorax carbo and shags Phalacrocorax aristotelis canbe difficult to distinguish from each other during aerial survey. Any birdsnot identified to species level were recorded as ‘cormorant spp’.
2.15 Other species groups were also used as appropriate, where specificidentification of birds to species level was not possible, eg ‘goose spp’,‘duck spp’, ‘wader spp’.

Aerial Surveys of Waterbirds in Strategic Wind Farm Areas: 2005/06 Final Report 19
Survey area
2.16 The survey area was divided into a series of survey blocks that could becovered by a single plane in one day. The survey area was designed tocover all Round 2 OWF sites being investigated, plus a buffer zone andany control areas, and to cover areas known or thought to be importantfor waterbirds and seabirds. The boundaries of the survey blocks wereplaced to avoid cutting any possible OWF footprints and any areasknown to be important for flocks of birds, particularly common scoter.
2.17 Five survey blocks were identified for the North West strategic area, sixfor the Greater Wash and seven for the Thames (Figure ii).
2.18 In 2005/06 the Thames survey area was extended to include twoadditional survey blocks (only five survey blocks (TH1-5) were identifiedfor the Thames in 2004/05); TH6, located off the east coast of Kent, andTH7, located approximately 30 km off the east coast of Norfolk.
2.19 Work in survey block GW7, located in the Wash, was undertaken as aseparate project for English Nature (WWT Wetlands Advisory Service2006). Data have also been included in this report in order to present amore comprehensive account of bird numbers and distribution in theGreater Wash.

20 Aerial Surveys of Waterbirds in Strategic Wind Farm Areas: 2005/06 Final Report
Figure ii – Survey Blocks
Coverage
2.20 The distribution of many waterbirds wintering in the UK changes duringthe course of the winter, for example, because many breed outside theUK and migrate here at different times of year, and because of changesin food resources or weather. Changes during summer months will relateparticularly to breeding and fledging of young. Seven survey periodswere identified to record changes in abundance and distribution duringthe course of the year (Table 1).
2.21 The dates of flights in each survey block are given in Tables 2-4. Smallparts of some survey blocks could not be flown, for example, because of2 km flying exclusion zones around nuclear power stations (at Wylfa,Anglesey, Heysham, Lancashire, and Sizewell, Suffolk). In some surveyblocks on some dates, survey was also curtailed by military activity indanger zones (notably, the northwest corner of NW3), or because ofheavy boat traffic (eg in the mouth of the Humber) but these generallyaffected only small areas at the periphery of certain survey blocks.

Aerial Surveys of Waterbirds in Strategic Wind Farm Areas: 2005/06 Final Report 21
2.22 Coverage of the survey blocks varied between winter (Periods 1-4) andsummer (Periods 5-7). During the winter, NW4 was surveyed once(Period 3), and TH4 and TH5 were covered twice (Period 3 and 4). Allother survey blocks were surveyed throughout the winter. During thesummer; NW3 and NW5 were surveyed once, NW4, GW3-6 and TH4were covered in all periods, and surveys of NW1, NW6, GW1, GW2,GW7, TH1-3, TH5, TH6 and TH7 were not required.
2.23 In 2005/06 the programme of aerial surveys differed to that of 2004/05.
2.24 In 2005/06 in the North West, as in 2004/05, coverage of NW1, NW3, NW5and NW6 was required throughout the winter; however, surveys of NW4were reduced to just one flight (Period 3). During the summer, flightswere only required in NW4 (Periods 5-7), and NW3 and NW5 (Period 6);in comparison, all survey blocks in the North West, with the exception ofNW1, were surveyed in all summer periods in 2005.
2.25 Except for the addition of summer surveys in GW6 (Periods 5-7),coverage of the Greater Wash was the same as in 2004/05. All surveyblocks were surveyed during the winter (except for GW1 in Period 1, theonly scheduled survey which was not completed) and no summer flightswere required in GW1 and GW2. Surveys of GW7 were undertaken forthe first time in 2005/06 as part of a separate contract for English Nature.
3.26 In the Thames, as in 2004/05, surveys of TH1-3 were required throughoutthe winter; however, no flights were required in TH4 and TH5. Aerialsurveys of these blocks were, however, undertaken (in Period 3 and 4) aspart of a separate project for English Nature and data have been includedin this report in order to provide as complete picture as possible of birddistribution in the Thames. Winter surveys of new blocks TH6 and TH7were required in Periods 1-4. During the summer, flights were onlyrequired in TH4 (Periods 5-7); in comparison, in 2005 surveys of TH1 andTH5 were undertaken throughout the summer, and TH3 and TH4 weresurveyed once in Period 6.
2.27 Due to complications with obtaining Civil Aviation Authority (CAA)approval, it was not possible to fly through and therefore survey withinthe footprint of constructed wind farms. At these sites, the plane flew ata higher altitude (preventing survey using the prescribed methods), topass safely over the top of the wind farm before descending to thesurvey altitude as soon as possible afterwards (survey was therefore notpossible 1-2 km along the transect path either side of the constructedwind farm), or flew around the wind farm, departing from the intendedtransect route by approximately 1 km. This affected coverage of BarrowOWF in NW3, North Hoyle in NW5, Scroby Sands in GW6 and KentishFlats in TH1.

22 Aerial Surveys of Waterbirds in Strategic Wind Farm Areas: 2005/06 Final Report
Analysis and map production
2.28 The precise location of each bird or flock of birds was calculated bylinking the time (to the nearest second) at which they were recorded tothe location of the plane, recorded by the GPS (generally, every fiveseconds). Interpolation of the GPS data enabled the position of the planeto be located along the flight path at each second. The locations of birdsdetected were displaced either side of the flight path at a distanceroughly in the middle of the distance band in which they were recorded.The location of most observations is consequently considered to beaccurate to within 200-300 m.
2.29 The distribution of the more numerous species (or species groups) ineach Strategic Area is shown using encounter rate, i.e. the numbers ofbirds counted per unit length of transect flown. Data are summarised by2x2 km grid squares, corrected for survey effort (distance flown overwhich observers were actively looking for birds) in each cell. Casualobservations of ‘out of transect birds’ (eg those recorded while the planewas turning between transects) were omitted from this analysis.
2.30 The density scales used in the maps were selected to illustrate thedistribution patterns of encounter rates. They are broadly consistentbetween surveys but small variations will occur owing to the differentconditions of visibility during and between surveys, and the differentabilities of observers. Densities are not, however, comparable betweenspecies due to the different detectability of different species. Note thatthe range of relative density values may vary markedly between speciesand reference should be made to the key in each figure to interpretapparent high concentrations of birds appropriately.
Analytical methods for population assessment
2.31 The density and population abundance of common scoter and of alldiver species combined were estimated using Distance 5.0 software(Thomas et al 2005). Line transect methods were employed for the diveranalyses and strip transect methods for the common scoter (due tocomplications arising from the tendency for scoter to move away fromthe flight path in response to the plane). No significant differencesbetween observers were found and it was thus unnecessary to includeobserver as a covariate. Data were post-stratified by flock size or surveyblock to improve precision, and 95% confidence intervals were obtainedby bootstrap simulation. Observations were combined by geographicregion (East Coast and West Coast) within each of the seven surveyperiods, and abundance estimates are thus presented as regional totalsfor each survey period (unless insufficient observations were collected topermit analysis).

Aerial Surveys of Waterbirds in Strategic Wind Farm Areas: 2005/06 Final Report 23
Overall numbers and distribution
3.1 Maps showing the distribution of bird observations of all species inwinter (Periods 1-4) and summer (Periods 5-7) for the North West,Greater Wash and Thames OWF Strategic Areas are presented in Figures1-6. Relative densities of all birds encountered in winter and summer foreach of the Strategic Areas are presented in Figures 7-12. These mapsshow total numbers of birds counted per 2x2 km grid cell (summing thenumbers of birds recorded in flocks), corrected for survey effort.
3.2 Total numbers of birds encountered during aerial surveys of the NorthWest, Greater Wash and Thames OWF Strategic Areas are given inTables 5-7. Numbers recorded in each individual survey block are givenin Tables 13-33. Note these are not absolute numbers of birds in thesurvey areas, which need to be calculated using ‘distance’, allowing forthe numbers of birds which are missed with increasing distance from thetransect line.
3.3 Reduced coverage of NW4, TH4 and TH5 in winter and of NW3 and NW5in summer resulted in apparently low numbers of observations in theseblocks when data from different Periods were combined to producewinter and summer distribution maps.
3.4 Large numbers of birds were recorded in all Strategic Areas during thewinter, the Greater Wash holding highest numbers followed by the NorthWest then the Thames. In summer total bird numbers were smaller withhighest numbers recorded in the North West, followed by the GreaterWash and very few birds in the Thames, primarily due to limitedcoverage in this last area.
3.5 The highest numbers of observations (one bird or one flock of birds areboth treated as one observation) were recorded in the winter, with lowernumbers in the summer.
3.6 Many of the high number of observations made close to shore are aresult of flocks of waders or gulls feeding or loafing on mudflats andsandbanks exposed at low tide. Areas with particularly large numbers ofbirds on exposed intertidal habitat include Morecambe Bay, Cumbria(NW4), off the Dengie and southwest from Foulness, Essex (TH1), offSkegness, Lincolnshire (GW4) and the Wash, Lincolnshire/Norfolk (GW7).
Results

24 Aerial Surveys of Waterbirds in Strategic Wind Farm Areas: 2005/06 Final Report
3.7 In the North West during winter there were high numbers ofobservations in most areas. The most concentrated observations wereover Shell Flat sand bank, off Blackpool, around the North Wales coastand the mouth of the Dee Estuary to Formby Point. Many of theobservations in offshore areas were of single birds, leading to lowrelative densities in these areas. The areas holding highest densities ofbirds were Shell Flat (mainly due to common scoter), the North Walescoast (common scoter and birds associated with intertidal areas),Formby Point and Morecambe Bay (mainly birds over intertidalsandbanks).
3.8 During the summer in the North West there were high numbers ofobservations in Morecambe Bay, in offshore areas of NW4, and in ConwyBay. Large numbers of observations in offshore areas were mainly ofsingle birds or small flocks, but there were some areas of high relativedensities in these areas (Manx shearwaters Puffinus puffinus, gannetsMorus bassanus, kittiwakes and auks). High densities of birds wererecorded in Morecambe Bay (intertidal associations and eider Somateriamollissima) and in Conwy Bay (breeding seabirds).
3.9 In the Greater Wash during winter the number and distribution ofobservations was fairly even throughout the survey area, with highnumbers of observations extending well offshore. The highestconcentration of birds was in the Wash (GW7), due to large flocks ofeider and common scoter, plus birds associated with intertidal areas. Therest of the Greater Wash held mainly low relative densities of birds, apartfrom a small area off northwest Norfolk where large, discrete flocks ofscoter were observed.
3.10 During the summer in the Greater Wash the highest concentrations ofbirds were located along the coast, and in offshore areas, the lattermainly consisting of single birds, leading to low relative densities inthese areas. Areas with high relative densities were recorded close toshore (intertidal associations and birds foraging close to breedingcolonies) and off Great Yarmouth (divers, terns and auks).
3.11 The highest numbers of observations, and highest relative densitiesduring winter in the Thames were observed in the mouth of the ThamesEstuary (birds associated with exposed intertidal areas) and thesoutheast corner of the survey area (feeding seabirds).
3.12 Little of the Thames Strategic Area was surveyed during the summer,and consequently very low numbers of birds were recorded.

Aerial Surveys of Waterbirds in Strategic Wind Farm Areas: 2005/06 Final Report 25
Common scoter
3.13 Total numbers of scoters counted in each survey block during Periods 1-7are given in Table 8. Estimates of scoter numbers calculated using‘distance’ for the West Coast (North West) and East Coast (Greater Washand Thames) are given in Table 9 for each Period in which significantnumbers were recorded. Relative densities of scoter found duringPeriods 1-4 and 6-7 (no birds were recorded in Period 5) in the NorthWest are shown in Figures 13-18, during Periods 1-4 in the Greater Washin Figures 19-22, and during winter (Periods 1-4 combined) in theThames in Figure 23.
3.14 Large numbers of common scoters were recorded during the winter, withthe highest numbers in the North West. Moderate numbers wererecorded in the Greater Wash and small numbers in the Thames. Thedistribution of common scoter was clumped, with a large proportion ofbirds occurring in one or two survey blocks.
3.15 The North West held the largest number of scoter with a peak of almost25,000 birds counted in Period 3, markedly higher than numbers duringthe rest of winter (between 4,500 and 6,500). This was mainly due to theinclusion of NW4, but numbers in other survey blocks also increasedduring this Period (Table 9).
3.16 The highest numbers of scoter were located over Shell Flat, extendingsouth to the mouth of the Ribble, and in Colwyn Bay. Smaller numberswere recorded in Conwy and Red Wharf Bays and low numbers in theSolway and off Walney Island.
3.17 As the survey block holding most scoter was only surveyed once duringthe winter it is not possible to describe any gross changes in distributionthrough the winter. The Solway held moderate numbers in early winter,falling as the winter progressed. The proportion of scoter off north Walesincreased through the winter, as birds appeared to move south, andthere was also some westward movement as the winter progressed. ByPeriod 4 the birds off north Wales and in the Solway extended furtheroffshore than in previous Periods.
3.18 Few scoter were encountered in the North West during the summer, andnone was recorded in Period 5. Birds were found off Shell Flat and inConwy Bay, with few birds in Colwyn Bay. The majority of birds werelocated less than 10 km from the coast.
3.19 Moderate numbers of scoter were counted in the Greater Wash duringwinter, with numbers remaining relatively stable, varying from 955 to2,565.

26 Aerial Surveys of Waterbirds in Strategic Wind Farm Areas: 2005/06 Final Report
3.20 During early winter the majority of birds were in the Wash with smallernumbers located off the North Norfolk Coast. In Period 3, which had thelowest count of scoter, the majority of birds were recorded off the NorthNorfolk Coast, with only five birds in the Inner Wash. The count in Period4 recorded almost equal numbers in the Wash and off North Norfolk.Most scoter occurred in the outer parts of the Wash, not far from thebirds recorded off North Norfolk. Scoter at the latter site were located ina few large discrete flocks, usually off Skegness, Titchwell or HolkhamBay. There were no obvious distribution changes as the winterprogressed and no apparent movement offshore.
3.21 Small numbers of scoter were recorded off the North Norfolk Coastduring the summer in similar areas to those in winter.
3.22 The Thames held the smallest and most variable number of scoterduring the winter, with no birds during October-December. The peak of273 occurred in Period 3. The majority of birds were located in the mouthof the Thames Estuary off Foulness, with small numbers scattered in thesouth west of the survey area.
3.23 During the summer few scoter were recorded in the Thames, mostlocated in TH4, an area that held no birds during the winter.
3.24 Numbers of scoters calculated using ‘distance’ were between 1.5 to 3.5times greater than actual counts (Tables 8 & 9). The large confidenceintervals are partially a result of the aggregated distribution of scoter andpartially due to the tendency of scoter to flush in front of the plane,moving away from the transect line, resulting in some areas with theminimum confidence intervals falling below the actual number counted.This is particularly noticeable off the East Coast (Greater Wash andThames), where scoter occurred in few, large flocks.
3.25 The West Coast (North West) held significantly higher numbers than EastCoast. The North West OWF Strategic Area held numbers exceeding theinternational 1% threshold (16,000 individuals; Wetlands International2002) in Period 3. For other Periods scoter numbers were just below theinternational threshold, even though the most important area for scoter(NW4) was not surveyed.
Divers
3.26 Total numbers of divers (red-throated, black-throated, great northern andthose not identified to species) counted in each survey block duringPeriods 1-7 are given in Table 10. Estimates of diver numbers calculatedusing ‘distance’ for the West Coast and East Coast are given in Table 11 foreach Period in which significant numbers were recorded. Observations ofdivers in Periods 1-4 in the North West are shown in Figures 24-27, in theGreater Wash in Figures 28-31 and in the Thames in Figures 32-35.

Aerial Surveys of Waterbirds in Strategic Wind Farm Areas: 2005/06 Final Report 27
3.27 The Thames held the highest number of divers during much of thewinter, with up to four times as many as the other two OWF StrategicAreas combined. Counts in the Greater Wash were similar to those of theNorth West from October to December. From January numbers in theGreater Wash doubled, whilst numbers in the North West remainedstable.
3.28 Divers were generally widely distributed through survey areas, withhighest concentrations occurring off the mouths of estuaries and ininshore areas. Low densities of birds were encountered a long way fromshore in all Strategic Areas, and extended up to the outer limits of thesurvey areas in the Greater Wash and Thames. Small numbers of diverswere recorded in the Thames in early winter, rising rapidly through midwinter then stabilising with almost identical counts in Periods 3 and 4 ofaround 1,360. The increase in numbers during the latter two Periods waspartially due to increased coverage during this time, though numbersincreased dramatically in TH2.
3.29 The highest concentrations of divers in the Thames occurred in midchannel, often up to 30 km offshore and in inshore areas off GreatYarmouth. Smaller numbers were found widely distributed throughoutthe area, extending to the outer limits of the survey area. Birds oftenoccurred in flocks of more than ten birds near channels and sand banksmid way between Kent and Essex.
3.30 Although the main concentrations were in roughly the same areasthroughout the winter, there was some variation in distribution betweenmonths. In mid to late winter fewer birds were found in the south and inoffshore parts of the north of the survey area, as birds appeared toconcentrate in central areas, and move inshore in the north.
3.31 Divers were present in the North West throughout the winter in low butconsistent numbers; total counts varied from 135 to 187. There was noobvious pattern to the variation in numbers.
3.32 Birds were widely distributed through the survey area, with the highestconcentrations occurring from the Ribble Estuary along the North Walescoast to Conwy Bay, and in the Solway in Period 1. Smaller numbersoccurred in areas offshore from Morecambe Bay, where birds werefound up to 30 km from shore.
3.33 During early winter the Solway was the most important site for divers,holding almost 75% of birds recorded. Numbers here droppeddramatically in Period 2 and remained low for the rest of the winter. Incontrast the number of divers along the North Wales coast up to theRibble Estuary increased in Period 2 then remained stable during winter,perhaps indicating a general movement southwards during the winter.

28 Aerial Surveys of Waterbirds in Strategic Wind Farm Areas: 2005/06 Final Report
3.34 Moderate numbers of divers were recorded in the Greater Wash duringthe winter, with 100 birds during October to December, increasing toaround 300 from January to March.
3.35 The distribution of divers throughout the Greater Wash was quitevariable during the winter, though GW4 and GW6 held the highestnumbers in most Periods. The highest densities occurred close to shoreoff the northeast Norfolk coast. Smaller numbers of birds showed someassociation with the Humber and Wash Estuary mouths. Small numbersof birds occurred far from shore, up to 50 km offshore.
3.36 The distribution of divers varied through the winter, particularly withregard to the distance from shore. There appeared to be a generalmovement offshore in Period 4, but whether this reflects a seasonalchange in distribution or simply between-month variation is not clear.
3.37 No divers were recorded in any of the Strategic Areas during summersurveys.
3.38 Numbers of divers calculated using ‘distance’ gave estimates between3.5 and 8 times higher than actual counts (Tables 10 & 11), withconfidence intervals much smaller than those for scoter. This is largely aconsequence of the more even distribution of divers.
3.39 Estimates of divers were much higher in the East Coast than the WestCoast. Numbers in the East Coast exceeded 3,000 in Period 2, and 7,000in Periods 3 and 4. No single survey block held more than 3,000 birds,although the combined total for TH1 and TH2 exceeded this figure inPeriods 3 and 4.
Little gull
3.40 Total numbers of little gulls counted in Periods 1-7 in each survey blockare given in Table 12. Observations of little gulls in the winter (Periods 1-4) in the North West and Greater Wash are shown in Figures 36 & 37.
3.41 Large numbers of little gulls were encountered in the Greater WashStrategic Area in early winter (Period 1), when moderate numbers werealso present in the Thames. Numbers in these areas decreased duringthe rest of winter, with only small numbers present off the East Coast.Moderate numbers were present during mid to late winter (Periods 3 &4) in the North West, an area which held virtually no birds earlier in thewinter.
3.42 Little gulls tended to show relatively continuous distribution over distinctareas, with few birds falling outside these areas.

Aerial Surveys of Waterbirds in Strategic Wind Farm Areas: 2005/06 Final Report 29
3.43 During Period 1, 222 little gulls were recorded in the Greater Wash.Numbers in Period 2 were much lower (33 birds) and numbers fellsteadily through the rest of the winter.
3.44 Ninety five per cent of little gulls recorded in the Greater Wash duringthe peak count (Period 1) were located in GW4, with only 13 birds inGW5, the only other survey block to hold any birds. During Period 2birds were distributed much more evenly over four survey blocks. Therewere no areas of high density with a fairly continuous, even distributionoff the North Norfolk Coast between Hunstanton and Blakeney Point,with most birds occurring between 10 and 25 km offshore, althoughsmaller numbers were recorded near the outer limit of the survey area,over 60 km from shore.
3.45 In the North West virtually no little gulls were recorded from October toDecember, with moderate numbers from January to March.
3.46 During winter in the North West little gulls occurred in offshore areasfrom Cumbria to the Dee Estuary, gradually moving closer to shore fromthe Ribble Estuary southwards. During Period 3 the majority of birdsoccurred in NW3 and NW4; by Period 4 numbers were highest in NW5and NW6a (there was no coverage of NW4), indicating a movementsouthwards, and inshore, during the winter.
3.47 The highest count in the Thames of 59 birds occurred in early winter,with roughly even numbers occurring in TH3 and TH7. Very smallnumbers were recorded in mid winter, with no birds by late winter.
3.48 No little gulls were recorded in any of the Strategic Areas during thesummer.
Eider
3.49 Large numbers of eider were recorded throughout the winter (Tables 5-7). The highest numbers occurred in the Greater Wash with a peak of2,358. Moderate numbers were recorded in the North West and very fewin the Thames.
3.50 The majority of eiders were found at the mouths of large estuaries, withsmall numbers occurring in shallow inshore waters.
3.51 Eider numbers were fairly constant through the winter in the GreaterWash, except in Period 3 when numbers doubled (Table 6). Almost all theeider were located in the Wash, mainly in shallow water off the northeastcoast. None was found more than 10 km from shore (Figure 38).

30 Aerial Surveys of Waterbirds in Strategic Wind Farm Areas: 2005/06 Final Report
3.52 The number of eiders recorded in the North West varied greatly betweenmonths (Table 5). This is mainly due to the fact that the individual surveyblock in which most eider occur (NW4) was not surveyed in somePeriods (3, 5, 6 & 7).
4.53 During winter the majority of eiders in the North West were recorded inthe outer parts of Morecambe Bay, with small numbers around WalneyIsland (Figure 39). Small numbers were also present in Conwy andColwyn Bay, off the mouths of rivers Conwy and Clwyd, respectively.During summer all eider recorded occurred in NW4, around the outerpart of Morecambe Bay.
Manx shearwater
3.54 Moderate numbers of Manx shearwaters were recorded in the NorthWest during summer, with a peak of 337 birds in both Periods 6 and 7(Tables 5-7). No birds were recorded during the winter.
3.55 The highest number of birds occurred in areas offshore from Blackpooland the Ribble Estuary (Figure 40). Small numbers occurred offshorefrom Cumbria and off North Wales, especially offshore from Conwy Bayand close to Great Ormes Head, one of the few areas where theyoccurred close to shore. Higher numbers of Manx shearwaters wererecorded at the offshore limits of the survey area.
Gannet
3.56 Large numbers of gannets were observed in the Thames during thewinter, with a peak count of 2,404 in Period 2 of which 2,373 were in TH6(Tables 7 & 28). By late winter and into summer only small numberswere present.
3.57 The majority of gannets in the Thames occurred in the southeast cornerof the survey area (Figure 41). Small numbers occurred in central andnorthern areas, almost all well offshore up to the limits of the surveyarea.
3.58 Moderate numbers of gannets occurred in the North West in thesummer, with highest numbers in mid to late summer (Table 5). The peakcount of 357 was recorded in Period 7, despite only one survey blockbeing covered. Small numbers were recorded in early winter andnumbers dropped as winter progressed.
3.59 Gannets in the North West occurred in offshore areas from Fleetwood tothe Ribble Estuary, and off North Wales, with birds off the Cumbriancoast occurring closer to shore (Figure 42). The highest densities wererecorded in offshore areas.

Aerial Surveys of Waterbirds in Strategic Wind Farm Areas: 2005/06 Final Report 31
3.60 The Greater Wash held moderate numbers of gannets in early winter(Period 1) and late summer (Period 7). The distribution of birds variedbetween these two Periods, with higher numbers in the south in earlywinter (Tables 20 & 26).
Cormorant and shag
3.61 Moderate numbers of cormorants and shags (and those not identified tospecies) were found during winter in the North West, with a peak of 708in Period 2 followed by a steady decline in numbers through the winter(Table 5).
3.62 The areas holding the highest number of cormorant species in the NorthWest were from the mouth of Ribble along the north Wales coast toConwy Bay and the mouth of the Solway (Figure 43). The latter site heldhigh numbers in Period 1, with numbers declining as the winterprogressed. Survey blocks NW3 and NW6b never held more than sevenbirds (Tables 13-16).
3.63 During summer in the North West far fewer birds were recorded, due toreduction in coverage of the Strategic Area (Figure 44). The peak count ofcormorants in summer was in Period 6 (Tables 17-19), the only summersurvey to include NW5, an important area for cormorant species, whichheld 207 of the total of 211 birds.
3.64 The Thames held moderate numbers of cormorants in late winter, withthe total of 681 (Period 4) exclusively located in TH1 (Table 30). This sitealso held the highest numbers throughout the winter (Tables 27-33).
Gulls
3.65 Six species of gull - black-headed gull, common gull, lesser black-backedgull, herring gull, greater black-backed gull and kittiwake - werecommonly recorded during the surveys (Figures 45-65). The first fivespecies are found in large numbers at coastal and inland sites; kittiwakesare generally pelagic and separate maps are therefore presented for thisspecies.
3.66 Large numbers of gulls were recorded in all Strategic Areas during thewinter. The Thames held the largest numbers, followed by the GreaterWash with the North West holding the smallest (Tables 5-7). Duringsummer the North West held similar numbers to those recorded inwinter but became the area holding most birds as numbers dropped inthe Greater Wash and the Thames.

32 Aerial Surveys of Waterbirds in Strategic Wind Farm Areas: 2005/06 Final Report
3.67 The Thames held similar numbers throughout the winter (between 4,700and 6,100) except during Period 2 when there was a large increase to16,156. Survey blocks holding the highest numbers of gulls were TH1,TH6 and TH4 (Tables 27-33). Throughout the winter gulls were distributedin small numbers over much of the Strategic Area, with higherconcentrations usually found on the coast or inshore areas. During earlywinter gulls in the Thames showed a strong association with the coastextending just south of Foulness to the mouth of the Blackwater Estuary(Figure 59). During the peak count in Period 2 high concentrationsoccurred over the coast in locations favoured in Period 1, and in thesoutheast of the survey area (Figure 60). In mid to late winter birds werescattered over a larger area, with fewer areas of high densities, whichwere then found in inshore, rather than over the coast. Generally thedistribution of gulls was quite variable between survey Periods. Severalsmall isolated areas of high concentrations occurred in offshore areas inmost Periods.
3.68 During the summer the number of gulls in the Thames decreaseddramatically, partly due to reduced coverage, although there was agenuine decrease in bird numbers in areas covered. Gulls weredistributed in small concentrations throughout the survey area, with fewhigh densities.
3.69 The number of gulls in the Greater Wash varied greatly between surveyPeriods throughout the winter, from 1,246 in Period 2 to 9,940 in Period 3(Table 6). There was no obvious pattern to the variation, with theminimum and maximum counts occurring in consecutive Periods. Thedistribution of gulls in the Greater Wash also varied considerablythrough the winter, with large numbers of gulls in the Wash in Periods 1,3 and 4 but not in Period 2 when the distribution was concentratedfurther offshore. Fewer birds were present in offshore areas in Periods 3and 4.
3.70 Numbers of gulls in the Greater Wash were much lower in summercompared with winter, largely due to reduction in coverage, especiallythe loss of GW7.
3.71 During early summer the highest densities of gulls were in nearshoreareas, with small numbers extending well offshore (Figure 56). In midsummer few birds were recorded, most of which were sparselydistributed in the north and east of the survey area (Figure 57). By latesummer there was fairly even distribution through survey area, withsome higher densities at the coast (Figure 58).
3.72 Gull numbers in the North West were fairly stable throughout the year,despite reduced coverage in the summer, with an increase in numbers insummer for those survey blocks covered (Tables 13-19).

Aerial Surveys of Waterbirds in Strategic Wind Farm Areas: 2005/06 Final Report 33
3.73 The distribution of gulls varied through the year. Each survey block atone time held a high proportion of gulls recorded, with the exception ofNW3. The highest concentrations of birds were almost all in nearshoreareas, with few small isolated concentrations in offshore areas. Awayfrom nearshore areas gulls were distributed over a wide area in smallconcentrations, extending well offshore.
3.74 The distribution of gulls in the summer was similar to that of winter.High concentrations occurred in Morecambe Bay, with smaller numbersaround Walney Island.
Kittiwake
3.75 Moderate to high numbers of kittiwakes were recorded over the winter(Tables 5-7), with highest numbers in the Greater Wash in early winter,and in the Thames in mid to late winter. The North West held smallnumbers throughout winter. During summer the North West held smallnumbers, with fewer in the Greater Wash and Thames.
3.76 In the North West during winter there was little variation in the numberof kittiwakes, with slightly higher counts in Periods 1 & 2. During thesummer there was large variation between months, partly due tochanges in coverage.
3.77 The distribution of kittiwakes varied through the year. Each survey blockheld a high proportion of birds in at least one Period with the exceptionof NW6a, which never held more than ten birds. Generally kittiwakeswere distributed widely throughout the survey area in low densities,extending from the coast to offshore areas (Figure 66). High numbers ofbirds were recorded off North Wales, but low numbers off Blackpool.
3.78 During summer the distribution was far patchier, with more areas of highconcentrations. Areas off north Wales continued to hold large numbers,with more birds off Blackpool than in winter and few birds off Cumbria(Figure 67).
3.79 The Greater Wash held high numbers of kittiwakes in early winter.Numbers then decreased till Period 3, then remained stable (Table 6).During summer numbers were fairly variable.
3.80 Central survey blocks (GW3-5) held the largest numbers of kittiwakes formost of the winter, except in Period 2 when birds were mostly located inGW2 and GW6 (Tables 20-23). During winter birds were spread thinlyover a large area from the coast to the outer limit of survey area (Figure68). The highest relative densities occurred offshore.

34 Aerial Surveys of Waterbirds in Strategic Wind Farm Areas: 2005/06 Final Report
3.81 In summer kittiwakes displayed a more clumped distribution, with anobvious shift to offshore areas and very few birds near the coast (Figure69).
3.82 In the Thames kittiwake numbers increased until the peak in Period 3 of951, then decreased with very few birds in summer months, partly due toreduced coverage (Table 7).
3.83 During winter kittiwakes occurred mainly in offshore areas of the Thameswith highest numbers in the southeast (Figure 70). Few birds occurredclose to shore. The distribution was more clumped than in otherStrategic Areas during winter. During summer the few birds occurring inTH4 were concentrated in the north of the survey block (Figure 71).
Terns
3.84 Large numbers of terns were recorded in the Greater Wash duringsummer, with small numbers in the North West and Thames.
3.85 Tern numbers in the Greater Wash were relatively stable through thesummer, with small numbers recorded in early winter.
3.86 Terns occurred throughout most of the Greater Wash, with the highestdensities close to shore near Skegness, Lincolnshire, Scolt Head,Holkham NNR and Blakeney Point, north Norfolk, and Winterton, GreatYarmouth (Figure 72). Tern distribution was very similar in early and midsummer, with slightly more birds in offshore areas (GW3) in Period 5(Tables 24-25). In late summer there were fewer birds in GW5, and morein GW6, and a slight increase in offshore areas (GW3) (Table 27).
3.87 Small, stable numbers of terns were recorded in the North West duringsummer. Birds were distributed along the coast, with no highconcentrations in any areas (Figure 73). No terns were observed inoffshore areas.
3.88 The Thames held small numbers of terns during the summer, with highvariation between months (Tables 27-33). Very few were recorded inearly summer, none in mid summer and small numbers, similar to thosein the North West, in late summer. The highest numbers of terns werefound in offshore areas, with few high concentrations close to shore(Figure 74).

Aerial Surveys of Waterbirds in Strategic Wind Farm Areas: 2005/06 Final Report 35
Auks
3.89 Large numbers of auks were recorded throughout winter in all StrategicAreas, with highest numbers in the North West (Tables 5-7). During thesummer the number of auks was variable, with around 1,000 recorded inat least one Period in the North West and Greater Wash.
3.90 The highest numbers of auks were recorded in the North West in Periods1 and 2, with the peak in the latter, after which numbers dropped slightlyin Periods 3 and 4. Small numbers were recorded during early and latesummer. A peak of 960 birds was recorded in mid summer.
3.91 Auks showed a clumped distribution in early winter in the North Westwith large concentrations off Anglesey and offshore from the mouth ofthe Solway (Figure 75). These concentrations dispersed through thewinter, with more continuous distribution spread over much of thesurvey area (Figures 76-78). Few birds were recorded in inshore areas oraround the mouths of the Solway and Mersey Estuaries. Auks generallyfavoured offshore areas during winter.
3.92 Over the winter the distribution shifted southwards, with highestnumbers off North Wales from January to March, and fewer birds northof Morecambe Bay.
3.93 In early summer auks were distributed evenly throughout the surveyarea (Figure 79), changing in mid to late summer to a more clumpeddistribution with concentrations in offshore waters off Blackpool, andinshore areas around Great Ormes Head (Figures 80 & 81).
3.94 The Greater Wash held highest numbers of auks in early winter.Numbers then dropped through the winter and into mid summer,followed by a dramatic increase in late summer, when auk numbers weresimilar to those in early winter.
3.95 In early winter the majority of auks were located off the mouth of theWash (Figure 82). During mid to late winter distribution shifted to theoffshore eastern edge of the survey area (Figures 83-85). Although thedistribution of auks was generally widespread in small densities, therewere small clumped concentrations of high density present in mostPeriods, the positions of which varied greatly.
3.96 During summer there were few auks in the Greater Wash, located mainlyin the north (Figures 86-87). In late summer the number of auksincreased dramatically, with birds occurring mainly in offshore areas,with a large aggregation off east Norfolk (Figure 88).

36 Aerial Surveys of Waterbirds in Strategic Wind Farm Areas: 2005/06 Final Report
4.97 The numbers of auks in the Thames were low in early winter, thenincreased rapidly in Period 2 and peaked in Period 3 with 1,837 birds.Numbers fell in late winter. Very few bids were recorded in the summerwhen only TH4 was surveyed: this survey block held consistently lownumbers of auks (Tables 27-33).
4.98 The survey blocks which held the most auks were TH6 and TH7, whichtogether accounted for about 70% of the total count. Birds occurredwidely in offshore parts of the Strategic Area, with highestconcentrations in the southeast and north. In early winter birds occurredin small concentrations over wide areas, generally offshore with no areasof high concentration (Figure 89). During mid winter higherconcentrations of auks occurred in the southeast and northeast areas(Figures 90 & 91). The distribution of birds in late winter was similar tothat of early winter (Figure 92).
4.99 Few birds were recorded in the summer, with no obvious distributionaltrends (Figures 93-94).

Aerial Surveys of Waterbirds in Strategic Wind Farm Areas: 2005/06 Final Report 37
Overall summary
4.1 One of the major factors affecting the changes in bird numbers anddistribution was differing levels of coverage of survey areas. Several keysurvey blocks are particularly important for some species, but were notsurveyed in each Period during winter, notably NW4 (important forcommon scoter in particular) and TH4 and TH5 (important for divers andseabirds). Most of Thames and North West Strategic Areas were notsurveyed during the summer months.
4.2 Tidal state was another important factor in determining distribution,especially of species which feed on exposed sand banks, such as gullsand waders.
4.3 The Greater Wash held the highest numbers of birds during winter. Ahigh proportion of these occurred in the Wash (GW7), however, and ifdata from this survey block were removed, the North West then holdsthe highest numbers. During summer the North West held the highestnumber of birds, the Greater Wash slightly fewer, while counts in theThames were very low.
4.4 The North West in winter was characterised by large numbers ofcommon scoter, especially along the North Wales coast and over ShellFlat, off Blackpool. There were also high numbers of auks during thistime. In summer the North West held moderate numbers of gulls, auksand waders (the latter only occurred in large numbers in Period 7).
4.5 The Greater Wash in winter was characterised by large numbers of gullsand scoter, the Wash by large numbers of seaduck in shallow waters andof gulls, waders and wildfowl over exposed intertidal areas. Duringsummer the Greater Wash held moderate numbers of auks and terns,often extending well offshore, plus waders and gulls, many of whichwere associated with exposed sand banks.
Discussion
38 Aerial Surveys of Waterbirds in Strategic Wind Farm Areas: 2005/06 Final Report
4.6 The Thames in winter held large numbers of divers, mainly mid-channelbetween Kent and Essex, plus gulls and waders, often over exposedsand banks. In summer very few birds were recorded, due to limitedcoverage of the survey area.
4.7 The Thames and North West both held fairly consistent numbersthroughout the winter, though with a mid winter peak in one Period(Period 2 for the Thames, Period 3 for the North West). The Greater Washshowed more variation, with similar total bird numbers in early and latewinter, a dip in Period 2 and peak in Period 3.
4.8 Numbers were quite variable in all summer Periods, with a gradualincrease in the North West. Total bird numbers were similar in early andlate summer, both in the Greater Wash and Thames; numbers in theThames increased in mid summer, whilst numbers in the Greater Washdecreased at this time.
4.9 The Solway Firth held large numbers of several species in early winteronly; numbers then dropped markedly throughout the rest of winter. Thisnorthernmost part of the North West Strategic Area may be important asa staging post for birds moving south to wintering grounds, includingscoter, divers and cormorant species.
Common scoter
4.10 The number of common scoter in the North West during Period 3estimated using ‘distance’ (61,400) easily surpassed the level forinternational importance (16,000; Wetlands International 2002), as indeeddid the lower confidence interval of the estimate. During the rest of thewinter estimated numbers of scoter were just below this threshold,despite the fact that the survey block holding most scoter (NW4) was notsurveyed. If it had been covered there is little doubt that the estimates ofcommon scoter numbers would have exceeded the level for internationalimportance in all winter Periods.
4.11 Winter maxima for common scoter in Liverpool Bay during 2001/02 to2005/06 were 27,800, 79,100, 42,900, 47,600 and 61,400 (Cranswick et al2004, Hall et al 2005) (although surveys in the last two seasons willinclude small numbers in the Solway Firth, an area not covered inprevious surveys), demonstrating the regular and continuous presence ofinternationally important numbers at this site. The designation of thissite as a marine SPA is currently underway (Webb et al 2004).
4.12 As in previous years there was a mid to late winter peak in scoternumbers in all survey blocks in the North West (WWT Wetlands AdvisoryService 2005, Cranswick et al 2004). However, as NW4, the key area forscoter, was only surveyed – Period 3, it is not possible to determine ifthis represented the peak number in the North West during 2005/06.

Aerial Surveys of Waterbirds in Strategic Wind Farm Areas: 2005/06 Final Report 39
During the course of the winter there appeared to be a gradualdistributional shift southwards, with a movement to offshore areas inPeriod 4.
4.13 The gradual southward movement of scoter through the winter may be aresult of birds returning from breeding grounds in the north; i.e. theyarrive from the north and move southwards as the winter progresses.This would explain the sharp decrease in numbers in the Solway afterearly winter. This southward movement has been noted in previousyears, with the proportion of scoter off North Wales compared with ShellFlat increasing as the winter progresses.
4.14 The movement offshore of birds in late winter is believed to be aresponse to food depletion in inshore areas during early winter. Birdsfavour shallower, inshore areas as it is more energetically profitable tofeed in shallow waters. However with such large numbers of birdsfeeding in these areas, resources become depleted. Recent studies onthe benthic communities of Liverpool Bay found a large reduction (morethan 50 per cent) of potential scoter prey through the winter (M Kaiserpers comm.).
4.15 Moderate numbers of common scoter were found in the Wash and offthe North Norfolk Coast: numbers were relatively stable through thewinter with no obvious winter peak. The lowest count was recorded inPeriod 3, when only five birds were recorded in the Wash. Due to thesmall distance between the two main concentrations of scoter off thenorth Norfolk and Lincolnshire coasts it is likely that there is somemovement between the two areas. As these two areas fall into differentaerial survey blocks, which were not surveyed simultaneously, it ispossible that birds were missed if moving between the survey blocks.
4.16 Few common scoter were found in the Thames, an area that hashistorically held significant numbers (Lack 1986). This highlights the factthat areas favoured by birds do not remain constant but change overtime, hence the need for continued surveys to identify current areas ofimportance for sensitive species.
4.17 Several other sites in the UK are important for common scoter. Theseinclude Carmarthen Bay which regularly holds 20,000 birds (Cranswick etal 2005), designated as the UK’s first marine SPA based on its commonscoter numbers. Cardigan Bay was estimated to hold 11,800 scoter in2003/04 (Hall et al 2005). Aerial surveys in Scotland have recorded scoterin Aberdeen Bay (258 in February 2005), Firth of Tay (1085 in December2004), Firth of Forth (70 in February 2005) and the Moray Firth (693 inMarch 2005), with peaks for individual sites occurring in different months(Wilson et al 2006). Estimates of numbers present at these sites using‘distance’ analysis are not yet available.

40 Aerial Surveys of Waterbirds in Strategic Wind Farm Areas: 2005/06 Final Report
4.18 The current published estimate for the number of common scoterwintering in Britain is 50,000 (Cranswick in press, Kershaw & Cranswick2003). Data collected from recent aerial surveys suggests the total maybe closer to 80-90,000 birds in most years and in some, as in 2005/06,may even exceed 100,000.
4.19 The estimate for the biogeographic population of common scoters is 1.6million, with the majority of the European wintering population found inthe Baltic and Kattegat. The eastern North Sea holds several hundredthousands, with smaller numbers in France, Portugal and northernAfrica. During cold winters it is thought that many of the birds from theBaltic and Kattegat move into the North Sea (Skov et al 1995).
Red-throated diver
4.20 Divers were encountered widely throughout all Strategic Areas. Althoughnot all could be identified to species, it is believed that the vast majoritywere red-throated divers and all unidentified divers are treated as suchhere.
4.21 Estimates of numbers of divers calculated using ‘distance’ exceeded3,000 birds off the East Coast (Greater Wash and Thames combined,though most birds occurred in the Thames) in Periods 2, 3 and 4.Estimates for survey blocks TH1 and TH2 combined exceeded 3,000 birdsin Periods 3 and 4.
4.22 The international population estimate of red-throated divers is between100,000 and 1 million (Wetlands International 2002). The internationalthreshold is thus currently set at 10,000 birds, but this is likely to berevised to 3,000 in the next edition of Waterbird Population Estimates(Wetlands International in prep).
4.23 Winter maxima for red-throated divers in the Thames during 2002/03 to2005/06 were 11,100, 7,700, 5,600 and 8,000 (WWT Wetlands AdvisoryService 2005, Webb et al 2005). The latter two figures are in factestimates for the English East coast, from Kent to Yorkshire, but only asmall number of divers occur outside the Thames. These figuresdemonstrate the regular and continued presence of large numbers ofred-throated divers in the Thames. The boundaries of a potential SPA fordivers in the Thames are currently being prepared.
4.24 Only a few sites in Northwest Europe hold comparable numbers to thosein the Thames, and are usually found over much larger areas. In theeastern German Bight 23,500 divers (a mixture of red-throated and black-throated) occurred over 13,000 km²; those recorded in the Thames occurover 8,233 km² (Skov et al 1993).

Aerial Surveys of Waterbirds in Strategic Wind Farm Areas: 2005/06 Final Report 41
4.25 A marked increase in diver numbers was noted in the Thames andGreater Wash during Periods 3 and 4. Peak numbers of divers in theThames usually occur in late winter, although the precise timing variesbetween years. The peak is reached either with a large influx in mid orlate winter, such as in 2005/06, or as a gradual increase in numbersthroughout the winter.
4.26 Numbers in the Thames in 2005/06 were higher than in 2004/05, but havenot reached levels recorded in 2002/03. This may be due to morefavourable conditions in other wintering grounds, perhaps as a result ofmild winters or high food availability.
4.27 High concentrations of divers occurred mid-channel between Essex andKent, and in the north of the Strategic Area, as noted in previous years.Birds appeared to be distributed near sand banks despite turbid and veryshallow water, which would appear to make foraging difficult for thesevisual feeders which dive for their food. It is possible that divers in suchwaters have switched their diet in late winter/early spring, perhaps tospawning fish/eggs as has been noted in other areas (Guse et al inpress).
4.28 Large-scale changes in the distribution of divers between Periods areunsurprising for a species that feeds on fish, a widespread and mobilefood resource. It might be speculated that the timing and distribution ofarrival of the winter influx of divers may be driven by seasonaloccurrence of fish species, particularly spawning fish. Lower numbers ofdivers in recent years may be as a result of reduced fish stocks in thewestern North Sea, or due to improved food resources in other winteringareas.
4.29 The extent of the survey area was extended further offshore in 2005/06specifically to investigate the limits of diver distribution. Divers were stillrecorded in the outer limits of these new survey areas off Suffolk andKent, suggesting that their distribution extends beyond the survey areas.Red-throated divers have been recorded throughout the North Sea to the20 m depth contour (Skov et al 1995), though there has been littlecoverage of central areas in recent years.
4.30 Movement of red-throated divers within the Thames between monthsindicates that the whole of the survey area – and perhaps unsurveyedareas beyond – represents a coherent site for this species. Future surveysshould ensure synchronised coverage across this broad region to ensurean accurate assessment of numbers in this area, and to avoid missingbirds.

42 Aerial Surveys of Waterbirds in Strategic Wind Farm Areas: 2005/06 Final Report
4.31 Moderate numbers of divers were recorded in the Greater Wash, mainlyin inshore areas though there was much variation in distributionbetween months, probably related to movements of their prey.
4.32 Winter maxima for red-throated divers in Liverpool Bay during 2001/02 to2005/06 were 1,600, 1,000, 600, 1,000 and 1,500 (Webb et al 2004,Wetlands Advisory Service 2005, Hall et al 2005). Although thesenumbers demonstrate regular and continued presence of large numberswithin the area, they do not surpass the level for internationalimportance.
4.33 The UK Government has, however, adopted selection guidelines for SPAsthat include areas regularly used by 1% or more of the Great Britainpopulation of species listed in Annex 1 of the EC Birds Directive (Stroudet al 2001). Consequently, as the current British estimate is 4,850 birdsand the 1% threshold for national importance is 50 birds (Kershaw &Cranswick 2003), numbers in Liverpool Bay are sufficient for this site tobe selected as an SPA for red-throated divers. The proposed SPA forcommon scoter in Liverpool Bay will include the important areas fordivers.
4.34 Aerial surveys of other sites in the UK during winter 2005/06 recordedmoderate numbers of red-throated divers in the Tay (33 in February),Firth of Forth (57 in December) and Aberdeen Bay (31 in December)(Wilson et al 2006). Estimates of actual numbers calculated usingdistance analysis are not yet available. Shore-based counts of AberdeenBay recorded a peak of 423 red-throated divers in May 2005 (Wilson et al2006). Estimates of divers calculated using distance analysis for CardiganBay suggested 1,200 were present in March 2004 (Hall et al 2005).
4.35 Increased aerial surveys over the past two winters have greatly increasedour knowledge on red-throated divers wintering in UK waters and showthe current British wintering estimate to be a considerableunderestimate. A revised estimate is currently in preparation, and islikely to be 15,000 birds (O’Brien et al in prep). Although the revised 1%threshold for national importance would therefore be increased to 150,numbers in Liverpool Bay still easily surpass this figure.
Little gull
4.36 Little gulls were found in large numbers off the east coast of Britain inearly winter, particularly in the Greater Wash. The North West heldvirtually none at this time but from January to March held moderatenumbers. Little gulls are regularly observed in the Greater Wash areaduring migration periods, although large counts are rare: land-basedcounts off Spurn, Yorkshire, in October 2000 found more than 1,400, andboat-based surveys of the same area in September 2003 found 1,835,though few birds remained by the end of October (Hartley 2004). Both

Aerial Surveys of Waterbirds in Strategic Wind Farm Areas: 2005/06 Final Report 43
these counts occurred in the area of GW1a and GW2, where few birdswere recorded during aerial surveys. Large counts of little gulls wererecorded from the plane in October to November 2005, much later thanland or boat counts which occurred in September.
4.37 Little gulls occurred in central areas of the Greater Wash, between 10and 25 km offshore. Similar numbers and distribution of little gulls werefound in the previous winter’s survey. It appears that there may be largernumbers of little gulls passing through British waters than is realised,due to the difficulty of monitoring offshore areas. Hartley (2004)speculated that the eastern part of the North Sea formed an importantstaging area for little gulls on their way to wintering grounds that extendfrom Britain to the western Mediterranean, and off West Africa.
4.38 Moderate numbers of little gulls occurred in the North West during midto late winter. The lack of birds in early winter followed by an increase inmid to late winter suggests that this area is used as a wintering ground.Small numbers of little gulls were also recorded off the East Coast in midwinter, and in 2004/05 small numbers were recorded in all StrategicAreas at this time, demonstrating that small numbers of little gulls areusing UK waters as wintering grounds, perhaps following mobile foodstocks to profitable feeding grounds.
Other species
4.39 Large numbers of eider were found in the Wash, though very fewelsewhere in the Greater Wash. Eider numbers in the North West duringwinter were much lower than in 2004/05 as Morecambe Bay, the areaknown to hold the majority of eider in the North West, was not coveredduring winter. The outer part of the Bay was covered during Period 3 butdue to poor visibility the whole area could not be surveyed.
4.40 Eider numbers varied greatly in the summer, probably as a result ofmovements in or out of the survey area limits in relation to tidal state. Inlate winter a high proportion of the birds observed wereimmature/juveniles or moulting birds.
4.41 Manx shearwaters occurred mainly at the offshore edge of the NorthWest survey area, and it is likely that far greater numbers were presentwest of the survey area. There are a number of breeding colonies aroundthe Irish Sea, including the Calf of Man (Isle of Man), Bardsey Island(Anglesey), Saltee Islands (County Wexford), Lambay (County Dublin),Copeland Islands (County Down) and southern parts of Argyll & Bute.However as Manx shearwaters are known to make feeding trips ofseveral days’ duration it may be that birds observed in the North Westwere from colonies even further afield (Simmons et al 1977).

44 Aerial Surveys of Waterbirds in Strategic Wind Farm Areas: 2005/06 Final Report
4.42 Gannet distribution in the Thames was highly concentrated in thesoutheast limits of the survey area, where many species of seabird werealso recorded in high densities. The high number of several species heresuggests the presence of abundant food resources in this area. Casualobservations of the areas adjacent to the boundary of TH6 suggest thathigh numbers of birds occurred immediately outside the survey area.
4.43 High numbers of gannets were recorded in early winter and late summerin the Greater Wash, with few birds there throughout the rest of the year.This may suggest the Greater Wash is important as a migrating orstaging area, for birds moving from breeding grounds in the North towintering areas.
4.44 Large numbers of gulls were observed in all Strategic Areas throughoutthe year (except for the Thames in summer when there was very lowcoverage), with high variation in numbers and distribution betweenPeriods. Many gull species (except for kittiwakes) were associated withexposed sand banks during counts at mid to low tide. During high tidegulls from these intertidal areas may move inland to forage, andtherefore outside of the survey area. Tidal state is probably an importantfactor in determining the numbers and distribution of gulls during aerialsurveys. Birds favouring coastal locations during summer will includeconcentrations around breeding colonies as well as those associatedwith exposed intertidal areas.
4.45 Small areas of high densities of gulls occurring in the offshore parts ofsurvey blocks were, in many cases, due to association with fishingvessels. The large offshore concentration of gulls in the southeast of theThames overlaps with high concentrations of other seabirds in the area.Gulls recorded there may have been feeding on the same food resourcesas the other seabirds present, or may be parasitising other species forfood.
4.46 Kittiwakes occurred extensively throughout the Strategic Areas in winter,generally evenly spread in small numbers. The decrease in numbers ofkittiwakes in the Greater Wash during Periods 3 and 4 coincided with anincrease in the Thames. This may be a consequence of birds movingsouth in mid to late winter, possibly in response to movement orchanges in food resources.
4.47 Kittiwakes and auks often had similar distributions through the winter.Observers regularly saw kittiwakes closely associated with auks.
4.48 Large numbers of terns were recorded in the Greater Wash, with smallernumbers in the North West, possibly due to lack of coverage in foragingareas close to breeding colonies, such as North Wales and around themouth of the Dee and Ribble Estuaries.

Aerial Surveys of Waterbirds in Strategic Wind Farm Areas: 2005/06 Final Report 45
4.49 Estimates of tern numbers off the East Coast during summer rangedbetween 2,127 and 2,420 birds. The national seabird census in 2000recorded 5,375 occupied nests in Norfolk (Mitchell et al 2004).
4.50 The decrease in late summer of tern numbers in GW5 coincided with anincrease in GW6 and a movement into offshore areas (GW3) north of thebreeding grounds. The increase in GW6 may be a result of chicksfledging from the breeding site at Winterton into the local area. In aprevious study birds moved further from shore in July compared to June(Allcorn et al 2003).
4.51 Terns were mostly found in inshore areas, but did occur well offshore, upto the limits of the survey area. Some birds were encountered up to 65km from breeding sites. A previous estimate of the average distance offoraging trips suggested a radius of 16 km from colonies for Sandwichterns (Brenninkmeijer & Stienen 1994). Terns carrying fish in their billswere encountered at much greater distances than this from colonies on anumber of occasions during aerial surveys in 2006.
4.52 Variable numbers of terns in the Thames during summer may beexplained by local movements within the survey area: as only onesurvey block (TH4) was covered, birds within most of the survey areawould be missed unless feeding was concentrated in that block on thedate of the survey.
4.53 Auks were found mainly in offshore areas during the winter, withdistribution varying between Periods, presumably as auks follow mobilefish stocks. During summer auks were found closer to the coast, in mostcases obviously associated with breeding colonies. Auk numbers werelow in the Strategic Areas where no auk breeding colonies occur. In theGreater Wash most auks in summer were found in the north of theStrategic Area, close to the breeding colony at Flamborough Head(Yorkshire).
Changes between years
4.54 The surveys in 2005/06 were the second season of co-ordinated surveysin the Offshore Wind Farm Strategic Areas and potential SPA sites. Theboundaries of individual survey blocks remained the same for bothprojects. Coverage differed between the two years, however, and twoadditional survey blocks (TH6 & 7) were created for the 2005/06 surveyprogramme, while the results of survey in another area (GW7) are alsoincluded in this report. This allows only broad comparisons betweendata from the two years.

46 Aerial Surveys of Waterbirds in Strategic Wind Farm Areas: 2005/06 Final Report
4.55 Overall distributions were very similar in both 2004/05 and 2005/06, withhigh densities of birds in inshore areas, and in areas where scoteroccurred. In the Greater Wash there were more birds in GW6 in 2005/06compared to the previous year. In the Thames there was a notableoffshore concentration of seabirds in the southeast in 2005/06, an areanot surveyed during the previous year.
4.56 The peak count of scoter in the North West in 2005/06 (24,424 birds) washigher compared with the peak in 2004/05 (19,032). Distance estimateswere also markedly higher (61,400 compared with 47,600), suggesting agenuine increase in numbers. Although numbers were below the levelsfound in 2002/03 (79,100), this does suggest that Liverpool Bay regularlyholds very high numbers of common scoters in late winter.
4.57 The peak count in 2005/06 occurred in Period 3, compared to Period 4 inthe previous year, although the actual dates of the survey differed onlyby a fortnight. Period 3 was, however, the only period in 2005/06 whenthe main scoter area (Shell Flat) was surveyed. It is therefore notpossible to determine if this figure represented the winter peak of scoterin the North West in 2005/06.
4.58 In the North West during the summer period of 2006, Conwy Bay heldmuch larger numbers compared with Colwyn Bay, unlike summer 2005when Colwyn Bay held higher numbers than Conwy Bay.
4.59 Distribution of common scoter in the North West was very similar in bothyears, with concentrations over Shell Flat and close to the North Walescoast. Changes in distribution during the winter also appeared to besimilar, with birds in the North West moving south and into offshoreareas as the winter progressed. Assessment of the extent of thesemovements in this project was, however, limited due to reducedcoverage of NW4.
4.60 The distribution of scoter in the Greater Wash was similar during the twoyears, with most birds occurring off the North Norfolk Coast andSkegness. Significant numbers of scoter were found in the Wash, an areanot previously covered. In late winter 2004/05 scoter were found offshorefrom north Norfolk but this was not apparent during 2005/06 when scoterwere found close to the coast.
4.61 The number of scoter in the Greater Wash was smaller in 2005/06 than in2004/05. If the counts in the Wash are removed from 2005/06 data thedifference in numbers between years is even greater.

Aerial Surveys of Waterbirds in Strategic Wind Farm Areas: 2005/06 Final Report 47
4.62 Diver numbers during winter were generally similar in 2004/05 and2005/06. In the North West the peak has occurred in late winter inprevious years, although it occurred in Period 2 (early/mid winter) in2005/06. In the Greater Wash the increase in numbers during winteroccurred earlier, with higher numbers than in the previous winter.
4.63 In both winters divers occurred in highest densities close to shore andaround the mouths of estuaries. Low densities extended a long way fromshore in parts of all the Strategic Areas.
4.64 Diver distribution in the North West and Thames areas was broadlysimilar between years, with between-year variation no greater thanwithin-year variation. In the Greater Wash divers were spread moreevenly over larger areas in 2005/06, with more birds in eastern areasthan in the previous winter, especially off the northeastern coast ofNorfolk.
4.65 In both winters, there were changes in distribution over large areas,particularly in the Thames, between months, implying that a functionalsite for red-throated divers covers a very large area.

48 Aerial Surveys of Waterbirds in Strategic Wind Farm Areas: 2005/06 Final Report
Allcorn, R, MA Eaton, PA Cranswick, M Perrow, C Hall, L Smith, JB Reid, AWebb, KWS Smith, RHW Langston & N Ratcliffe. 2003. A pilot study ofbreeding tern foraging ranges in NW England and East Anglia in relation topotential development areas for offshore windfarms. RSPB/WWT/JNCC, Sandy.27 pp.
Brenninkmeijer, A & EWM Stienen. 1994. Pilot study on the influence offeeding conditions at the North Sea on the breeding results of the sandwichtern Sterna sandvicensis. Institute for Forestry and Nature Research (IBN-DLO),Wageningen, the Netherlands. IBN Research Report No 94/10.
Buckland, ST, D Anderson, K Burnham, J Laake, D Borchers & L Thomas. 2001Introduction to distance sampling: estimating abundance of biologicalpopulations. Oxford University Press, Oxford.
Camphuysen, CJ, AD Fox, MF Leopold & IK & Petersen. 2004. Towardsstandardised seabird at sea census techniques in connection withenvironmental impact assessments for offshore wind farms in the UK: acomparison of ship and aerial sampling methods for marine birds, and theirapplicability to offshore wind farm assessments. NIOZ report to COWRIE.
Cranswick, PA, C Hall & L Smith. 2003. Aerial surveys of birds in proposedstrategic areas for offshore windfarm development, round 2: preliminaryreport, winter 2002/03. WWT, Slimbridge. 13 pp.
Cranswick, PA, C Hall & L Smith. 2004. All Wales Common Scoter survey:report on 2002/03 work programme. WWT Wetlands Advisory Service report toCountryside Council for Wales, CCW Contract Science Report no 615.
Cranswick, PA, J Worden, RM Ward, HE Rowell, C Hall, AJ Musgrove, RDHearn, SJ Holloway, AN Banks, GE Austin, LR Griffin, B Hughes, M Kershaw,MJ O’Connell, MS Pollitt, EC Rees & LE Smith. 2005. The Wetland Bird Survey2001-03: Wildfowl & Wader Counts. BTO/WWT/RSPB/JNCC, Slimbridge.
References

Aerial Surveys of Waterbirds in Strategic Wind Farm Areas: 2005/06 Final Report 49
Cranswick, PA. In press. Status and distribution of common scoter Melanittanigra and velvet scoter M. fusca in the United Kingdom. In: Western PalearcticScoter Flyway Review; Proceedings of the Seaduck Specialist Group meeting atFugelsø, Jutland 2000. NERI technical report: 59-65.
Guse, N, S Garthe & R Mundry. In press. Spring or winter menu? The impact ofseason on the diet of red-throated divers in the southern Baltic Sea.Proceedings of the 9th International Seabird Group Conference, Aberdeen,Scotland 2006.
Hall, C, L Smith & PA Cranswick. 2005. All Wales Common Scoter survey:report on 2003/04 work programme. WWT Wetlands Advisory Service report toCountryside Council for Wales, CCW Contract Science Report No 709.
Hartley, C. 2004. Little Gulls at sea off Yorkshire in autumn 2003. British Birds97: 448-455.
Johnston, SM, CG Turnbull & ML Tasker. 2002. Natura 2000 in UK OffshoreWaters: Advice to support the implementation of the EC Habitats and BirdsDirectives in UK offshore waters. JNCC Report No 325.
Kahlert, J, M Desholm, I Clausager & IK Petersen. 2000. Environmental impactassessment of an offshore wind park at Rødsand. Natural EnvironmentResearch Institute, Rønde.
Kershaw, M & PA Cranswick. 2003. Numbers of wintering waterbirds in GreatBritain, 1994/1995-1998/1999: I. Wildfowl and selected waterbirds. BiologicalConservation 111: 91-104.
Lack, P. 1986. The Atlas of Wintering Birds in Britain and Ireland. T & ADPoyser, London.
Mitchell, PI, SF Newton, N Ratcliffe & TE Dunn. 2004. Seabird Populations ofBritain and Ireland. Results of the Seabird 2000. T & AD Poyser, London.
O’Brien, S, L Wilson, A Webb & PA Cranswick. In prep. Revised estimate ofnumbers of wintering red-throated divers Gavia stellata in Great Britain.Unpublished JNCC report, Peterborough.
Simmons, KEL, IJ Ferguson-Lees, R Gillmor, PAD Hollom, R Hudson, EMNicholson, MA Ogilvie, PJS Olney, KH Voous & J Watter. 1977. Handbook ofthe Birds of Europe the Middle East and North Africa: The Birds of the WesternPalearctic Volume I Ostrich to Ducks. Oxford University Press.
Stroud, DA, D Chambers, S Cook, N Buxton, B Fraser, P Clement, P Lewis, IMcLean, H Baker & S Whitehead. 2001. The UK SPA network: its scope andcontent. JNCC, Peterborough.

50 Aerial Surveys of Waterbirds in Strategic Wind Farm Areas: 2005/06 Final Report
Skov, H, J Durinck, MF Leopold & ML Tasker. 1995. Important Bird Areas forseabirds in the North Sea. BirdLife International, Cambridge.
Thomas, L, JL Laake, S Strindberg, FFC Marques, ST Buckland, DL Borchers,DR Anderson, KP Burnham, SL Hedley, JH Pollard, JRB Bishop & TA Marques.2005. Distance 5.0. Release Beta 5. Research Unit for Wildlife PopulationAssessment, University of St Andrews, UK. http://www.ruwpa.st-and.ac.uk/distance/
Webb, A, CA McSorley, A Webb, BJ Dean, JB Reid, PA Cranswick, L Smith & CHall. 2004. An assessment of the numbers and distribution of inshoreaggregations of waterbirds using Liverpool Bay during the non-breedingseason. JNCC Report No 373.
Webb, A, CA McSorley, BJ Dean, S O'Brien, JB Reid, PA Cranswick, LE Smith &C Hall. 2005. An assessment of the numbers and distribution of aggregationsof inshore waterbirds using the Greater Thames during the non-breedingseason. JNCC Report No 374.
Wilson, LJ, BJ Dean, A Webb, CA McSorley & JB Reid. 2006 Winteringseaducks, divers and grebes in UK inshore areas: Aerial surveys and shore-based counts 2004/05. JNCC Report No 371.
Wetlands International. 2002. Waterbird Population Estimates – Third Edition.Wetlands International Global Series No 12. Wageningen, the Netherlands.
Wetlands International. In prep. Waterbird Population Estimates – FourthEdition. Wetlands International, Wageningen, the Netherlands.
WWT Wetlands Advisory Service. 2003. All Wales Common Scoter Survey:report on 2001/02 work programme. CCW Contract Science Report No 568.
Department of Trade and Industry. 2006. Aerial Surveys of Waterbirds inStrategic Windfarm Areas: 2004/05 Final Report. Department of Trade andIndustry, London.
WWT Wetlands Advisory Service. 2006. Aerial Surveys of Waterbirds in theWash, 2005/06. WWT Wetlands Advisory Service report to English Nature.

Aerial Surveys of Waterbirds in Strategic Wind Farm Areas: 2005/06 Final Report 51
Figures
Observations of birds in the North West, Greater Wash and Thames OWFStrategic Areas are presented in Figures 1-6. A single record of birds (whetheran individual or flock) is treated as one observation. The approximate boundaryof the individual survey blocks is shown in green. The grid is the 10 km nationalgrid. Note, a higher proportion of birds is detected close the plane, hence theapparent distribution is of lines of birds running north-south along the path ofthe transects. Note some survey blocks were not surveyed in all months.
Relative density of birds in the North West, Greater Wash and Thames OWFStrategic Areas are presented in Figures 7-94. Numbers of all species aresummed by 2x2 km grid squares, corrected for survey effort.
Figures presenting data for ‘winter 2005/06’ are derived by summingobservations of birds in Periods 1-4 inclusive.
Figures presenting data for ‘summer 2006’ are derived by summingobservations of birds in Periods 5-7 inclusive.

52 Aerial Surveys of Waterbirds in Strategic Wind Farm Areas: 2005/06 Final Report
Figure 1 - Observations of birds in the North West OWF Strategic Area duringaerial surveys, winter 2005/06.

Aerial Surveys of Waterbirds in Strategic Wind Farm Areas: 2005/06 Final Report 53
Figure 2 - Observations of birds in the North West OWF Strategic Area duringaerial surveys, summer 2006.

54 Aerial Surveys of Waterbirds in Strategic Wind Farm Areas: 2005/06 Final Report
Figure 3 - Observations of birds in the Greater Wash OWF Strategic Areaduring aerial surveys, winter 2005/06.

Aerial Surveys of Waterbirds in Strategic Wind Farm Areas: 2005/06 Final Report 55
Figure 4 - Observations of birds in the Greater Wash OWF Strategic Areaduring aerial surveys, summer 2006.

56 Aerial Surveys of Waterbirds in Strategic Wind Farm Areas: 2005/06 Final Report
Figure 5 - Observations of birds in the Thames OWF Strategic Area duringaerial surveys, winter 2005/06.

Aerial Surveys of Waterbirds in Strategic Wind Farm Areas: 2005/06 Final Report 57
Figure 6 - Observations of birds in the Thames OWF Strategic Area duringaerial surveys, summer 2006.

58 Aerial Surveys of Waterbirds in Strategic Wind Farm Areas: 2005/06 Final Report
Figure 7 - Relative density of birds recorded in North West OWF StrategicArea during aerial surveys, winter 2005/06.

Aerial Surveys of Waterbirds in Strategic Wind Farm Areas: 2005/06 Final Report 59
Figure 8 - Relative density of birds recorded in North West OWF StrategicArea during aerial surveys, summer 2006.

60 Aerial Surveys of Waterbirds in Strategic Wind Farm Areas: 2005/06 Final Report
Figure 9 - Relative density of birds recorded in Greater Wash OWF StrategicArea during aerial surveys, winter 2005/06.

Aerial Surveys of Waterbirds in Strategic Wind Farm Areas: 2005/06 Final Report 61
Figure 10 - Relative density of birds recorded in Greater Wash OWF StrategicArea during aerial surveys, summer 2006.

62 Aerial Surveys of Waterbirds in Strategic Wind Farm Areas: 2005/06 Final Report
Figure 11 - Relative density of birds recorded in Thames OWF Strategic Areaduring aerial surveys, winter 2005/06.

Aerial Surveys of Waterbirds in Strategic Wind Farm Areas: 2005/06 Final Report 63
Figure 12 - Relative density of birds recorded in Thames OWF Strategic Areaduring aerial surveys, summer 2006.

64 Aerial Surveys of Waterbirds in Strategic Wind Farm Areas: 2005/06 Final Report
Figure 13 - Relative density of common scoters Melanitta nigra recorded inNorth West OWF Strategic Area during aerial surveys, Period 1.

Aerial Surveys of Waterbirds in Strategic Wind Farm Areas: 2005/06 Final Report 65
Figure 14 - Relative density of common scoters Melanitta nigra recorded inNorth West OWF Strategic Area during aerial surveys, Period 2.

66 Aerial Surveys of Waterbirds in Strategic Wind Farm Areas: 2005/06 Final Report
Figure 15 - Relative density of common scoters Melanitta nigra recorded inNorth West OWF Strategic Area during aerial surveys, Period 3.
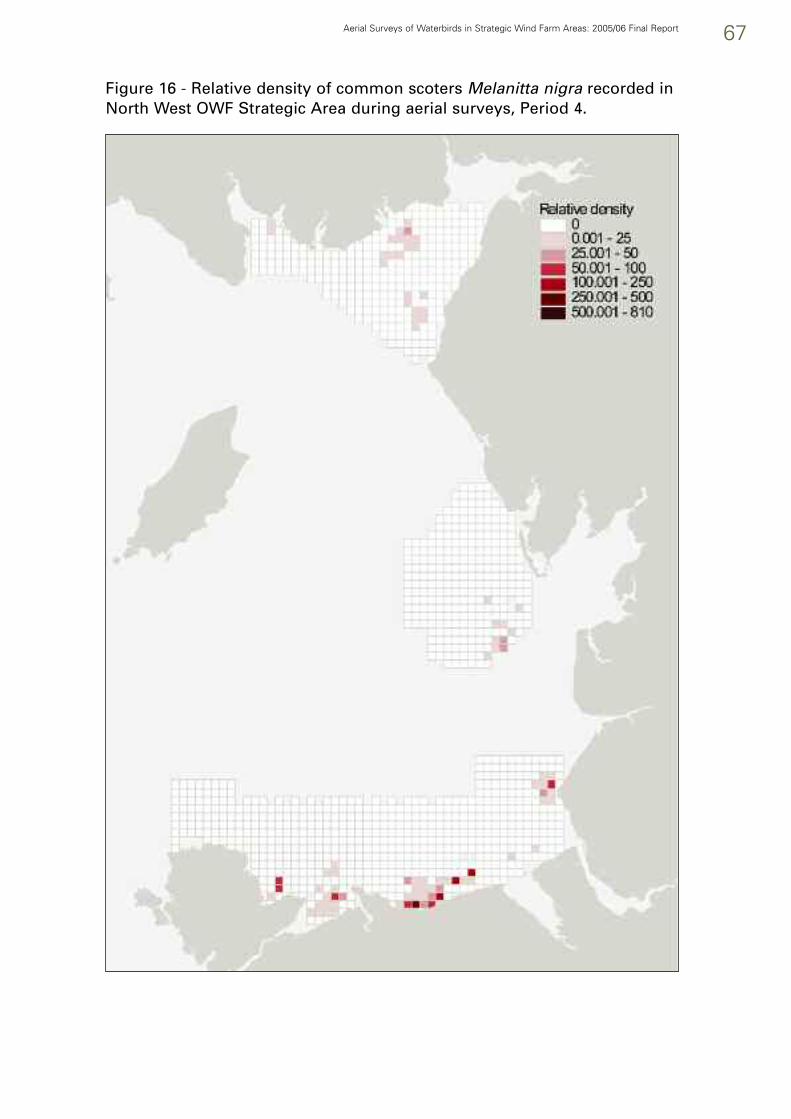
Aerial Surveys of Waterbirds in Strategic Wind Farm Areas: 2005/06 Final Report 67
Figure 16 - Relative density of common scoters Melanitta nigra recorded inNorth West OWF Strategic Area during aerial surveys, Period 4.

68 Aerial Surveys of Waterbirds in Strategic Wind Farm Areas: 2005/06 Final Report
Figure 17 - Relative density of common scoters Melanitta nigra recorded inNorth West OWF Strategic Area during aerial surveys, Period 6.
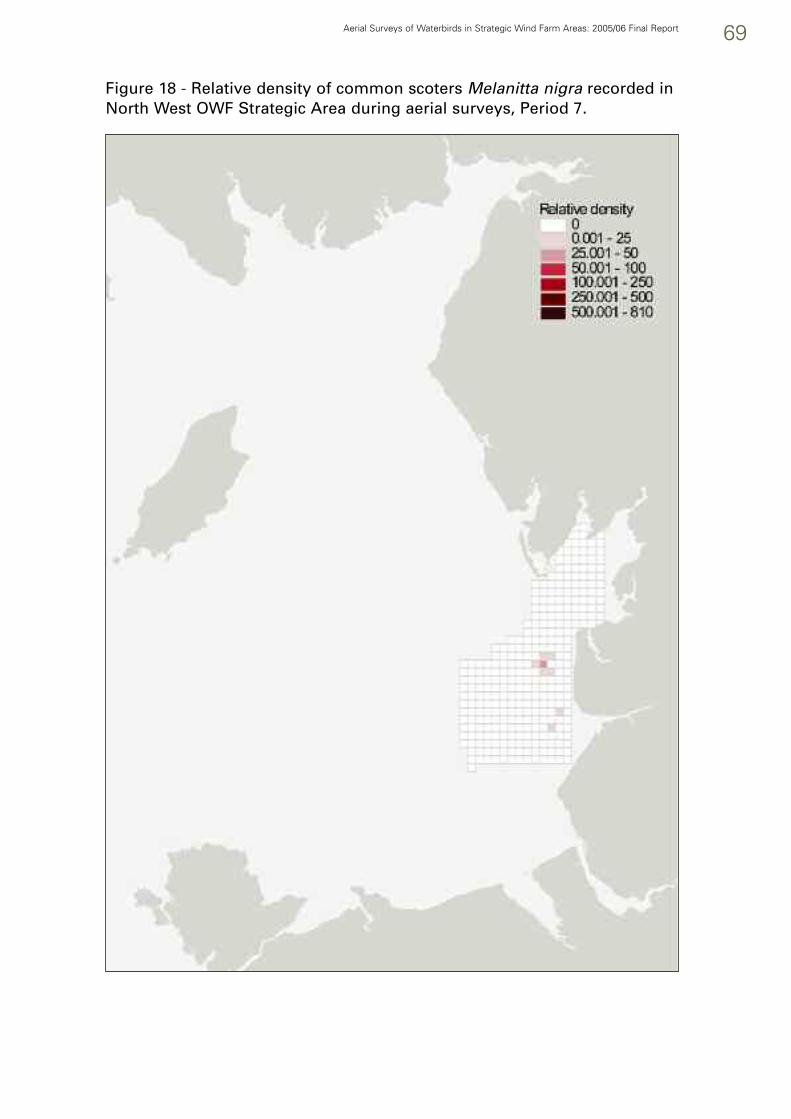
Aerial Surveys of Waterbirds in Strategic Wind Farm Areas: 2005/06 Final Report 69
Figure 18 - Relative density of common scoters Melanitta nigra recorded inNorth West OWF Strategic Area during aerial surveys, Period 7.

70 Aerial Surveys of Waterbirds in Strategic Wind Farm Areas: 2005/06 Final Report
Figure 19 - Relative density of common scoters Melanitta nigra recorded inGreater Wash OWF Strategic Area during aerial surveys, Period 1.

Aerial Surveys of Waterbirds in Strategic Wind Farm Areas: 2005/06 Final Report 71
Figure 20 - Relative density of common scoters Melanitta nigra recorded inGreater Wash OWF Strategic Area during aerial surveys, Period 2.
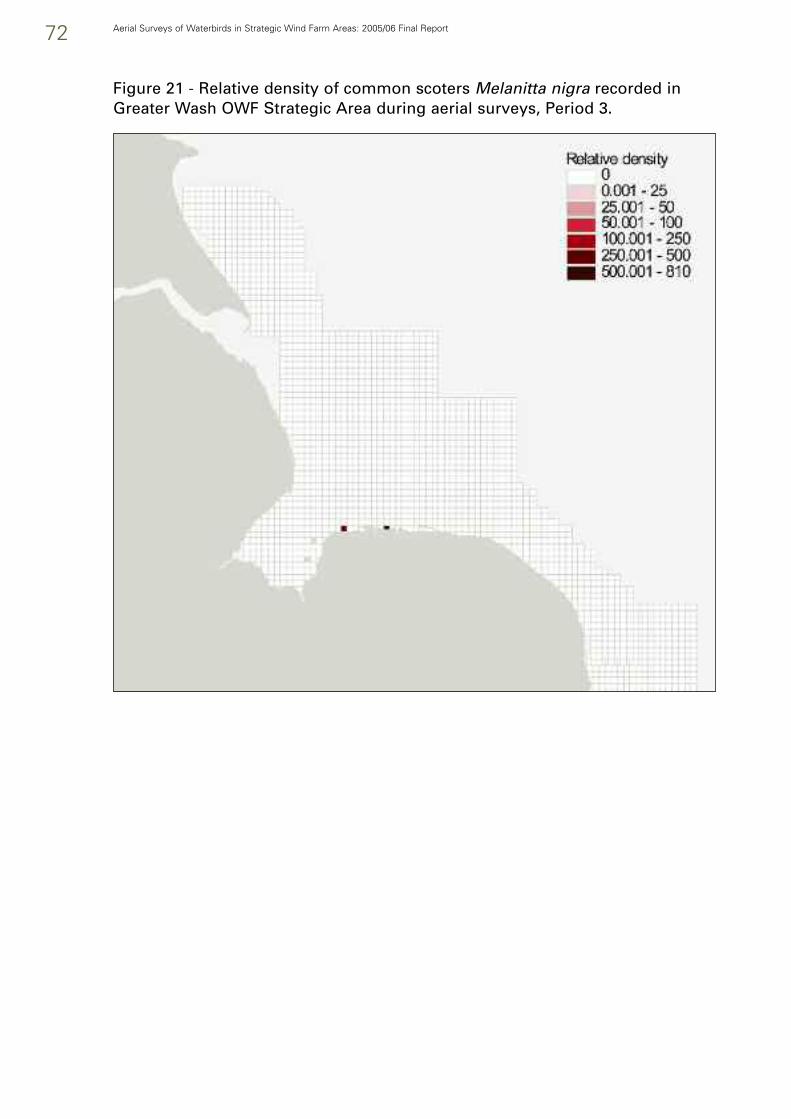
72 Aerial Surveys of Waterbirds in Strategic Wind Farm Areas: 2005/06 Final Report
Figure 21 - Relative density of common scoters Melanitta nigra recorded inGreater Wash OWF Strategic Area during aerial surveys, Period 3.
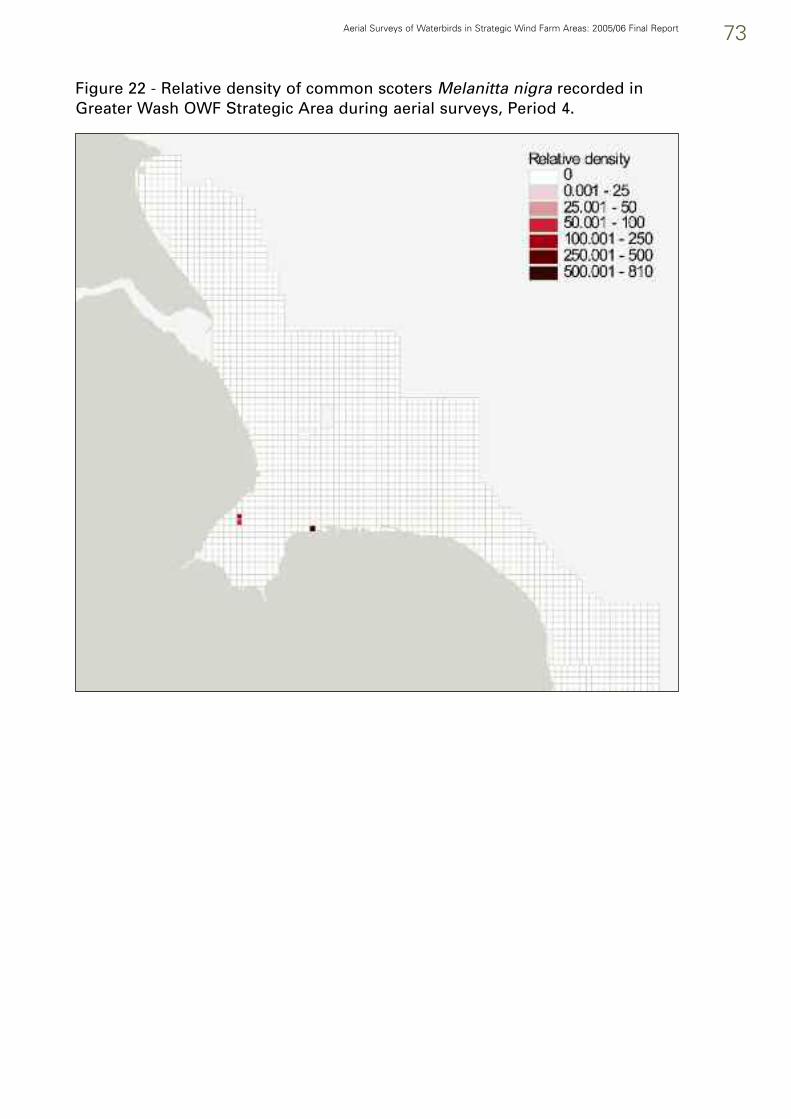
Aerial Surveys of Waterbirds in Strategic Wind Farm Areas: 2005/06 Final Report 73
Figure 22 - Relative density of common scoters Melanitta nigra recorded inGreater Wash OWF Strategic Area during aerial surveys, Period 4.

74 Aerial Surveys of Waterbirds in Strategic Wind Farm Areas: 2005/06 Final Report
Figure 23 - Relative density of common scoters Melanitta nigra recorded inThames OWF Strategic Area during aerial surveys, winter 2005/06.

Aerial Surveys of Waterbirds in Strategic Wind Farm Areas: 2005/06 Final Report 75
Figure 24 - Relative density of divers Gavia spp. recorded in North WestOWF Strategic Area during aerial surveys, Period 1.

76 Aerial Surveys of Waterbirds in Strategic Wind Farm Areas: 2005/06 Final Report
Figure 25 - Relative density of divers Gavia spp. recorded in North WestOWF Strategic Area during aerial surveys, Period 2.
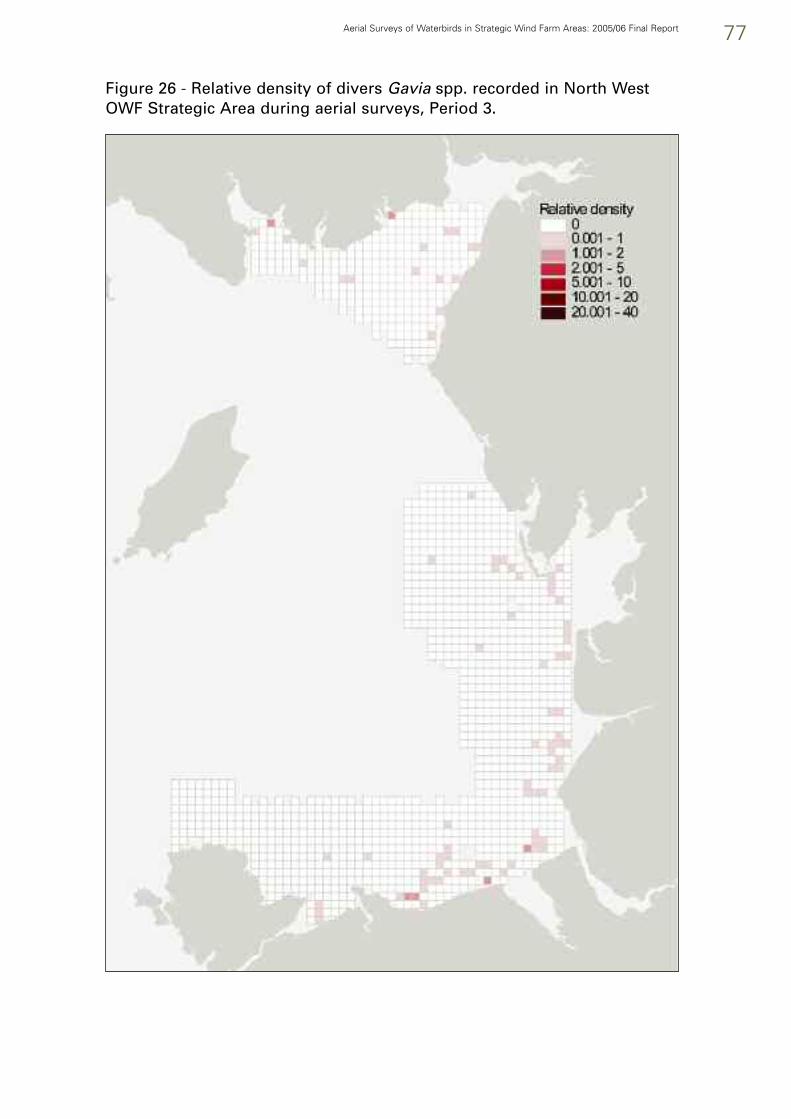
Aerial Surveys of Waterbirds in Strategic Wind Farm Areas: 2005/06 Final Report 77
Figure 26 - Relative density of divers Gavia spp. recorded in North WestOWF Strategic Area during aerial surveys, Period 3.

78 Aerial Surveys of Waterbirds in Strategic Wind Farm Areas: 2005/06 Final Report
Figure 27 - Relative density of divers Gavia spp. recorded in North WestOWF Strategic Area during aerial surveys, Period 4.

Aerial Surveys of Waterbirds in Strategic Wind Farm Areas: 2005/06 Final Report 79
Figure 28 - Relative density of divers Gavia spp. recorded in Greater WashOWF Strategic Area during aerial surveys, Period 1.

80 Aerial Surveys of Waterbirds in Strategic Wind Farm Areas: 2005/06 Final Report
Figure 29 - Relative density of divers Gavia spp. recorded in Greater WashOWF Strategic Area during aerial surveys, Period 2.

Aerial Surveys of Waterbirds in Strategic Wind Farm Areas: 2005/06 Final Report 81
Figure 30 - Relative density of divers Gavia spp. recorded in Greater WashOWF Strategic Area during aerial surveys, Period 3.

82 Aerial Surveys of Waterbirds in Strategic Wind Farm Areas: 2005/06 Final Report
Figure 31 - Relative density of divers Gavia spp. recorded in Greater WashOWF Strategic Area during aerial surveys, Period 4.

Aerial Surveys of Waterbirds in Strategic Wind Farm Areas: 2005/06 Final Report 83
Figure 32 - Relative density of divers Gavia spp. recorded in Thames OWFStrategic Area during aerial surveys, Period 1.

84 Aerial Surveys of Waterbirds in Strategic Wind Farm Areas: 2005/06 Final Report
Figure 33 - Relative density of divers Gavia spp. recorded in Thames OWFStrategic Area during aerial surveys, Period 2.

Aerial Surveys of Waterbirds in Strategic Wind Farm Areas: 2005/06 Final Report 85
Figure 34 - Relative density of divers Gavia spp. recorded in Thames OWFStrategic Area during aerial surveys, Period 3.

86 Aerial Surveys of Waterbirds in Strategic Wind Farm Areas: 2005/06 Final Report
Figure 35 - Relative density of divers Gavia spp. recorded in Thames OWFStrategic Area during aerial surveys, Period 4.

Aerial Surveys of Waterbirds in Strategic Wind Farm Areas: 2005/06 Final Report 87
Figure 36 - Relative density of little gulls Larus minutus recorded in NorthWest OWF Strategic Area during aerial surveys, winter 2005/06.

88 Aerial Surveys of Waterbirds in Strategic Wind Farm Areas: 2005/06 Final Report
Figure 37 - Relative density of little gulls Larus minutus recorded in GreaterWash OWF Strategic Area during aerial surveys, winter 2005/06.

Aerial Surveys of Waterbirds in Strategic Wind Farm Areas: 2005/06 Final Report 89
Figure 38 - Relative density of eiders Somateria mollissima recorded in GreaterWash OWF Strategic Area during aerial surveys, winter 2005/06.

90 Aerial Surveys of Waterbirds in Strategic Wind Farm Areas: 2005/06 Final Report
Figure 39 - Relative density of eiders Somateria mollissima recorded inNorth West OWF Strategic Area during aerial surveys, winter 2005/06.

Aerial Surveys of Waterbirds in Strategic Wind Farm Areas: 2005/06 Final Report 91
Figure 40 - Relative density of Manx shearwaters Puffinus puffinus recordedin North West OWF Strategic Area during aerial surveys, summer 2006.

92 Aerial Surveys of Waterbirds in Strategic Wind Farm Areas: 2005/06 Final Report
Figure 41 - Relative density of gannets Morus bassanus recorded in ThamesOWF Strategic Area during aerial surveys, winter 2005/06.

Aerial Surveys of Waterbirds in Strategic Wind Farm Areas: 2005/06 Final Report 93
Figure 42 - Relative density of gannets Morus bassanus recorded in NorthWest OWF Strategic Area during aerial surveys, summer 2006.

94 Aerial Surveys of Waterbirds in Strategic Wind Farm Areas: 2005/06 Final Report
Figure 43 - Relative density of cormorants Phalacrocorax spp. recorded inNorth West OWF Strategic Area during aerial surveys, winter 2005/06.

Aerial Surveys of Waterbirds in Strategic Wind Farm Areas: 2005/06 Final Report 95
Figure 44 - Relative density of cormorants Phalacrocorax spp. recorded inNorth West OWF Strategic Area during aerial surveys, summer 2006.

96 Aerial Surveys of Waterbirds in Strategic Wind Farm Areas: 2005/06 Final Report
Figure 45 - Relative density of gulls Larus spp. recorded in North WestOWF Strategic Area during aerial surveys, Period 1.
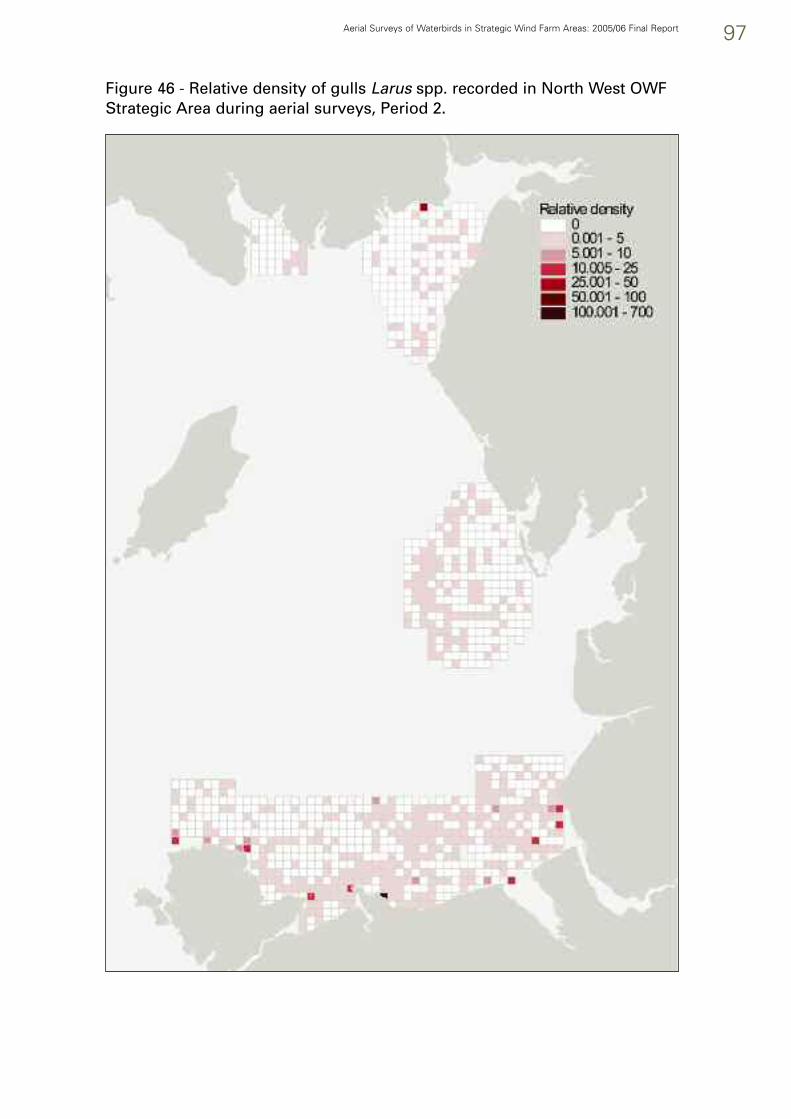
Aerial Surveys of Waterbirds in Strategic Wind Farm Areas: 2005/06 Final Report 97
Figure 46 - Relative density of gulls Larus spp. recorded in North West OWFStrategic Area during aerial surveys, Period 2.

98 Aerial Surveys of Waterbirds in Strategic Wind Farm Areas: 2005/06 Final Report
Figure 47 - Relative density of gulls Larus spp. recorded in North WestOWF Strategic Area during aerial surveys, Period 3.

Aerial Surveys of Waterbirds in Strategic Wind Farm Areas: 2005/06 Final Report 99
Figure 48 - Relative density of gulls Larus spp. recorded in North West OWFStrategic Area during aerial surveys, Period 4.

100 Aerial Surveys of Waterbirds in Strategic Wind Farm Areas: 2005/06 Final Report
Figure 49 - Relative density of gulls Larus spp. recorded in North WestOWF Strategic Area during aerial surveys, Period 5.

Aerial Surveys of Waterbirds in Strategic Wind Farm Areas: 2005/06 Final Report 101
Figure 50 - Relative density of gulls Larus spp. recorded in North West OWFStrategic Area during aerial surveys, Period 6.

102 Aerial Surveys of Waterbirds in Strategic Wind Farm Areas: 2005/06 Final Report
Figure 51 - Relative density of gulls Larus spp. recorded in North WestOWF Strategic Area during aerial surveys, Period 7.

Aerial Surveys of Waterbirds in Strategic Wind Farm Areas: 2005/06 Final Report 103
Figure 52 - Relative density of gulls Larus spp. recorded in Greater Wash OWFStrategic Area during aerial surveys, Period 1.

104 Aerial Surveys of Waterbirds in Strategic Wind Farm Areas: 2005/06 Final Report
Figure 53 - Relative density of gulls Larus spp. recorded in Greater Wash OWFStrategic Area during aerial surveys, Period 2.
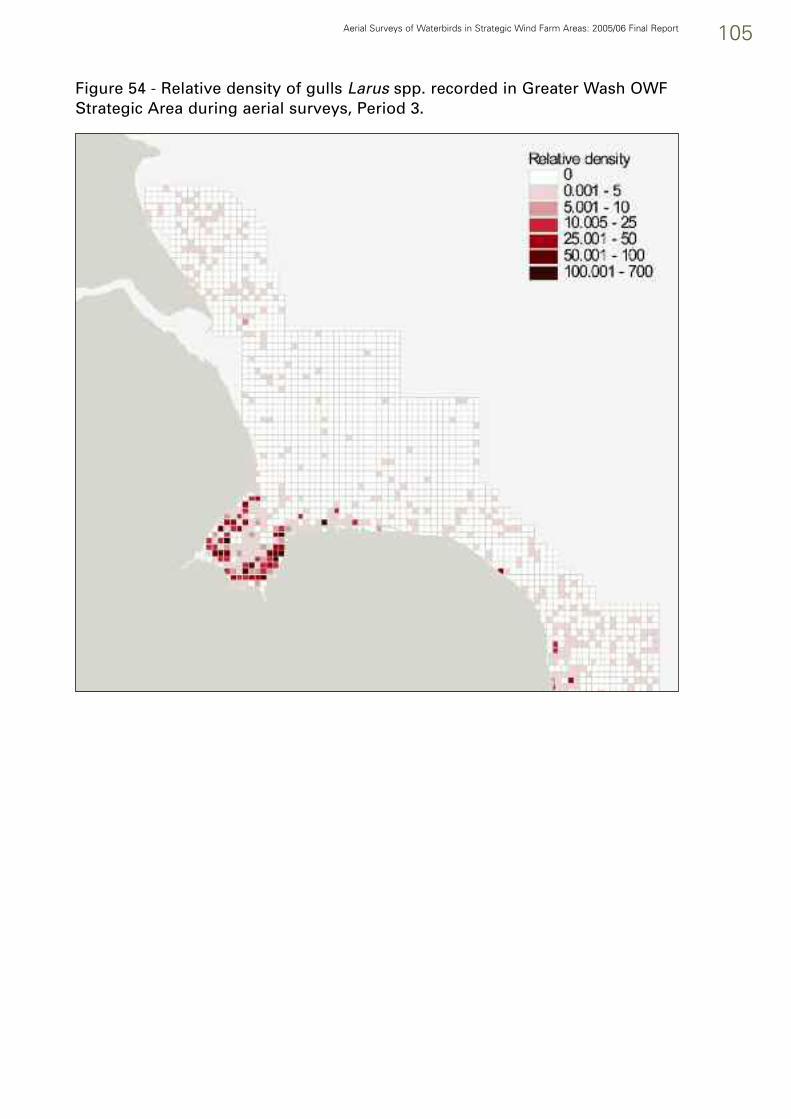
Aerial Surveys of Waterbirds in Strategic Wind Farm Areas: 2005/06 Final Report 105
Figure 54 - Relative density of gulls Larus spp. recorded in Greater Wash OWFStrategic Area during aerial surveys, Period 3.

106 Aerial Surveys of Waterbirds in Strategic Wind Farm Areas: 2005/06 Final Report
Figure 55 - Relative density of gulls Larus spp. recorded in Greater Wash OWFStrategic Area during aerial surveys, Period 4.

Aerial Surveys of Waterbirds in Strategic Wind Farm Areas: 2005/06 Final Report 107
Figure 56 - Relative density of gulls Larus spp. recorded in Greater Wash OWFStrategic Area during aerial surveys, Period 5.

108 Aerial Surveys of Waterbirds in Strategic Wind Farm Areas: 2005/06 Final Report
Figure 57 - Relative density of gulls Larus spp. recorded in Greater Wash OWFStrategic Area during aerial surveys, Period 6.

Aerial Surveys of Waterbirds in Strategic Wind Farm Areas: 2005/06 Final Report 109
Figure 58 - Relative density of gulls Larus spp. recorded in Greater Wash OWFStrategic Area during aerial surveys, Period 7.

110 Aerial Surveys of Waterbirds in Strategic Wind Farm Areas: 2005/06 Final Report
Figure 59 - Relative density of gulls Larus spp. recorded in Thames OWFStrategic Area during aerial surveys, Period 1.

Aerial Surveys of Waterbirds in Strategic Wind Farm Areas: 2005/06 Final Report 111
Figure 60 - Relative density of gulls Larus spp. recorded in Thames OWFStrategic Area during aerial surveys, Period 2.

112 Aerial Surveys of Waterbirds in Strategic Wind Farm Areas: 2005/06 Final Report
Figure 61 - Relative density of gulls Larus spp. recorded in Thames OWFStrategic Area during aerial surveys, Period 3.

Aerial Surveys of Waterbirds in Strategic Wind Farm Areas: 2005/06 Final Report 113
Figure 62 - Relative density of gulls Larus spp. recorded in Thames OWFStrategic Area during aerial surveys, Period 4.

114 Aerial Surveys of Waterbirds in Strategic Wind Farm Areas: 2005/06 Final Report
Figure 63 - Relative density of gulls Larus spp. recorded in Thames OWFStrategic Area during aerial surveys, Period 5.
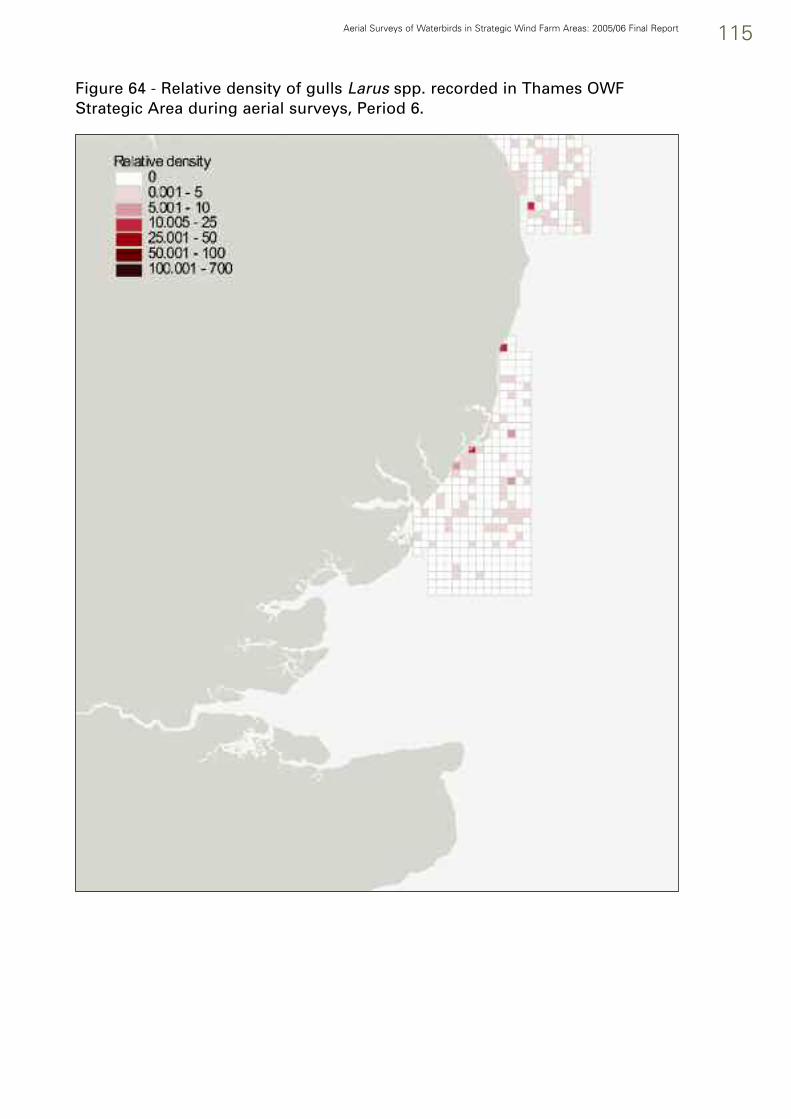
Aerial Surveys of Waterbirds in Strategic Wind Farm Areas: 2005/06 Final Report 115
Figure 64 - Relative density of gulls Larus spp. recorded in Thames OWFStrategic Area during aerial surveys, Period 6.

116 Aerial Surveys of Waterbirds in Strategic Wind Farm Areas: 2005/06 Final Report
Figure 65 - Relative density of gulls Larus spp. recorded in Thames OWFStrategic Area during aerial surveys, Period 7.
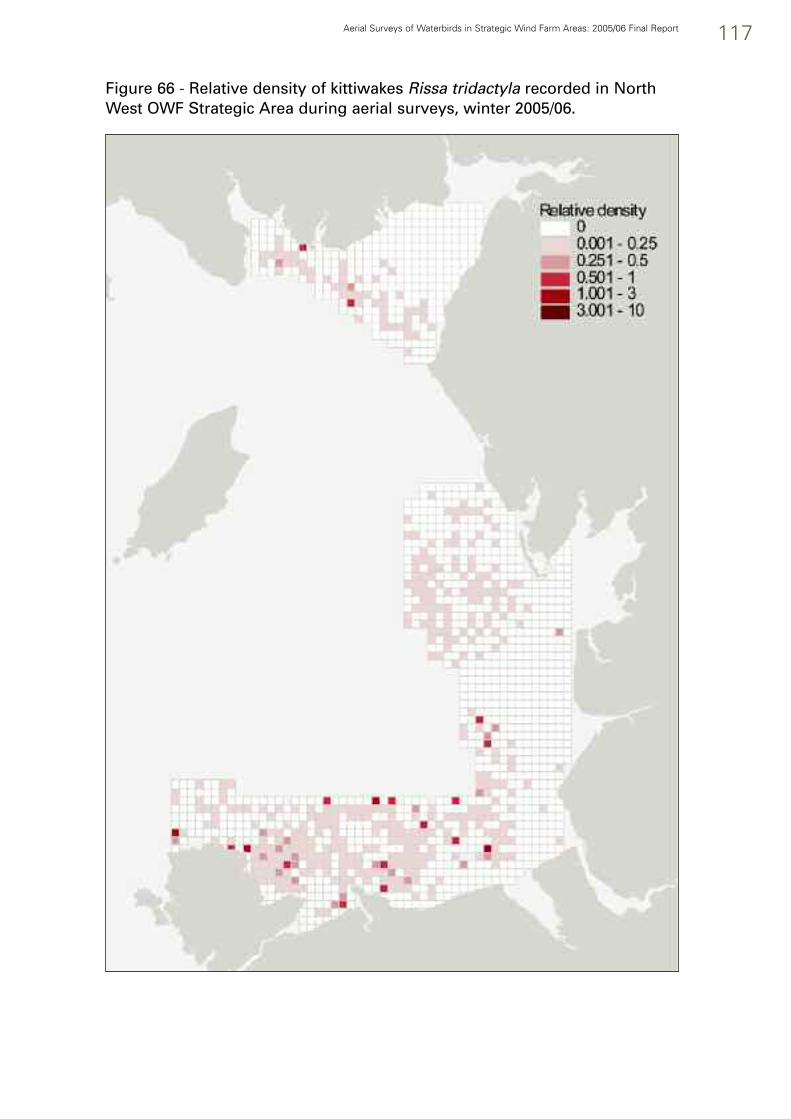
Aerial Surveys of Waterbirds in Strategic Wind Farm Areas: 2005/06 Final Report 117
Figure 66 - Relative density of kittiwakes Rissa tridactyla recorded in NorthWest OWF Strategic Area during aerial surveys, winter 2005/06.

118 Aerial Surveys of Waterbirds in Strategic Wind Farm Areas: 2005/06 Final Report
Figure 67 - Relative density of kittiwakes Rissa tridactyla recorded in NorthWest OWF Strategic Area during aerial surveys, summer 2006.

Aerial Surveys of Waterbirds in Strategic Wind Farm Areas: 2005/06 Final Report 119
Figure 68 - Relative density of kittiwakes Rissa tridactyla recorded in GreaterWash OWF Strategic Area during aerial surveys, winter 2005/06.

120 Aerial Surveys of Waterbirds in Strategic Wind Farm Areas: 2005/06 Final Report
Figure 69 - Relative density of kittiwakes Rissa tridactyla recorded in GreaterWash OWF Strategic Area during aerial surveys, summer 2006.

Aerial Surveys of Waterbirds in Strategic Wind Farm Areas: 2005/06 Final Report 121
Figure 70 - Relative density of Kittiwakes Rissa tridactyla recorded in ThamesOWF Strategic Area during aerial surveys, winter 2005/06.

122 Aerial Surveys of Waterbirds in Strategic Wind Farm Areas: 2005/06 Final Report
Figure 71 - Relative density of kittiwakes Rissa tridactyla recorded in ThamesOWF Strategic Area during aerial surveys, summer 2006.

Aerial Surveys of Waterbirds in Strategic Wind Farm Areas: 2005/06 Final Report 123
Figure 72 - Relative density of terns Sterna spp. recorded in Greater Wash OWFStrategic Area during aerial surveys, summer 2005.

124 Aerial Surveys of Waterbirds in Strategic Wind Farm Areas: 2005/06 Final Report
Figure 73 - Relative density of terns Sterna spp. recorded in North West OWFStrategic Area during aerial surveys, summer 2006.
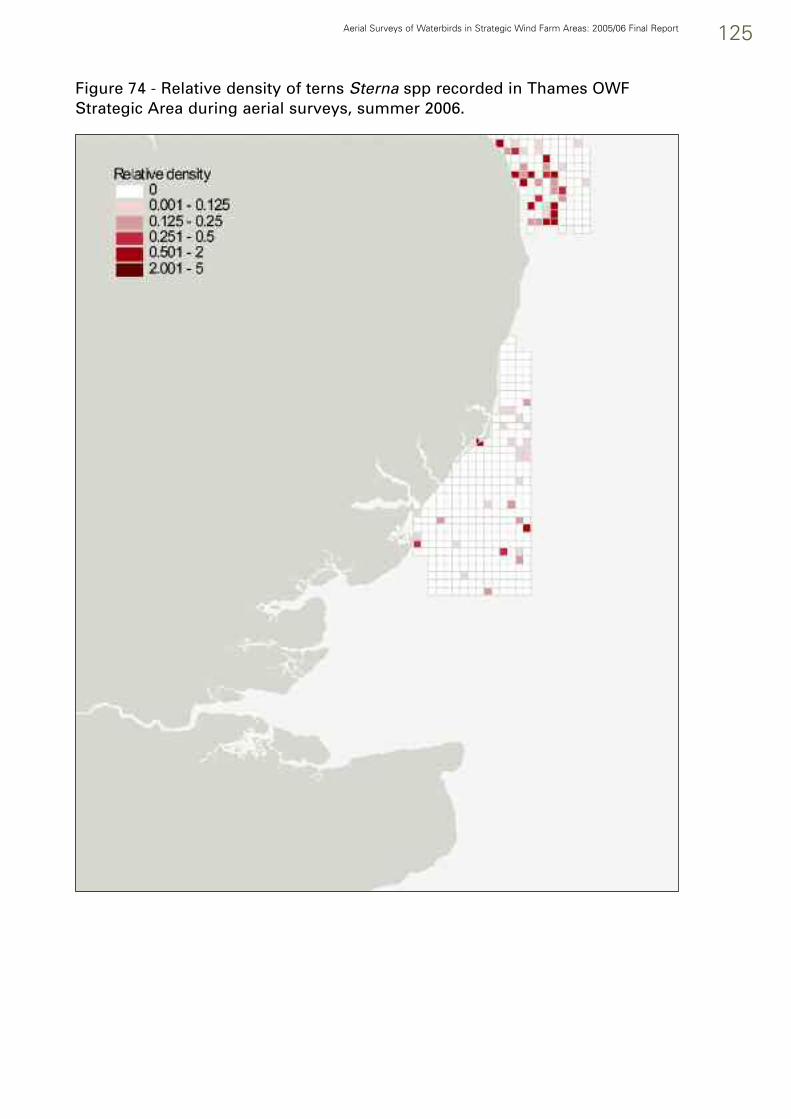
Aerial Surveys of Waterbirds in Strategic Wind Farm Areas: 2005/06 Final Report 125
Figure 74 - Relative density of terns Sterna spp recorded in Thames OWFStrategic Area during aerial surveys, summer 2006.

126 Aerial Surveys of Waterbirds in Strategic Wind Farm Areas: 2005/06 Final Report
Figure 75 - Relative density of auks Uria/Alca/Fratercula spp. recorded inNorth West OWF Strategic Area during aerial surveys, Period 1.

Aerial Surveys of Waterbirds in Strategic Wind Farm Areas: 2005/06 Final Report 127
Figure 76 - Relative density of auks Uria/Alca/Fratercula spp. recorded inNorth West OWF Strategic Area during aerial surveys, Period 2.

128 Aerial Surveys of Waterbirds in Strategic Wind Farm Areas: 2005/06 Final Report
Figure 77 - Relative density of auks Uria/Alca/Fratercula spp. recorded inNorth West OWF Strategic Area during aerial surveys, Period 3.

Aerial Surveys of Waterbirds in Strategic Wind Farm Areas: 2005/06 Final Report 129
Figure 78 - Relative density of auks Uria/Alca/Fratercula spp. recorded inNorth West OWF Strategic Area during aerial surveys, Period 4.

130 Aerial Surveys of Waterbirds in Strategic Wind Farm Areas: 2005/06 Final Report
Figure 79 - Relative density of auks Uria/Alca/Fratercula spp. recorded inNorth West OWF Strategic Area during aerial surveys, Period 5.

Aerial Surveys of Waterbirds in Strategic Wind Farm Areas: 2005/06 Final Report 131
Figure 80 - Relative density of auks Uria/Alca/Fratercula spp. recorded inNorth West OWF Strategic Area during aerial surveys, Period 6.

132 Aerial Surveys of Waterbirds in Strategic Wind Farm Areas: 2005/06 Final Report
Figure 81 - Relative density of auks Uria/Alca/Fratercula spp. recorded inNorth West OWF Strategic Area during aerial surveys, Period 7.

Aerial Surveys of Waterbirds in Strategic Wind Farm Areas: 2005/06 Final Report 133
Figure 82 - Relative density of auks Uria/Alca/Fratercula spp. recorded inGreater Wash OWF Strategic Area during aerial surveys, Period 1.

134 Aerial Surveys of Waterbirds in Strategic Wind Farm Areas: 2005/06 Final Report
Figure 83 - Relative density of auks Uria/Alca/Fratercula spp. recorded inGreater Wash OWF Strategic Area during aerial surveys, Period 2.

Aerial Surveys of Waterbirds in Strategic Wind Farm Areas: 2005/06 Final Report 135
Figure 84 - Relative density of auks Uria/Alca/Fratercula spp. recorded inGreater Wash OWF Strategic Area during aerial surveys, Period 3.

136 Aerial Surveys of Waterbirds in Strategic Wind Farm Areas: 2005/06 Final Report
Figure 85 - Relative density of auks Uria/Alca/Fratercula spp. recorded inGreater Wash OWF Strategic Area during aerial surveys, Period 4.

Aerial Surveys of Waterbirds in Strategic Wind Farm Areas: 2005/06 Final Report 137
Figure 86 - Relative density of auks Uria/Alca/Fratercula spp. recorded inGreater Wash OWF Strategic Area during aerial surveys, Period 5.

138 Aerial Surveys of Waterbirds in Strategic Wind Farm Areas: 2005/06 Final Report
Figure 87 - Relative density of auks Uria/Alca/Fratercula spp. recorded inGreater Wash OWF Strategic Area during aerial surveys, Period 6.

Aerial Surveys of Waterbirds in Strategic Wind Farm Areas: 2005/06 Final Report 139
Figure 88 - Relative density of auks Uria/Alca/Fratercula spp. recorded inGreater Wash OWF Strategic Area during aerial surveys, Period 7.

140 Aerial Surveys of Waterbirds in Strategic Wind Farm Areas: 2005/06 Final Report
Figure 89 - Relative density of auks Uria/Alca/Fratercula spp. recorded inThames OWF Strategic Area during aerial surveys, Period 1.

Aerial Surveys of Waterbirds in Strategic Wind Farm Areas: 2005/06 Final Report 141
Figure 90 - Relative density of auks Uria/Alca/Fratercula spp. recorded inThames OWF Strategic Area during aerial surveys, Period 2.
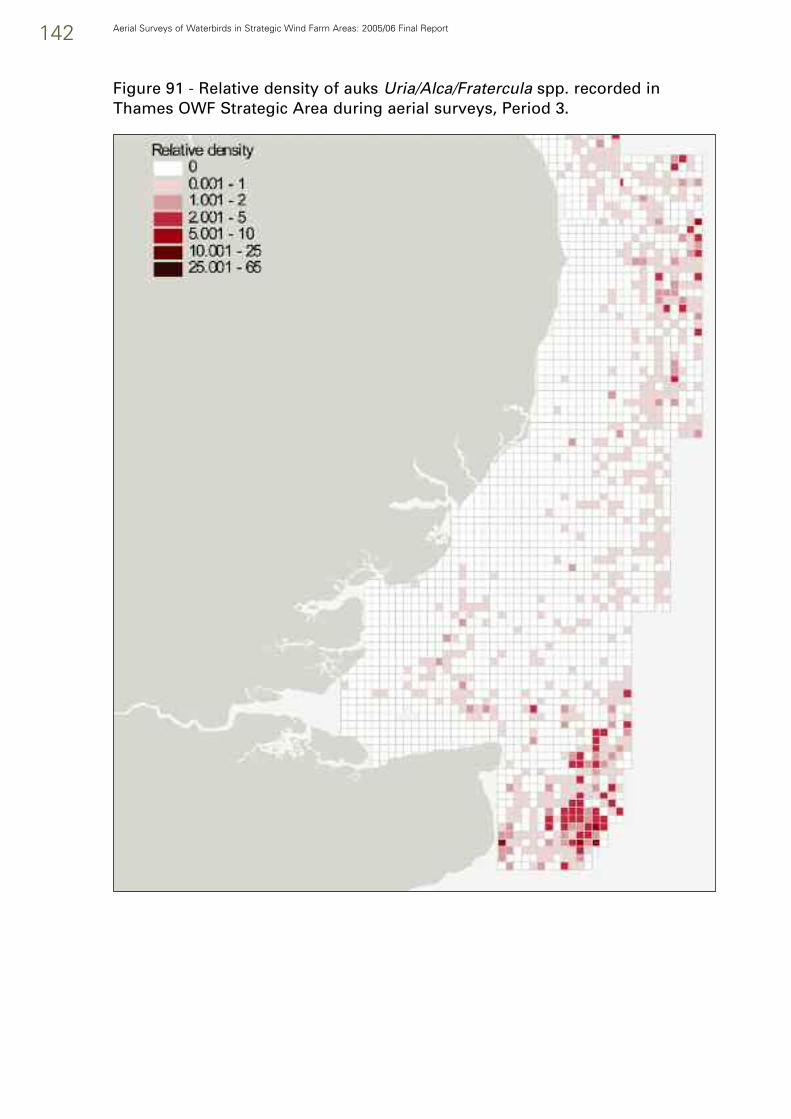
142 Aerial Surveys of Waterbirds in Strategic Wind Farm Areas: 2005/06 Final Report
Figure 91 - Relative density of auks Uria/Alca/Fratercula spp. recorded inThames OWF Strategic Area during aerial surveys, Period 3.

Aerial Surveys of Waterbirds in Strategic Wind Farm Areas: 2005/06 Final Report 143
Figure 92 - Relative density of auks Uria/Alca/Fratercula spp. recorded inThames OWF Strategic Area during aerial surveys, Period 4.

144 Aerial Surveys of Waterbirds in Strategic Wind Farm Areas: 2005/06 Final Report
Figure 93 - Relative density of auks Uria/Alca/Fratercula spp. recorded inThames OWF Strategic Area during aerial surveys, Period 5.

Aerial Surveys of Waterbirds in Strategic Wind Farm Areas: 2005/06 Final Report 145
Figure 94 - Relative density of auks Uria/Alca/Fratercula spp. recorded inThames OWF Strategic Area during aerial surveys, Period 7.

146 Aerial Surveys of Waterbirds in Strategic Wind Farm Areas: 2005/06 Final Report
Tables
Tables presenting total numbers (Tables 5-7, 8, 10, 12 & 13-33) are not absolutenumbers of birds in the survey area, which need to be calculated using‘distance’, to allow for the numbers of birds missed with increasing distancefrom the plane.
Estimated numbers of common scoter and divers, presented in tables 9 and 11respectively, were calculated using Distance 5.0. Estimates were calculated forbirds off the East coast (Strategic Areas Greater Wash and Thames combined)and west coast (Strategic Area North West). Estimates for survey blocksholding significant numbers of each species are also given. Areas withinsufficient data to allow estimates to be calculated were excluded.

Aerial Surveys of Waterbirds in Strategic Wind Farm Areas: 2005/06 Final Report 147
Table 1 - Survey periods used for aerial surveys in 2005/06
Survey Period Description Dates
1 Early winter 17 October – 20 November2 Mid winter (1) 21 November – 31 December3 Mid winter (2) 1 January – 12 February4 Late winter 13 February – 12 March5 Breeding: incubation 8 May – 4 June6 Breeding: chick rearing 5 June – 9 July7 Post fledging/moult 10 July – 20 August
Table 2 - Dates of survey flights in the North West Strategic Area, Periods 1-7
North West NW1 NW3 NW4 NW5 NW6a NW6b
Period 1 08 Nov 20 Oct - 10 Nov 19 Oct 19 OctPeriod 2 13 Dec 02 Dec - 22 Nov/ 08 Dec 22 Nov
8 DecPeriod 3 02 Feb 11 Jan 03 Feb 01 Feb 17 Jan 17 JanPeriod 4 20 Feb 14 Feb - 06 Mar 14 Feb 14 FebPeriod 5 - - 01 Jun - - -Period 6 - 23 Jun 27 Jun 27 Jun - -Period 7 - - 26 Jul - - -

148 Aerial Surveys of Waterbirds in Strategic Wind Farm Areas: 2005/06 Final Report
Table 4 - Dates of survey flights in the Thames Strategic Area, Periods 1-7
Thames TH1 TH2 TH3 TH4 TH5 TH6 TH7
Period 1 13 Nov 16 Nov 16 Nov - - 17 Nov 17 Nov
Period 2 11 Dec 06 Dec 08 Dec - - 07 Dec 09 Dec
Period 3 14 Jan 13 Jan 10 Feb 10 Feb 11 Feb 13 Jan 18 Jan
Period 4 18 Feb 02 Mar 03 Mar 09 Mar 09 Mar 02 Mar 07 Mar
Period 5 - - - 04 Jun - - -
Period 6 - - - 22 Jun - - -
Period 7 - - - 10 Aug - - -
Table 3 - Dates of survey flights in the Greater Wash Strategic Area, Periods 1-7
Greater Wash GW1a GW1b GW2 GW3 GW4 GW5 GW6 GW7
Period 1 - - 18 Nov 07 Nov 09 Nov 15 Nov 15 Nov 27 Nov
Period 2 28 Nov 28 Nov 14 Dec 29 Nov 29 Nov 30 Nov 30 Nov 10 Dec
Period 3 19 Jan 19 Jan 19 Jan 12 Jan 12 Jan 18 Jan 02/11 Feb 15 Jan
Period 4 11 Mar 11 Mar 14 Mar 19 Feb 04 Mar 16 Mar 10/11 Mar 11 Mar
Period 5 - - - 25 May 02 Jun 01 Jun 03 Jun -
Period 6 - - - 28 Jun 20 Jun 21 Jun 23 Jun -
Period 7 - - - 19 Aug 09/19 Aug 26 Jul 27 Jul -

Aerial Surveys of Waterbirds in Strategic Wind Farm Areas: 2005/06 Final Report 149
Table 5 - Totals numbers of all species in the North West Strategic Area,Periods 1-7
Species Period 1 Period 2 Period 3 Period 4 Period 5 Period 6 Period 7
mute swan 10whooper swan 1pink-footed goose 1greylag goose 17barnacle goose 71brent goose 40shelduck 10 1 3wigeon 25mallard 5pochard 1scaup 15 1eider 28 986 41 739 174common scoter 5,567 4,410 24,424 6,646 502 309velvet scoter 5 8goldeneye 2duck sp. 1 7 3red-breasted merganser 15 23 27 35 1diver sp. 135 167 115 126red-throated diver 20 31 30great northern diver 5great crested grebe 1 3grebe sp. 5 44 1 11fulmar 6 19 35 23 2 6 1Manx shearwater 6 337 337gannet 96 5 61 13 278 357British storm-petrel 1cormorant 586 687 386 222 20 169 14shag 8 15 40 61 25cormorant/shag 8 6 24 21 17 1oystercatcher 838 223 679 86 41 19 59lapwing 15dunlin 5curlew 2 11wader sp. 1 25 800 1,890small wader sp. 22 591 9medium wader sp. 25 1large wader sp. 1great skua 1skua sp. 1little gull 1 51 46black-headed gull 44 109 18 22 1 49 288common gull 89 53 42 60 1 5 76lesser black-backed gull 12 26 1 5 407 189 218herring gull 88 387 360 94 299 665 61great black-backed gull 26 21 45 30 6 20 12kittiwake 232 325 146 183 36 281 112grey gull spp. 560 184 116 205 34 30 196black-backed gull spp 19 53 16 40 13 83 23large gull sp. 2 76 49 85 142 138 13small gull sp. 13 186 45 71 6 28 1gull sp. 139 253 345 488 420 128 171Sandwich tern 12 26 14Arctic/common tern 2 6 14tern sp. 15 3 5guillemot 6 2 3 26razorbill 4 1auk sp. 2,119 2,360 1,670 1,872 142 934 229magpie 1carrion crow 2 3passerine sp. 1 2

150 Aerial Surveys of Waterbirds in Strategic Wind Farm Areas: 2005/06 Final Report
Table 6 - Total number of all species in the Greater Wash Strategic Area,Periods 1-7
Species Period 1 Period 2 Period 3 Period 4 Period 5 Period 6 Period 7
mute swan 2 1 13canada goose 1brent goose 259 645 290 595goose sp. 22 179shelduck 688 1,209 1,990 1,013 59 40 4wigeon 48 440 644 10teal 57 45mallard 74 82 83 13 2pintail 14 2dabbling ducks 9pochard 1scaup 45eider 1,105 1,122 2,358 1,127common scoter 1,361 2,522 955 2,565 40 106velvet scoter 2 3goldeneye 2duck sp. 6 572 533 106 1 4red-breasted merganser 5 9 13 33 2diver sp. 105 80 267 301red-throated diver 28 12 34 70great northern diver 1 2 1great crested grebe 1 2grebe sp. 6 1 4fulmar 23 72 28 80 48 16 14gannet 199 7 43 63 75 72 230cormorant 54 57 78 25 79 10 34shag 2 2cormorant/shag 2 3 1 5 4little egret 5 8 7grey heron 2kestrel 1oystercatcher 2,445 2,389 2,919 3,116 306 272 162grey plover 1lapwing 1 286 2knot 45 760 15dunlin 130 6bar-tailed godwit 14 336curlew 1 87 53 16 9wader sp. 3,601 1,198 4,724 4,356 276 22 67small wader sp. 9,771 2,696 2,509 5,670 69 8 38medium wader sp. 669 599 700 50 10 23large wader sp. 374 401 27 2 55pomarine skua 1Arctic skua 3great skua 4 5little gull 222 33 11 3black-headed gull 99 108 802 306 243 229 228common gull 38 117 202 220 2 6lesser black-backed gull 13 12 12 5 9 56 27herring gull 159 123 489 483 132 37 43great black-backed gull 31 55 48 10 4 7kittiwake 506 201 62 87 44 101 86grey gull spp 234 150 1,304 468 100 30 79black-backed gull spp 64 61 82 10 9 7 13large gull sp. 65 25 26 30 28 63 77small gull sp. 175 130 189 43 49 21 123gull sp. 636 231 6,713 2,531 734 60 378Sandwich tern 185 209 59Arctic/common tern 3 49 118 48little tern 27 7 16tern sp. 8 185 93 325guillemot 4 36razorbill 2 1auk sp. 1,208 754 775 424 220 153 1,052feral pigeon 1 52wood pigeon 178 14 15fieldfare 1jay 1carrion crow 2 1passerine sp. 25 1 42
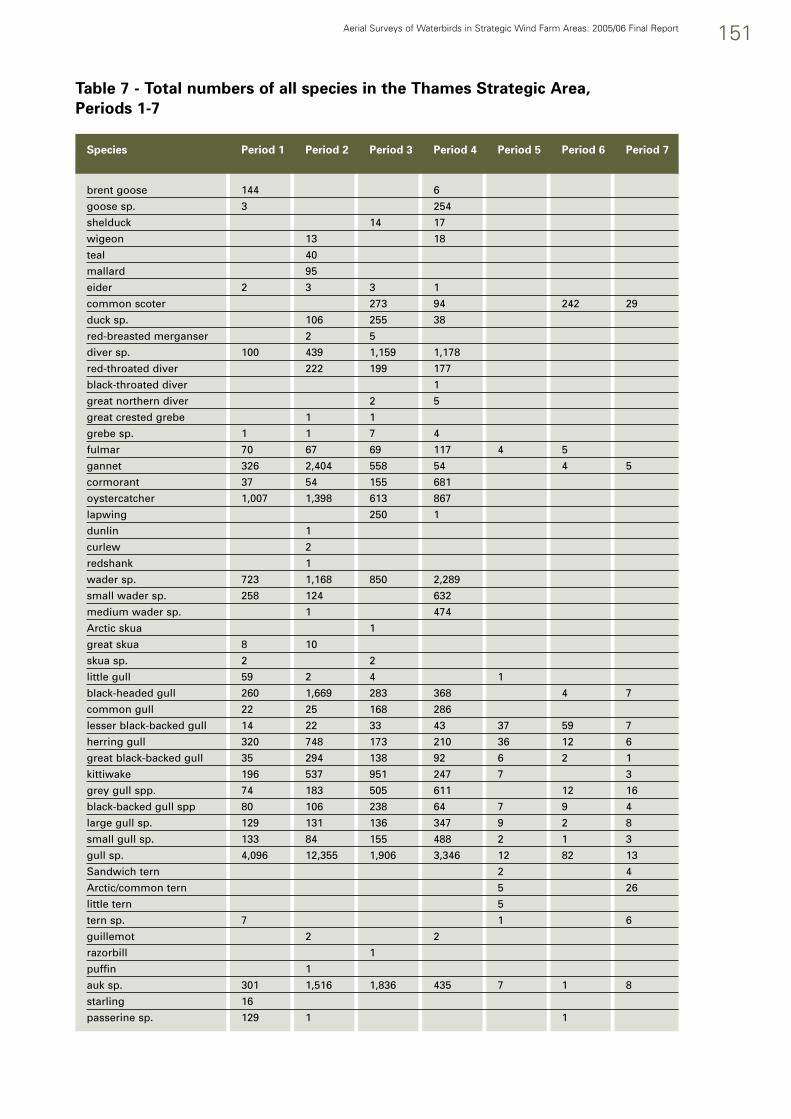
Aerial Surveys of Waterbirds in Strategic Wind Farm Areas: 2005/06 Final Report 151
Table 7 - Total numbers of all species in the Thames Strategic Area,Periods 1-7
Species Period 1 Period 2 Period 3 Period 4 Period 5 Period 6 Period 7
brent goose 144 6
goose sp. 3 254
shelduck 14 17
wigeon 13 18
teal 40
mallard 95
eider 2 3 3 1
common scoter 273 94 242 29
duck sp. 106 255 38
red-breasted merganser 2 5
diver sp. 100 439 1,159 1,178
red-throated diver 222 199 177
black-throated diver 1
great northern diver 2 5
great crested grebe 1 1
grebe sp. 1 1 7 4
fulmar 70 67 69 117 4 5
gannet 326 2,404 558 54 4 5
cormorant 37 54 155 681
oystercatcher 1,007 1,398 613 867
lapwing 250 1
dunlin 1
curlew 2
redshank 1
wader sp. 723 1,168 850 2,289
small wader sp. 258 124 632
medium wader sp. 1 474
Arctic skua 1
great skua 8 10
skua sp. 2 2
little gull 59 2 4 1
black-headed gull 260 1,669 283 368 4 7
common gull 22 25 168 286
lesser black-backed gull 14 22 33 43 37 59 7
herring gull 320 748 173 210 36 12 6
great black-backed gull 35 294 138 92 6 2 1
kittiwake 196 537 951 247 7 3
grey gull spp. 74 183 505 611 12 16
black-backed gull spp 80 106 238 64 7 9 4
large gull sp. 129 131 136 347 9 2 8
small gull sp. 133 84 155 488 2 1 3
gull sp. 4,096 12,355 1,906 3,346 12 82 13
Sandwich tern 2 4
Arctic/common tern 5 26
little tern 5
tern sp. 7 1 6
guillemot 2 2
razorbill 1
puffin 1
auk sp. 301 1,516 1,836 435 7 1 8
starling 16
passerine sp. 129 1 1

152 Aerial Surveys of Waterbirds in Strategic Wind Farm Areas: 2005/06 Final Report
Table 8 - Numbers of Common Scoter recorded in Periods 1-7
Survet Block Period 1 Period 2 Period 3 Period 4 Period 5 Period 6 Period 7
NW1 880 284 982 566
NW3 11 41 507 387 0
NW4 14,029 0 79 309
NW5 3,963 2,588 6,623 4,589 423
NW6a 418 1,173 1,237 532
NW6b 295 324 1,046 572
North West Total 5,567 4,410 24,424 6,646 0 502 309
GW1a 0 0 3
GW1b 0 0 0
GW2 5 0 0 0
GW4 0 205 950 1,272 40 0 101
GW5 0 0 0 0 0 0 0
GW6 45 0 0 0 0 0 5
GW7 1,311 2,317 5 1,290 -
Greater Wash Total 1,361 2,522 955 2,565 40 0 106
TH1 0 0 249 94
TH2 0 0 24 0
TH3 0 0 0 0
TH4 0 0 0 242 29
TH5 0 0
TH6 0 0 0 0
TH7 0 0 0 0
Thames Total 0 0 273 94 0 242 29

Aerial Surveys of Waterbirds in Strategic Wind Farm Areas: 2005/06 Final Report 153
Table 9 - Estimates of Common Scoter numbers (with 95% bootstrapconfidence intervals) for each period off the East coast and West coast
Survey Block Estimate Lower Confidence Upper ConfidenceInterval Interval
Period 1 east 4,503 1,329 15,285Period 1 west 13,180 6,904 25,170NW5 10,737 4,941 23,332Period 2 east 8,572 2,491 29,430Period 2 west 13,089 9,146 17,551NW6a & NW5 9,657 6,359 13,363Period 3 east 1,868 502 6,917Period 3 west 61,416 32,618 115,624NW4 34,448 12,050 66,821NW5 13,643 5,552 24,004Period 4 east 5,008 1,216 20,528Period 4 west 14,079 9,757 19,117NW5 7,986 4,814 11,721Period 7 west 878 259 1,687
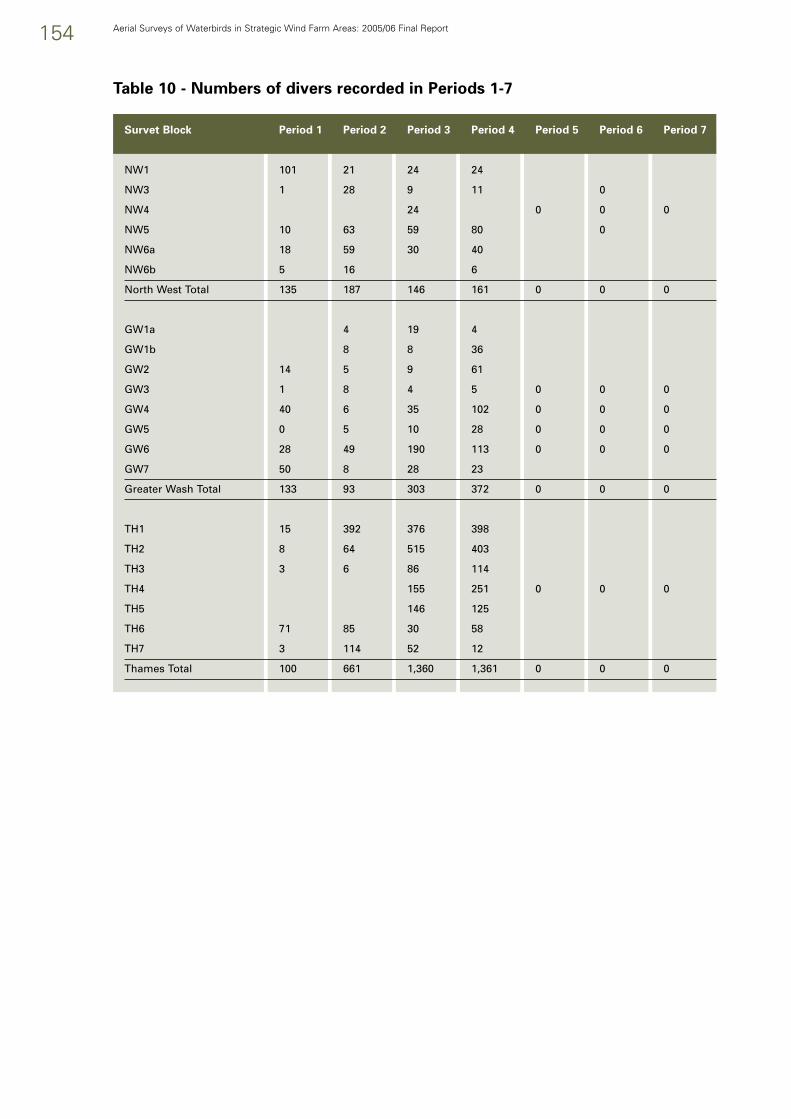
154 Aerial Surveys of Waterbirds in Strategic Wind Farm Areas: 2005/06 Final Report
Table 10 - Numbers of divers recorded in Periods 1-7
Survet Block Period 1 Period 2 Period 3 Period 4 Period 5 Period 6 Period 7
NW1 101 21 24 24
NW3 1 28 9 11 0
NW4 24 0 0 0
NW5 10 63 59 80 0
NW6a 18 59 30 40
NW6b 5 16 6
North West Total 135 187 146 161 0 0 0
GW1a 4 19 4
GW1b 8 8 36
GW2 14 5 9 61
GW3 1 8 4 5 0 0 0
GW4 40 6 35 102 0 0 0
GW5 0 5 10 28 0 0 0
GW6 28 49 190 113 0 0 0
GW7 50 8 28 23
Greater Wash Total 133 93 303 372 0 0 0
TH1 15 392 376 398
TH2 8 64 515 403
TH3 3 6 86 114
TH4 155 251 0 0 0
TH5 146 125
TH6 71 85 30 58
TH7 3 114 52 12
Thames Total 100 661 1,360 1,361 0 0 0

Aerial Surveys of Waterbirds in Strategic Wind Farm Areas: 2005/06 Final Report 155
Table 11 - Estimates of diver numbers (with 95% bootstrap confidenceintervals) for each period off the East coast and West coast
Survey Block Estimate Lower Confidence Upper ConfidenceInterval Interval
Period 1 east 1,319 949 1,750TH6 292 178 430Period 1 west 838 548 1,210NW1 606 415 847Period 2 east 3,483 2,938 4,038Period 2 west 1,518 981 2,163NW6a & NW5 885 485 1,386Period 3 east 7,998 6,609 9,661TH2 2,254 1,301 3,907TH1 1,913 1,562 2,341Period 2 west 808 548 1,070NW5 272 142 426Period 4 east 7,768 2,781 10,097TH1 1,724 580 2,469TH2 1,441 512 2,076Period 4 west 1,145 624 1,292NW5 580 260 740

156 Aerial Surveys of Waterbirds in Strategic Wind Farm Areas: 2005/06 Final Report
Table 12 - Number of Little Gulls recorded in Periods 1-7
Survet Block Period 1 Period 2 Period 3 Period 4 Period 5 Period 6 Period 7
NW1 0 0 0 0
NW3 0 0 21 0 0
NW4 21 0 0 0
NW5 1 0 0 32 0
NW6a 0 0 9 14
NW6b 0 0 0 0
North West Total 1 0 51 46 0 0 0
GW1a 0 0 0
GW1b 1 0 0
GW2 0 0 0 0
GW3 0 12 0 0 0 0 0
GW4 209 10 9 3 0 0 0
GW5 13 4 2 0 0 0 0
GW6 0 6 0 0 0 0 0
GW7 0 0 0 0
Greater Wash Total 222 33 11 3 0 0 0
TH1 0 0 0 0
TH2 0 0 2 0
TH3 27 0 0 0
TH4 0 0 1 0 0
TH5 0 0
TH6 0 1 1 0
TH7 32 1 1 0
Thames Total 59 2 4 0 1 0 0
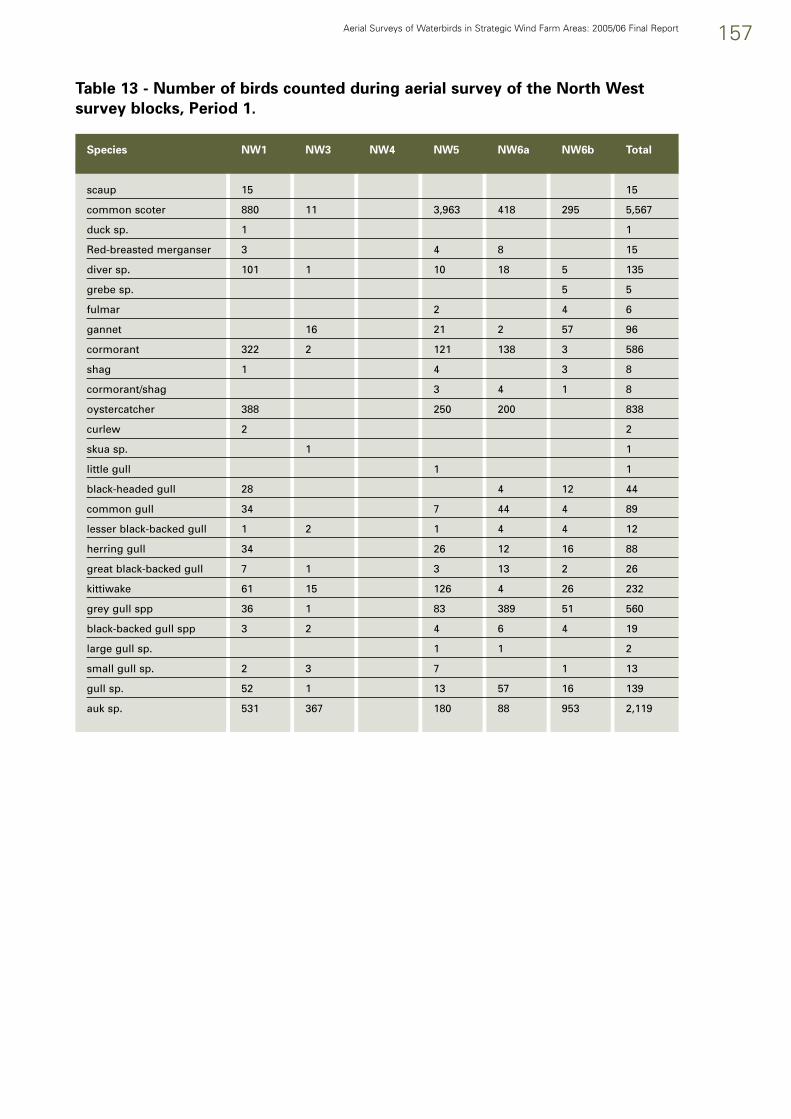
Aerial Surveys of Waterbirds in Strategic Wind Farm Areas: 2005/06 Final Report 157
Table 13 - Number of birds counted during aerial survey of the North Westsurvey blocks, Period 1.
Species NW1 NW3 NW4 NW5 NW6a NW6b Total
scaup 15 15
common scoter 880 11 3,963 418 295 5,567
duck sp. 1 1
Red-breasted merganser 3 4 8 15
diver sp. 101 1 10 18 5 135
grebe sp. 5 5
fulmar 2 4 6
gannet 16 21 2 57 96
cormorant 322 2 121 138 3 586
shag 1 4 3 8
cormorant/shag 3 4 1 8
oystercatcher 388 250 200 838
curlew 2 2
skua sp. 1 1
little gull 1 1
black-headed gull 28 4 12 44
common gull 34 7 44 4 89
lesser black-backed gull 1 2 1 4 4 12
herring gull 34 26 12 16 88
great black-backed gull 7 1 3 13 2 26
kittiwake 61 15 126 4 26 232
grey gull spp 36 1 83 389 51 560
black-backed gull spp 3 2 4 6 4 19
large gull sp. 1 1 2
small gull sp. 2 3 7 1 13
gull sp. 52 1 13 57 16 139
auk sp. 531 367 180 88 953 2,119

158 Aerial Surveys of Waterbirds in Strategic Wind Farm Areas: 2005/06 Final Report
Table 14 - Number of birds counted during aerial survey of the North Westsurvey blocks, Period 2
Species NW1 NW3 NW4 NW5 NW6a NW6b Total
mute swan 1 9 10
greylag goose 17 17
brent goose 40 40
mallard 5 5
pochard 1 1
scaup 1 1
eider 13 15 28
common scoter 284 41 2,588 1,173 324 4,410
velvet scoter 5 5
red-breasted merganser 2 20 1 23
diver sp. 21 28 60 53 5 167
red-throated diver 3 6 11 20
great crested grebe 1 1
grebe sp. 24 4 16 44
fulmar 2 13 4 19
gannet 2 3 5
cormorant 156 4 131 393 3 687
shag 11 4 15
cormorant/shag 5 1 6
oystercatcher 217 6 223
curlew 11 11
wader sp. 1 1
small wader sp. 9 13 22
large wader sp. 1 1
black-headed gull 6 20 43 40 109
common gull 28 12 4 9 53
lesser black-backed gull 1 16 7 2 26
herring gull 22 8 228 107 22 387
great black-backed gull 1 1 5 10 4 21
kittiwake 8 88 155 9 65 325
grey gull spp 99 6 71 4 4 184
black-backed gull spp 11 1 13 24 4 53
large gull sp. 7 44 18 7 76
small gull sp. 15 18 47 106 186
gull sp. 12 35 113 80 13 253
auk sp. 126 559 1,065 26 584 2,360
magpie 1

Aerial Surveys of Waterbirds in Strategic Wind Farm Areas: 2005/06 Final Report 159
Table 15 - Number of birds counted during aerial survey of the North Westsurvey blocks, Period 3
Species NW1 NW3 NW4 NW5 NW6a NW6b Total
whooper swan 1 1
pink-footed goose 1 1
barnacle goose 71 71
shelduck 10 10
wigeon 22 3 25
eider 1 904 81 986
common scoter 982 507 14,029 6,623 1,237 1,046 24,424
velvet scoter 8 8
goldeneye 2 2
duck sp. 3 4 7
red-breasted merganser 2 7 11 7 27
diver sp. 24 7 16 56 12 115
red-throated diver 2 8 3 18 31
grebe sp. 1 1
fulmar 6 13 13 3 35
cormorant 29 1 43 56 257 386
shag 39 1 40
cormorant/shag 3 18 2 1 24
oystercatcher 399 204 76 679
wader sp. 25 25
small wader sp. 255 336 591
medium wader sp. 25 25
little gull 21 21 9 51
black-headed gull 8 9 1 18
common gull 13 14 14 1 42
lesser black-backed gull 1 1
herring gull 72 14 201 70 2 1 360
great black-backed gull 4 1 12 15 13 45
kittiwake 8 39 20 45 6 28 146
grey gull spp 32 12 47 21 3 1 116
black-backed gull spp 1 2 1 8 4 16
large gull sp. 13 7 9 17 3 49
small gull sp. 8 3 13 20 1 45
gull sp. 169 6 40 86 39 5 345
guillemot 6 6
razorbill 4 4
auk sp. 132 90 303 846 105 194 1,670
Carrion Crow 2

160 Aerial Surveys of Waterbirds in Strategic Wind Farm Areas: 2005/06 Final Report
Table 16 - Number of birds counted during aerial survey of the North Westsurvey blocks, Period 4
Species NW1 NW3 NW4 NW5 NW6a NW6b Total
shelduck 1 1
eider 37 4 41
common scoter 566 387 4,589 532 572 6,646
duck sp. 3 3
red-breasted merganser 15 14 6 35
diver sp. 23 11 55 32 5 126
red-throated diver 24 6 30
great northern diver 1 1 2 1 5
great crested grebe 3 3
grebe sp. 2 9 11
fulmar 3 12 8 23
gannet 58 1 2 61
cormorant 17 67 135 3 222
shag 59 2 61
cormorant/shag 3 1 15 2 21
oystercatcher 86 86
wader sp. 250 550 800
small wader sp. 9 9
little gull 32 14 46
black-headed gull 18 4 22
common gull 22 4 27 7 60
lesser black-backed gull 1 3 1 5
herring gull 1 80 9 4 94
great black-backed gull 3 4 12 11 30
kittiwake 5 4 29 2 143 183
grey gull spp 92 6 82 17 8 205
black-backed gull spp 3 32 3 2 40
large gull sp. 2 36 27 13 7 85
small gull sp. 12 22 20 4 13 71
gull sp. 89 52 48 46 253 488
guillemot 2 2
razorbill 1 1
auk sp. 228 183 799 63 599 1,872
carrion crow 3 3
passerine sp. 1 1

Aerial Surveys of Waterbirds in Strategic Wind Farm Areas: 2005/06 Final Report 161
Table 17 - Number of birds counted during aerial survey of the North Westsurvey blocks, Period 5
Species NW1 NW3 NW4 NW5 NW6a NW6b Total
eider 739 739
fulmar 2 2
Manx shearwater 6 6
gannet 13 13
cormorant 20 20
oystercatcher 41 41
black-headed gull 1 1
common gull 1 1
lesser black-backed gull 407 407
herring gull 299 299
great black-backed gull 6 6
kittiwake 36 36
grey gull spp 34 34
black-backed gull spp 13 13
large gull sp. 142 142
small gull sp. 6 6
gull sp. 420 420
Sandwich tern 12 12
Arctic/common tern 2 2
tern sp. 15 15
guillemot 3 3
auk sp. 142 142

162 Aerial Surveys of Waterbirds in Strategic Wind Farm Areas: 2005/06 Final Report
Table 18 - Number of birds counted during aerial survey of the North Westsurvey blocks, Period 6
Species NW1 NW3 NW4 NW5 NW6a NW6b Total
shelduck 3 3
common scoter 79 423 502
red-breasted merganser 1 1
fulmar 1 5 6
Manx shearwater 30 276 31 337
gannet 115 69 94 278
British storm-petrel 1 1
cormorant 1 3 165 169
shag 25 25
cormorant/shag 17 17
oystercatcher 19 19
medium wader sp. 1 1
black-headed gull 1 3 45 49
common gull 5 5
lesser black-backed gull 20 155 14 189
herring gull 2 584 79 665
great black-backed gull 1 2 17 20
kittiwake 17 67 197 281
grey gull spp 3 1 26 30
black-backed gull spp 37 26 20 83
large gull sp. 7 126 5 138
small gull sp. 2 23 3 28
gull sp. 4 19 105 128
Sandwich tern 18 1 7 26
Arctic/common tern 1 5 6
tern sp. 1 2 3
guillemot 11 15 26
auk sp. 121 383 430 934
passerine sp. 2 2

Aerial Surveys of Waterbirds in Strategic Wind Farm Areas: 2005/06 Final Report 163
Table 19 - Number of birds counted during aerial survey of the North Westsurvey blocks, Period 7
Species NW1 NW3 NW4 NW5 NW5(2) NW6a NW6b Total
eider 174 174
common scoter 309 309
fulmar 1 1
Manx shearwater 337 337
gannet 357 357
cormorant 14 14
cormorant/shag 1 1
oystercatcher 59 59
lapwing 15 15
dunlin 5 5
wader sp. 1,890 1,890
great skua 1 1
black-headed gull 288 288
common gull 76 76
lesser black-backed gull 218 218
herring gull 61 61
great black-backed gull 12 12
kittiwake 112 112
grey gull spp 196 196
black-backed gull spp 23 23
large gull sp. 13 13
small gull sp. 1 1
gull sp. 171 171
Sandwich tern 14 14
Arctic/common tern 14 14
tern sp. 5 5
auk sp. 229 229

164 Aerial Surveys of Waterbirds in Strategic Wind Farm Areas: 2005/06 Final Report
Table 20 - Number of birds counted during aerial survey of the Greater Washsurvey blocks, Period 1.
Species GW1a GW1b GW2 GW3 GW4 GW5 GW6 GW7 Total
brent goose 4 255 259
shelduck 688 688
wigeon 48 48
teal 57 57
mallard 74 74
pintail 14 14
pochard 1 1
eider 1,105 1,105
common scoter 5 45 1,311 1,361
duck sp. 3 3 6
red-breasted merganser 5 5
diver sp. 14 1 40 28 22 105
red-throated diver 28 28
great crested grebe 1 1
fulmar 22 1 23
gannet 3 7 20 22 146 1 199
cormorant 5 49 54
cormorant/shag 1 1 2
oystercatcher 1 2,444 2,445
curlew 1 1
wader sp. 3,601 3,601
small wader sp. 13 2 9,756 9,771
medium wader sp. 669 669
large wader sp. 1 373 374
pomarine skua 1 1
Arctic skua 2 1 3
great skua 1 2 1 4
little gull 209 13 222
black-headed gull 4 10 6 79 99
common gull 25 13 38
lesser black-backed gull 1 9 1 1 1 13
herring gull 4 3 152 159
great black-backed gull 3 1 1 2 24 31
kittiwake 23 189 155 96 10 33 506
grey gull spp 12 24 77 2 12 107 234
black-backed gull spp 3 2 13 1 2 43 64
large gull sp. 5 3 1 53 3 65
small gull sp. 29 44 51 21 20 10 175
gull sp. 16 89 23 5 19 484 636
Arctic/common tern 3 3
tern sp. 8 8
auk sp. 116 304 458 215 75 40 1,208
passerine sp. 25 25

Aerial Surveys of Waterbirds in Strategic Wind Farm Areas: 2005/06 Final Report 165
Table 21 - Number of birds counted during aerial survey of the Greater Washsurvey blocks, Period 2.
Species GW1a GW1b GW2 GW3 GW4 GW5 GW6 GW7 Total
brent goose 645 645
goose sp. 22 22
shelduck 19 1,190 1,209
wigeon 440 440
teal 45 45
mallard 82 82
dabbling ducks 9 9
scaup 45 45
eider 2 1,120 1,122
common scoter 205 2,317 2,522
velvet scoter 2 2
goldeneye 2 2
duck sp. 20 25 527 572
red-breasted merganser 2 7 9
diver sp. 1 4 5 8 5 5 48 4 80
red-throated diver 3 4 1 1 3 12
great northern diver 1 1
grebe sp. 5 1 6
fulmar 22 34 11 5 72
gannet 2 3 1 1 7
cormorant 7 8 20 22 57
cormorant/shag 1 2 3
oystercatcher 8 2,381 2,389
grey plover 1 1
lapwing 1 1
knot 45 45
curlew 87 87
wader sp. 60 1,138 1,198
small wader sp. 425 2,271 2,696
medium wader sp. 599 599
large wader sp. 401 401
little gull 1 12 10 4 6 33
black-headed gull 4 2 1 76 25 108
common gull 67 1 1 4 40 3 1 117
lesser black-backed gull 2 2 1 1 3 3 12
herring gull 2 69 5 2 4 4 37 123
great black-backed gull 6 12 15 2 5 3 2 10 55
kittiwake 7 20 9 42 30 48 27 18 201
grey gull spp 48 33 1 40 2 25 1 150
black-backed gull spp 3 12 21 2 2 10 11 61
large gull sp. 2 2 5 10 1 4 1 25
small gull sp. 1 2 55 20 29 23 130
gull sp. 2 64 4 94 21 20 26 231
auk sp. 11 12 82 191 39 173 204 42 754
fieldfare 1 1
passerine sp. 1 1

166 Aerial Surveys of Waterbirds in Strategic Wind Farm Areas: 2005/06 Final Report
Table 22 - Number of birds counted during aerial survey of the Greater Washsurvey blocks, Period 3.
Species GW1a GW1b GW2 GW3 GW4 GW5 GW6 GW7 Total
brent goose 290 290
goose sp. 179 179
shelduck 1,990 1,990
wigeon 644 644
mallard 83 83
pintail 2 2
eider 2,358 2,358
common scoter 950 5 955
velvet scoter 3 3
duck sp. 3 530 533
red-breasted merganser 13 13
diver sp. 18 6 9 4 25 6 174 25 267
red-throated diver 1 2 9 4 16 2 34
great northern diver 1 1 2
grebe sp. 1 1
fulmar 2 1 9 2 2 5 6 1 28
gannet 3 11 2 27 43
cormorant 8 1 1 44 24 78
shag 2 2
cormorant/shag 1 1
oystercatcher 2,919 2,919
lapwing 286 286
knot 760 760
dunlin 130 130
bar-tailed godwit 14 14
curlew 53 53
wader sp. 4,724 4,724
small wader sp. 2,509 2,509
medium wader sp. 700 700
large wader sp. 27 27
little gull 9 2 11
black-headed gull 1 62 739 802
common gull 3 13 1 4 9 172 202
lesser black-backed gull 3 1 1 1 6 12
herring gull 2 1 4 2 90 3 16 371 489
great black-backed gull 6 1 11 2 8 2 18 48
kittiwake 1 28 2 5 1 22 3 62
grey gull spp 7 9 40 90 11 49 1,098 1,304
black-backed gull spp 19 2 4 1 56 82
large gull sp. 2 2 2 10 1 5 4 26
small gull sp. 2 2 1 3 2 28 151 189
gull sp. 5 40 531 17 117 6,003 6,713
auk sp. 64 20 240 76 31 168 152 24 775

Aerial Surveys of Waterbirds in Strategic Wind Farm Areas: 2005/06 Final Report 167
Table 23 - Number of birds counted during aerial survey of the Greater Washsurvey blocks, Period 4.
Species GW1a GW1b GW2 GW3 GW4 GW5 GW6 GW7 Total
brent goose 595 595
shelduck 1,013 1,013
wigeon 10 10
mallard 13 13
eider 3 1,124 1,127
common scoter 3 1,272 1,290 2,565
duck sp. 106 106
red-breasted merganser 33 33
diver sp. 4 33 52 5 72 22 92 21 301
red-throated diver 2 9 30 6 21 2 70
great northern diver 1 1
great crested grebe 2 2
grebe sp. 2 1 1 4
fulmar 8 3 11 49 6 3 80
gannet 15 21 2 17 8 63
cormorant 3 9 13 25
cormorant/shag 2 1 1 1 5
oystercatcher 27 3,089 3,116
knot 15 15
dunlin 6 6
bar-tailed godwit 336 336
curlew 16 16
wader sp. 1 4,355 4,356
small wader sp. 6 5,664 5,670
medium wader sp. 50 50
large wader sp. 2 2
little gull 3 3
black-headed gull 7 4 140 1 103 51 306
common gull 2 6 2 4 134 29 43 220
lesser black-backed gull 1 4 5
herring gull 5 43 2 1 8 7 23 394 483
great black-backed gull 4 3 3 10
kittiwake 2 5 17 30 4 23 6 87
grey gull spp 7 29 11 16 21 45 28 311 468
black-backed gull spp 2 3 5 10
large gull sp. 1 3 2 11 1 3 9 30
small gull sp. 1 9 4 8 6 9 1 5 43
gull sp. 9 192 8 17 159 37 16 2,093 2,531
razorbill 2 2
auk sp. 79 38 120 44 25 84 29 5 424
carrion crow 1 1 2

168 Aerial Surveys of Waterbirds in Strategic Wind Farm Areas: 2005/06 Final Report
Table 24 - Number of birds counted during aerial survey of the Greater Washsurvey blocks, Period 5.
Species GW1a GW1b GW2 GW3 GW4 GW5 GW6 GW7 Total
mute swan 2 2
canada goose 1 1
shelduck 46 13 59
common scoter 40 40
duck sp. 1 1
red-breasted merganser 2 2
fulmar 11 13 22 2 48
gannet 43 5 26 1 75
cormorant 16 63 79
shag 2 2
little egret 2 3 5
kestrel 1 1
oystercatcher 258 48 306
wader sp. 272 4 276
small wader sp. 9 46 13 1 69
medium wader sp. 10 10
black-headed gull 9 142 91 1 243
lesser black-backed gull 4 1 4 9
herring gull 128 2 2 132
kittiwake 22 13 9 44
grey gull spp 49 50 1 100
black-backed gull spp 8 1 9
large gull sp. 7 12 8 1 28
small gull sp. 19 12 14 4 49
gull sp. 36 323 229 146 734
Sandwich tern 22 110 39 14 185
Arctic/common tern 7 5 14 23 49
little tern 13 11 3 27
tern sp. 68 21 88 8 185
guillemot 4 4
auk sp. 128 39 38 15 220
feral pigeon 1 1
wood pigeon 178 178

Aerial Surveys of Waterbirds in Strategic Wind Farm Areas: 2005/06 Final Report 169
Table 25 - Number of birds counted during aerial survey of the Greater Washsurvey blocks, Period 6.
Species GW1a GW1b GW2 GW3 GW4 GW5 GW6 GW7 Total
mute swan 1 1
shelduck 31 9 40
fulmar 8 1 6 1 16
gannet 11 4 6 51 72
cormorant 9 1 10
cormorant/shag 2 2 4
little egret 6 2 8
oystercatcher 153 119 272
wader sp. 22 22
small wader sp. 1 7 8
black-headed gull 120 98 11 229
common gull 2 2
lesser black-backed gull 2 7 1 46 56
herring gull 1 11 4 21 37
great black-backed gull 1 3 4
kittiwake 101 101
grey gull spp 4 3 9 14 30
black-backed gull spp 1 6 7
large gull sp. 1 3 59 63
small gull sp. 2 8 6 5 21
gull sp. 16 5 24 15 60
Sandwich tern 19 108 68 14 209
Arctic/common tern 37 70 11 118
little tern 7 7
tern sp. 11 24 52 6 93
auk sp. 68 32 13 40 153
feral pigeon 43 9 52
wood pigeon 12 2 14
jay 1 1
carrion crow 1 1

170 Aerial Surveys of Waterbirds in Strategic Wind Farm Areas: 2005/06 Final Report
Table 26 - Number of birds counted during aerial survey of the Greater Washsurvey blocks, Period 7.
Species GW1a GW1b GW2 GW3 GW4 GW5 GW6 GW7 Total
mute swan 11 2 13
shelduck 4 4
mallard 2 2
common scoter 101 5 106
duck sp. 2 2 4
fulmar 10 1 3 14
gannet 120 14 29 67 230
cormorant 26 3 5 34
little egret 6 1 7
grey heron 2 2
oystercatcher 122 27 13 162
lapwing 2 2
curlew 9 9
wader sp. 58 3 6 67
small wader sp. 38 38
medium wader sp. 22 1 23
large wader sp. 55 55
great skua 5 5
black-headed gull 7 154 54 13 228
common gull 5 1 6
lesser black-backed gull 1 3 7 16 27
herring gull 2 31 4 6 43
great black-backed gull 2 3 2 7
kittiwake 60 6 20 86
grey gull spp 43 5 19 12 79
black-backed gull spp 7 2 2 2 13
large gull sp. 2 59 9 7 77
small gull sp. 36 63 10 14 123
gull sp. 20 130 166 62 378
Sandwich tern 2 16 13 28 59
Arctic/common tern 11 26 2 9 48
little tern 2 1 1 12 16
tern sp. 56 79 32 158 325
guillemot 25 11 36
razorbill 1 1
auk sp. 375 72 100 505 1,052
wood pigeon 15 15
passerine sp. 42 42

Aerial Surveys of Waterbirds in Strategic Wind Farm Areas: 2005/06 Final Report 171
Table 27 - Number of birds counted during aerial survey of the Thames surveyblocks, Period 1.
Species TH1 TH2 TH3 TH4 TH5 TH6 TH7 Total
brent goose 141 3 144
goose sp. 3 3
eider 2 2
diver sp. 15 8 3 71 3 100
grebe sp. 1 1
fulmar 20 38 12 70
gannet 1 10 44 262 9 326
cormorant 26 1 10 37
oystercatcher 1,007 1,007
wader sp. 601 105 17 723
small wader sp. 258 258
great skua 2 1 4 1 8
skua sp. 2 2
little gull 27 32 59
black-headed gull 207 53 260
common gull 6 1 15 22
lesser black-backed gull 5 1 8 14
herring gull 317 2 1 320
great black-backed gull 16 3 14 2 35
kittiwake 9 12 59 73 43 196
grey gull spp 54 4 4 9 3 74
black-backed gull spp 32 5 1 37 5 80
large gull sp. 38 1 15 19 56 129
small gull sp. 31 20 4 47 31 133
gull sp. 2,240 98 4 1,535 219 4,096
tern sp. 4 3 7
auk sp. 2 76 83 67 73 301
starling 16 16
passerine sp. 52 19 30 6 22 129

172 Aerial Surveys of Waterbirds in Strategic Wind Farm Areas: 2005/06 Final Report
Table 28 - Number of birds counted during aerial survey of the Thames surveyblocks, Period 2.
Species TH1 TH2 TH3 TH4 TH5 TH6 TH7 Total
wigeon 13 13
teal 40 40
mallard 95 95
eider 3 3
duck sp. 106 106
red-breasted merganser 2 2
diver sp. 236 53 6 69 75 439
red-throated diver 156 11 16 39 222
great crested grebe 1 1
grebe sp. 1 1
fulmar 3 35 22 7 67
gannet 1 23 4 2,373 3 2,404
cormorant 50 4 54
oystercatcher 1,398 1,398
dunlin 1 1
curlew 2 2
redshank 1 1
wader sp. 1,162 6 1,168
small wader sp. 124 124
medium wader sp. 1 1
great skua 10 10
little gull 1 1 2
black-headed gull 1,655 12 1 1 1,669
common gull 22 3 25
lesser black-backed gull 16 4 2 22
herring gull 559 5 4 175 5 748
great black-backed gull 72 3 10 207 2 294
kittiwake 1 76 34 382 44 537
grey gull spp 153 4 1 16 9 183
black-backed gull spp 54 5 2 44 1 106
large gull sp. 71 7 52 1 131
small gull sp. 66 1 12 5 84
gull sp. 5,796 845 5 5,382 327 12,355
guillemot 1 1 2
puffin 1 1
auk sp. 71 71 222 863 289 1,516
passerine sp. 1 1

Aerial Surveys of Waterbirds in Strategic Wind Farm Areas: 2005/06 Final Report 173
Table 29 - Number of birds counted during aerial survey of the Thames surveyblocks, Period 3.
Species TH1 TH2 TH3 TH4 TH5 TH6 TH7 Total
shelduck 14 14
eider 3 3
common scoter 249 24 273
duck sp. 250 3 2 255
red-breasted merganser 5 5
diver sp. 289 440 63 152 146 24 45 1,159
red-throated diver 86 75 23 2 6 7 199
great northern diver 1 1 2
great crested grebe 1 1
grebe sp. 1 4 1 1 7
fulmar 36 23 6 4 69
gannet 3 18 3 528 6 558
cormorant 150 2 3 155
oystercatcher 613 613
lapwing 250 250
wader sp. 850 850
Arctic skua 1 1
skua sp. 2 2
little gull 2 1 1 4
black-headed gull 87 1 1 133 60 1 283
common gull 119 13 4 15 13 4 168
lesser black-backed gull 5 1 3 10 9 5 33
herring gull 46 15 5 69 2 36 173
great black-backed gull 21 13 32 25 4 38 5 138
kittiwake 50 165 103 13 16 558 46 951
grey gull spp 49 27 10 179 55 169 16 505
black-backed gull spp 10 16 32 14 121 45 238
large gull sp. 28 2 56 10 38 1 1 136
small gull sp. 1 5 16 61 29 2 41 155
gull sp. 364 93 136 634 372 189 118 1,906
razorbill 1 1
auk sp. 85 159 128 11 62 897 494 1,836

174 Aerial Surveys of Waterbirds in Strategic Wind Farm Areas: 2005/06 Final Report
Table 30 - Number of birds counted during aerial survey of the Thames surveyblocks, Period 4.
Species TH1 TH2 TH3 TH4 TH5 TH6 TH7 Total
brent goose 6 6
goose sp. 254 254
shelduck 17 17
wigeon 18 18
eider 1 1
common scoter 94 94
duck sp. 3 35 38
diver sp. 367 349 82 238 77 58 7 1,178
red-throated diver 30 51 31 12 48 5 177
black-throated diver 1 1
great northern diver 1 3 1 5
grebe sp. 4 4
fulmar 11 5 1 2 23 75 117
gannet 7 5 21 9 12 54
cormorant 681 681
oystercatcher 867 867
lapwing 1 1
wader sp. 2,262 15 12 2,289
small wader sp. 632 632
medium wader sp. 474 474
black-headed gull 342 3 10 7 1 5 368
common gull 158 28 12 30 2 54 2 286
lesser black-backed gull 9 1 1 5 19 5 3 43
herring gull 74 1 3 65 40 7 20 210
great black-backed gull 12 7 22 2 12 7 30 92
kittiwake 20 34 20 7 15 129 22 247
grey gull spp 405 76 17 57 19 18 19 611
black-backed gull spp 16 4 5 8 23 5 3 64
large gull sp. 69 12 9 8 6 238 5 347
small gull sp. 39 12 11 327 11 87 1 488
gull sp. 1,139 1,037 51 489 63 129 438 3,346
guillemot 2 2
auk sp. 4 19 82 8 59 146 117 435
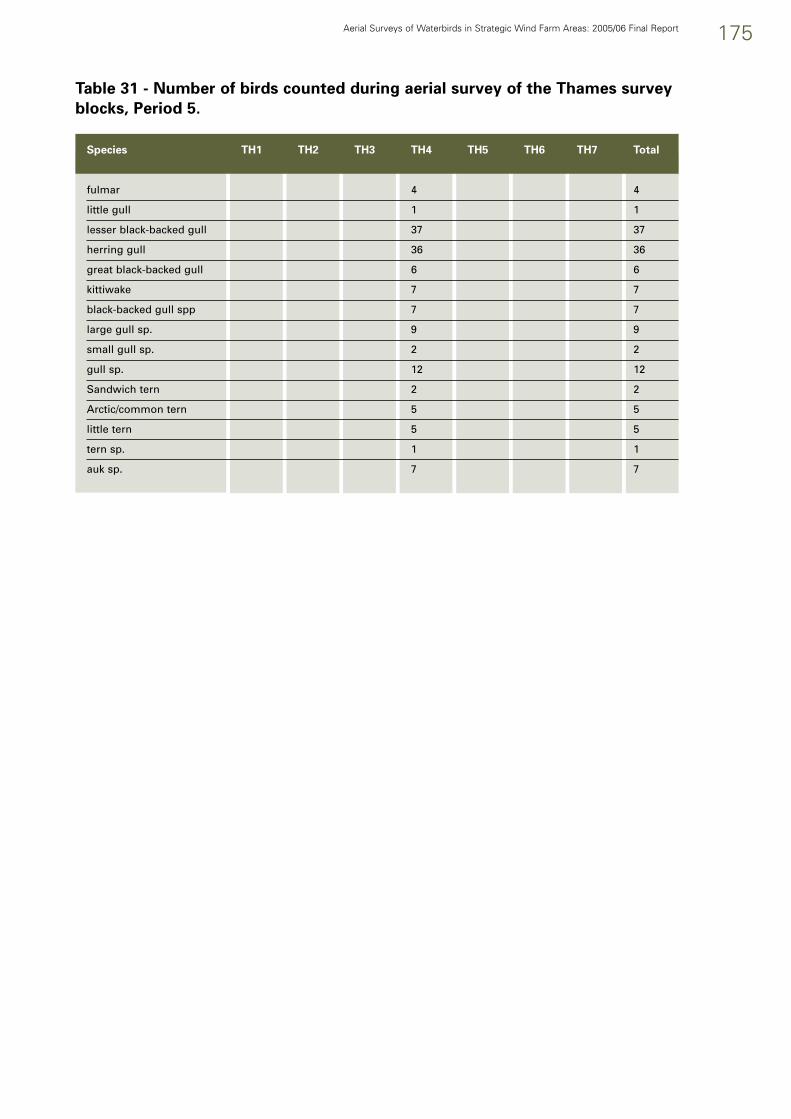
Aerial Surveys of Waterbirds in Strategic Wind Farm Areas: 2005/06 Final Report 175
Table 31 - Number of birds counted during aerial survey of the Thames surveyblocks, Period 5.
Species TH1 TH2 TH3 TH4 TH5 TH6 TH7 Total
fulmar 4 4
little gull 1 1
lesser black-backed gull 37 37
herring gull 36 36
great black-backed gull 6 6
kittiwake 7 7
black-backed gull spp 7 7
large gull sp. 9 9
small gull sp. 2 2
gull sp. 12 12
Sandwich tern 2 2
Arctic/common tern 5 5
little tern 5 5
tern sp. 1 1
auk sp. 7 7

176 Aerial Surveys of Waterbirds in Strategic Wind Farm Areas: 2005/06 Final Report
Table 33 - Number of birds counted during aerial survey of the Thames surveyblocks, Period 7.
Species TH1 TH2 TH3 TH4 TH5 TH6 TH7 Total
common scoter 29 29
gannet 5 5
black-headed gull 7 7
lesser black-backed gull 7 7
herring gull 6 6
great black-backed gull 1 1
kittiwake 3 3
grey gull spp 16 16
black-backed gull spp 4 4
large gull sp. 8 8
small gull sp. 3 3
gull sp. 13 13
Sandwich tern 4 4
Arctic/common tern 26 26
tern sp. 6 6
auk sp. 8 8
Table 32 - Number of birds counted during aerial survey of the Thames surveyblocks, Period 6.
Species TH1 TH2 TH3 TH4 TH5 TH6 TH7 Total
common scoter 242 242
fulmar 5 5
gannet 4 4
black-headed gull 4 4
lesser black-backed gull 59 59
herring gull 12 12
great black-backed gull 2 2
grey gull spp 12 12
black-backed gull spp 9 9
large gull sp. 2 2
small gull sp. 1 1
gull sp. 82 82
auk sp. 1 1
passerine sp. 1 1

Aerial Surveys of Waterbirds in Strategic Wind Farm Areas: 2005/06 Final Report 177
Erratum to the 2004/05 final reportFigure 37 published in the 2004/05 final report was incorrect. The correct version is presented below.
Figure 37 - Relative density of Little Gulls Larus minutus recorded in North West OWF Strategic Areaduring aerial surveys, winter 2004/05 (Periods 1-4 inclusive). Numbers of all birds are summed by2x2 km grid squares, corrected for survey effort.

2Printed in the UK on recycled paper containing a minimum of 75% post consumer waste.
Department for Business, Enterprise & Regulatory Reform. www.berr.gov.ukFirst published October 2007. © Crown Copyright. Pub 8624/0.1k/10/07/NP URN 07/1431


![BENZO[ ]PRYRENE (BaP) - Defra, UKrandd.defra.gov.uk/Document.aspx?Document=10310_TGS_BaP... · hplc 45 Table 1: Summary of sampling and analytical strategies for BaP data sets explored](https://img.dokumen.tips/doc/110x75/60ca05fb3710b966442c3ba8/benzo-pryrene-bap-defra-hplc-45-table-1-summary-of-sampling-and-analytical.jpg)