Embed Size (px)
Citation preview

269
F
C H A P T E R 1 6
Fertilizer in Kenya: Factors Driving the Increase in Usage by Smallholder Farmers
Joshua Ariga and T. S. Jayne
ertilizer use is notably lower in most of Sub-Saharan Africa than in other developing regions. Too little irrigation and varieties unresponsive to fertilizer may
explain this low use to some degree. But more often, the causes are lack of credit, long distances between farmers and the nearest fertilizer retailer, weak market infrastructure, and lack of government support. Indeed, in many countries, the withdrawal of state input delivery systems has led to a reduc- tion in fertilizer use as commercial distribution systems compete with subsidized government programs.
Kenya, however, stands as a notable departure from this common Sub-Saharan African narrative. In the early 1990s fertilizer markets were liberalized, government price con- trols and import licensing quotas were eliminated, and fer- tilizer donations by external donor agencies were phased out. Fertilizer use then almost doubled over the 15-year period from 1992 to 2007, with much of the increase attrib- utable to smallholder farmers. In the productive farming areas of western Kenya, rates of fertilizer application on maize are comparable with rates in Asia and Latin America.
Kenya’s economy is predominantly agrarian, with more than 70 percent of its people dependent on agriculture- related farm and off-farm activities for their livelihoods (Ministry of Agriculture 2004). Food security is a concern for the 60 percent of the population living below the $1-a- day poverty line. While increasing the available supply of
food is an important goal, the problem of access to food is perhaps the primary cause of food insecurity in Kenya. Ensuring access to food requires that the poor are able either to produce or to buy enough food for a healthy diet.
Because of unpredictable weather and poor infrastruc- ture, producers and consumers of agricultural products in Kenya face volatile market prices, with periods of surplus production providing a boon for consumers and periods of deficit benefiting a relatively few producers who are net sell- ers and hurting the majority of consumers. The justification for state participation in the market for agricultural prod- ucts in Kenya has been to maintain prices at levels that both provide incentives to raise farm incomes for producers and ensure that consumers can access food, the classic “food price dilemma.”
Before 1990 Kenya addressed this dilemma through direct participation in input and output markets for national “strategic” crops through either state-run agencies that set prices at panterritorial levels or ostensible farmer organiza- tions that were managed by state-connected political agents or their surrogates. For example, in the coffee sector, the gov- ernment helped enact laws that created the Coffee Board of Kenya and Kenya Planters Cooperative Union; for pyrethrum (chrysanthemums), it encouraged the creation of the Pyrethrum Board of Kenya; and for milk, tea, and maize, the government helped create the Kenya Cooperative
Joshua Ariga is a senior research fellow with the Tegemeo Institute of Agricultural Policy and Development, Egerton University, and a research specialist at Michigan State University. T. S. Jayne is Professor, International Development, Michigan State University.
2 CHAPTER 16: FERTILIZER IN KENYA: FACTORS DRIVING THE INCREASE IN USAGE BY SMALLHOLDER FARMERS
Creameries, the Kenya Tea Development Agency, and the National Cereals and Produce Board (NCPB). In its heyday, the NCPB generally bought maize grain from farmers at higher-than-market prices and sold it to industrial maize millers at below-market prices. On the input side, the 1970s and 1980s brought the formation of the state-run Kenya National Trading Corporation (KNTC) and the Kenya Grain Growers Cooperative Union (KGGCU), later the Kenya Farmers Association (KFA), which worked with the output organizations.
Of all the crops mentioned in the previous paragraph, policy makers in Kenya—and indeed, throughout East Africa—have been most concerned with increasing fertilizer use on maize, the main food security crop in the region. For a number of reasons, however, state efforts in the 1980s to improve food security through increased production and incomes did not produce desired results. As a result, several reform measures were implemented that sought to achieve food security objectives in a more efficient way, in the lines of a laissez faire or competitive markets dogma.
Fertilizer and maize market reforms
The period before market reforms in Kenya was character- ized by a predictable pattern involving the participation of state-run agencies or private farmer organizations (with heavy state intervention in their management) in input and output markets for import and export, distribution, and retailing. Although these state agencies continually rein- vented themselves under different names, particularly when they came under scrutiny for corruption and unsustainable budgets, their reincarnation followed the same general modus operandi, and all eventually failed to achieve their goal of improving the livelihoods of smallholder farmers.
To put the reform process into perspective, it is impor- tant to recognize that agricultural policy in Kenya has also gone through a number of key phases characterized by an unpredictable shelf life. In the immediate postinde- pendence period (late 1960s), agricultural policy was concerned with supporting a smooth transfer of prime land from white settlers to indigenous Kenyans with help from state-supported agencies in the production and mar- keting of produce (such as NCPB for maize). Agricultural inputs were marketed through the farmers’ union, KFA, and credit was provided through the Agricultural Finance Corporation (AFC).
In the 1960s KFA could, for instance, offer inputs on credit (through AFC) to select farmers, who repaid the union after harvesting the crop and delivering it to relevant
marketing agencies such as the NCPB (which deducted the cost of the loans on behalf of the KFA and AFC). To deal with high prices and a weak distribution network for small- holder farmers, fertilizer subsidies were also introduced through these agencies (Ariga, Jayne, and Nyoro 2006). This conflict of interest across interlinked agencies generated widespread corruption and bureaucratic costs that led to a policy change in 1972 in favor of introducing another agency (KNTC), which was tasked with importing fertilizer, while the KFA was to be the distributor. This shift was intended to increase competition within Kenya’s market for fertilizer, but it did not succeed in keeping fertilizer prices at low levels, and the agencies, influenced by the state, fell into the same patterns of bureaucracy and corruption as before. On the output side, the NCPB controlled maize prices at all levels of the market chain (Nyoro, Kiiru, and Jayne 1999). By setting fixed panterritorial prices and removing arbitrage opportunities for all market participants, these entities sti- fled private trade. Requirements that private traders apply for permits to transport grain across district boundaries made the situation more difficult.
In the 1980s the government started relaxing its monop- oly, allowing the private sector to compete with state agen- cies, albeit under state rules. Fertilizer traders were to adhere to official prices, and the state influenced competition through strict trade licensing requirements and control of the allocation of scarce foreign exchange to importers (Arg- wings-Kodhek 1996). Licensing and allocation of foreign exchange provided rent-seeking opportunities for public sector officials (Kimuyu 1994). While the controlled pricing structure was designed to improve farmers’ access to fertil- izer, it had the opposite effect in geographically remote areas, where the controlled prices were too low for fertilizer retailers to recoup the costs of transporting fertilizer from district towns to remote areas. Hence, retailers in remote locations were less likely to stock fertilizer than those in more urbanized areas, leaving the average distance traveled by farmers to procure fertilizer relatively high in the 1980s and early 1990s.
In addition to the market inefficiencies they created, state agencies also imposed a heavy burden on public resources in Kenya, contributing to deficits and inflation in the 1980s. A decline in budgetary support to the agricultural sector by late 1980s probably contributed to the subsequent decline in agricultural growth, as did the mismanagement of agricul- tural institutions, the ad hoc reform agenda, withholding of donor funds over disagreements about democracy and gov- ernance, and depreciation of the Kenyan shilling, the last of which raised input prices (Argwings-Kodhek 2004). In the
CHAPTER 16: FERTILIZER IN KENYA: FACTORS DRIVING THE INCREASE IN USAGE BY SMALLHOLDER FARMERS 271
Thou
sand
s of
met
ric to
ns
late 1980s and early 1990s, however, Kenya began easing trade restrictions in the fertilizer and maize markets. The government started removing some import quota restric- tions, for example, in January 1990 and abolished licensing requirements for fertilizer imports in 1992.
In a major policy change, the government liberalized the fertilizer subsector specifically in 1993 to allow the partici- pation of the private sector in importing, local trading, and distribution of fertilizer. Coupled with the liberalization of the foreign exchange regime in 1992, these changes in the policy environment led to the entry of a significant number of private sector firms in importing, wholesaling, distribu- tion, and retailing of fertilizer (Wanzala 2001). Government price controls and import licensing quotas were ultimately eliminated, and fertilizer donations by external donor agen- cies were phased out. Maize trading controls were relaxed in the early 1990s to allow private traders to transport a few bags across districts with permission from government offi- cials, a situation that led to rent-seeking behavior and increased costs for businesses (Kimuyu 1994). The NCPB, however, helped stabilize prices for producers and con- sumers by continuing to buy maize (mostly from large pro- ducers) at above-market prices and, during shortages, sell- ing it to consumers at subsidized prices (Jayne, Myers, and Nyoro 2008).
With the participation of stakeholders from all facets of society in the 1990s and 2000s, a number of government
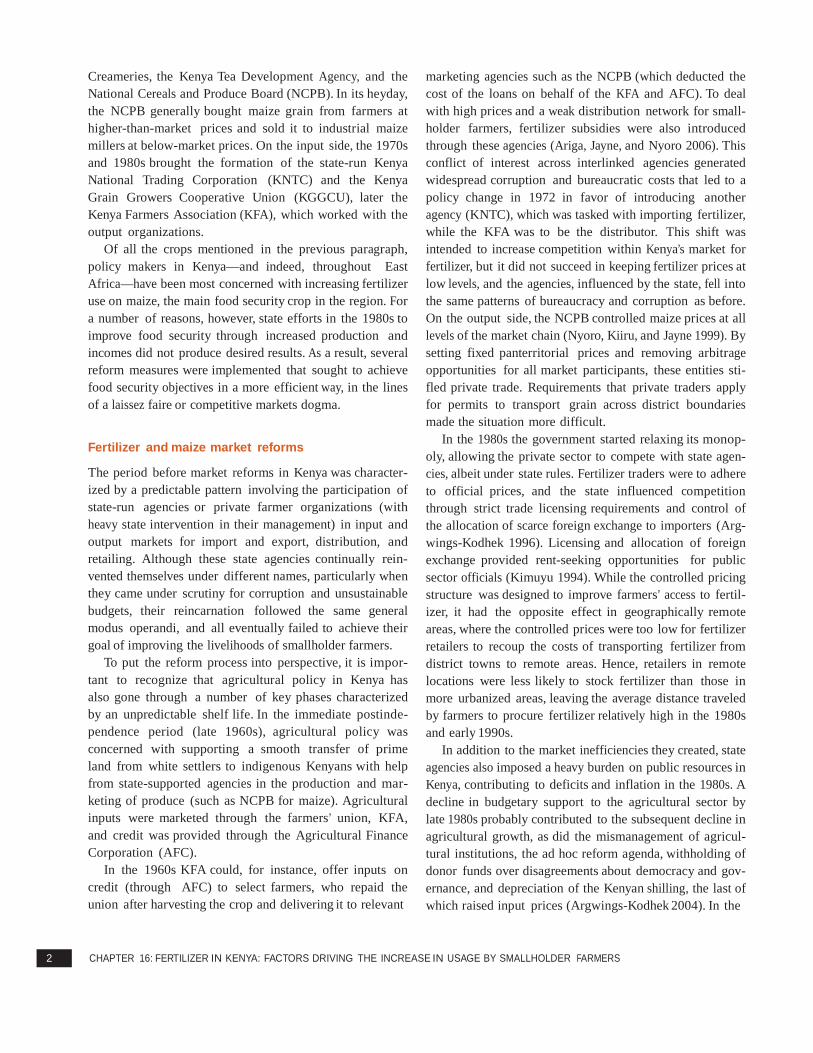
policy papers emphasized a multisectoral approach to rural development in Kenya, including private-public synergies in development. By 1996, 12 major importers, 500 wholesalers, and roughly 5,000 retailers were distributing fertilizer in Kenya (Allgood and Kilungo 1996), and by 2000 the num- ber of retailers was estimated to have risen to between 7,000 and 8,000 (IFDC 2001). (These are estimates because there is no comprehensive business registry or database covering all types of businesses in Kenya.) Even with the easing of trade restrictions, the high costs of upland transportation and logistical problems at the port of Mombasa continued to inflate the cost of fertilizer and reduce effective demand (Wanzala 2001; Ariga and Jayne 2008). Although markups are less than 11 percent of the farm gate price of fertilizer in western Kenya, in a number of farming areas no fertilizer is applied because of the risk from markets, poor rainfall, and agricultural conditions. But in other areas, application rates rival those of Asia, and selling fertilizer is clearly profitable. The overall trend in national consumption of fertilizer has followed a steady growth path since 1990, with government imports declining and the role of the private sector increas- ing (figure 16.1).
Since 2007 a major escalation in the world price of fertil- izer has led to increased government involvement in fertil- izer marketing. The post-2007 period, which has been marked by uncertain policy regimes, follows a fairly stable and transparent period since 1993. In Kenya, in a move to
Figure 16.1 Trends in Consumption, Commercial Imports, and Donor Imports of Fertilizer in Kenya, 1990/91–2010/11
600
500
400
300
200
100
0
Imports Consumption Donor / state imports Projected
Source: Estimated from Kenya Ministry of Agriculture data by the authors. Note: In 2004 and 2008, respectively, NCPB imported approximately one-third and 40 percent of national fertilizer needs. The estimate given for 2010/11 is a projection that includes private and government imports. The shaded years cover the time period after 2006/07, when government imports/subsidies were reinstated partly as a reaction to deficits in maize production and postelection disruptions of agricultural activities.

4 CHAPTER 16: FERTILIZER IN KENYA: FACTORS DRIVING THE INCREASE IN USAGE BY SMALLHOLDER FARMERS
bolster agricultural production after postelection violence led to disruption of farm activities, NCPB imported fertil- izer in 2008 but delivered it to farmers late, which con- tributed to the low levels of maize production that year. This situation, in turn, created pressure from some farmer lobby groups and activists for increased subsidization of inputs (fertilizer and seed) to raise productivity of maize to counter an expected increase in hunger in 2009. In 2009 the government of Kenya imported substantial amounts of fer- tilizer through NCPB to be distributed through its branches and select private retailers at prices that included a 40 per- cent subsidy. In early 2010 news reports indicated that the government planned to import 1.5 million bags (75,000 tons) of fertilizer.1 Table 16.1 details key points in the liber-
alization of the maize sector, especially the role played by NCPB, the main grain-marketing state agency.
Although the increased participation of the Kenyan gov- ernment in the agricultural market was expected to be short-lived and not significant enough to disrupt private sector investments, unforeseen events (such as poor rains in recent years) may mean that occasional state subsidies will be implemented over the upcoming few years in an attempt to meet national food requirements, particularly as political pressure for such measures increases. If recent indications are reliable, the incidence of government subsidies will probably decline after a few years as they become unsus- tainable unless international partners shoulder some of the responsibility.
Table 16.1 Evolution of Maize and Fertilizer Market Policy Reforms in Kenya, 1988–2010
State marketing agency Maize market policy Fertilizer market policy 1988: NCPB faces deficits and is financially
restructured. NCPB depots are phased out. NCPB debts are written off; crop purchase fund is established but not replenished.
Early 1990s: NCPB narrows its margins. Private sector finds it unprofitable to reach remote areas.
1988: Cereal Sector Reform Program envisages widening of NCPB price margin. In fact, margin narrows. Proportion of grain that millers are obliged to buy from NCPB declines. Limited unlicensed maize trade is allowed. State sets all prices for maize grain and flour.
1991: Local and international pressure for
reforms builds up. Interdistrict trade is further relaxed.
1992: Kenya moves from a one-party political system to a multiparty system. Restrictions
Pre-1990: KGGCU / KFA and KNTC are main input agencies. Mismanagement and deficits are common. Government control of the fertilizer industry is heavy. Imports are poorly coordinated, leading to surplus/deficits. Licensing of private trade in the late 1980s is controlled but under panterritorial pricing. State agencies are financially weak.
1992: Foreign exchange regime is liberalized.
Fertilizer import restrictions are relaxed. on maize trade across districts are reimposed. 1993: Fertilizer market is liberalized.
1995: Donor pressure leads to NCPB being restricted to the role of buyer and seller of last resort. NCPB market share declines to 10–20 percent of marketed maize trade. NCPB operations are confined mainly to high-potential areas of western Kenya.
NCPB is unable to defend ceiling prices. 1993: Maize and maize meal prices deregulated.
Import tariffs are abolished. No subsidies are provided to registered millers.
1995: Internal maize and maize meal trade is
fully liberalized. Maize import tariff of 30 percent is reimposed. 1996: Export ban is imposed after poor harvest.
1997: Import tariff is imposed after poor harvest.
Private traders are allowed to import and distribute. State and donor imports decline dramatically.
1994: Custom duty and value added tax (VAT) are removed.
1996: Number of market entrants is estimated at 12 major importers, 500 wholesalers, and roughly 5,000 retailers (Allgood and Kilungo 1996)
2000 onward: NCPB is provided with funds 1997–2005: External trade and tariff rate levels to purchase a greater volume of maize. NCPB’s share of total maize trade rises to 25–35 percent of total marketed maize.
change frequently and become difficult to predict. NCPB producer prices are normally set above import parity levels
2005 onward: The government withdraws the import tariff on maize entering Kenya from East African Community member countries. An official 2.75 percent duty is still assessed, and a variable import duty is still assessed on maize entering Kenya through the Mombasa port.
(continued next page)

CHAPTER 16: FERTILIZER IN KENYA: FACTORS DRIVING THE INCREASE IN USAGE BY SMALLHOLDER FARMERS 273
Table 16.1 (continued)
State marketing agency Maize market policy Fertilizer market policy 2008: World food prices are high. NCPB is
asked to sell subsidized grain to millers, who in turn could lower prices for consumers. State has difficulty enforcing and monitoring at millers’ end because of unknown milling costs. Allegations of corruption emerge.
2009: Briefcase firms and NCPB employees take advantage of crisis and subsidy arrangements to favor some firms in return for kickbacks. Weaknesses in disaster preparedness, institutions, and food policy are revealed. Top management of NCPB and some Ministry of Agriculture officials are fired for corruption during the crisis.
2010: NCPB allocates funds to buy maize produced in eastern Kenya during short rainy season.
2008: Postelection violence erupts. African Centre for Open Governance estimates that 3.5 million bags of maize are destroyed. NCPB begins importing maize from United States and South Africa in late 2008. An estimated 5 million bags arrive, according to the center.
2009: Imports continue, but domestic maize production is greater than expected. Claims of monopoly at Mombasa port involving grain handling (particularly related to one large grain handler, Grain Bulk Handlers Limited) and milling arise but are not substantiated.
2010: Short rainy season results in large
amount of maize production, but farmers report poor prices from private traders.
2008: High world prices for fertilizer exacerbate food crisis effects from postelection violence. Prices more than double. Petrol and transport costs also go up.
2009: NCPB imports state- subsidized
fertilizer to aid in recovery from postelection violence. Fertilizer is distributed through private trade networks.
2010: State imports more than 30,000 tons of
fertilizer and distributes to vulnerable farmers. Distribution is managed by NGOs.
Source: Authors, adapted from Ariga and Jayne (2008).
THE EFFECT OF REFORMS IN FERTILIZER AND MAIZE MARKETS
Data collected in household surveys and found in secondary sources can be used to analyze the effects of policy reforms on fertilizer and maize markets in Kenya during the 1980s, 1990s, and 2000s. The panel data consist of nationwide rural household panel survey data covering the 1996/97, 1999/2000, 2003/04, and 2006/07 crop seasons. The panel household survey was designed and implemented under the Tegemeo Agricultural Monitoring and Policy Analysis Pro- ject (TAMPA), implemented by Egerton University/Tege- meo Institute with support from Michigan State University. Out of the national sample of 1,260 households, a balanced panel of 899 households was interviewed in all four periods. Other data, such as monthly maize price levels and NCPB maize purchases and sales, were obtained from various Kenyan government ministries.
For analytical convenience, the survey sample has been classified into zones based on agro-ecological characteristics, districts, and agricultural production potential. Each of these agro-ecological zones has been split into two broader categories—high-potential and low-potential regions—based on soil quality, rainfall, yield potential, and fertilizer use.2
Processes leading to growth in smallholder fertilizer use and maize yields
Figure 16.2 provides a schematic description of how public investments in market infrastructure and policy reform
within fertilizer and maize markets generated specific responses from the private sector and smallholder farmers. The basic story is one of synergies between liberalization of input and maize markets and public investments in support of smallholder agriculture that led to substantial private sec- tor investment in fertilizer retailing and maize marketing, which in turn resulted in an impressive increase in the use of fertilizer by smallholder farmers and in the maize yields of smallholder farms over 1997–2007. Distance from farm to fertilizer seller One indicator of how reforms have contributed to fertilizer availability in Kenya is the distance farmers now have to travel to buy fertilizer compared with the distance in the prereform period (figure 16.3). This variable is a measure of increased private sector competition leading to more invest- ment in locating retail services closer to producers, with retailers opening stores in new catchment areas that were hitherto not serviced by the government-run input system and opening additional stores in already-served areas to capture more business.
In general, distances in the low-potential region are longer than those in the high-potential region, which is one reason why the sample is split into two broad groups in the analysis presented here. The private sector invest- ment in fertilizer trade has expanded rapidly after the state allowed competition and removed trade restrictions. Although absolute distances are generally higher for the

274 CHAPTER 16: FERTILIZER IN KENYA: FACTORS DRIVING THE INCREASE IN USAGE BY SMALLHOLDER FARMERS
Dist
ance
to fe
rtiliz
er se
ller (
kilo
met
ers)
Figure 16.2 Synergies Increasing Fertilizer Use and Maize Yields by Smallholder Farmers
Public investments: 1. Major investment in rural feeder roads 2. Generation and release of new maize varieties by Kenya Agricultural Research
Institute and by private seed firms
Policy reforms—fertilizer marketing: 1. Price controls on fertilizer abolished 2. Private fertilizer trade fully legalized 3. Fertilizer import quotas eliminated 4. Government auctioning of free donor
fertilizer phased out; no competing fertilizer subsidy program (1990–2007)
Policy reforms—maize marketing: 1. Barriers to private maize marketing
eliminated by 1995 2. Maize meal price controls eliminated
in 1993 3. Closing of buying stations in most parts
of the country; stations remain active in only three or four surplus maize-producing districts
Private sector responses: 1. Rapid expansion in private fertilizer wholesaling and retailing, reducing the
distance farmers travel to nearest fertilizer retailer 2. Reduction in fertilizer marketing costs observed between off-loading at Mombasa
port and farm gate level 3. Reduction in distance traveled by farmers to point of maize sale to private trader 4. Increase over time in maize/fertilizer price ratios
Smallholder farmer responses: 1. Rise in the percent of farmers using fertilizer and hybrid maize seed 2. Increase in maize yield and maize production 3. Increase in percent of farmers selling maize
Source: Authors.
Figure 16.3 Average Distance from Farm to Fertilizer Seller
15.0
15
low-potential region, the rate at which distances have declined is generally higher than in the high-potential region. The consumption of fertilizer has not followed the same regional pattern, however, implying the presence of other constraints.
10
5 4.3
0
3.0
2.3
2.9
10.6 6.9
4.1
Increasing proportion of households using fertilizer Data from a balanced panel of households in Kenya show that the percentage of households using fertilizer on at least one farm plot rose from 59 percent in 1997 to 72 percent in 2007 for the national sample (table 16.2). However, there are differences in growth across agro-ecological zones and the two broad regions of interest. For the high-potential
High-potential region Low-potential region region, which began with a much higher proportion of
Source: Authors, estimated from Tegemeo Institute/Egerton University household surveys, 1997, 2000, 2004, and 2007. Note: The high-potential region includes the districts of Bomet, Bungoma, Gishu, Kakamega, Kisii, Meru, Muranga, Narok, Nakuru, Nyeri, Trans Nzoia, Uasin, and Vihiga. The low-potential region includes the districts of Kilifi, Kisumu, Kitui, Kwale, Machakos, Makueni, Mwingi, Siaya, Taita, and Taveta.
fertilizer users, use increased from 77 percent to 91 per- cent of households between 1997 and 2007.Use in the low-potential region more than doubled during the same period, increasing from 12 percent in 1997 to 26 percent in 2007, but the proportion of households using fertilizer remained relatively small.

CHAPTER 16: FERTILIZER IN KENYA: FACTORS DRIVING THE INCREASE IN USAGE BY SMALLHOLDER FARMERS 275
Diffe
renc
es in
mea
ns
(kilo
gram
s pe
r acr
e)
Table 16.2 Share of Maize-Growing Households Using Fertilizer, by Region and Zone (percent)
Region and zone 1997 2000 2004 2007 High-potential region
Western transitional 41 65 71 81 High-potential maize zone 84 89 89 92 Western highlands 78 90 91 95 Central highlands 90 91 91 93
Subtotal 77 85 86 91 Low-potential region
Coastal lowland 4 4 5 11 Eastern lowland 26 27 47 48 Western lowland 2 5 7 13
Subtotal 12 14 23 26 Grand total 59 65 68 72
Source: Authors, estimated from Tegemeo Institute/Egerton University household surveys, 1997, 2000, 2004, and 2007. Note: This sample consists of a balanced panel of 899 households interviewed in all four periods.
Dynamics of fertilizer application rates
By examining fertilizer application rates for households using fertilizer and for the whole sample of households sur-
Figure 16.4 Average Difference in Mean Household Fertilizer Application Rates from 1997 Levels, by Region
veyed, including nonusers, one can observe a trend in the intensity of fertilizer use (kilogram per acre of maize) since the inception of fertilizer reforms in the 1990s. For compar- ison at the household level, plot-level application rates using plot area (acres) as weights are aggregated.3 First, for each region, the differences between the weighted mean house- hold application rates (kilograms per acre) for the years 2000, 2004, and 2007 are compared with the rates for 1997, revealing whether application rates increased, decreased or remained the same in subsequent years compared with the
20 15 10
7.8 5
0
10.7
19.0
0.1
1.5 1.9
base period of 1997. Figure 16.4 shows the trend in this indicator using the base year 1997.
Clearly, weighted mean household application rates have increased relative to those in 1997 (and also from one year to the next) for each region. It is also obvious that in absolute terms, the differences are much smaller in the low-potential region, probably as a result of lower application rates and the lower proportion of fertilizer users (the latter shown in table 16.2). Table 16.3 supplies information on fertilizer application rates (kilograms per acre) for two sets of households: the whole sample of households surveyed (the sum of fertilizer users and nonusers), and a subset consisting of households that used fertilizer (only users).
As shown in table 16.3, fertilizer application rates have increased from their 1997 levels for all regions and agro- zones, although intensities differ across regions and agro- zones. The high- potential maize zone (HPMZ), which
High-potential region Low-potential region Source: Authors, estimated from Tegemeo Institute/Egerton University household surveys, 1997, 2000, 2004, and 2007. includes Trans Nzoia and Uasin Gishu, and the Central Highland zone have some of the highest application rates in the sample. For example, the HPMZ’s rates for fertilizer users only in 1997 and 2007 are 157.3 and 181.1 kilograms per hectare, similar to rates in Asia, which benefited from the green revolution and now has one of the highest fertil- izer application rates in the world. Trend in maize yields for unfertilized plots and different seed technologies
As shown in figure 16.4 and table 16.3, fertilizer application has increased significantly since the reforms of the 1990s,

276 CHAPTER 16: FERTILIZER IN KENYA: FACTORS DRIVING THE INCREASE IN USAGE BY SMALLHOLDER FARMERS
Table 16.3 Fertilizer Application Rates for Maize-Growing Households in Kenya, by Region and Zone (kilograms per acre)
Region/zone High-potential region
Sum of fertilizer users and nonusers Fertilizer users only 1997 2000 2004 2007 1997 2000 2004 2007
Western transitional 23.0 47.1 46.5 57.3 57.5 73.0 63.8 71.8 High-potential maize zone 53.1 58.5 60.9 65.4 63.7 66.5 70.4 73.3 Western highlands 26.9 40.6 49.6 48.4 36.3 45.4 54.0 51.7 Central highlands 62.2 68.4 73.4 67.2 68.8 77.9 84.2 74.1
Subsample 46.3 56.1 59.5 61.6 60.6 66.7 70.0 69.6 Low-potential region
Coastal lowland 0.4 0.8 0.1 1.6 10.4 19.6 2.1 13.9 Eastern lowland 3.1 5.7 8.3 9.6 12.1 24.8 19.7 23.9 Western lowland 0.4 0.5 0.9 2.3 21.3 16.4 19.4 18.6
Subsample 1.4 2.8 4.0 5.3 12.7 23.6 19.1 22.0 Grand total 33.3 38.0 43.1 45.0 58.0 63.8 65.2 64.7
Source: Authors, estimated from Tegemeo Institute/Egerton University household surveys, 1997, 2000, 2004, and 2007. Note: When estimating rates for the whole set of households, “zeros” are used for households not using fertilizer, making these rates lower or equal to rates calculated for the group including fertilizer users only (depending on presence of nonusers).
when markets were opened up to competition. But have the reforms and the rise in consumption of fertilizer, had an effect on maize production? Looking at the dynamics of maize yields for plots that received fertilizer and those that did not across the survey years and for different seed types provides information on this question.
First, as shown in figure 16.5, yields from fertilized and unfertilized plots generally increased between 1997 and 2007. Second, irrespective of fertilization, yields for hybrid seed plots are higher than those for nonhybrid plots. Third, for each seed technology, yields for fertilized fields are higher than those for unfertilized fields. And finally, yields for plots that receive fertilizer and use hybrid seeds are the highest for each of the four survey years.4
Although yields generally increased between each sur- vey year and the next, the increase was particularly signif- icant between 1997 and 2000. This may partly be explained by the favorable prices for maize following a poor maize crop in the 1998/99 season; as a result, the fer- tilizer-to-maize price ratio was lower at the start of the planting season for year 2000, an incentive to farmers to increase their fertilizer use during that season (using naive price expectations based on recent output prices). Figure 16.6 shows the existence of regional differences in the yield-fertilizer nexus for the period covered by the household surveys.
Figure 16.6 shows clear differences in the potential for maize production in the two regions. Even without fertiliza- tion, yields for unfertilized plots in the high-potential region are generally higher than those from fertilized plots
in the low- potential region, indicating that the effects of fertilizer use vary according to other factors.
Table 16.4, which expresses yields in metric tons per acre, can be used to show why the maize yield estimates reported by the Ministry of Agriculture are different from the com- posite yield measure used in this paper. The Ministry of Agriculture estimates are generally lower than the compos- ite yield (that is, the sum of the yields for maize and other crops in the same plot converted to an index using price ratio of each crop to that of maize), and they do not reflect the true returns to inputs applied to the plot or field. The composite yield measure increased from 0.9 ton in 1997 to 1.4 tons in 2007, whereas the standard measure by the Min- istry of Agriculture, increased from 0.6 to 1.0 ton per acre over the same years. Trends in wholesale price margins Price margins can indicate the state of competition and innovations that reduce marketing costs between two points of interest by improving market efficiency. As shown in figure 16.7, the margin between the wholesale world price of fertilizer, as measured by the cost, insurance, and freight (CIF) of fertilizer arriving in the port of Mombasa on the east coast of Kenya, and prices in the hinterland town of Nakuru has declined dramatically in the years between 1990 and 2008.
The world price of fertilizer remained fairly constant from 1990 to 2007, when it rose sharply (see figure 16.7). During this period the wholesale cost of fertilizer in Nakuru steadily

CHAPTER 16: FERTILIZER IN KENYA: FACTORS DRIVING THE INCREASE IN USAGE BY SMALLHOLDER FARMERS 277
Kilo
gram
s pe
r acr
e Ki
logr
ams
per a
cre
Figure 16.5 Trend in Maize Yields in Fertilized and Unfertilized Plots in Kenya for Different Seed Technologies
2,000
a. Plots not using fertilizer b. Plots using fertilizer
1,500
1,000
500
0
Hybrid seed Nonhybrid Hybrid seed Nonhybrid
Source: Authors, estimated from Tegemeo Institute/Egerton University household surveys, 1997, 2000, 2004, and 2007.
Figure 16.6 Trend in Maize Yields for Fertilized and Unfertilized Plots in Kenya, by Region
2,000
a. High-potential region b. Low-potential region
1,500
1,000
500
0
Unfertilized Fertilized Unfertilized Fertilized
Source: Authors, estimated from Tegemeo Institute/Egerton University household surveys, 1997, 2000, 2004, and 2007.
declined, implying that the costs of marketing fertilizer there had declined, leading to lower prices at Nakuru. Studies (Kimuyu 1994; Wanzala, Jayne, and Staatz 2002; Allgood and Kilungo 1996; IFDC 2001), based on interviews with stake-
holders suggest this reduction is a result of increased compe- tition after reforms in the 1990s, economies of scope result- ing from mergers, and access to competitive credit from international sources.

278 CHAPTER 16: FERTILIZER IN KENYA: FACTORS DRIVING THE INCREASE IN USAGE BY SMALLHOLDER FARMERS
Cos
t per
50
kilog
ram
bag
(con
stant
200
7 K
sh)
Table 16.4 Trend in Composite and “Standard” Maize Yields in Kenya, by Region and Zone (tons per acre)
High-potential region
1997 2000 2004 2007
Western transitional 0.7(0.5) 1.2(0.8) 1.0(1.0) 1.6(1.2) High-potential maize zone 1.3(1.1) 1.3(1.0) 1.6(1.4) 1.6(1.3) Western highlands 0.7(0.5) 1.7(0.9) 0.9(0.8) 1.4(0.9) Central highlands 1.2(0.6) 1.8(1.1) 1.7(1.0) 2.3(1.3)
Subtotal 1.1(0.8) 1.4(1.0) 1.4(1.1) 1.7(1.2) Low-potential region
Coastal lowland
0.5(0.2)
1.0(0.6)
0.5(0.3)
0.8(0.5) Eastern lowland 0.4(0.2) 1.0(0.5) 0.6(0.4) 0.8(0.5) Western lowland 0.5(0.3) 0.7(0.4) 0.5(0.3) 0.9(0.7)
Subtotal 0.5(0.2) 0.9(0.5) 0.5(0.3) 0.9(0.6) Grand total 0.9(0.6) 1.3(0.8) 1.2(0.9) 1.4(1.0)
Source: Composite yield estimated by authors from Tegemeo Institute/Egerton University household surveys, 1997, 2000, 2004, and 2007. Maize-only yield from Kenya Ministry of Agriculture.
Figure 16.7 Price of Diammonium Phosphate in
Mombasa and Nakuru
4,400
4,000
3,600
3,200
2,800
2,400
2,000
1,600
1,200
800
Nakuru, wholesale Mombasa, cif
Source: Kenya Ministry of Agriculture.
HOUSEHOLD AND OTHER DETERMINANTS OF FERTILIZER DEMAND
Using variables including education, value of assets, land size, land preparation technology, gender of the household head, as well as geographic factors such as distance to fertil- izer seller, agro-ecological conditions, soil types, and market conditions, it is possible to conduct a regression analysis of fertilizer demand in the high-potential and low-potential regions of Kenya. This analysis will provide a measure of diversity or heterogeneity in demand across the country and between different households that face varied surroundings, knowledge that is important in setting appropriate policy geared to achieving food security for smallholders.
The analysis conducted for this paper used regression methods including random effects (RE), fixed effects (FE), and correlated random effects (CRE) to model fertilizer demand (application rate per acre). The RE approach assumes strict exogeneity between explanatory variables and composite error term, which includes unobserved household-specific heterogeneity. On the other hand, FE does not assume strict exogeneity but takes the unob- served effects as constant over time and uses a differencing approach to remove these effects to generate consistent estimates. Unlike FE, the CRE method extends the RE analysis by modeling unobserved heterogeneity using the household means of time-varying variables. Therefore, with CRE, it is possible to test whether the model captures unobserved effects and to use estimates of these effects to classify households or explain differences between house- holds (Wooldridge 2002). An additional benefit of CRE is that the estimates on the time-varying variables are the same as those in the FE estimation, and unlike in the FE approach, the effect of time-constant factors (such as gender and location dummies) are estimated as well (not differenced away as in FE).
Using CRE, it is possible to reject the null hypothesis of nonexistence of unobserved heterogeneity, implying that the FE approach is more appropriate than RE, which assumes exogeneity. However, CRE regression offers the benefit of producing the same estimates as FE regression for time-varying variables, while at the same time providing a way to model heterogeneity so as to explain differences across households based on skills and other factors that can- not be observed or for which data cannot be obtained. For these reasons, the results of only the CRE method are dis- cussed here, using a double-hurdle approach.

CHAPTER 16: FERTILIZER IN KENYA: FACTORS DRIVING THE INCREASE IN USAGE BY SMALLHOLDER FARMERS 279
Table 16.5 Fertilizer Market Participation and Demand Using Correlated Random Effects to Model Household Heterogeneity
Variables
High-potential region Low-potential region
Market Consumption Market Consumption participation (kilograms/acre) participation (kilograms/acre)
Table 16.5, presents the results of the CRE regressions for the high- and low-potential regions for fertilizer mar- ket participation and consumption or use decisions. For the double-hurdle model, the same variable can have
different sign and magnitude in the market participation and demand equations, unlike the Tobit model, which assumes the same effect and magnitude in both equa- tions.
Dependent variable (units) (0/1) (kilograms/acre) (0/1) (kilograms/acre) Price for nitrogen (K Sh/kilogram) 0.015 –0.831* –0.009 –0.175**
(0.005) (0.439) (0.009) (0.081) Price for maize grain (K Sh/kilogram) –0.003 0.313 –0.003 –0.016
Age of household head (years)
(0.003) –0.002** (0.001)
(0.218) (0.004) –0.001 (0.001)
(0.026)
Quintiles for value of household assets: 2
0.012
0.853
–0.047
0.359*
(0.016) (1.421) (0.029) (0.206) 3 0.001 1.108 0.016 0.571***
4
(0.019) –0.017
(1.554) –0.101
(0.031) –0.001
(0.219) 0.401*
(0.022) (1.704) (0.032) (0.241) 5 –0.012 2.454 0.021 0.897***
(0.024) (1.849) (0.036) (0.261) Quintiles for total cropped land: 2
0.021
–3.767***
0.007
0.130
3
4
(0.019) 0.038*
(0.021) 0.068***
(1.394) –4.270*** (1.505) –3.995**
(0.026) –0.006 (0.027) –0.007
(0.202) –0.326 (0.216) 0.058
(0.022) (1.680) (0.028) (0.235) 5 0.069*** –1.594 0.006 –0.261
(0.025) (1.926) (0.032) (0.264) Categories for education of head of household: 2 1–4 years
–0.018
1.475
–0.066
–0.305
(0.022) (2.696) (0.035) (0.338) 3 5–8 years –0.017 0.546 –0.036 –0.155
(0.022) (2.640) (0.034) (0.289) 4 9–12 years 0.001 5.605* 0.043 0.379
(0.024) (2.897) (0.044) (0.357) 5 > 12 years 0.032 6.416* 0.100 0.133
(0.029) (3.698) (0.067) (0.537) Categories for land preparation technology: 2 Oxen
0.101***
4.330**
–0.016
0.011
(0.021) (1.768) (0.027) (0.200) 3 Tractor 0.147*** 5.670*** –0.030 0.056
(0.020) (1.701) (0.040) (0.293) Categories for land tenure: 2 Own land without title
0.005
–0.088
0.027
0.068
(0.014) (1.069) (0.018) (0.142) 3 Renting land 0.054*** –1.047 0.030 –0.299
Dummy (1= female head of household)
(0.018) –0.023 (0.018)
(1.508) –0.647 (1.669)
(0.036) –0.060*** (0.020)
(0.303) –0.281* (0.197)
Categories of soil types: 2
0.007
–1.595
–0.162**
–0.479
(0.040) (4.346) (0.079) (0.872)
(continued next page)

280 CHAPTER 16: FERTILIZER IN KENYA: FACTORS DRIVING THE INCREASE IN USAGE BY SMALLHOLDER FARMERS
Table 16.5 (continued)
High-potential region Low-potential region
Variables
Market
participation
Consumption
(kilograms/acre)
Market
participation
Consumption
(kilograms/acre)
3 0.020 –1.643 (0.028) (2.903)
4 0.009 –1.708 –0.008 –0.143
(0.024) (2.577) (0.075) (0.578) 5 –0.094* –7.913* –0.083 –0.377
(0.054) (4.362) (0.103) (0.907) Agro-zone dummies (central lowland and west transitional dropped): 3 Eastern lowlands –0.036 –0.195
(0.064) (0.710) 4 Western lowlands 0.389*** 2.324**
(0.110) (1.133) 6 High-potential maize 0.398*** –0.435
(0.050) (3.891) 7 West highlands 0.263*** –2.239
(0.059) (4.134) 8 Central highlands 0.423*** 19.053***
(0.058) (6.189) Dummy (1= single crop in plot) –0.061*** –0.307 –0.001 –0.042
(0.016) (1.084) (0.018) (0.161) Mundlak–Chamberlain device: Price for nitrogen (K Sh / kilogram) –0.064** –1.246 –0.062 0.525
(0.025) (2.880) (0.061) (0.576) Price for maize grain (K Sh/kilogram) 0.053*** –1.669 0.030*** 0.098
(0.011) (1.075) (0.010) (0.092) Dependency ratio (dependants to productive
members) –0.001 –0.359 0.002 –0.005 (0.002) (0.287) (0.004) (0.039)
Distance to fertilizer seller –0.023*** 0.641 –0.009*** –0.012 (0.005) (0.629) (0.003) (0.025)
Duration as head of household (years) 0.004** 0.001 (0.002) (0.002)
Quintiles for value of household assets: 2 0.015 4.074 0.096 –0.495
(0.036) (4.228) (0.065) (0.561) 3 0.088** –3.910 0.046 –0.396
(0.038) (4.261) (0.061) (0.537) 4 0.111*** 0.454 0.058 0.218
(0.040) (4.353) (0.062) (0.567) 5 0.103** –1.483 0.057 –0.064
(0.044) (4.683) (0.064) (0.593) Quintiles for total cropped land: 2 –0.046 –2.737 0.190*** –1.039
(0.037) (4.147) (0.068) (0.548) 3 –0.002 4.387 0.238*** –0.278
(0.038) (4.129) (0.065) (0.529) 4 –0.067* 0.031 0.173*** –0.489
(0.038) (4.117) (0.064) (0.562) 5 –0.007 2.099 0.178*** –0.657
(0.043) (4.483) (0.068) (0.585) Fractions of 20-day periods with
< 40 millimeters of rain in season –0.185*** –26.845** 0.100 6.206 (0.124) (12.346) (0.254) (2.479)
Observations (plots) 4,051 4,051 1,782 1,782
Source: Authors. Note: Quintiles range from lowest (1) to highest (5) for asset values and land sizes (estimates shown in the table are compared with lowest quintile, which is dropped). Estimates for the remainder of categories (land preparation, zones, tenure, and others) should be interpreted in relation to the omitted category (category 1). Standard errors are in parentheses; *** p < 0.01, ** p < 0.05, * p <0.1.

CHAPTER 16: FERTILIZER IN KENYA: FACTORS DRIVING THE INCREASE IN USAGE BY SMALLHOLDER FARMERS 281
Effect of fertilizer and maize prices on demand for fertilizer
Results of the regression analysis presented in table 16.5 show that when fertilizer prices increase by approxi- mately 278 shillings per 50 kilogram bag, household fer- tilizer application rates (kilograms per acre) decline by 4.4 kilograms (high-potential region) and 1.1 kilograms (low-potential region). For the high-potential region, this translates to a response elasticity of 0.52 (that is, a 10 percent increase in fertilizer price leads to a 5.2 percent decline in application rates per acre). The elasticity for low-potential region is 0.32.
From the Mundlak-Chamberlain device (Wooldridge 2002), it is evident that households facing higher fertilizer prices have lower probability of participation, while those facing higher maize output prices have higher probability of participation in fertilizer markets. There is a reduction in probability of market participation of 0.64 points for households facing a 10 K Sh-per-kilogram higher fertilizer price (or K Sh 500 per 50-kilogram bag), while the proba- bility of participation by households facing a similar higher maize output price is higher by 0.53 points for the high- potential region (0.30 in low-potential region)—that is, households facing higher fertilizer prices have lower proba- bility of market participation, while those facing higher out- put prices have higher probability. However, the effect of prices on the decision about how many kilograms of fertil- izer to apply per acre is not significantly different across households. This finding implies that price signals are important in determining farmers’ decision to participate in fertilizer markets.
Effect of household resource endowments on demand for fertilizer
The analysis also takes into account the effect of some mea- sures of resource endowment (asset values and land size) on fertilizer demand. Although the probability of market par- ticipation for the low-potential region does not change with value of assets, the application rate rises with assets. Raising a household’s assets from the lowest quintile to the third quintile or the fifth quintile, for example, raises the applica- tion rates by 0.571 and 0.897 kilogram per acre, respectively. But when contrasting different households in the high- potential region, it is evident that households with assets of a higher value have a greater probability of participating in the fertilizer market.
A related measure of resources is the amount of land under crops during the season (because data used for this
analysis do not include total land owned for the year 2000, land under crops is used as a proxy for this variable). Although the probability of market participation rises with an increase in the size of land for households in the high- potential region, the amount applied per acre decreases with land size. Households with more land under crops in the low-potential region have a higher probability of market participation, although the rates per acre are not signifi- cantly different from those with less land under crops. Effect of land tenure, gender, land preparation technology, and mixed cropping on demand for fertilizer
Households that rent land have a higher probability of fer- tilizer market participation (by 0.05 points) than those that have title to their land, but differences in application rates across land tenure categories are not significant. Female- headed households have a lower probability of market par- ticipation (0.06) and intensity per acre (0.28) compared with male-headed households in the low-potential region. Although signs of estimates are the same as those in the high-potential region, gender estimates for the high-poten- tial region are not significant. The authors find no plausible explanation why the low-potential region has a gender effect while the high-potential region does not.
In terms of agro-ecological zones, households in the cen- tral highlands have a 0.4-point higher probability of partic- ipating in fertilizer markets than those in the western tran- sitional zone and apply 5.95 kilograms more fertilizer per acre. On land preparation technology, there is a higher probability of market participation for households using animal draught (0.1) or tractors (0.14) compared with manual hoeing; fertilizer application per acre for these households also increases by 4.4 and 5.6 kilograms, respec- tively, over manual technologies. Households that do inter- crop or mix cropping (that is, plant maize with one or more other crops in the same plot) have a higher probability of fertilizer market involvement than those growing only maize. However, application rates do not significantly differ with intensity of mixed cropping. Effect of distance to fertilizer seller, education, and experience on demand for fertilizer
Households that are further away from fertilizer sellers have lower probability of participating in the market (0.023 points per kilometer for the high-potential region and 0.01 points for low-potential region). In other words, households in the high-potential region that are located 10 kilometers away

282 CHAPTER 16: FERTILIZER IN KENYA: FACTORS DRIVING THE INCREASE IN USAGE BY SMALLHOLDER FARMERS
from fertilizer retailers have a 0.23-point lower probability of participating in fertilizer markets, but application rates per acre do not differ significantly. Households with head who have more years of schooling have a positive but insignificant probability of participating in the market than those who do not. The intensity of application per acre is positive with years of education (and significant for high-potential region). Age of household head in the high-potential region has a negative relationship with probability of participation but not the intensity of application. The number of years or duration as the head of household has a positive effect on probability of participation in the market in the high-potential region; experience as head of household raises chances of market participation.
LESSONS LEARNED, SUSTAINABILITY, AND POTENTIAL FOR REPLICABILITY
When examining the factors driving growth in fertilizer use and maize productivity in Kenya from the early 1990s to 2007, the basic story is one of synergies between the liberal- ization of input and maize markets on one hand and public investments in support of smallholder agriculture on the other, a situation that has led to tangible private sector investment in fertilizer retailing and maize marketing, which in turn has encouraged an impressive rise in fertilizer use and maize yields on smallholder farms over the period 1997–2007. This narrative is complicated, however, by the many changes that Kenya’s economy and business environ- ment has experienced during this period, both positive and negative, which have also undoubtedly affected the incen- tives of farmers, consumers, and private marketing agents. These factors may not be directly linked to the fertilizer and maize markets, but their influence on observed indicators cannot be analytically separated from those of the reforms highlighted in this paper. However, it is reasonable to assume that these influences outside the agricultural sector are of second-order magnitude, compared with the more direct agricultural policy reforms and investments, in explaining the behavioral responses of farmers and fertilizer and maize marketing agents.
There are several pathways through which government actions in fertilizer and maize markets has positively affected the agricultural sector and rural and urban living standards in Kenya in recent years. As shown in figure 16.2, the government of Kenya implemented a number of policy reforms affecting the incentives for investment by private fertilizer distribution firms. The government also legalized domestic and regional maize trade, although other actions
during the 1990s partially eroded the potential response by the private sector. Despite the mixed government stance toward maize market liberalization during the 1990s and early 2000s, evidence of increased private sector investment is tangible. Traders buying maize directly from farmers have penetrated more deeply into smallholder areas. Increased competition and efficiency in maize milling and retailing is also evident in the significant decline in maize marketing margins. There is also strong evidence of increased state investment in public goods supportive of private sector investment, especially since the creation of the Constituency Development Fund (CDF) in 2003. The combination of supportive policy changes in the fertilizer, foreign exchange, and maize markets, coupled with improved access to markets and services made possible by public good investments, appears to have stimulated investment by the private sector in both maize and fertilizer marketing. These factors have worked synergistically to bring about important gains in maize productivity and benefits to smallholder farmers and consumers in Kenya.
Evidence of increased smallholder fertilizer use and maize yields is drawn from nationwide household panel data from four surveys conducted by Egerton University’s Tegemeo Institute between 1997 and 2007. Because the data constitute a balanced nationwide panel of 1,260 households,5 the results provide a fairly reliable indicator of the changes in fertilizer use patterns over time, although the surveys are not strictly nationally representative. The main findings of the surveys are as follows: The percentage of sampled smallholders using fertilizer
on maize increased from 56 percent in 1996 to 70 percent in 2007.
Fertilizer application rates (for all maize fields including unfertilized fields) rose from 34 kilograms an acre in 1997 to 45 kilograms an acre in 2007, a 32 percent increase.
There are wide regional variations in fertilizer use. More than 90 percent of smallholder farmers use fertilizer on maize in three of the broad zones surveyed: the high- potential maize zone, western highlands, and central highlands. Fertilizer use is low and barely rising in most of the semiarid regions (coastal and western lowlands, and the marginal rain shadow). However, fertilizer use has risen impressively in the medium-potential eastern lowlands and Western Transitional zones, where the percentage of households using fertilizer on maize rose from 21 and 39 percent, respectively, in 1997 to 43 and 81 percent in 2007.
CHAPTER 16: FERTILIZER IN KENYA: FACTORS DRIVING THE INCREASE IN USAGE BY SMALLHOLDER FARMERS 283
While the total area under maize in Kenya remained largely constant over 1997–2007, maize yields increased by roughly 18 percent during the same period. This yield improvement is not borne out in official government maize production statistics, however, which do not take into account the shift over time in the proportion of maize area grown under intercropped cultivation or the shift over time in the proportion of maize area grown in relatively semiarid regions, which has been facilitated by the release of improved maize cultivars well suited to mid- and low-altitude areas of the country. To assess changes in maize yield, it is important to account for the gradual shift in the proportion of maize area under monocropped versus intercropped cultivation as well as the expansion of maize production in the more semiarid parts of the country. After stratifying between hybrid and nonhybrid users and between intercropped and monocropped maize fields, the household survey data show that maize yields on all types of fields have increased over time, reflecting the influence of many fac- tors in addition to fertilizer use. Fertilizer use and maize yields have increased especially rapidly on the inter- cropped fields, less so on monocropped fields.
Fertilizer marketing costs declined substantially in con- stant K Sh between the mid-1990s and 2007. Interviews with key informants in Kenya’s fertilizer sector identified four factors responsible for the declining fertilizer mar- keting costs observed in Kenya: the potential for cheaper backhaul transportation has been exploited by making more use of trucks transporting cargo from Rwanda and Democratic Republic of Congo to the port of Mombasa; private importers are increasingly using international connections to obtain credit at lower interest rates and financing costs than are available in the domestic econ- omy; local and international firms have merged, enabling shared knowledge and economies of scope that save local distribution costs; and increased competition among local importers and wholesalers has expanded the num- ber of firms engaged in fertilizer marketing since the early 1990s. It is likely that the fourth factor—increased competition—has to some extent stimulated firms to exploit the other cost-reducing innovations identified in order to maintain their market position.
To assess the robustness of the Tegemeo Institute’s sur-
vey findings, the proportion of smallholder households purchasing fertilizer according to the survey results was compared with estimates based on three other analyses covering a subset of the same districts during the same
general time period. The Tegemeo survey estimates are comparable and in some cases lower than other estimates of fertilizer purchases and dose rates. The rise in smallholder use of fertilizer in the Tegemeo survey data is also consis- tent with official Ministry of Agriculture figures (shown in figure 16.1), which indicate that total fertilizer consump- tion in Kenya rose 65 percent between 1997 and 2007.
The rise in fertilizer use in Kenya has not been uniform across regions, however. Use rates are much higher in areas where the main-season rainfall is relatively high and stable than they are in the drier areas. Fertilizer use is highly risky in many of the semiarid regions, where environmental fac- tors are likely to limit the role of fertilizer in contributing to poverty alleviation and food security unless it is accompa- nied by actions to improve soil organic matter and moisture (Marenya and Barrett 2008). Within a given agro-ecological zone, it is evident that the decision of households to pur- chase fertilizer is only slightly related to farm size and unre- lated to household wealth. In relatively productive areas, the proportion of poorer and wealthier households applying fertilizer on maize is similar. In risky environments, only a small proportion of either poor or wealthy households use fertilizer on maize.
These gains in smallholder fertilizer use and maize yields have been encouraged by Kenya’s decision to liberalize input and maize markets in the early 1990s. New entries and investment in fertilizer wholesaling and retailing have been massive since the early 1990s. The International Fertilizer Development Center (IFDC) estimates that more than 500 wholesalers and 7,000 retailers are operating in the country. This has led to a denser network of rural retailers and a major reduction in the distance between farms and fertilizer sellers, which has contributed to the impressive growth in fertilizer use by Kenyan smallholders from the early 1990s to 2007. The Tegemeo Institute survey data also indicate that the mean distance traveled by farmers to sell their maize to private traders declined over 1997–2007; the median distance as of 2007 was zero, indicating that assem- bly traders tend to purchase maize right from farmers’ fields. Analysis of wholesale maize grain prices and retail maize meal prices indicate that the miller-retail marketing margin has declined significantly over time, conferring benefits mainly to consumers. More than 50 percent of rural farm households are either buyers or net buyers of maize, while virtually all urban households purchase maize meal each year (Mukumbu and Jayne 1994; Jayne and Argwings-Kodhek 1997).
Other signs of improvement in maize markets in Kenya include farmers’ level of satisfaction with the performance

284 CHAPTER 16: FERTILIZER IN KENYA: FACTORS DRIVING THE INCREASE IN USAGE BY SMALLHOLDER FARMERS
tonn
e m
aize
/tonn
e DA
P fe
rtiliz
er p
rice
ratio
of maize markets from their subjective perspective. More than 65 percent of farmers surveyed in the nationwide Tege- meo Institute rural surveys indicated that they prefer the current liberalized maize marketing system to the former controlled marketing system, primarily because grain is eas- ier to sell, farmers are paid in cash at the time of sale, and maize is more reliably available for purchase.
In 2008, however, the positive trends in Kenya’s maize and fertilizer markets were reversed by civil disruption, drought, and the unprecedented surge in world fertilizer prices. The civil unrest led to the destruction of much phys- ical infrastructure in western Kenya, such as petrol stations and grain storage, as well as to the closing of many input supply stores, in early 2008. Moreover, incentives to use fer- tilizer in Kenya have been adversely affected both by drought and world events as maize/fertilizer price ratios plunged to their lowest level in at least 18 years. Figure 16.8 plots monthly wholesale maize to wholesale fertilizer price ratios per ton in Nakuru. The higher the ratio, the more profitable the maize, and therefore the greater the incentive to apply fertilizer on maize. While this ratio has historically ranged between 0.4 and 0.6 at the time of planting, in 2008 it plunged to below 0.25 because of the increase in world fertilizer prices. The price of maize in Kenya has not risen nearly as dramatically as fertilizer.
These findings have implications for policy options. The main general lesson is the need for a public-private
Figure 16.8 Maize/Fertilizer Price Ratios, Nakuru, Kenya, 1994–2008
0.8
0.7
0.6
0.5
0.4
0.3
0.2
0.1
Source: Kenya Ministry of Agriculture, Market Information Bureau. Note: Price ratio is defined as the wholesale market price per ton of maize in Nakuru divided by the cost of diammonium phosphate (CIF) in Nakuru per ton, in nominal Kenyan shillings.
relationship that encourages investment in input and out- put marketing services for smallholder farmers. In Kenya’s case, this relationship was achieved through a combination of investments in public goods and institutional reforms supportive of liberalized marketing, even though the maize marketing reforms were at times subject to rever- sals. Considerable additional gains could be made in smallholder and consumer welfare if progress could also be made in the following areas: Consider changes in government actions in the transport sector that could reduce fertilizer and grain distribution costs. For example, because of fre- quent delays in off-loading of commodities at the port of Mombasa and because of the erosion of the regional railway system, it is difficult to arrange for upcountry transport of a full shipload of fertilizer. Because of this coordination prob- lem, fertilizer importers have invested in storage facilities near the port where fertilizer can be temporarily stored until trucks arrive for loading and upcountry distribution. These investments make sense if upland transport con- straints and the delays and inefficiency at the Port of Mombasa are taken as given. However, if procedures for streamlining the efficiency of off-loading at the port could be achieved (for example, by privatizing stevedore services and issuing performance contracts or by devolving wider management of port operations to professional firms), thus reducing off-loading time and the storage costs incurred at Mombasa for lack of sufficient transport, then fertilizer importing firms could avoid these extra charges. In a com- petitive marketing environment, these reductions in fertil- izer marketing costs would then be passed along in the form of lower farm gate prices.6
Reduce transaction costs associated with VAT and port operations. Currently fertilizer, as well as most other farm inputs, is zero-rated with respect to import duties. This means that no duty is charged on fertilizers, although at least until 2007, a VAT on related services was still levied. A VAT is charged, for example, on transport and services such as bagging at the port of Mombasa. Although the VAT is supposed to be refunded, the process is lengthy and is a source of continuing frustration for market participants. In addition, port handling charges, Kenya Bureau of Stan- dards charges, and other taxes account for 17 percent of CIF (Gitonga 2004). Port fees, levies, and accessorial charges need to be rationalized and aggregated. In addition, the numerous documentation procedures need to be reduced and, if possible, provided through electronic means.

CHAPTER 16: FERTILIZER IN KENYA: FACTORS DRIVING THE INCREASE IN USAGE BY SMALLHOLDER FARMERS 285
Interviews with key informants in the fertilizer industry have identified numerous other potential sources of cost savings, many of which require action on the part of gov- ernment to improve efficiency.
Invest in rehabilitating the eroded rail, road, and port infrastructure, which would reduce distribu- tion costs. The farm gate price of fertilizer in western Kenya is roughly twice as high as the landed cost at Mom- basa, and transport costs are the major component of this cost difference. High farm gate prices of fertilizer restrict demand for its use and depress agricultural productivity. Hence, efforts to improve the efficiency of port costs and upland shipping would bring major economywide benefits. In particular, rail transport could reduce these costs sub- stantially and also save government spending on repairing roads damaged by heavy truck traffic.
Tailor fertilizer packages to local demand condi- tions. This action would increase demand from smaller farmers who require and are able to purchase only small packets. Repackaging of fertilizers from 50 kilogram packets into packets of 25, 10, 2, and 1 kilograms is increasingly taking place, but the process is sometimes associated with fertilizer adulteration and counterfeit products. (That said, adulteration and sales of counterfeit products are often isolated events rather than a well-organized activi- ties, according to Global Development Solutions.)7 Part of the wide fluctuation in the nitrogen and phosphorous concentration in fertilizers can be attributed to the absence of effective measurement and calibration facilities. In this context, the Kenya Plant Health Inspectorate Ser- vice and the Kenya Pesticide Board should become more effective in monitoring and controlling adulteration and counterfeit products, as well as in intensifying farmer and retailer awareness programs to help protect farmers from substandard products.
Raise fertilizer response rates through agronomic training of farmers. The profitability of fertilizer use could be enhanced by improving the aggregate crop yield response rates to fertilizer application. This requires mak- ing complementary investments in training for farmers on agronomic practices, soil fertility, water management, and efficient use of fertilizer and investing in crop science to generate more fertilizer-responsive seeds.8 Emerging problems of soil acidity in the maize belt of western Kenya indicate that soil pH levels may need to be raised to ensure profitable use of fertilizer in these areas. Survey
data commonly indicate that the contribution of fertilizer to food grain yields varies tremendously across farms even within the same villages. Simply bringing fertilizer response rates among the bottom half of the distribution up to the mean would result in substantial improvements in household and national food security (Nyoro, Kirimi, and Jayne 2004). Producer organizations, despite their poor track record, will be increasingly important for rural income growth. Assuming that the management prob- lems and politicization of producer organizations and cooperatives could be minimized, they might afford an important pathway for smallholders to achieve higher levels of input use and to adopt better production and marketing practices than the current separate and uncoordinated stages in the supply value chains. The role of independent producer groups would be to reduce the transaction costs and risks of private marketing firms dealing with farmers and to develop a production base through the transfer of credit, inputs, and know-how. The Farm Inputs Promotions and the Kenya Market Development Program/Cereal Grow- ers Association farmer training programs are examples of successful attempts by the government, development part- ners, and NGOs to assist and train groups and to utilize farm extension knowledge, supply chain development, and fertilizer technologies.
While all of these measures can contribute to increased fertilizer use, none is likely to prove effective on its own. Pol- icy makers should, therefore, select strategic combinations of supply- and demand-side measures to allow supply and demand to grow in parallel—strengthening the basis for viable private sector-led commercial fertilizer markets.
The final question is about the role of fertilizer subsidies. The greatest scope for subsidies to promote fertilizer use is in areas where fertilizer use is far below its optimal levels after taking into account the maize yield response to fertil- izer and the riskiness of applying fertilizer, especially in semiarid regions where crop failure is not unusual. Recent evidence indicates that crop response to fertilizer applica- tion varies widely among smallholder farmers even within the same villages because of differences in management practices, soil quality, timeliness of application, and so forth. The evidence also shows substantial scope for raising the efficiency of fertilizer use, at least for farmers who are currently getting lower response rates from fertilizer appli- cation than their more efficient neighbors (Marenya and Barrett 2009; Xu et al. 2009). Moreover, there is little empir- ical evidence to determine how prevailing levels of fertilizer

286 CHAPTER 16: FERTILIZER IN KENYA: FACTORS DRIVING THE INCREASE IN USAGE BY SMALLHOLDER FARMERS
application compare with optimal levels when taking these factors into account. Fertilizer use rates are clearly low in the semiarid areas of Kenya, and fertilizer subsidies in these areas would likely raise fertilizer use, but the contribution to yields and smallholder incomes may be quite limited because of the environmental riskiness and low response rates in such areas. A major question for semiarid areas, therefore, is whether poverty reduction and food security objectives can be best achieved through fertilizer subsidies or other types of public programs and investments. Given that resources are scarce, efforts should be made to identify the types of agricultural expenditures that will generate the greatest payoffs.
In the high-potential areas, a large majority of farmers is already purchasing fertilizer. Although use rates were quite high in 2007, they are likely to have fallen given the ensuing adverse conditions since then. Fertilizer subsidies are polit- ically attractive in that they promise increased fertilizer use and food production, but these outcomes are by no means assured. In 2009 Kenya faced its lowest maize production level in recent history after having initiated a major fertil- izer subsidy program; poor rains in 2009 rendered the fer- tilizer subsidy program relatively ineffective, leading the country to import more than 1 million tons of maize in 2009. Moreover, providing subsidized fertilizer in areas of high commercial demand will almost certainly result in a partial crowding out of commercial sales, as shown by the findings of studies conducted in Zambia and Malawi, where commercial demand for fertilizer is considerably lower than in Kenya (see Xu et al 2009; Dorward et al. 2008). Where purchase of commercial fertilizer is high, then a ton of subsidized fertilizer distributed by govern- ment is unlikely to result in an additional ton of fertilizer being applied on farmers’ fields, because the farmers previ- ously purchasing fertilizer are no longer likely to buy it if they can acquire the same amount more cheaply from a government program.
In the current high price environment, the availability of seasonal loans for input purchases takes on heightened importance for maintaining farmers’ effective commercial demand for fertilizer. Many Kenyan farmers have been able to finance fertilizer through the credit offered in the integrated input-output chains for crops such as tea, sugar, and coffee. These integrated marketing arrange- ments have also provided the means for farmers to obtain fertilizer for their food crops, since the companies can recoup their loans for other crops as well when the farm- ers sell their cash crop back to the company. But in areas where fertilizer use on a particular crop is profitable, such
as maize in western Kenya and horticulture throughout the country, most farmers have achieved reasonable levels of fertilizer use without credit. Support for the develop- ment of viable credit programs may also help smallholder farmers maintain their access to fertilizer use despite cur- rent high prices for households in which liquidity con- straints are the main problem.
The experience of Kenya demonstrates the role of a sup- portive policy environment that attracts local and foreign direct investment in improving smallholder farmers’ access to input and commodity markets. In Kenya’s case, a stable input marketing policy environment has fostered a private sector response that supports smallholder agricultural pro- ductivity and poverty alleviation. These goals remain elusive in countries lacking a sustained commitment to the devel- opment of viable commercial input delivery systems. While the government’s policy stance toward maize marketing has been prone to vacillation, the operations of the NCPB and the elimination of regional trade barriers since the inception of the East Africa Community Custom Union in January 2005 have both promoted maize price stability (Jayne, Myers, and Nyoro 2008; Chapoto and Jayne 2009). Comple- mentary programs to support small farmer productivity, such as the Farm Inputs Promotion program, the agro- dealer training and credit program, and the organization of farmers into groups to facilitate their access to exten- sion and credit services under the Kenya Market Develop- ment Program have also been important factors in raising fertilizer use in Kenya.
Because mean household incomes are higher and infra- structure relatively better in Kenya than in many other African countries, the market-led growth in smallholder fertilizer use in Kenya may not be easily transferable to countries where effective demand is highly constrained. Kenya’s success in increasing fertilizer usage among small- holder farmers is also tenuous. Sustaining the momentum will depend on continued public investment, good policy choices, favorable weather conditions, and avoidance of international events detrimental to Kenya. Governance problems and civil disruption are jeopardizing the sustain- ability of the commercially driven input distribution system and rural development more generally. Continued access to input credit for small farmers in many parts of the country will require government commitment to limit the potential for politicization and interference in the management of the interlinked crop marketing systems for sugarcane, tea, and coffee, which have provided a means for farmers to acquire additional fertilizer on credit for use on food crops. Also, new investment is needed in Kenya’s eroded rail, road, and

CHAPTER 16: FERTILIZER IN KENYA: FACTORS DRIVING THE INCREASE IN USAGE BY SMALLHOLDER FARMERS 287
port infrastructure if Kenya is to maintain its competitive- ness. Last, effective systems to improve smallholders’ crop husbandry and management practices are needed to provide incentives for continued expansion of fertilizer use and pro- ductivity growth in areas where fertilizer is only marginally profitable at present.
NOTES
1. “Kenya to Import 1.5 Million Bags of Cheap Fertilizer,” Daily Nation, June 23, 2009, p. 33. Throughout this chapter, “tons” are metric tons. 2. The high-potential region has higher productive poten-
tial and covers the agro-zones of Western and Central High- lands, High Maize Potential, and Western transition areas, which include the districts of Bomet, Bungoma, Gishu, Kakamega, Kisii, Meru, Muranga, Narok, Nakuru, Nyeri, Trans Nzoia, Uasin, and Vihiga. The low-potential region consists of the lowland zones in the coast, east, and west of the country (which are generally drier and have poorer- quality soil). The low-potential region includes the districts of Kilifi, Kisumu, Kitui, Kwale, Machakos, Makueni, Mwingi, Siaya, Taita, and Taveta. 3. The sum of the product of plot fertilizer application
rates and ratio of plot size (acres) to total acres is calculated for all plots in the household. This procedure gives more weight to application rates in bigger plots indetermining aggregate household application rates. Rate = Σ (plot rate * plot area / total household area). 4. Note that “hybrid” stands for purchased hybrid seed and
open pollinated varieties and “nonhybrid” consists of recy- cled or replanted hybrids and some “traditional” seed types of unknown source. 5. In other Tegemeo papers, the balanced panel consists of
1,275 households, but 15 households did not have complete information on all variables used in this study, hence the 1,260 sample size. 6. Some efficiency improvements in Mombasa port opera-
tions have been recently implemented, and more compre- hensive reforms are currently under consideration. 7. According to Global Development Solutions (2005),
nearly 3–5 percent of repackaged fertilizers are sold using counterfeit labels and packages. Specifically, fake brand name labels are used to sell inferior quality fertilizers. 8. Research indicates that the highest crop yield response is
obtained when improved seed, fertilizer, and agronomic practices to raise soil organic matter are combined (Marenya and Barrett 2008; Kelly 2006). In some areas, improved management practices may have greater impact on yields than use of fertilizer alone (Haggblade, Tembo, and Donovan 2004).
REFERENCES
Allgood, J. H., and J. Kilungo. 1996. “An Appraisal of the Fertilizer Market in Kenya and Recommendations for Improving Fertilizer Use Practices by Smallholder Farmers: A Field Report.” International Fertilizer Development Center (IFDC), Muscle Shoals, AL.
Ariga, J. M., and T. S. Jayne. 2008. “Maize Trade and Mar- keting Policy Interventions in Kenya.” Paper presented at the Conference on Food Marketing and Trade Policies in Eastern and Southern Africa. EST Division, Food and Agriculture Organization (FAO), Rome, March 1.
Ariga, J. M., T. S. Jayne, and J. Nyoro. 2006. “Factors Driving the Growth in Fertilizer Consumption in Kenya, 1990–2005: Sustaining the Momentum in Kenya and Lessons for Broader Replicability in Sub-Saharan Africa.” Working Paper 24, Tegemeo Institute, Egerton University, Nairobi.
Argwings-Kodhek, G. 1996. “The Impacts of Fertilizer Market Liberalization in Kenya.”
Policy Analysis Matrix Project of the Kenya Marketing Development Programme. Nairobi.
———. 2004. “Kenya Agriculture Sector Brief.” FAO, Rome. Chapoto, A., and T. S. Jayne. 2009. Open versus Closed Maize
Border Policy: A Comparison of Maize Price Instability in East and Southern Africa. International Development Working Paper. Department of Agricultural, Food, and Resource Economics, Michigan State University, East Lansing, MI.
Dorward, A., E. Chirwa, V. Kelly, T. Jayne, R. Slater, and D. Boughton. 2008. “Evaluation of the 2006/7 Agricultural Input Supply Programme, Malawi.” Final Report of the School of Oriental and African Studies, Wadonda Consult, Michigan State University, and Overseas Development Institute, undertaken for the Ministry of Agriculture and Food Security, Government of Malawi, Lilongwe.
Global Development Solutions. 2005. “From Laboratory to the Dining Table: Tracing the Value Chain of Kenyan Maize.” Report prepared for the World Bank. Reston, VA.
Gitonga. K. T. 2004. “Study on Rationalization and Harmo- nization of Policies, Regulations, Procedures, Grades, and Standards in the Fertilizer Sub-sector in Eastern Africa.” Kenya Report. Kampala: Eastern and Central Africa Program for Agricultural Policy Analysis.
Haggblade, S., G. Tembo, and C. Donovan. 2004. “House- hold Level Financial Incentives to Adoption of Conser- vation Agricultural Technologies in Africa.” Working Paper 9. Food Security Research Project, Lusaka.
IFDC (International Center for Soil Fertility and Agricul- tural Development ). 2001. “An Assessment of Fertilizer Prices in Kenya and Uganda: Domestic Prices vis-à-vis International Market Prices.” IFDC, Muscle Shoals, AL.

288 CHAPTER 16: FERTILIZER IN KENYA: FACTORS DRIVING THE INCREASE IN USAGE BY SMALLHOLDER FARMERS
Jayne, T. S., and G. Argwings-Kodhek. 1997. “Consumer Response to Maize Market Liberalization.” Food Policy 22 (5): 447–58.
Jayne, T. S., R. J. Myers, and J. Nyoro. 2008. “The Effects of Government Maize Marketing Policies on Maize Prices in Kenya.” Agricultural Economics 38 (3): 313–25.
Kelly, V. 2006. “Factors Affecting Demand for Fertilizer in Sub-Saharan Africa.” Agriculture and Rural Development Discussion Paper 23, World Bank, Washington, DC.
Kimuyu, P. 1994. “Evaluation of the USAID/Kenya Fertilizer Pricing and Marketing Reform Program.” U.S. Agency for International Development, Nairobi.
Marenya, P. P., and C. B. Barrett. 2008. Soil Quality and Fer- tilizer Use Rates among Smallholder Farmers in Western Kenya. Ithaca, N.Y: Cornell University.
Ministry of Agriculture, Kenya. 2004. “Strategy for Revital- izing Agriculture: 2004–2014.” Nairobi.
———. 2008. “Economic Review of Agriculture: 2008.” Central Planning and Project Monitoring Unit, Nairobi.
Mukumbu, M., and T. S. Jayne. 1994. “Urban Maize Meal Consumption Patterns: Strategies for Improving Food Access for Vulnerable Urban Households in Kenya.” Paper presented at the Symposium on Agricultural Policies and Food Security in Eastern Africa, Egerton University, Tegemeo Institute, Nairobi, May 19–20.
Nyoro, J., M., W. Kiiru, and T. S. Jayne. 1999. “Evolution of Kenya’s Maize Marketing Systems in the Post Liberaliza- tion Era.” Working Paper 2, Tegemeo Institute, Egerton University, Nairobi.
Nyoro, J., L. Kirimi, and T. Jayne. 2004. “Competitiveness of Kenya and Ugandan Maize Production: Challenges for the Future.” Working Paper 10, Tegemeo Institute, Egerton University, Nairobi.
Tegemeo Institute. 2007. “Enhancing Market Access and Technology Adoption among Smallholders: A Baseline Report for Evaluating Agricultural Interventions Funded by the Rockefeller Foundation in Western Kenya.” Report prepared for the Rockefeller Foundation, Egerton Uni- versity, Nairobi.
Wanzala, M., T. S. Jayne, and J. Staatz. 2002. “Fertilizer Markets and Agricultural Production Incentives: Insights from Kenya.” Working Paper 4, Tegemeo Insti- tute, Egerton University, Nairobi.
Wooldridge, J. 2002. Econometric Analysis of Cross Section and Panel Data. Cambridge, MA: MIT Press.
Xu, Z., B. Burke, T. S. Jayne, and J. Govereh. 2009. “Do Input Subsidy Programs “Crowd In” or “Crowd Out” Commer- cial Market Development? Modeling Fertilizer Demand in a Two-Channel Marketing System.” Agricultural Eco- nomics 40 (1): 79–94.