Embed Size (px)
Citation preview
*Corr. Author’s Address: Dalian University of Technology, Department of Mechanical Engineering, Dalian, China, [email protected] 135
Strojniški vestnik - Journal of Mechanical Engineering 60(2014)2, 135-144 Received for review: 2013-08-13© 2014 Journal of Mechanical Engineering. All rights reserved. Received revised form: 2013-11-15DOI:10.5545/sv-jme.2013.1368 Original Scientific Paper Accepted for publication: 2013-12-11
0 INTRODUCTION
Engineering fatigue fracture failure is one of the most common phenomena of mechanical and structural failure, statistically representing approximately 50 to 90% of total mechanical damage [1]. Lattice structures have been widely used in crane booms, steel plants, parking garages, offshore platforms and other fields [2] to [4]. In a crane, the lattice boom has better mechanical properties compared to a box boom of the same weight. However, the welding process of a lattice structure is complex. The defects on the structures located at high levels are occasionally difficult to detect, especially in the crane boom. If the boom welds are not examined in a timely manner, there will be a massive security risk. Therefore, lattice boom fatigue life assessment of a crane has considerable significance in ensuring safety during use.
Fatigue life assessment methods applied in the crane field applications began nearly two decades ago. The primary objects of the study were bridge cranes, gantry cranes, harbour cranes and other cranes with high levels of utilization [5] to [7]. The mainly welded structures of bridge cranes and gantry cranes are composed of flat butt weld or fillet weld structures, for
which the welding process and the stress conditions are simpler than those of the lattice boom.
Most scholars focused on the overall life estimation of the entire metal structure and the life assessment of the flat welded areas of the structure. There are many difficulties in performing fatigue life analysis of the lattice boom compared to other structures:(1) Because a lattice boom is primarily welded by a
large number of K-type and T-type pipe welded joints, a high probability of cracks or failure occurs in the poor working conditions in the latter part of the working time than for other types of cranes.
(2) The fatigue cycle of the utilization level of a lattice boom crane is in the overlap zone of low-cycle fatigue and high-cycle fatigue [1]. Strength analysis parameters, such as stress or strain, are difficult to choose because the structure stress state is complex.
(3) Because the structure of a lattice boom is more complex than that of a box boom, the fatigue experiments must design a special tooling equipment installation for the lattice boom connector. Therefore, few studies have been performed involving appropriate tooling design for the experiments.
Fatigue Life Analysis of Crane K-Type Welded Joints Based on Non-Linear Cumulative Damage Theory
Cai, F. – Wang, X. – Liu, J. – Zhao, F.Fuhai Cai1,* – Xin Wang1 – Jiquan Liu2 – Fuling Zhao1
1Dalian University of Technology, Department of Mechanical Engineering, China 2Jiangsu Bada Heavy Industry Machinery, China
There are large numbers of welds on cranes’ lattice booms. Due to notably complicated force conditions, the fatigue life analysis of the lattice boom is difficult when designing the limit life. The fatigue cycle of the utilization level of a lattice boom crane is in the overlap zone of low-cycle fatigue and high-cycle fatigue. The poor accuracy of measurement of the fatigue life of lattice booms indicates that the calculation dispersion of the linear Palmgren-Miner (PM) rule was high. To obtain real crane stress spectra inexpensively and conveniently, a new stress spectra acquisition method based on the ‘measured & simulated & compared & statistics’ integrated strategy of crane K-type welded joints is proposed. The errors of the maximum stress amplitudes between the measured stress spectra and the simulated stress spectra were less than 10%. The fatigue test results also indicated that errors of the test fatigue life were less than 10% under both the simulated and the measured stress spectra. A new, simplified Huffman non-linear cumulative damage theory is proposed to calculate the fatigue life of crane K-type welded joints based on the notch stress and strain approaches. The calculation results indicated that the accuracy of the non-linear damage accumulation was higher than that of the PM rule, although the calculation result based on the non-linear damage accumulation method was slightly un-conservative when the initial damage was not considered in the calculation. By setting different initial damage conditions, various results were analysed, which revealed that the calculation errors of fatigue life based on the non-linear theory were less than 10% when the initial damage levels were set from 0.02 to 0.04. Such results are appropriate for engineering applications. When the fatigue life calculation needs to be more conservative, the initial damage levels may be set from 0.04 to 0.07; the resulting calculation errors could be less than 25%. As the Huffman non-linear cumulative damage theory requires data from only a few material properties, such as the cyclic stress-strain curve and the constant amplitude strain-life curve, it could therefore be more suitable for engineering applications with higher calculation accuracy and fewer costs.Keywords: crane, lattice boom, K-type welded joints, fatigue life analysis, non-linear cumulative damage theory

Strojniški vestnik - Journal of Mechanical Engineering 60(2014)2, 135-144
136 Cai, F. – Wang, X. – Liu, J. – Zhao, F.
(4) It is costly and time-consuming to obtain effective stress-time spectra. The traditional method is to place strain gauges on the structure for an extended time to obtain information on structure deformation and strain. However, as the crane boom is quite large, the measurement points cannot cover the structures as much as desired.
(5) The Palmgren-Miner (PM) rule is a linear accumulation damage approach that is widely used for predicting the part’s lifespan under variable amplitude loading [8]. However, there is a considerable dispersion rate in the damage calculation, which results in a lower life assessment accuracy. In recent years, models have been developed based on a variety of techniques that join theories of fracture mechanics and empirical observations [9] to [12]. Other methods take into account the residual stresses caused by the plasticity of the material at the crack tip and the crack tip closing phenomena. Although these modelling methods are more accurate than the PM rule, they require substantially more experimental data to fit the necessary parameters.To solve such difficulties, a new method of
obtaining the stress-time spectra is proposed in this paper, based on the simulation software with the advantages of being economical and convenient. A simplified non-linear cumulative damage theory based on the strain parameter is introduced; it is suitable for engineering applications within elastic-plastic deformation structures, such as a crane lattice boom, because it requires only a small amount of material properties data, such as the cyclic stress-strain curve and the constant amplitude strain-life curve.
1 STRUCTURE LOAD CHARACTERISTICS
There are many K-type welded joints on a lattice boom. The flowchart of the fatigue life assessment is
shown in Fig. 1. Each step of the flowchart will be described in this paper.
Fig. 1. Flowchart of fatigue life assessment
1.1 Load Characteristics Analysis
A notable feature of a jib crane is that it has an overhang with a rotating boom as the main working component. A jib crane can work in a round or oblong space. The load characteristics of a lattice boom crane are shown as follows:(1) The load condition is complicated. The boom is
mainly subjected to a plane axial load force and a bending load force in the luffing plane, as shown in Fig. 2a. The boom is subjected to a lateral bending plane load force in the turning plane, as shown in Fig. 2b. The boom can withstand a compressive load, and the K-type weld joints are subjected to tension and compression composite fatigue loads, as is shown in Fig. 2c.
(2) The fatigue design parameter does not clearly correspond to the crane’s fatigue cycles. The utilization level of all cranes can be divided into
a) b) c) F1-working load; F2-cable tension T-lateral load N1, N2 in plane axial load; M out of plane bending
Fig. 2. Loading diagrams a) in the luffing plane; b) in the turning plane; and c) of K-type welded joints
Strojniški vestnik - Journal of Mechanical Engineering 60(2014)2, 135-144
137Fatigue Life Analysis of Crane K-Type Welded Joints Based on Non-Linear Cumulative Damage Theory
10 classes, defined as U0 to U9, which represent the frequency of the use of the crane [13]. The lattice boom crane utilization level is generally U4 to U6. U4 represents the total number of working cycles 1.25×10⁵<N≤2.5×10⁵. U6 represents the total number of working cycles 2.5×10⁵<N≤1.0×10⁶. These levels indicate that the crane’s total working cycles is in the range of 1.25×10⁵~1×10⁶. When the number of crane working cycles exceeds the range, the crane may be in the state of fatigue failure, which is extremely dangerous. Regarding fatigue research, we believe that a low-cycle fatigue failure of cycles is N<104~105 cycles, which the strain parameter often chosen as the design parameter. The high-cycle fatigue failure of cycles is N>104~105, which indicates the stress parameter is often chosen as the design parameter [1]. However, the utilization level of the lattice boom crane with a range of 1.25×10⁵ to 1×10⁶ cycles is in the overlap zone of low-cycle fatigue and high-cycle fatigue. Therefore, a more suitable parameter for cranes requires more considerations.
(3) The load history is random with a large amount of scatter. The load state level of all cranes can be divided into four classes, defined as Q1 to Q4, which indicate whether the load is heavy or light in the daily operation of the crane [13]. Q1 indicates that the crane rarely lifts the rated load but always lifts decidedly lighter loads. Q4 indicates the crane currently lifts the rated load. In transportation construction, the small and middle tonnage of lattice boom crane is usually used, e.g. 25 to 100 ton cranes. For this kind of crane, the load state is generally Q2 to Q3, i.e. occasionally lifting rated loads. Part of the structure may suffer plastic deformation because of the high stress concentration or poor weld quality under exceptional poor load conditions. As a result, cracks initiate in the boom weaknesses, followed by crack propagation. In large buildings and engineering lifting, the large tonnage of the lattice boom crane is usually used. For this kind of crane, the load state is generally Q3 to Q4, i.e. lifting rated load frequently. Furthermore, cracks may initiate in the high stress concentration. As the crane experiences a variety of working conditions, e.g. different boom lengths, different working ranges and different weights of the work according to various work demand, the loads will be changed randomly.
Therefore, lattice boom and welded joints have complex stress characteristics. K-type pipe joints of the booms are welded together with circular hollow pipes. The chords and braces are intersected. Damage will occur under fatigue load, especially in the seam weld, which is subjected to high stress and variable amplitude multi-axial loading. Some plastic deformation will occur in the weak areas because of the stress concentration and poor weld quality. The single stress parameter can no longer reflect the actual force conditions. Therefore, the strain parameter can be chosen as a reasonable design parameter for the fatigue life calculation [14] and [15].
1.2 Determination of the Critical Points of the Boom
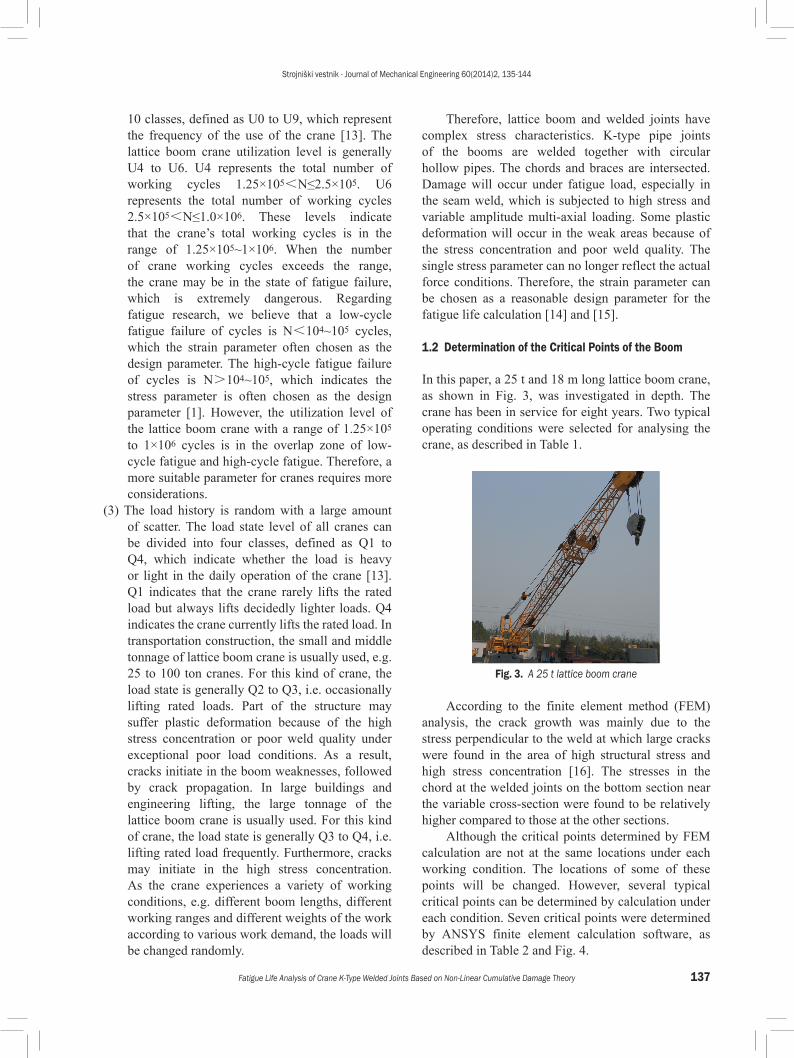
In this paper, a 25 t and 18 m long lattice boom crane, as shown in Fig. 3, was investigated in depth. The crane has been in service for eight years. Two typical operating conditions were selected for analysing the crane, as described in Table 1.
Fig. 3. A 25 t lattice boom crane
According to the finite element method (FEM) analysis, the crack growth was mainly due to the stress perpendicular to the weld at which large cracks were found in the area of high structural stress and high stress concentration [16]. The stresses in the chord at the welded joints on the bottom section near the variable cross-section were found to be relatively higher compared to those at the other sections.
Although the critical points determined by FEM calculation are not at the same locations under each working condition. The locations of some of these points will be changed. However, several typical critical points can be determined by calculation under each condition. Seven critical points were determined by ANSYS finite element calculation software, as described in Table 2 and Fig. 4.

Strojniški vestnik - Journal of Mechanical Engineering 60(2014)2, 135-144
138 Cai, F. – Wang, X. – Liu, J. – Zhao, F.
Table 1. Calculation conditions
Conditions Load Boom amplitude [m] Actions1 85% of the
rated load8 Lifting-turning-
unloading2 12
Table 2. The critical points determined by calculated stress amplitudes
Points index
LocationsCondition 1
[MPa]Condition 2
[MPa]
1Connection of the chord and the stiffener plate on the bottom section
129.23 149.12
2Connection of the chord and the side brace on the bottom section
150.11 170.23
3Connection of the chord and the space brace on the bottom section
125.34 138.45
4The chord hinge ear root on the bottom section
117.22 134.32
5The chord hinge ear root on the middle section
104.32 122.51
6Connection of the chord and the space brace on the middle section
113.56 134.34
7Connection of the chord and the space brace on the top section
136.34 150.45
To ensure whether the critical points that were determined by the software matched the real locations on the boom, the crane boom was inspected. Most of the calculated points were found to match the real locations.
Because the crane has been in service for eight years, several cracks were detected. The working cycle is approximately 2.8×10⁵, which is beyond the U4 level. There were different degrees of cracks, which were found in the welding area of the jib structure, as shown in Figs. 5 and 6. At point 2, the mean crack length is approximately 3.0 to 5.5 mm. At point 7, the mean crack length is approximately 3.5 to 6.0 mm. The max length of the crack on this kind of boom joints is typically approximately 10 to 15 mm.
As can be seen in the pictures, the stress concentration is high because of the poor weld quality. Therefore, the fact that cracks were found there means that the boom had been very seriously damaged. Most of the cracks were in a state of stable crack growth or that of rapid crack growth. This was sufficiently dangerous that the boom of the crane needed to be repaired.
After performing an in-depth examination, the majority of the cracks were found in the critical area or near the area accounting for approximately 80% of the total number of cracks. After determining the critical points, the fatigue analysis range was narrowed to a small number of priority hazardous areas. Point 2 on the K-type welded joint is considered as the focused analysis object in the following analysis.
Fig. 5. Cracks at critical point 2; crack length = 3.0 to 5.5 mm
Fig. 6. Cracks at critical point 7; crack length = 3.5 to 6.0 mm
a) b) c) Fig. 4. The critical points: a) on the bottom section; b) on the middle section; c) on the top section

Strojniški vestnik - Journal of Mechanical Engineering 60(2014)2, 135-144
139Fatigue Life Analysis of Crane K-Type Welded Joints Based on Non-Linear Cumulative Damage Theory
1.3 Simulated Stress Spectra Acquisition Method
A statistical method that is based on a large sample specimen is not suitable for a crane’s complex metal components, because the number of crane experimental samples is relatively small. As a result, a new method of obtaining the stress-time spectra based on simulation is proposed here. The details are described as follows.(1) When the finite element model was built in
Ansys, the beam188 element type was chosen for the structures of the pipes and the shell63 element type was chosen for the structures of the plates on the lattice boom [16]. After the static analysis, the most critical areas with high stress were determined. This next step was to narrow the study area that was shown in Fig. 4.
(2) To obtain the stress and stress distribution on the circumferential direction of the K-type welded joints on the chords and braces, the beam188 element type was modified to the shell63 element type. In the dynamic analysis, stress information cannot be extracted from the beam188 element type. To avoid the coupling effects between the two elements, the shell elements chords and braces area are built as large as possible to ensure that the coupling region was far away from the critical areas [17]. After modification, all the critical areas were built using shell63 element type.
(3) In Ansys, the model was transferred to the MSC.ADAMS software. Dynamic load was applied on the model in ADAMS [18]. Next, the simulated stress-time spectra could be obtained from the finite element model nodes after the dynamic simulation, as shown in Fig. 7. The axial forces and the bending moment of each chord and brace could be obtained from the dynamic simulation.
They will be used to load the chord in the fatigue test.
(4) Comparative analysis of the measured and simulated stress-time spectra is discussed here. A strain gage was used to measure the actual strain information at point 2, as shown in Fig. 8. Because the FEM model could only be simulated under determined conditions in the software, the measured conditions should be set the same as the simulated conditions. First, the measured points should be polished clearly to obtain the true strain. Second, the load of the crane should be the standard weight. Third, the actions of the crane working cycles should be the same between the measurement and the simulation. It means that, in each step of ‘lifting-turning-unloading’, the measured time and the simulated time should be the same. However, the time of different cycles can be different. From six working cycle simulations, a comparative analysis of the simulated and measured stress spectra of Condition 1 are described in Fig. 7 and Table 3. The error of the maximum stress amplitudes were less than 10%, with the majority being within the 5% error range of the allowable project application. The results indicated that the stress-time spectra obtained from dynamic software was accurate.
Fig. 8. Strain gauge at critical point 2
Fig. 7. Measured and simulated stress-time spectra of point 2; L-lifting; T-turning; U-unloading

Strojniški vestnik - Journal of Mechanical Engineering 60(2014)2, 135-144
140 Cai, F. – Wang, X. – Liu, J. – Zhao, F.
Table 3. Maximum stress amplitude comparison
Cycle number
Stress Amplitudes Error[%]measured [MPa] simulated [MPa]
1 -138.32 -140.13 1.312 -145.07 -138.22 -4.723 -142.07 -138.32 -2.644 -144.61 -139.34 -3.645 -150.11 -139.41 -7.136 -146.23 -139.42 -4.51
(5) The stress spectra shown in Fig. 7 were treated as a basic stress spectra block. The rain-flow counting method was used for statistical analysis. The counting cycles corresponding to the stress amplitude and the mean stress were obtained as shown in Figs. 9 and 10 [19]. The basic stress spectra block could be extended to a long time stress spectra as the classic stress spectra of the crane. The same method could be used to obtain the stress spectra of Condition 2 and of other critical points. Although this is not the real stress spectra, the stress spectra of specified conditions can be obtained based on the virtual simulations. Significant amounts of money and time can be saved via this method.
Fig. 9. Histograms of the rain-flow stress amplitudes cycles of Condition 1
Fig. 10. Histograms of the rain-flow mean stress cycles of Condition 1
Based on the above introductions, the new analysis method, including the ‘measured & simulated & compared & statistics’ combination strategy can be applied in the crane stress spectra acquisition. This method has been used in studies of bridge cranes and gantry cranes [20].
2 CALCULATION OF THE NON-LINEAR FATIGUE DAMAGE ACCUMULATION
The PM rule can be expressed by Eq. (1):
D nN
Di
ii= =∑ ∑ , (1)
where D is a constant that denotes the damage, and ni and Ni are the applied cycles and the total cycles to failure under ith constant amplitude loading level Si , respectively. Based on the assumptions made by the model, D should be 1; experimentally, it is found to range between 0.7 and 2.2. This variability is evidence of the failure of the PM rule to accurately predict fatigue lifespans. Because of its conceptual simplicity and the minimal amount of data necessary for its implementation, PM is a popular method for estimating the fatigue life.
A non-linear fatigue cumulative damage calculations approach from Huffman was used in this paper [21]. Only the cyclic stress-strain curve and the curve of the constant amplitude strain-life material properties are required in this method, which could be found easily from the research results of [1] and [22] to [24]. The model was first applied to calculate the K-type welded structure fatigue life with the intrinsically non-linear cumulative damage theory. The model is calculated as follows.
DT is the sum of the damage of all reversals and Di is the normalized damage caused by the ith reversal ranging from i = 1 to i = 2NT; failure occurs when DT = 1.
D DT ii
NT=
=∑1
2
. (2)
The damage accrued in each step is calculated using a relatively simple algorithm and a constant amplitude strain–life data. The Basquin-Manson-Coffin (BMC) equation is the most widely used constant amplitude strain-life approach, which is described in Eq. (3):
∆ ∆ ∆ε ε ε
σε
2 2 2
2 2
= + =
= +
e p
ffail
bf fail
c
EN N
''( ) ( ) , (3)

Strojniški vestnik - Journal of Mechanical Engineering 60(2014)2, 135-144
141Fatigue Life Analysis of Crane K-Type Welded Joints Based on Non-Linear Cumulative Damage Theory
where Δε / 2 is half of the strain range, Δεe is the elastic strain, Δεp is the plastic strain, and 2Nfail is the number of reversals until failure. In this sample experiment, the material of K-type welded joints is Q345B, the elastic modulus E = 200741 MPa, the fatigue strength coefficient σf' = 947.1 MPa, the fatigue strength exponent b = –0.0943, the fatigue ductility coefficient εf' = 0.4644, the fatigue ductility exponent c = –0.5395.
A good description of the crack growth per reversal, for a constant amplitude strain, is given by the hyperbolic sine function. For a crack size a, the rate of crack tip advance, after 2Nk reversals, can be written as Eq. (4):
dadN
NN
k
fail
∝ sinh( ),22
ρ (4)
where 2Nfail is the total number of reversals to failure for the given strain amplitude, and ρ is a scaling factor, that is used to adjust the incremental damage. ρ = log(2Nfailγ), where 2Nfail was from the BMC equation and γ was taken as –c / 2εf'. In this way, da / DN has the correct functional relationship to the strain amplitude.
Eq. (4) was used for the damage calculation. The normalized damage due to the ith reversal is expressed as Eq. (5):
D
NN
NN
Ni
k
fail
k
failk
N
k
N
j
TT
=−
==
+
∑∑ sinh( ) sinh( )
sinh(
22
22
211
1
ρ ρ
22
2222
1
1
NNN
dN
NN
failj
N
k
failkN
N
j
fail
f
T
T
ρ
ρ
ρ
)
sinh( )
sinh(
=
+
∑
∫
≈
≈))
.dN j
N f
1∫ (5)
where NT is the number of reversals required to achieve the accumulated damage, and DT is the damage due to a constant amplitude strain range Δεi / 2. The number of reversals to failure at this constant strain range is 2Nfail when the total damage DT = 1.
DT is the sum of Di , which can be expressed as Eq. (6):
D
NNNN
NN
T
k
failk
N
j
failj
N
kT
f= ≈=
=
∑
∑
sinh( )
sinh( )
sinh(2222
221
1
ρ
ρ
ffailk
N
j
failj
N
dN
NN
dN
T
f
ρ
ρ
)
sinh( )
1
1
22
∫
∫, (6)
Eq. (6) can be solved to find:
22
2 2
1NN
D
N N
Tfail
T
fail fai
= × −
− +
−
ρρ
ρ ρ
cosh ( (cosh( )
(cosh( )) cosh(ll
)),
(7)
From Eqs. (1) to (7), the strain life calculation process based on non-linear cumulative damage is shown in Fig. 11.
Initial total damage
Cycle damage calculationEq.(5)
Total damage calculation
TD
iD
1TD >
Number of reversals until failure calculation f a i l
N
Total cycle calculation
T
N Eq.(7)
T T iD D D= +∑
Eq.(3)
Failture cylces calculation
Eq.(2)
i
Y
N
Fig. 11. Non-linear cumulative damage based on the strain life calculation process
3 FATIGUE LIFE CALCULATIONS
3.1 The Preparation of the Fatigue Test
A specially designed test rig for K-type welded joints was applied, on which axial force and bending moment can be loaded. The rig is shown in Fig. 12. The specimen outline is shown in Fig. 13. The dimension was the same size as the K-type welded joint area, where the critical Point 2 located.
There are two kinds of test. They are described as Condition 1 and Condition 2 under simulated stress spectra. The total number of specimens is ten. The number of specimens for each fatigue test is five. The axial forces are applied from the simulation by ADAMS. When all the tests were finished, the mean value of the specimens’ fatigue life was used for comparison.

Strojniški vestnik - Journal of Mechanical Engineering 60(2014)2, 135-144
142 Cai, F. – Wang, X. – Liu, J. – Zhao, F.
Fig. 12. Test rig for K-type welded joints
Fig. 13. Outline of the K-type connector specimen
3.2 The Purposes of the Fatigue Test
There are three purposes for the fatigue test:1. Influence analysis on the calculated fatigue life
based on the measured and simulated stress-time spectra;
2. Calculated fatigue life error analysis based on the Huffman non-linear cumulative damage theory and the linear PM rule compared to the test data;
3. Influence analysis on calculated fatigue life of different initial damage.The model assumed that failure occurs when a
single critical crack propagates across the width of the chord. The damage calculation was performed with the Huffman non-linear damage model and the PM damage model.
3.3 Test Results Analysis
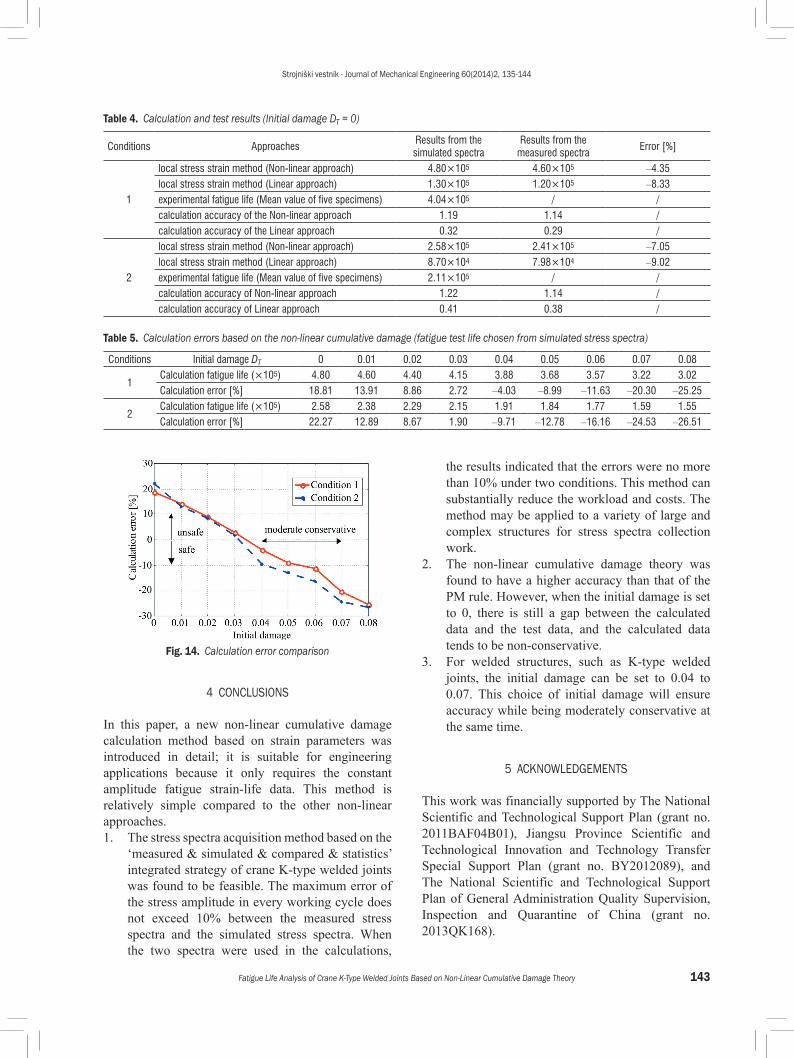
In Table 4, all of the calculated cycles and the test cycles are shown and compared as 0 when the initial damage was considered. It can be inferred that:
1. The measured stress spectra can be replaced by the simulated stress spectra. The errors from the two calculated fatigue cycles do not exceed 10%, which satisfies the engineering requirements.
2. The calculation accuracy of the non-linear damage model is higher than that of the linear PM model. The non-linear calculation precision is approximately 1.14 to 1.19 under Conditions 1 and 2. The linear PM calculation precision is approximately 0.29 to 0.32 under Conditions 1 and 2. The linear calculation model is too conservative.
3. The calculated fatigue life based on the simulated spectra is longer than that of the measured spectra. The maximum error is less than 10%. In the measured stress spectra, there are many stress mutations and stress fluctuations, leading to structural stress mutation prone microstructure grain boundary sliding and cracks, so the fatigue life is shorter. The simulated stress spectra is relatively stable, indicating that less stress mutation causes less damage to the structure; this may explain the longer life.
4. Although the accuracy of the non-linear damage model is higher than that of the linear PM damage model, there is still a gap between the calculation life and the test life. In addition, the calculation result tends to be slightly un-conservative. The error may come from the initial damage.
3.4 The Design Recommendations Based on the Initial Damage Analysis
Using the initial damage in the calculations in the range from 0.01 to 0.08, the results are described in Table 5 and Fig. 14. The test fatigue life data from the simulated spectra were used as the comparison reference. It can be inferred that when the initial damage is set to 0.03 to 0.04, the calculation errors are less than 10% for the two conditions based on the non-linear model. When the initial damage is set to a value of over 0.07, the calculation error will be larger than 20%.
For the engineering application, there should be a certain amount of surplus for the design requirements. The proposed initial damage of K-type welded joints may be set to 0.04 to 0.07; this choice will ensure accuracy while being moderately conservative at the same time.
Strojniški vestnik - Journal of Mechanical Engineering 60(2014)2, 135-144
143Fatigue Life Analysis of Crane K-Type Welded Joints Based on Non-Linear Cumulative Damage Theory
Fig. 14. Calculation error comparison
4 CONCLUSIONS
In this paper, a new non-linear cumulative damage calculation method based on strain parameters was introduced in detail; it is suitable for engineering applications because it only requires the constant amplitude fatigue strain-life data. This method is relatively simple compared to the other non-linear approaches.1. The stress spectra acquisition method based on the
‘measured & simulated & compared & statistics’ integrated strategy of crane K-type welded joints was found to be feasible. The maximum error of the stress amplitude in every working cycle does not exceed 10% between the measured stress spectra and the simulated stress spectra. When the two spectra were used in the calculations,
the results indicated that the errors were no more than 10% under two conditions. This method can substantially reduce the workload and costs. The method may be applied to a variety of large and complex structures for stress spectra collection work.
2. The non-linear cumulative damage theory was found to have a higher accuracy than that of the PM rule. However, when the initial damage is set to 0, there is still a gap between the calculated data and the test data, and the calculated data tends to be non-conservative.
3. For welded structures, such as K-type welded joints, the initial damage can be set to 0.04 to 0.07. This choice of initial damage will ensure accuracy while being moderately conservative at the same time.
5 ACKNOWLEDGEMENTS
This work was financially supported by The National Scientific and Technological Support Plan (grant no. 2011BAF04B01), Jiangsu Province Scientific and Technological Innovation and Technology Transfer Special Support Plan (grant no. BY2012089), and The National Scientific and Technological Support Plan of General Administration Quality Supervision, Inspection and Quarantine of China (grant no. 2013QK168).
Table 4. Calculation and test results (Initial damage DT = 0)
Conditions ApproachesResults from the simulated spectra
Results from the measured spectra
Error [%]
1
local stress strain method (Non-linear approach) 4.80×10⁵ 4.60×10⁵ –4.35local stress strain method (Linear approach) 1.30×10⁵ 1.20×10⁵ –8.33experimental fatigue life (Mean value of five specimens) 4.04×10⁵ / /calculation accuracy of the Non-linear approach 1.19 1.14 /calculation accuracy of the Linear approach 0.32 0.29 /
2
local stress strain method (Non-linear approach) 2.58×10⁵ 2.41×10⁵ –7.05local stress strain method (Linear approach) 8.70×10⁴ 7.98×10⁴ –9.02experimental fatigue life (Mean value of five specimens) 2.11×10⁵ / /calculation accuracy of Non-linear approach 1.22 1.14 /calculation accuracy of Linear approach 0.41 0.38 /
Table 5. Calculation errors based on the non-linear cumulative damage (fatigue test life chosen from simulated stress spectra)
Conditions Initial damage DT 0 0.01 0.02 0.03 0.04 0.05 0.06 0.07 0.08
1Calculation fatigue life (×105) 4.80 4.60 4.40 4.15 3.88 3.68 3.57 3.22 3.02Calculation error [%] 18.81 13.91 8.86 2.72 –4.03 –8.99 –11.63 –20.30 –25.25
2Calculation fatigue life (×105) 2.58 2.38 2.29 2.15 1.91 1.84 1.77 1.59 1.55Calculation error [%] 22.27 12.89 8.67 1.90 –9.71 –12.78 –16.16 –24.53 –26.51

Strojniški vestnik - Journal of Mechanical Engineering 60(2014)2, 135-144
144 Cai, F. – Wang, X. – Liu, J. – Zhao, F.
6 REFERENCES
[1] Zhao, S.B., Wang, Z.B. (1997). Fatigue Design: Methods and Data. China Machine Press, Beijing.
[2] Xu, G.N., Yang, R.G. (2005). Influence of control ambit parameter cap for reliability analyses of large type steel structure system. Chinese Journal of Mechanical Engineering, vol. 41, no. 12, p. 130-134, DOI:10.3901/JME.2005.12.130.
[3] Sonsino, C.M. (2012). Comparison of different local design concepts for the structural durability assessment of welded offshore K-nodes. International Journal of Fatigue, vol. 34, no. 1, p. 27-34, DOI:10.1016/j.ijfatigue.2010.09.005.
[4] Sonsino, C.M., Fricke, W., Bruyne, F., Hoppe, A., Ahmadi, A., Zhang, G. (2012). Notch stress concepts for the fatigue assessment of welded joints–Background and applications. International Journal of Fatigue. vol. 34, no. 1, p. 2-16, DOI:10.1016/j.ijfatigue.2010.04.011.
[5] Fan, X.N., Xu, G.N., Wang, A.H. (2011). Evaluation method of remaining fatigue life for crane based on the acquisition of the equivalent load spectrum by the artificial neural network. Chinese Journal of Mechanical Engineering, vol. 47, no. 20, p. 69-74, DOI:10.3901/JME.2011.20.069.
[6] Xu, G.N., Fan, X.N., Lu, F.Y., Yang, H. (2011). Monte Carlo simulation of fatigue reliabilities and initial cracks for welded box girders of crane. Chinese Journal of Mechanical Engineering, vol. 47, no. 20, p. 41-44, DOI:10.3901/JME.2011.20.041.
[7] Kopnov, V.A. (1999). Fatigue life prediction of the metalwork of a travelling gantry crane. Engineering Failure Analysis, vol. 6, no. 3, p. 131-141, DOI:10.1016/S1350-6307(98)00041-7.
[8] Fatemi, A., Yang, L. (1998). Cumulative fatigue damage and life prediction theories: a survey of the state of the art for homogeneous materials. International Journal of Fatigue, vol. 20, no. 1, p. 9-34, DOI:10.1016/S0142-1123(97)00081-9.
[9] Zhang, X.L., Chen, X.F., Li, B., He., Z.J. (2011). Review of life prediction for mechanical major equipments. Chinese Journal of Mechanical Engineering, vol. 47, no. 11, p. 100-116, DOI:10.3901/JME.2011.11.100.
[10] Shang De-Guang, Yao Wei-Xing. (1999). A nonlinear damage cumulative model for uniaxial fatigue. International Journal of Fatigue, vol. 21, no. 2, p. 187-194, DOI:10.1016/S0142-1123(98)00069-3.
[11] Zhi, Y.H., Danièle, W., Claude, B., Louis, C. (2011). Cumulative fatigue damage in low cycle fatigue and gigacycle fatigue for low carbon–manganese steel.
International Journal of Fatigue, vol. 33, no. 2, p. 115-121, DOI:10.1016/j.ijfatigue.2010.07.008.
[12] Chen H., Shang, D.G., Liu, E.T. (2011). Multiaxial fatigue life prediction method based on path-dependent cycle counting under tension/torsion random loading. Fatigue & Fracture of Engineering Materials & Structures, vol. 34, no. 10, p. 782-791, DOI:10.1111/j.1460-2695.2011.01572.x.
[13] Beijing Machinery Institute of Crane. (2008). Design Rules for Cranes. China standard Press, Beijing.
[14] Zhao, Y.X. (2001). On the strain-based fatigue reliability analysis. Chinese Journal of Mechanical Engineering, vol. 37, no. 11, p. 1-6, DOI:10.3901/JME.2001.11.001.
[15] Zhao, Y.X. Yang, B., Zhang, W.H. (2005). New advances of the strain-based fatigue reliability theory and methods. Journal of Mechanical Strength, vol. 27, no. 5, p. 604-611.
[16] Moaveni S. (2008). Finite element analysis: theory and application with ANSYS. Pearson Prentice Hall, Upper Saddle River.
[17] Gao, S.D., Xie, G.L., Cao, X.Y., Bai, Z.Y., Li, D. (2011). Dynamical analysis on compactor based on rigid flexible-coupling model. Chinese Journal of Construction Machinery, vol. 9, no. 3, p. 284-289.
[18] Msc Documentation of Adams software. (2010). MSC Corporation.
[19] Niesłony, Adam. (2009). Determination of fragments of multiaxial service loading strongly influencing the fatigue of machine components. Mechanical Systems and Signal Processing, vol. 23, no. 8, p. 2712-2721, DOI:10.1016/j.ymssp.2009.05.010.
[20] Gao, Y.S., Wang, A.H., Xu. G.N. (2012). Random Stress Spectrum Acquisition and Fatigue Residual Life Estimate for Overhead Travelling Crane. Chinese Journal of Mechanical Engineering, vol. 48, no. 18, p. 192-198, DOI:10.3901/JME.2012.18.192.
[21] Huffman, P.J., Beckman, S.P. (2012). A non-linear damage accumulation fatigue model for predicting strain life at variable amplitude loadings based on constant amplitude fatigue data. International Journal of Fatigue, vol. 36, no. 1, p. 165-169, DOI:10.1016/j.ijfatigue.2012.10.016.
[22] Hobbacher, A. (2003). Fatigue design of welded joints and components: Recommendations of IIW Joint Working Group XIII-XV. Woodhead Publishing, Cambridge.
[23] DNV (2008). Fatigue Design of Offshore Steel Structures, DNV, Oslo.
[24] Radaj, D., Sonsino, C.M. (1998). Fatigue Assessment of Welded Joints by Local Approaches. Woodhead publishing, Cambridge.


![IIW-Recommendations for Fatigue Design of Welded Joints and Components[1]](https://img.dokumen.tips/doc/110x75/5571ff7949795991699d5428/iiw-recommendations-for-fatigue-design-of-welded-joints-and-components1.jpg)