Embed Size (px)
DESCRIPTION
FATIGUE FAILURE AND TESTING METHODS
Citation preview

FATIGUE FAILURE AND TESTING METHODS
Bachelor’s thesis
MECHANICAL ENGINEERING AND PRODUCTION TECHNOLOGY
Riihimäki, 15/05/2013
ABASS ADEYINKA AZEEZ

Fatigue Failure and Testing Methods
1
ABSTRACT
Riihimäki
Mechanical Engineering and Production Technology
Mechatronics
Author ABASS ADEYINKA AZEEZ Year 2013
Bachelor’s thesis FATIGUE FAILURE AND TESTING METHOD
ABSTRACT
The aim of this thesis work is to discuss the principle of fatigue failure, re-
search the state of the art fatigue testing methods and finally design a veri-
fication fatigue test set-up to evaluate the performance of the newly devel-
oped dynamic testing machine in the mechatronics laboratory of HAMK
University of applied sciences.
A comprehensive study of the underlying principle, stages and numerous
factors that makes fatigue such a complex phenomenon was carried out.
This was closely followed by research work on the standard fatigue testing
methods and statistical analysis of fatigue test results.
Based on the knowledge gained from the research work stated above, a
four-point fully reversed bending set-up design was developed to put into
test the functionality of the dynamic testing machine once it is ready to run
and also a planned fatigue test suitable for laboratory exercise in a material
science or engineering design class was developed.
Keywords Fatigue Failure, Fatigue Testing Methods and 4-point bending set-up.
Pages 32 p. + appendix

Fatigue Failure and Testing Methods
2
BACHALOR THESIS
Table of Contents
1 INTRODUCTION ....................................................................................................... 3
2 FATIGUE AS A PHENOMENON IN THE MATERIAL ......................................... 4
2.1 General ................................................................................................................ 4
2.2 Different phases of fatigue life ............................................................................ 5 2.2.1 Crack initiation (Ni) ................................................................................. 6 2.2.2 Crack growth Np ...................................................................................... 6 2.2.3 Rapid fracture .......................................................................................... 6
2.3 Fatigue Properties of Materials ........................................................................... 6 2.4 Design for fatigue failure .................................................................................... 8
2.4.1 Corrected fatigue strength ....................................................................... 8
2.4.2 Selection of materials for fatigue resistance ............................................ 9
3 FATIGUE TESTING METHODS ............................................................................ 11
3.1 Classification based on the sequence of stress amplitudes ............................... 11 3.1.1 Constant-amplitude test ......................................................................... 11 3.1.2 Variable-amplitude tests ........................................................................ 12
3.2 Classification based on the nature of the test-piece .......................................... 13 3.2.1 Specimens .............................................................................................. 13
3.2.2 Component ............................................................................................ 14 3.3 General Classification of Fatigue Testing ......................................................... 15
3.3.1 Material type test ................................................................................... 15 3.3.2 Structural type test ................................................................................. 16
3.3.3 Actual service type test .......................................................................... 16
4 FATIGUE TESTING MACHINE ............................................................................. 17
4.1 Classification of fatigue testing machine .......................................................... 17 4.2 General purpose testing machine ...................................................................... 17
4.2.1 Classification based on type of stressing method .................................. 17 4.3 Components of a fatigue testing machine ......................................................... 20 4.4 The testing machine of HAMK University, mechatronic laboratory ................ 21
4.5 Design of the testing support structure .............................................................. 22
5 COLLECTION, ANALYSIS AND PRESENTATION OF FATIGUE DATA........ 24
5.1 Analysis and determination of finite life ........................................................... 25 5.2 Staircase method ............................................................................................... 25
6 A PLANNED FATIGUE TEST ................................................................................ 27
6.1 General .............................................................................................................. 27 6.2 Fatigue test exercise .......................................................................................... 28
7 CONCLUSION ......................................................................................................... 29

Fatigue Failure and Testing Methods
3
1 INTRODUCTION
A perusal of the broken parts in almost any scrap will show that a high number of fail-
ures occur at stresses below the yield strength of the part`s materials. This complex
phenomenon is known as “Fatigue”. Fatigue is responsible for up to 90% of the in-
service part failure which occur in industry.
In the 19th
century, it was considered mysterious that a fatigue fracture did not show
visible plastic deformation, this lead to an erroneous believe that fatigue was merely an
engineering problem. Well, they were not so wrong since the power of microscopic
equipment of that time was quite limited, also during this century few fatigue tests were
carried out by notable researchers; most popular was the work of August Wöhler, who
later come up with the idea of stress-lifetime curve (S-N Curve).
A major breakthrough in the understanding of the process of fatigue failure happened in
the 20th
century. Thanks to more powerful tools such as computer, powerful microscop-
ic instrument, advance numerical analysis methods and much more research work (as
much as 100,000 references was cited by John Mann in one of his works), fatigue began
to be viewed not as an engineering problem but as both material and design phenome-
non.
Despite the large amount of research carried out on fatigue failure, its true nature still
remains unknown and damage, cracks or even complete failure due to cycling loads are
constantly been reported. If the problem still exists after 100 years of research in the
previous century, there is something to be explained.
The idea behind this thesis work is not to provide answers to the unanswered ques-
tions, but to tackle the problem from a different perspective. This includes explaining
the complex nature of fatigue failure, introduce basic idea of engineering design against
fatigue failure, explain the known techniques of fatigue testing, set-up a verification test
for the servo-hydraulic dynamic testing machine (still under construction) in the mecha-
tronics laboratory of HAMK University of Applied Sciences and also plan a laboratory
fatigue test exercise suitable for a machine design or material science courseware.

Fatigue Failure and Testing Methods
4
2 FATIGUE AS A PHENOMENON IN THE MATERIAL
2.1 General
Fatigue is the condition whereby a material cracks or fails because of repeated (cyclic)
stresses applied below the ultimate strength of the material. Fatigue failure often occurs
quite suddenly with catastrophic result.
When a structure is loaded, a crack will be nucleated (crack nucleation) on a microscop-
ically small scale, this crack then grows (crack growth), then finally complete failure of
the specimen. The whole process constitutes the fatigue life of the component in ques-
tion. According to Jaap Schijve, Reasonable fatigue prediction for design or analysis
can only be done if fatigue is viewed not only as an engineering problem but also a ma-
terial phenomenon that is a process involving an invisible micro scale crack initiation
till a macro scale fatigue failure.
To this ends, the underlying stages of fatigue life of a component will be discussed as
well as important fatigue properties of common materials and also the basic principle of
design against fatigue failure.
Figure 1 Survey of the various aspects of fatigue of structures [3].

Fatigue Failure and Testing Methods
5
2.2 Different phases of fatigue life
Microscopic investigation in the 20th
century has revealed that the nucleation of fatigue
cracks occurs at a very early stage of fatigue life. The crack starts as a slip band within a
grain. The cyclic slip occurs as a result of cyclic shear stress, this slip leads to formation
of slip steps, in the present of oxygen, the freshly exposed surface of the material in slip
steps get oxidized, which prevents slip reversal. The slip reversal in this case occurs in
some adjacent slip plane, thereby leading to formation of extrusions and intrusions on
the surface of the material as shown in the figure below.
Figure 2 Formation of intrusion and extrusion marks on the material surface
The fatigue life is generally divided into three stages/periods
Figure 3 Different phases of the fatigue life
The fatigue life (Nf) of a component is defined by the total number of stress cycles re-
quired to cause failure. Fatigue life can be separated into three stages where:
Nf = Ni +Np (1)
Fatigue Failure and Testing Methods
6
2.2.1 Crack initiation (Ni)
This is the number of cycles required to initiate a crack. It generally results from dislo-
cation pile-ups and imperfections such as surface roughness, voids, scratch etc. hence;
in this period fatigue is a material surface phenomenon.
The stress concentration factor, Kt is another factor to be considered in crack initiation
prediction.
2.2.2 Crack growth Np
This is the number of cycles required to grow the crack in a stable manner to a critical
size, generally controlled by stress level. Since most common material contains flaws,
the prediction of crack growth is the most studied aspect of fatigue. Crack growth re-
sistance, when the crack penetrates into the material, depends on the material as a bulk
property. It is no longer a surface phenomenon. The stress intensity factor is an im-
portant factor for fatigue growth prediction.
2.2.3 Rapid fracture
Very rapid critical crack growth occurs when the crack length reaches a critical value.
Since rapid fracture occurs quickly, there is no rapid fracture term in the fatigue life
expression.
The fracture toughness KIC of the material is the primary factor for rapid fracture predic-
tion or design against fracture.
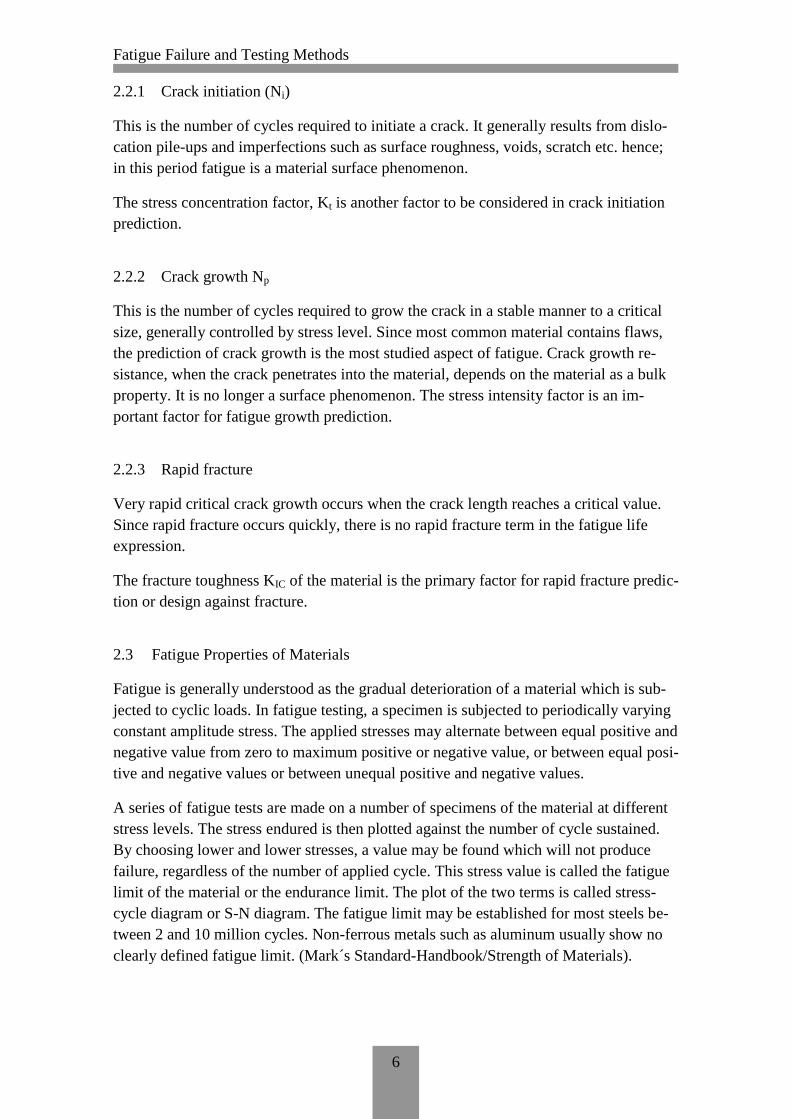
2.3 Fatigue Properties of Materials
Fatigue is generally understood as the gradual deterioration of a material which is sub-
jected to cyclic loads. In fatigue testing, a specimen is subjected to periodically varying
constant amplitude stress. The applied stresses may alternate between equal positive and
negative value from zero to maximum positive or negative value, or between equal posi-
tive and negative values or between unequal positive and negative values.
A series of fatigue tests are made on a number of specimens of the material at different
stress levels. The stress endured is then plotted against the number of cycle sustained.
By choosing lower and lower stresses, a value may be found which will not produce
failure, regardless of the number of applied cycle. This stress value is called the fatigue
limit of the material or the endurance limit. The plot of the two terms is called stress-
cycle diagram or S-N diagram. The fatigue limit may be established for most steels be-
tween 2 and 10 million cycles. Non-ferrous metals such as aluminum usually show no
clearly defined fatigue limit. (Mark´s Standard-Handbook/Strength of Materials).
Fatigue Failure and Testing Methods
7
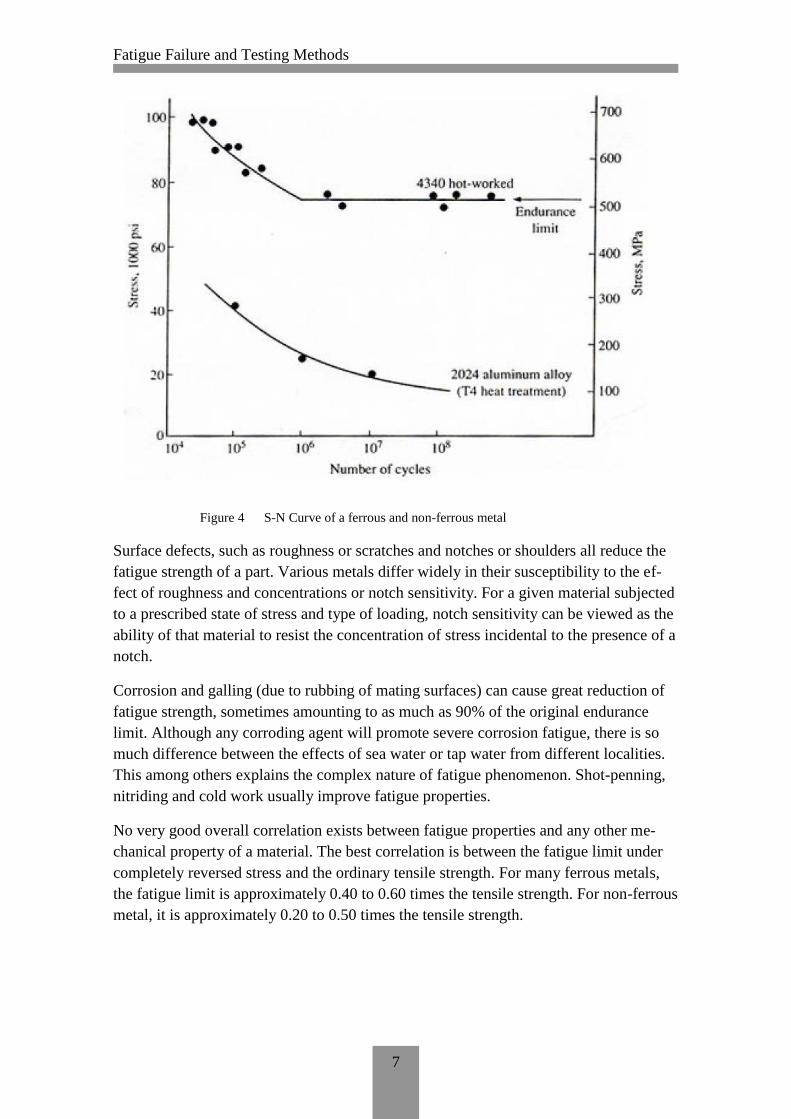
Figure 4 S-N Curve of a ferrous and non-ferrous metal
Surface defects, such as roughness or scratches and notches or shoulders all reduce the
fatigue strength of a part. Various metals differ widely in their susceptibility to the ef-
fect of roughness and concentrations or notch sensitivity. For a given material subjected
to a prescribed state of stress and type of loading, notch sensitivity can be viewed as the
ability of that material to resist the concentration of stress incidental to the presence of a
notch.
Corrosion and galling (due to rubbing of mating surfaces) can cause great reduction of
fatigue strength, sometimes amounting to as much as 90% of the original endurance
limit. Although any corroding agent will promote severe corrosion fatigue, there is so
much difference between the effects of sea water or tap water from different localities.
This among others explains the complex nature of fatigue phenomenon. Shot-penning,
nitriding and cold work usually improve fatigue properties.
No very good overall correlation exists between fatigue properties and any other me-
chanical property of a material. The best correlation is between the fatigue limit under
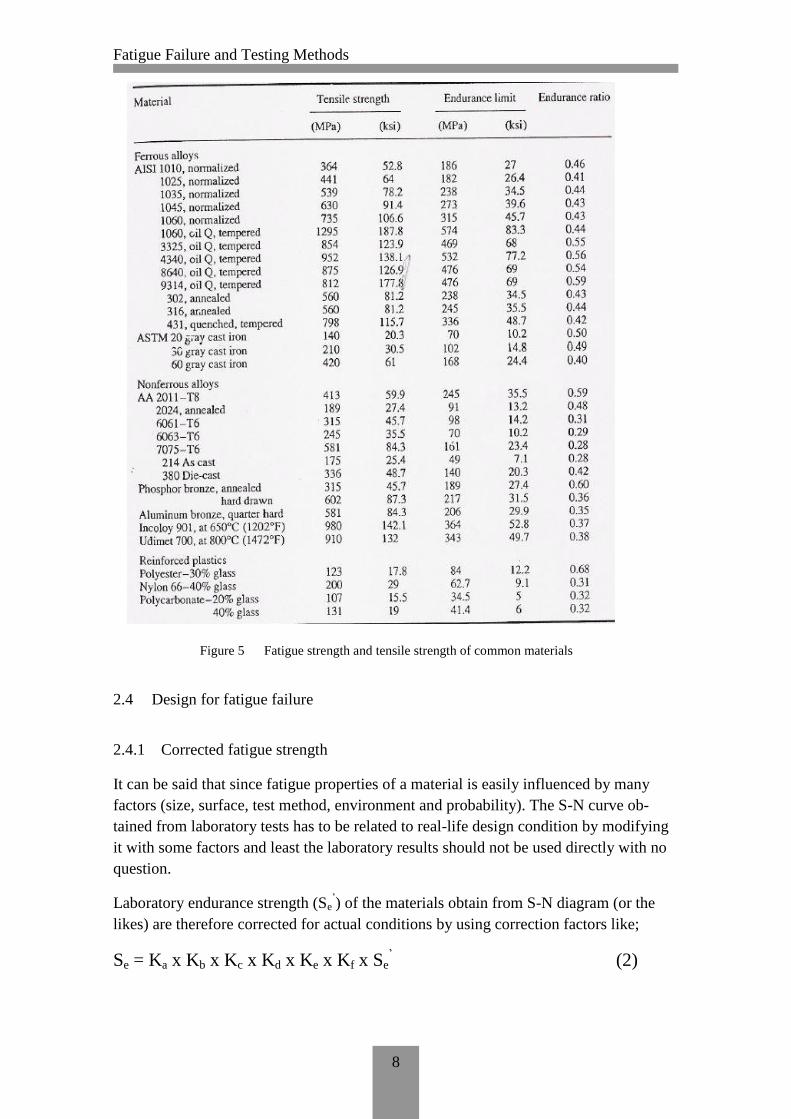
completely reversed stress and the ordinary tensile strength. For many ferrous metals,
the fatigue limit is approximately 0.40 to 0.60 times the tensile strength. For non-ferrous
metal, it is approximately 0.20 to 0.50 times the tensile strength.
Fatigue Failure and Testing Methods
8
Figure 5 Fatigue strength and tensile strength of common materials
2.4 Design for fatigue failure
2.4.1 Corrected fatigue strength
It can be said that since fatigue properties of a material is easily influenced by many
factors (size, surface, test method, environment and probability). The S-N curve ob-
tained from laboratory tests has to be related to real-life design condition by modifying
it with some factors and least the laboratory results should not be used directly with no
question.
Laboratory endurance strength (Se’) of the materials obtain from S-N diagram (or the
likes) are therefore corrected for actual conditions by using correction factors like;
Se = Ka x Kb x Kc x Kd x Ke x Kf x Se’ (2)

Fatigue Failure and Testing Methods
9
Where,
Ka = Surface Correction factor
Kb = Size Correction factor
Kc =Reliability Correction factor
Kd = Temperature Correction factor
Ke = Stress concentration Correction factor
Kf = Miscellaneous Correction factor
Se’ = Endurance Strength of material specimen under laboratory condition
Se = Endurance Strength of material specimen under actual running condition
2.4.2 Selection of materials for fatigue resistance
In many applications, the behavior of a component in service is influence by several
other factors besides the properties of the material used in its manufacture. This is par-
ticularly true for the cases where the component or structure is subjected to fatigue load-
ing, the fatigue resistance can be greatly influenced by the service environment, surface
condition of the part, method of fabrication and design details. In some cases, the role of
the material in achieving satisfactory fatigue life is secondary to the above parameters,
as long as the material is free from major flaws. Commonly used material type for de-
sign against fatigue is elaborated below with their basic characteristics.
Steel and cast iron
1. Steels are widely used as structural materials for fatigue application as they offer high
fatigue strength and good process-ability at relatively low cost.
2. The optimum steel structure for fatigue is tempered martensite, since it provides max-
imum homogeneity.
3. Steel with high hardenability gives high strength with relatively mild quenching and
hence, low residual stresses, which is desired in fatigue applications.
4. Normalized structure, with their finer structure give better fatigue resistance than
coarse pearlite structure obtained by annealing.
Nonferrous alloys
1. Unlike ferrous alloys, the nonferrous alloys, with the exception of titanium, do not
normally have clear endurance limit.

Fatigue Failure and Testing Methods
10
2. Aluminum alloys usually combine corrosion resistance, light weight, and reasonable
fatigue resistance
3. Fine grained inclusion-free alloys are most suited for fatigue applications.
Plastics
1. The viscoelasticity of plastics makes their fatigue behavior more complex than that of
metals.
2. Fatigue behavior of plastics is affected by the type of loading, small changes in tem-
perature and environment and method of fabrication
3. Because of their low thermal conductivity, hysteretic heating can build up in plastics
causing them to fail in thermal fatigue or to function at reduces stiffness level.
4. The amount of heat generated increases with increasing stress and test frequency.
Composite materials
1. The failure modes of reinforced materials in fatigue are complex and can be affected
by the fabrication process when difference in shrinkage between fibers and matrix in-
duce internal stresses.
2. However from practical experiences, some fiber reinforced plastics are known to per-
form better in fatigue than some metal
3. The advantage of fiber-reinforced plastics is even more apparent when compared to a
per weight basis.
4. As with static strength, fiber orientation affects the fatigue strength of fiber reinforced
composite.
5. In unidirectional composites, the fatigue strength is significantly lower in directions
other than the fiber orientation.
6. Reinforcing with continuous unidirectional fibers is more effective than reinforcing
with short random fibers.

Fatigue Failure and Testing Methods
11
3 FATIGUE TESTING METHODS
The objective of a fatigue test is generally speaking to determine the fatigue life and/or
the danger point, i.e. the location of failure of a test-piece subjected to a prescribed se-
quence of stress amplitude.
By simplifying and idealizing the test conditions, it would be possible to vary one or a
few of the factors, which influence the fatigue life and to state their effects.
Even if these conditions are fulfilled, there will always remain a number of unknown
and uncontrollable factors which produce a large scatter in fatigue life even of test-piece
which are considered to be identical.
There are 2 basics for a classification of the different methods of fatigue testing.
1. The sequence of stress amplitude.
2. The nature of the test-piece.
3.1 Classification based on the sequence of stress amplitudes
3.1.1 Constant-amplitude test
This is the simplest sequence of amplitude obtained by applying reversals of stress of
constant-amplitude to the test-piece until failure occurs. Different specimens of the test
series may be subjected to different stress amplitude but for each individual item, the
amplitude will never be varied.
Figure 6 Schematic Illustrating Cyclic Loading Parameters [Fuch & Stephens, 1980].

Fatigue Failure and Testing Methods
12
The following parameters are utilized to identify fluctuating stress cycles:
Mean Stress,Sm
max min
2m
S SS
(3)
Stress Range, Sr
max minrS S S (4)
Stress Amplitude, Sa
max min
2a
S SS
(5)
Stress Ratio, R
min
max
SR
S (6)
Depending upon the choice of stress levels, constant-amplitude tests may be classified
into three types
Routine test
In routine test, the applied stresses are chosen in such a way that all specimens are ex-
pected to fail after a moderate number of cycles say 104 to 10
7, a few run-outs, although
not intended may be allowed.
Short-life test
The stress levels are suited above the yield stress and some of the specimens are ex-
pected to fail statically at the application of the load.
Long-life test
In this type of testing method, the stress levels are suited below or just above the fa-
tigue limit and a fraction of the specimen does not fail after a pre-assigned number of
cycles about 106 to 10
7 cycles.
3.1.2 Variable-amplitude tests
More complicated sequences of amplitude are required in order to simulate the stresses
to which a specimen is subjected in actual service. A realistic simulation is very compli-
cated.
In order to discover laws in relation to the accumulation of fatigue damage in a spec-
imen subjected to stress reversals of different amplitudes, the sequence of stress ampli-

Fatigue Failure and Testing Methods
13
tudes may be simplified. Independent of the pattern used, such tests is known as varia-
ble-amplitude tests.
Figure 7 Variable amplitude fatigue stress loading
Variable-amplitude tests can be further divided into:
Cumulative damage test
These are tests where the objective is to investigate cumulative damage theory, in which
case the sequences are frequently simplified.
Service simulating test
These are tests which uses a more elaborate pattern (close to real service loading) for
simulating purpose.
3.2 Classification based on the nature of the test-piece
It will suffice to divide the test-piece into two categories
3.2.1 Specimens
The term “specimen” is generally used in the sense of a test-piece of simple shape, fre-
quently standardized, of small size and prepared carefully and with good surface finish.
The purpose of the simplification is not to make it less expensive but more to reduce the
variability of the product and to keep different influential factors under control.
Test-pieces of this type are generally intended for testing the material and for stating its
fatigue properties; they are also used extensively for research purposes.

Fatigue Failure and Testing Methods
14
Figure 8 Fatigue Test Specimens: (a) Rotating Bending, (b) Cantilever Flat Sheet (c)
buttoned axial dog-bone, (d) threaded axial dog-bone, (e) torsion, (f) com-
bined stress, (g) axial Cracked sheet, (h) part-through crack,(i) Compact ten-
sion and (j) three point bend specimen [Fuch & Stephens, 1980].
Even if the simplified specimen may simulate many of the properties of actual machine
parts, there are two factors pertaining to the component which are not represented in the
specimen i.e. design and fabrication. For this reason, it is indispensable to carry out ac-
tual tests with components in exactly the same condition as used in actual service.
3.2.2 Component
It is used to signify any machine part, actual structure, machine and assembly including
elements simulating actual components.

Fatigue Failure and Testing Methods
15
Figure 9 3-point bending test of a circuit board [2]
Figure 10 Service testing of a whole car model
3.3 General Classification of Fatigue Testing
Based on the three categories above, fatigue testing maybe divided base on the objective
of the test, the three categories are:
3.3.1 Material type test
Test of the material type are useful for a comparison of the behavior of different materi-
als subjected to repeated stresses, of the effects of various manufacturing processes, of
the behavior of material in various environment, of various simple geometrical factors
such as different sizes and shapes, of notches and different surface finishes.
Fatigue Failure and Testing Methods
16
It could also be used for elaborating the effect of surface treatment such as case-
hardening, decarburization, nitriding, shot-peening and plating on the fatigue properties
of different materials.
3.3.2 Structural type test
This type of test may be useful for a comparison of components made from different
materials, of different design and of structure fabricated by different procedures. They
may also be used for revealing stress concentration and for developing better designs or
better fabrication procedures.
3.3.3 Actual service type test
They are tests usually used as reliability test or quality test, mainly for fault finding or
verifying a new component in the machine or structure.
Fatigue tests completely different in type from the above mentioned tests are those
which have as an objective a study of the initiation and propagation of fatigue cracks,
this requires complex knowledge of fracture mechanics and microscopic view of mate-
rial structure and it is beyond the scope of this thesis work.

Fatigue Failure and Testing Methods
17
4 FATIGUE TESTING MACHINE
A fatigue testing machine may be classified from different viewpoints such as purpose
of the test, type of stressing, means of producing the load, operation characteristics, type
of load etc.
The purpose of the investigation is the most important item for thee research and of
course, this is known when starting the investigation. Hence, it makes sense to base the
classification on the purpose of the test.
4.1 Classification of fatigue testing machine
Base on the purpose of the test, fatigue testing machine can be divided into the follow-
ing:
1. General purpose fatigue testing machine
2. Special purpose fatigue testing machine
3. Equipment for testing parts and assemblies
In this work, the general purpose class will be expanded further as this is the widely
used type, most especially in academic environment.
4.2 General purpose testing machine
The general purpose testing machine can be further divided into two broad categories.
They are the following:
4.2.1 Classification based on type of stressing method
Rotating bending testing machine
The type of S-N curve created by this machine is identified as a rotating-bending, stress-
controlled fatigue data curve. The rotating bending test machine is used to create an S-N
curve by turning the motor at a constant revolution per minutes, or frequency. To create
a failure on the specimen, a constant-stationary force is applied on the specimen, which
creates a constant bending moment. A stationary moment applied to a rotating specimen
causes the stress at any point on the outer surface of the specimen to go from zero to a
maximum tension stress, back to zero and finally to a compressive stress. Thus, the
stress state is one that is completely reversed in nature.

Fatigue Failure and Testing Methods
18
Figure 11 Rotating Bending Testing Machine [Callister, 1994].
Reciprocating bending test machine
The type of S-N curve produced is identified as a tension-compression, strain controlled
fatigue data curve. This machine type is capable of zero mean cyclic stresses by posi-
tioning the specimen clamping vice with respect to the mean displacement position of
the crank drive.
Figure 12 Reciprocating Bending Testing Machine [Collins, 1981].
Axial loading (push-pull) type fatigue tester
In this type the specimen is not exposed to bending but to pure axial (tensile or com-
pressive) loading. Specimen is held at two ends and loaded cyclically between two ex-
treme (maximum and minimum) values.

Fatigue Failure and Testing Methods
19
Figure 13 Direct-Force Fatigue Testing Machine [Collins, 1981].
The axial loading (push-pull) tester employing conversion attachments are also capable
of bending and torsion fatigue testing when necessary, most commercial universal fa-
tigue testing machines have this feature.
Figure 14 Universal-tester [http://testersupply.com/8-fatigue-testing-machine.html]
Other possible types, though not commonly used for simplified testing are:
1. Torsion loading fatigue tester.
2. Combined bending and torsion fatigue tester.
3. Bi-axial and tri-axial loading fatigue tester.
Classification based on source of stressing

Fatigue Failure and Testing Methods
20
The following classification of fatigue testing machine is based on the principle behind
the source of the test-force. Load produced by:
1. Mechanical deflection
2. Dead weight or constant spring force
3. Centrifugal force
4. Electromagnetic force
5. Hydraulic force
6. Pneumatic force
The choice of load source depends on numerous factors such as the needed frequency,
amount of forces required, available control system, cost, and how close the test is to be
simplified to the actual working loading in service.
4.3 Components of a fatigue testing machine
All type of fatigue testing machine is composed of the following structural components:
1. Load-producing mechanism
This generates the alternating load (displacement) to which in some cases a steady load
is added.
2. Load-transmitting member
This includes grips, guide fixtures, flexure joints etc. by which the load produced is
transmitted in such a way as to produce the desired stress distribution within the speci-
men.
3. Measuring devices
This permit the setting of the nominal upper and lower load limits.
4. Control devices
This component controls the load throughout the test and sometimes automatically cor-
rects changes in force or displacement arising during the test using feedback techniques.
5. Counter and shut-off apparatus
This counts the number of stress reversals imposed on the specimen and stop the testing
machine after a given number of cycles, at complete fracture of the specimen or at some
pre-assigned change in deformation or frequency.

Fatigue Failure and Testing Methods
21
6. Framework
It supports the various parts of the machine and if necessary is arranged to reduce the
vibratory energy transmitted to the foundation.
In conclusion, the purpose of a fatigue testing machine is to apply to the specimen an
alternating load producing a well-defined stress distribution. The distribution should be
reproducible within narrow limits, a requirement which includes that the load should be
reproduced with sufficient accuracy and it should be transmitted to the test-piece with-
out undue scatters. Hence a careful and correct calibration and checking of the testing
machine is an indispensable condition for obtaining reliable results from any fatigue
testing machine.
4.4 The testing machine of HAMK University, mechatronic laboratory
The testing machine (still under construction) is a universal testing machine which can
be used for tensile test, compressive test and fatigue testing. The hydraulic can produce
forces up to 16KN and a frequency of maximum 10Hz.
The machine is a servo-controlled hydraulic testing machine. It is controlled with phoe-
nix programmable logic controller and can support wide ranges of load cell both for
axial force test and bending tests.
A full description of the capability of the tester and its components specification includ-
ing its user manual is available as a separate document.
Figure 15 Dynamic testing machine in HAMK Mechatronics laboratory (under-
construction)

Fatigue Failure and Testing Methods
22
4.5 Design of the testing support structure
The initial idea was to design a set-up for tensile test as the verification test for the dy-
namic fatigue tester, a major reason for this is that the machine was intended to be used
to test the behavior of welded TRIP Steel for Innosteel Oy, Hämeenlinna when the
welded parts is subjected to tensile force of 2-3 KN dynamic loading. To come up with
this design, several commercial universal fatigue testers were analyzed and also interna-
tional standards on basic design of mechanical testing. It was later discovered that ten-
sile fatigue testing will not be possible with the machine because the hydraulic cylinder
of the dynamic tester cannot provide the needed linear movement amplitude for tensile
fatigue testing, hence a new design (require smaller linear amplitude) is needed.
A bending setup was then considered, aside the fact that the first documented laboratory
fatigue test done by August Wöhler was actually a rotating bending fatigue up, bending
set-up offers much more advantages than other possible forms of set up, some of this
advantages are stated below:
1. Easy way to characterize some of the mechanical properties of a material
2. No special gripping is required
3. Mounting and dismounting of test-pies is very straight forward
4. The specimen is usually of very simple shape (rectangular cross section)
There are two options for the fatigue bending set-up
1. Three points fatigue bending set-up.
2. Four points fatigue bending set-up.
Figure 16 Transverse force and moment for the two bending setups.

Fatigue Failure and Testing Methods
23
In three points bending set-up, each section of the beam has a transverse force, resulting
in an interlaminar shear tension, which can cause delamination. But in four points bend-
ing, there is a section of the beam which is constant and the transverse force (thus the
interlaminar shear stress) is zero. This section experiences only normal stress.
In fatigue testing, the specimen shows permanent deflection after a few thousand cycles.
As a result, the indenter loses contact when its displacement is smaller than the perma-
nent deflection. In the next cycle, the indenter has an impact on the surface of the spec-
imen, causing impact damage, and as a result corrupts the fatigue data.
This problem can be solved if the permanent deflection is kept symmetrically, which
means at zero deflection. This can be easily obtained by fully reversed bending, where
the displacement varies between –Umin and +Umax.
In addition, since the specimen rotates at its ends, the outer supports need to allow this
rotation; otherwise, this would induce unwanted reaction forces in the specimen, cor-
rupting the fatigue data.
To carry out a four points fully reversed fatigue-bending test, a 4 points set-up is re-
quired. The figure below is the initial proposed design for bending set up support struc-
ture taking care of all the points stated above so as to achieve reasonable fatigue data.
Figure 17 Initial proposed design of a 4-point fully reversed bending set-up with rotat-
ing side supports.
Although the design above took care of the necessary points stated above, is major dis-
advantages are:
1. Complexity: it is quite complex and its mode of operation is not easy to comprehend.
2. Manufacturability: Several manufacturing process such as welding, drilling, milling,
turning, cutting will be required to make this design hence, it will be expensive to make.

Fatigue Failure and Testing Methods
24
Due to the reasons stated above and some minor ones, this design could not be ap-
proved, so, a cheaper, intuitive and easy to produce design is required.
“It is more difficult to make a simple design than a complex one….anonymous”
To solve the problem of cost, it was decided that all materials needed to manufacture the
support structure and set-up will be from the stock of HAMK Mechanical Engineering
Laboratory and also major machining operations such as turning, milling will be elimi-
nated. The new design must be easy to assemble and dissemble with little or no manual
required and finally it must allow test of wide range sizes/dimensions i.e. it must be
adjustable in length and height.
Figure below is the final design of the testing support structure. The beam structure is
far stronger than the maximum capacity of load that the hydraulic unit of the tester can
produce and it requires less manufacturing process (basically cutting, drilling and weld-
ing) than the earlier design.
Figure 18 Final design of the support structure for bending set up.
5 COLLECTION, ANALYSIS AND PRESENTATION OF FATIGUE
DATA
In order to generate realistic data for fatigue analysis, the fatigue tests are carried out on
several specimens at different levels of maximum alternating stresses. The fatigue data
is plotted on a semi-log or log-log scale in the form of S-N curve (i.e. stress vs. number
of cycles to failure curve), also known as the Wöhler curve. The portion of curve with
negative slope constitutes the finite life region and represents fatigue strength of the
material for given number of stress cycles, while the horizontal portion represents infi-
nite life region.
The stress level corresponding to horizontal portion (i.e. infinite life) is known as fa-
tigue Limit of the material. The changeover point, or the knee, signifies the phenome-
non where Crack nucleation is essentially arrested by some microstructural features.

Fatigue Failure and Testing Methods
25
5.1 Analysis and determination of finite life
Owing to inherent microstructural inhomogeneity in the material properties, differences
in surface finish and test condition, fatigue data exhibit scatter. The variance of log life
generally increases with decreasing stress levels, particularly for un-notched specimens;
hence, it is necessary to take into account the statistical nature of the fatigue data.
Various techniques are available to construct a median S-N curve and associate lower
and upper bound curves that characterize the minimum and maximum fatigue lives at a
given level of stress amplitude.
The JSME S 002 standard is one of them and much simpler in principle to other tech-
niques. It involves testing of two fatigue specimens at four stress levels for finite life
regions; while 6 specimens are used for determining the fatigue limit through the stair-
case method (will be discussed in the next paragraph). The recommended test sequence
is shown in figure xxx, where the numbers next to the data points represent the order for
conducting the fatigue tests. The fatigue is determined by taking the average of the
stress levels employed during the staircase test.
Figure 19 S-N testing according to JSME standard
5.2 Staircase method
The staircase method provides an estimate of the endurance limit by taking into account
its statistical nature. It is also known as up and down method. It is more efficient than

Fatigue Failure and Testing Methods
26
other methods such as the probit method because it can reduce the number of needed for
the whole text by forty percent.
In this test method, first of all, the mean endurance limit is estimated. Following this, a
specimen is tested at stress amplitude Sa slightly (about 5%) higher than the expected
endurance limit. If the specimen fails before completion of stipulated number of cycles
(about 2 million cycle), then the next specimen is tested at lower stress amplitude.
However, in the event of survival of a specimen, the test is suspended after completion
of stipulated number of cycles and the next specimen is tested at higher amplitude of
maximum alternating stress. Thus, the stress amplitude of each successive test is based
on the outcome of its previous test.
Figure 20 Staircase method for determining endurance limit.
In order to use the Dixon-mood method for statistical analysis of the test data from the
staircase method, the stress-steps must be uniform. The Dixon-mood method provides
formulae for estimating the mean, s and standard deviation,
s of the endurance limit,
Se, this is estimated by using the data of less frequent event out of the two possible
events i.e. survivals or failures. The individual stress amplitude, Sa which are spaced
uniformly at an interval of (d) are numbers as I, where i = 0 is used to denote the lowest
stress amplitude, S0. The method also requires that:
2
ssd
The estimate of mean endurance limit is given by;
If survival is less frequent event,
Fatigue Failure and Testing Methods
27
0
,
1
2
DMs
DM i
AS d
n
(7)
If failure is less frequent event,
0
,
1
2
DMs
DM i
AS d
n
(8)
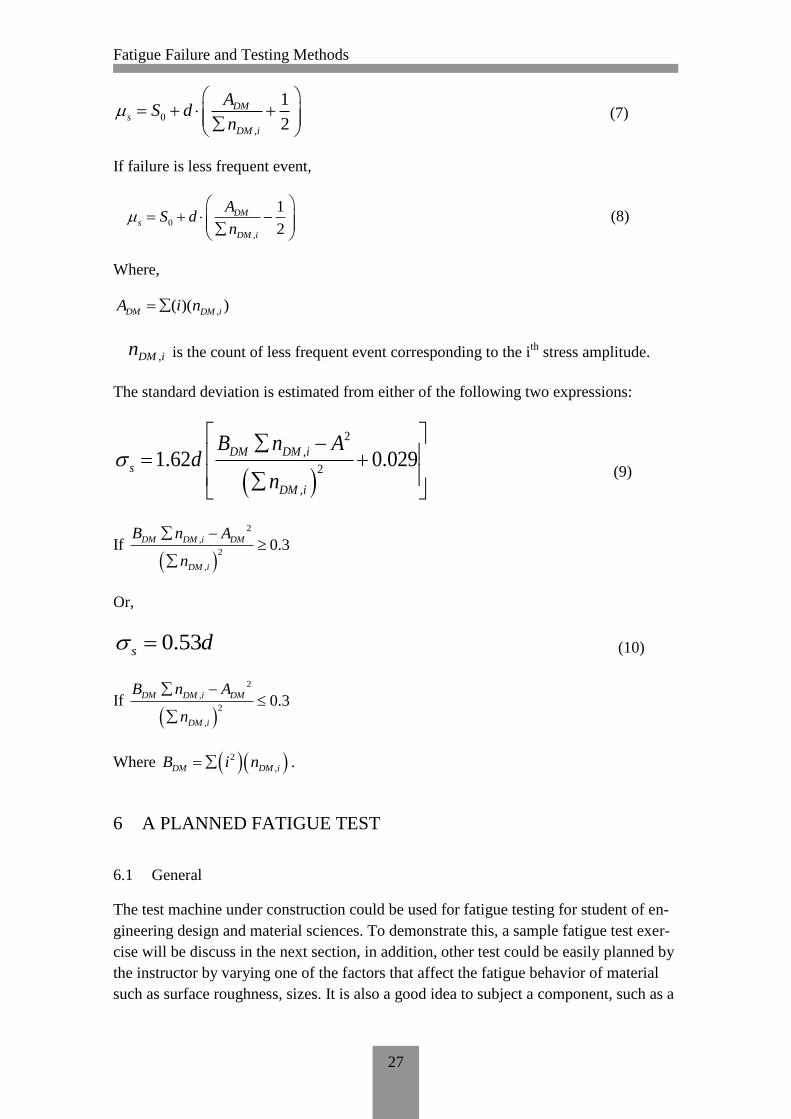
Where,
,( )( )DM DM iA i n
,DM in is the count of less frequent event corresponding to the ith
stress amplitude.
The standard deviation is estimated from either of the following two expressions:
2
,
2
,
1.62 0.029DM DM i
s
DM i
B n Ad
n
(9)
If
2
,
2
,
0.3DM DM i DM
DM i
B n A
n
Or,
0.53s d (10)
If
2
,
2
,
0.3DM DM i DM
DM i
B n A
n
Where 2
,DM DM iB i n .
6 A PLANNED FATIGUE TEST
6.1 General
The test machine under construction could be used for fatigue testing for student of en-
gineering design and material sciences. To demonstrate this, a sample fatigue test exer-
cise will be discuss in the next section, in addition, other test could be easily planned by
the instructor by varying one of the factors that affect the fatigue behavior of material
such as surface roughness, sizes. It is also a good idea to subject a component, such as a

Fatigue Failure and Testing Methods
28
circuit board to a constant cyclic stress and ask the student to determine how much cy-
cle the component can withstand.
It is important that the students are introduced to the theory of fatigue and if possible
use this thesis work as references before they perform the laboratory task and also study
the manual of the dynamic testing machine in order to be able to conduct the experiment
independently.
6.2 Fatigue test exercise
Objective
The main objectives of this experiment are.
1. Perform the fatigue test on the given specimen using the dynamic testing machine in
the laboratory to predict the fatigue life
2. Determine the safe stress level for the specimens if the fatigue life of 1,000,000 re-
versals had to be withstood.
Apparatus required
Dynamic testing machine, vernier caliper, aluminum specimens.
Experimental procedures
As fatigue experiments may run for hours, the usual procedure is to divide the class into
groups; each group will experiment with four aluminums specimens or more depending
on the size of the class. Each group will have a unique load set; two specimens will be
experimented with each of the load set. The load set for each group will be provided
once the group is made.at the end of the exercise, results will be shared among the
groups. The following procedures are to be followed:
1. Measure the dimension of the test piece and inspect the surface roughness.
2. Fix the test piece to the testing machine, set the test parameters and begin the test.
Instructions on how to operate the testing machine is available on the machine manual.
The test parameters are given below.
Material: Aluminum
Dimensions: 160mm x 30mm x 2.5mm
Frequency: 2 Hz
Amplitude: 6 mm
Force range: 1 – 7 KN.
3. Test two specimens for each load value.

Fatigue Failure and Testing Methods
29
4. Collate the results and record the testing parameters and testing conditions
Results
After obtaining the results for your load cases and getting the results of the remaining
cases from other groups, plot stress against logN on a suitable graph paper and look for
best fit lines and also determine the safe stress level if a fatigue life of 1,000,000 rever-
sals had to be withstood. Also discuss the fractured cross section of your specimens and
identify the cause of the fracture and also analyze the factor which could have affect the
result of your test.
Finally, compare your graph with standard S-N graph of aluminum and state reasons for
difference, if any.
7 CONCLUSION
Due to the wealth of materials on fatigue available on fatigue failure for research works,
it was quite challenging to sieve through these useful materials and come up with the
most relevant ones to the task at hand. Despite this fact, tremendous effort was put into
this work to select the most relevant information necessary for designers and researcher.
Perhaps, works such as this will inspire young engineers to design structures that can
withstand fatigue loading. Although numerous work has been done on fatigue failure
and testing methods, much still need to be done perhaps in a new dimension, I observed
that engineering students are introduce to the principle of fatigue towards the end of
their bachelor studies or early masters studies. I strongly suggest that students should be
introduce to the principle of fatigue failure right from their first year alongside other
testing (tensile test, hardness test and the rest) and also much more collaboration be-
tween engineers and materialist is needed so as to tackle the problem of fatigue failure.
Upon completion of the dynamic testing machine, this thesis work may serve as a guide
for various laboratory exercises and structural design courses for the engineering stu-
dent of HAMK University of Applied Sciences.

Fatigue Failure and Testing Methods
30
SOURCES
[1] Ives De Baere, Department of Mechanical Construction and Production, Ghent Uni-
versity, Gent, Belgium.
[2] J. Schijve fatigue of structures and materials. Dordrecht, Boston: Kluwer Academic
press, 2001.
[3] J. Schijve, “Fatigue of structures and materials in the 20th
century and the state of the
art” international journal of fatigue 25 (2003) 679-702.
[4] Nordson DAGE, 3 and 4 point flexural testing application note.pdf.
[5] T .Zhai, Y.g. Xu , j. W. Martins, A Wilkinson, G.A.D Briggs, “A Self-aligning
four-point bend Testing Rig and sample geometry effect in four-point bend fatigue”,
International journal of fatigue 21 (1999) 889-894.
[6] W. Weibull, Fatigue Testing and Analysis of Results; oxford. London. New York.
Paris, Pergamon press, 1961.

Fatigue Failure and Testing Methods
APPENDIX
Technical Drawings of the Proposed design of Support Structure.
(Available as attachment in the hard-copy version at HAMK Riihimäki library).