Embed Size (px)
Citation preview

See discussions, stats, and author profiles for this publication at: https://www.researchgate.net/publication/229045444
Fatigue Analysis and Optimization of Flexible Printed Circuits
Article · January 2006
CITATIONS
4READS
1,800
1 author:
Alexander V. Ptchelintsev
Nokia Research Center
3 PUBLICATIONS 21 CITATIONS
SEE PROFILE
All content following this page was uploaded by Alexander V. Ptchelintsev on 23 May 2014.
The user has requested enhancement of the downloaded file.

2006 ABAQUS Users’ Conference 405
Fatigue Analysis and Optimization of Flexible Printed Circuits
Alexander Ptchelintsev Nokia Research Center
P.O. Box 407, FI-00045 NOKIA GROUP, Finland Email: [email protected]
Abstract: Flexible printed circuits (FPC) are widely used in various electronic packages to interconnect high-performance devices. In case of dynamic applications mechanical reliability of FPCs is becoming a serious issue as complexity of the devices grows and miniaturization trend continues. For many of such applications, failures of FPCs can lead to serious consequences. Fatigue data on FPCs are not commonly available in published literature. One way to obtain such data is to combine fatigue test results from standard or proprietary FPC dynamic testers with Finite Element Analysis (FEA) based simulations. This paper describes first results of a research project on development of an automated procedure of fatigue life assessment of FPCs by FEA combined with fatigue and optimization analysis. Two goals have been pursued with development of the methodology: to enable quick modeling and FEA of FPCs by electrical or mechanical designers who are not familiar with FEA technology and ABAQUS software; to develop a fully parameterized model for subsequent sensitivity and optimization studies. The automated modeling of FPCs has been implemented as a vertical application or plug-in in Abaqus/CAE. Fatigue analysis based on the strain-life method has been programmed in Excel since location of the most dangerous area from fatique point of view could be predicted in advance. In general cases one should use specialized fatigue analysis software for this purpose. FEA and fatigue analysis have been combined using OPTIMUS software to find out an optimum design of the FPC from the fatigue point of view. First results of the sensitivity and optimization studies have shown that the method can be used provided more detailed test results are available both on a material and FPC level.
Keywords: Flexible Circuit, Fatigue, FEA, Optimization, DOE.

406 2006 ABAQUS Users’ Conference
1. Introduction
Flexible printed circuits (FPCs) are widely used in various electronic packages to interconnect high-performance devices. In case of dynamic applications like portable electronics and mobile phones, mechanical reliability of dynamic FPCs is becoming a serious issue as complexity of the devices grows and miniaturization trend continues. For many of such applications, failure of FPCs can lead to serious consequences. There are two main types of FPCs – static and dynamic. Circuits that are designed to form into a specific shape in order to conform to a design, and retain that shape without further flexing are called static flexible circuits. Dynamic flexible circuits, on the other hand, are made to provide a means of electrically connecting moving parts. Two main factors that influence usable life of dynamic flexible circuits are material parameters and circuit design. Detailed data on fatigue properties of thin copper foils and FPCs are not commonly available in published literature. One way to obtain such data is to combine fatigue test results from standard or proprietary FPC dynamic testers with finite element analysis (FEA) based simulations. Fatigue of cupper foils and flexible printed circuits has been of significant importance for suppliers of FPCs who published results of experimental studies (Merchant, 1999, Hayes, 2001, Douta, 2001, Martynenko, 2002). Several authors presented results of finite element simulations of FPCs using mainly 2-D models (Zehnder, 1997, Douta, 2001, Martynenko, 2002).
This paper presents a methodology how to model, simulate and conduct fatigue analysis of FPCs in automated manner. This is an ongoing study and only first results are presented in this paper. We have been pursuing two goals with development of the methodology. A first goal was to enable quick modeling and finite element analysis of FPCs by electrical or mechanical designers who are not familiar with FEA technology and ABAQUS software. The second goal was to develop fully parameterized model for subsequent sensitivity and optimization studies. In this paper automated modeling of FPCs has been implemented as a vertical application or plug-in in Abaqus/CAE.
2. Finite element analysis of FPCs with ABAQUS
2.1 Material properties
Circuit material choices are limited by their suitability for use in dynamic flex circuits by electrical, mechanical, and physical properties. Copper foil is used as the current carrying material in FPCs. In dynamic flex circuits annealed rolled copper (RA) foils are generally used because their fatigue ductility is much better than that of conventional electrodeposited (ED) foils. Polyimide films are used because they are dimensionally stable, can withstand soldering temperatures, and have high initiation tear strength. Adhesive type greatly influences flex life. Material properties provided by suppliers are usually limited to elastic ones and therefore sophisticated material models available in commercial finite element tools like ABAQUS cannot be utilized without conducting special additional testing. Literature review has shown that structural properties of thin copper foils are significantly different from properties of bulk copper and that should be taken into account in finite element simulations (Merchant, 1999, Hutchinson, 2000, Low, 2003, Yu, 2004). In the current model, copper and adhesive materials were specified

2006 ABAQUS Users’ Conference 407
as elastic-plastic with linear kinematic hardening option and linear properties were used for polyimide, see Table 1.
Table 1. Example of material properties used in the simulation. Material Poisson ratio Elastic Modulus
(GPa) Yield Stress
(MPa) Copper 0.34 75.0 85.0 Adhesive 0.4 0.69 33.0 Polyimide 0.35 4.0 -
Fatigue properties of FPCs are usually obtained by doing flex or rolling tests on standard or proprietary testers. The most typical test employed in the determination of dynamic flex life is the rolling flex method, where an etched circuit pattern with coversheet is subjected to continuous flexing until electrical discontinuity occurs. Motion of the model can be characterized by several stages. Situations at the start of the each stage are illustrated in Figure 1.
Side view
a) Starting position
b) End of FPC bending, upper holder
moves down
c) Rolling forward
d) Rolling backwards
Figure 1. Stages (a-d) of a rolling test.
2.2 Finite element model
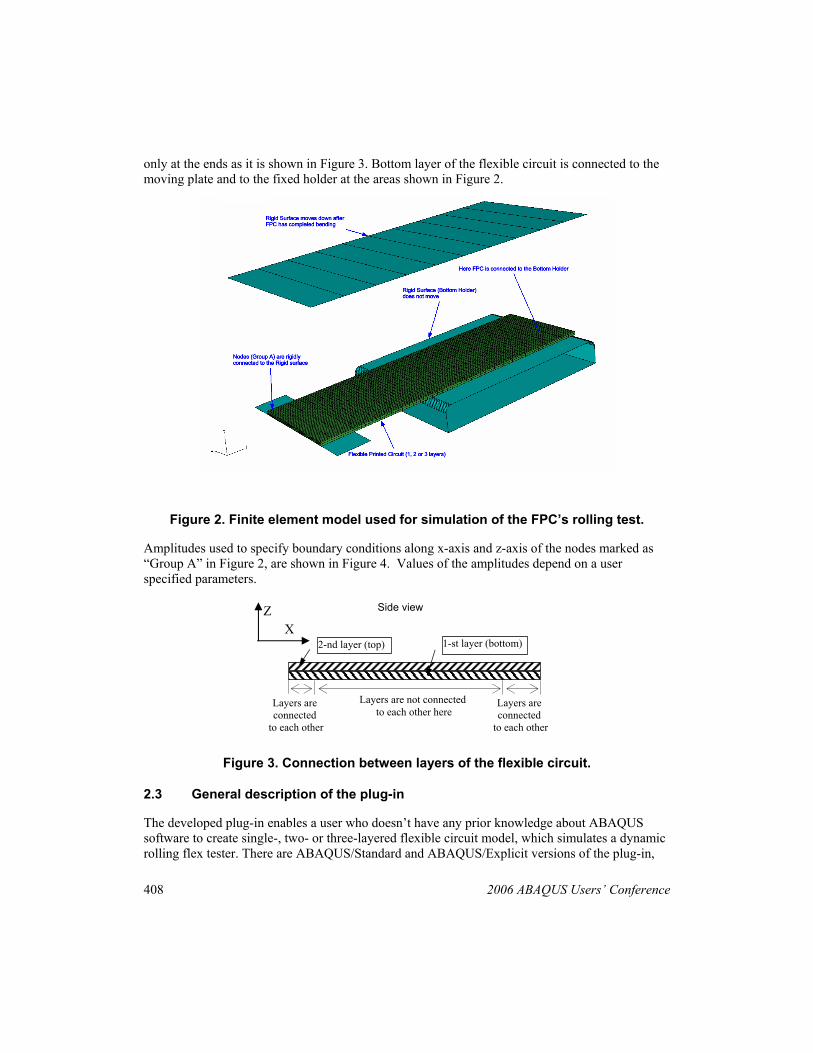
ABAQUS code (ABAQUS, 2005) has been selected for doing finite element modeling of the rolling test because that was a customer request. For modeling of the rolling test, it would be enough to have a simplified 2-D model but in a general case in a mobile phone flexible circuits can have various complicated shapes and deformation behavior that would require 3-D models. Continuum shell elements with composite structure have been chosen for modeling of FPSs and other parts were modeled as discrete rigid bodies. General view of the model is depicted in Figure 2. It can be seen that model contains four main parts: flexible circuit, two plates and one holder. Flexible circuit can be single, two- or three-layered. Bottom layer and middle layer can be different but upper layer is the same as the bottom layer. The layers are connected to each other
408 2006 ABAQUS Users’ Conference
only at the ends as it is shown in Figure 3. Bottom layer of the flexible circuit is connected to the moving plate and to the fixed holder at the areas shown in Figure 2.
Figure 2. Finite element model used for simulation of the FPC’s rolling test.
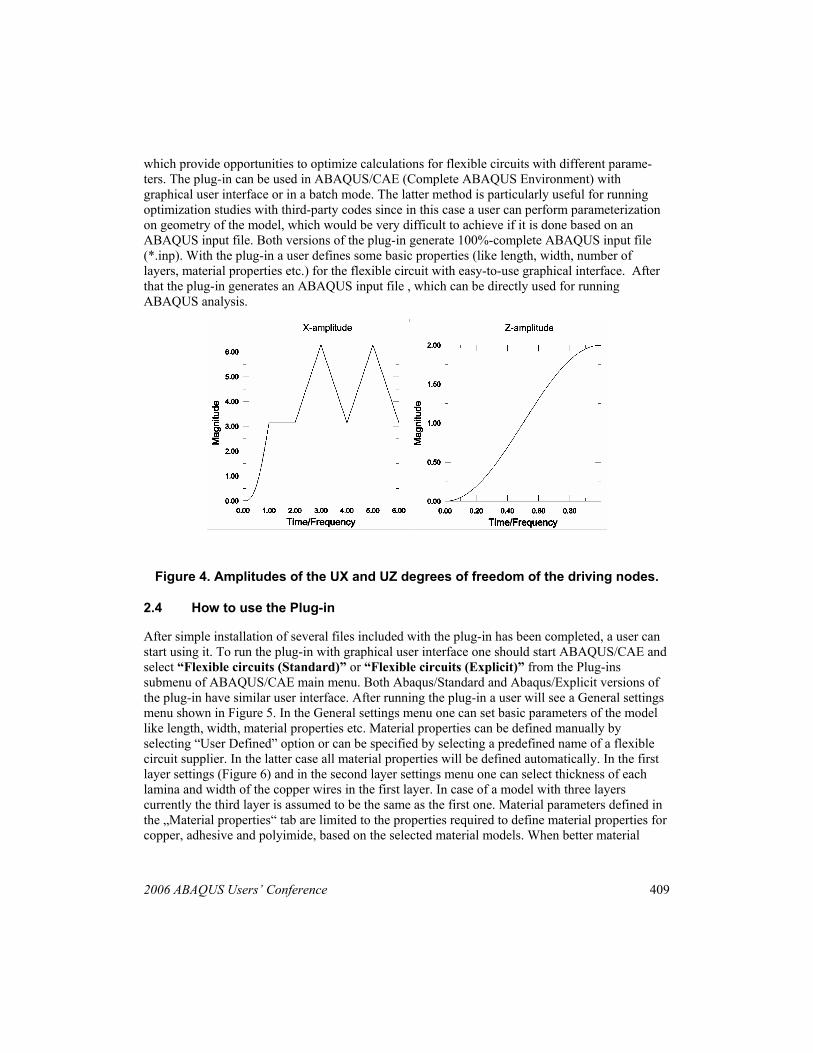
Amplitudes used to specify boundary conditions along x-axis and z-axis of the nodes marked as “Group A” in Figure 2, are shown in Figure 4. Values of the amplitudes depend on a user specified parameters.
Figure 3. Connection between layers of the flexible circuit.
2.3 General description of the plug-in
The developed plug-in enables a user who doesn’t have any prior knowledge about ABAQUS software to create single-, two- or three-layered flexible circuit model, which simulates a dynamic rolling flex tester. There are ABAQUS/Standard and ABAQUS/Explicit versions of the plug-in,
2-nd layer (top) 1-st layer (bottom)
Layers are not connected to each other here
Side view
X Z
Layers are connected
to each other
Layers are connected
to each other
2006 ABAQUS Users’ Conference 409
which provide opportunities to optimize calculations for flexible circuits with different parame-ters. The plug-in can be used in ABAQUS/CAE (Complete ABAQUS Environment) with graphical user interface or in a batch mode. The latter method is particularly useful for running optimization studies with third-party codes since in this case a user can perform parameterization on geometry of the model, which would be very difficult to achieve if it is done based on an ABAQUS input file. Both versions of the plug-in generate 100%-complete ABAQUS input file (*.inp). With the plug-in a user defines some basic properties (like length, width, number of layers, material properties etc.) for the flexible circuit with easy-to-use graphical interface. After that the plug-in generates an ABAQUS input file , which can be directly used for running ABAQUS analysis.
Figure 4. Amplitudes of the UX and UZ degrees of freedom of the driving nodes.
2.4 How to use the Plug-in
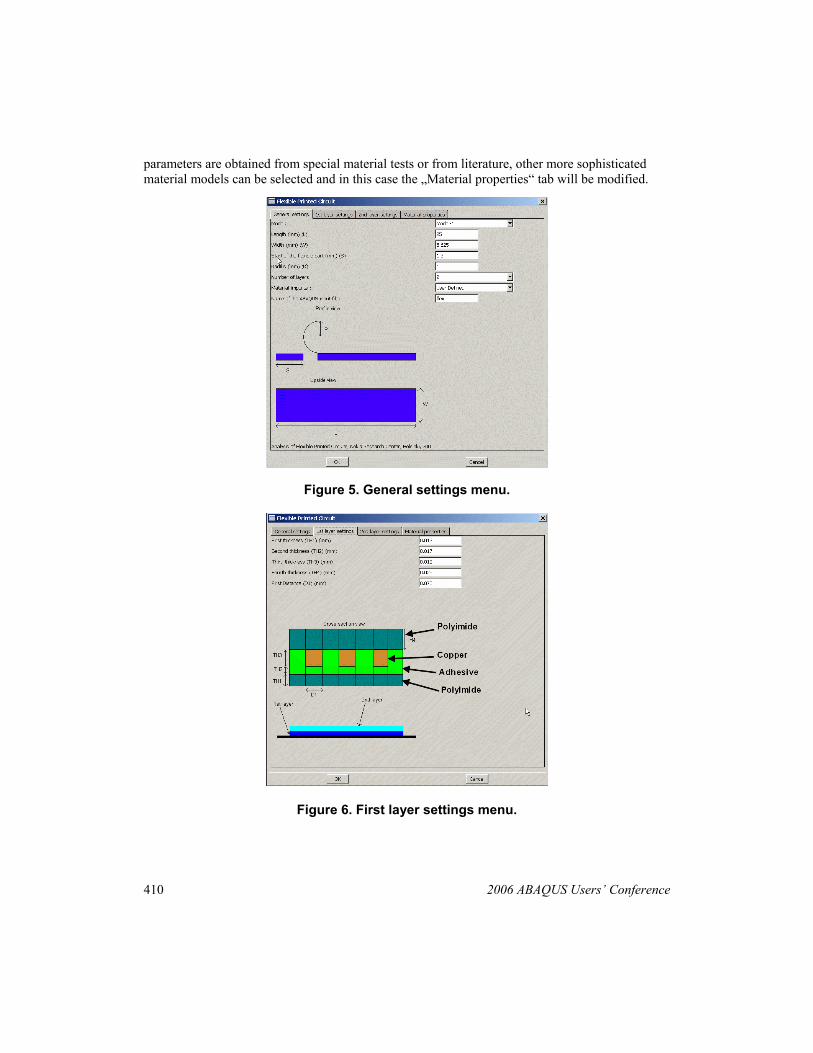
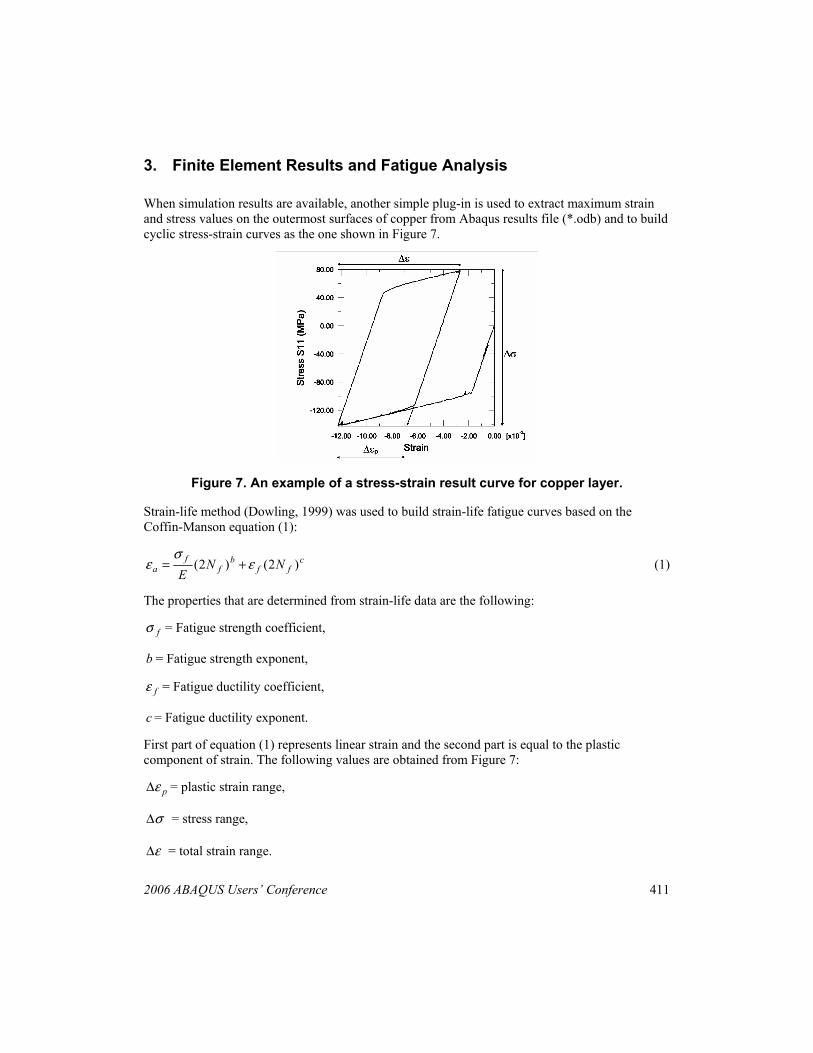
After simple installation of several files included with the plug-in has been completed, a user can start using it. To run the plug-in with graphical user interface one should start ABAQUS/CAE and select “Flexible circuits (Standard)” or “Flexible circuits (Explicit)” from the Plug-ins submenu of ABAQUS/CAE main menu. Both Abaqus/Standard and Abaqus/Explicit versions of the plug-in have similar user interface. After running the plug-in a user will see a General settings menu shown in Figure 5. In the General settings menu one can set basic parameters of the model like length, width, material properties etc. Material properties can be defined manually by selecting “User Defined” option or can be specified by selecting a predefined name of a flexible circuit supplier. In the latter case all material properties will be defined automatically. In the first layer settings (Figure 6) and in the second layer settings menu one can select thickness of each lamina and width of the copper wires in the first layer. In case of a model with three layers currently the third layer is assumed to be the same as the first one. Material parameters defined in the „Material properties“ tab are limited to the properties required to define material properties for copper, adhesive and polyimide, based on the selected material models. When better material
410 2006 ABAQUS Users’ Conference
parameters are obtained from special material tests or from literature, other more sophisticated material models can be selected and in this case the „Material properties“ tab will be modified.
Figure 5. General settings menu.
Figure 6. First layer settings menu.
2006 ABAQUS Users’ Conference 411
3. Finite Element Results and Fatigue Analysis
When simulation results are available, another simple plug-in is used to extract maximum strain and stress values on the outermost surfaces of copper from Abaqus results file (*.odb) and to build cyclic stress-strain curves as the one shown in Figure 7.
Figure 7. An example of a stress-strain result curve for copper layer.
Strain-life method (Dowling, 1999) was used to build strain-life fatigue curves based on the Coffin-Manson equation (1):
cff
bf
fa NN
E)2()2( ε
σε += (1)
The properties that are determined from strain-life data are the following:
fσ = Fatigue strength coefficient,
b = Fatigue strength exponent,
fε = Fatigue ductility coefficient,
c = Fatigue ductility exponent.
First part of equation (1) represents linear strain and the second part is equal to the plastic component of strain. The following values are obtained from Figure 7:
pεΔ = plastic strain range,
σΔ = stress range,
εΔ = total strain range.
412 2006 ABAQUS Users’ Conference
It would be useful to use half-ranges of the amplitudes instead of the amplitudes: Δε/2Δεa = , 2/σσ Δ=Δ a , 2/ppa εε Δ=Δ . Number of tests to failure is equal to fN2 , where fN is the
number of full reversals. E is elastic modulus of the material.
To draw the strain-life curve we need to determine the following constants for the equation (1): cbf ,,σ and fε . This was done in Excel by using linear least mean square approximation to fit the
following equations:
)log(1)log(1)2log( faf bbN σσ −= (2)
)log(1)log(1)2log( fpaf ccN εε −= (3)
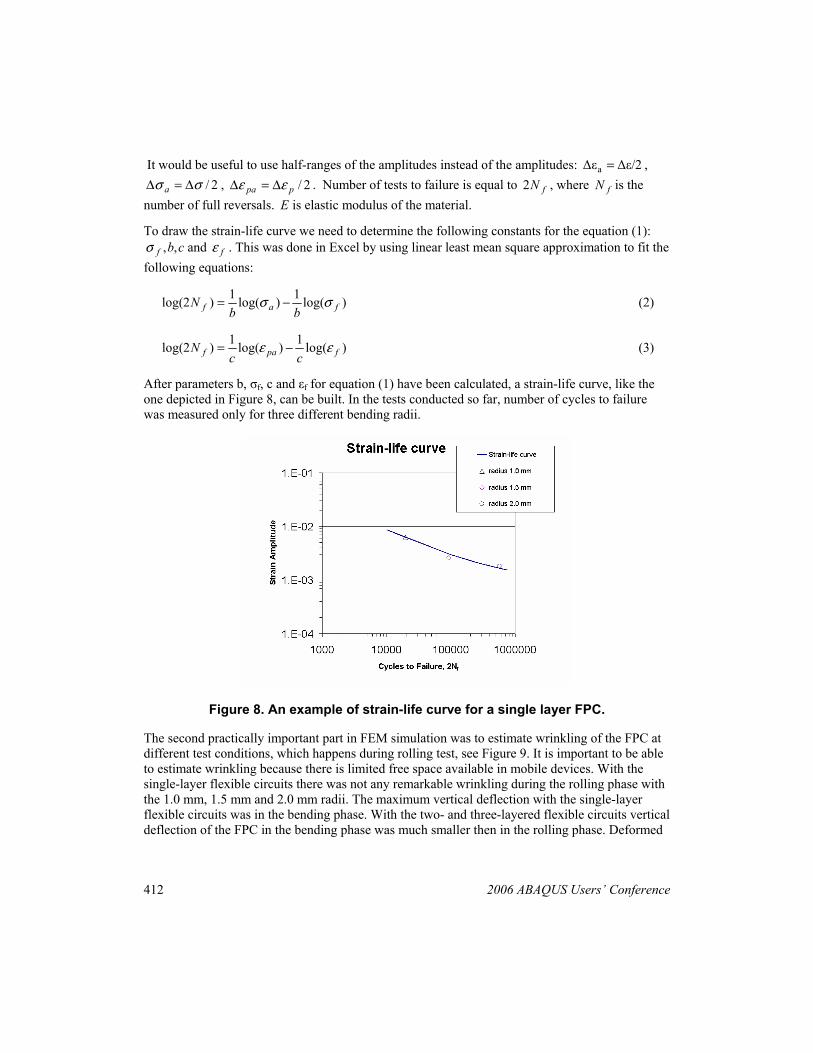
After parameters b, σf, c and εf for equation (1) have been calculated, a strain-life curve, like the one depicted in Figure 8, can be built. In the tests conducted so far, number of cycles to failure was measured only for three different bending radii.
Figure 8. An example of strain-life curve for a single layer FPC.
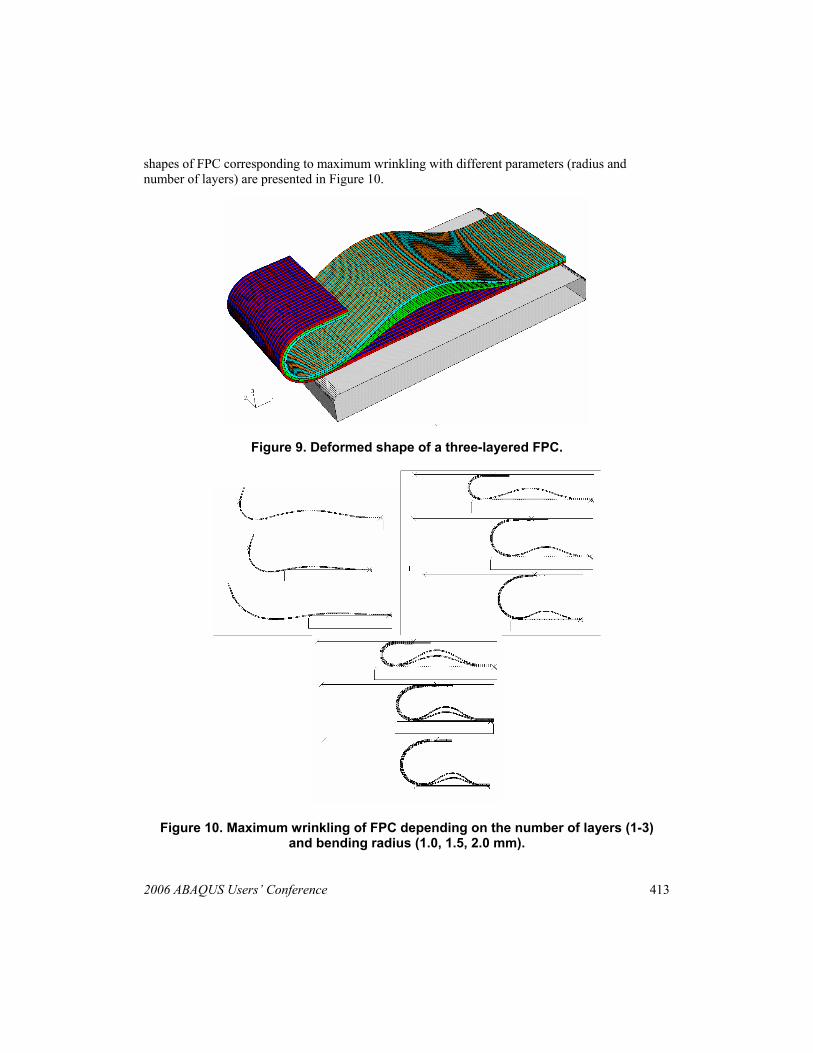
The second practically important part in FEM simulation was to estimate wrinkling of the FPC at different test conditions, which happens during rolling test, see Figure 9. It is important to be able to estimate wrinkling because there is limited free space available in mobile devices. With the single-layer flexible circuits there was not any remarkable wrinkling during the rolling phase with the 1.0 mm, 1.5 mm and 2.0 mm radii. The maximum vertical deflection with the single-layer flexible circuits was in the bending phase. With the two- and three-layered flexible circuits vertical deflection of the FPC in the bending phase was much smaller then in the rolling phase. Deformed
2006 ABAQUS Users’ Conference 413
shapes of FPC corresponding to maximum wrinkling with different parameters (radius and number of layers) are presented in Figure 10.
Figure 9. Deformed shape of a three-layered FPC.
Figure 10. Maximum wrinkling of FPC depending on the number of layers (1-3) and bending radius (1.0, 1.5, 2.0 mm).

414 2006 ABAQUS Users’ Conference
4. Sensitivity Analysis
Sensitivity analysis of a single-layer model of FPC was conducted using commercial general-purpose optimization software OPTIMUS from Noesis Solutions company (Noesis Solutions, 2005). OPTIMUS is an environment in which one can automatically visualize and explore the design space and gain the critical insights into the dynamics of the problem. OPTIMUS can intelligently find the optimum point in the design space using a combination of gradient methods for a quick analysis - or state-of-the-art genetic algorithms where multiple hills, valleys and saddles are anticipated in the response surface. Four geometrical parameters selected as input variables for the sensitivity study are thicknesses of each lamina as shown in Table 2, where nominal low and high values of the variables are shown.
Table 2. Geometrical input variables. Variable name Low value (mm) Nominal value (mm) Maximum value (mm) TH1 0.006 0.012 0.018 TH2 0.0085 0.017 0.0256 TH3 0.009 0.018 0.027 TH4 0.0125 0.025 0.0375
Young’s modulii of copper, adhesive and polyimide were selected as three more input variables as shown in Table 3 with their corresponding nominal, low and high values.
Table 3. Material input variables. Variable name Low value (GPa) Nominal value (GPa) Maximum value (GPa) CopperYoung 37.5 75 112.5 AdhYoung 0.35 0.7 1.05 PolYoung 2.15 4.3 6.45
It was necessary to parameterize the model in order to run Design of Experiment (DOE) study in OPTIMUS. Since change of section properties affects other parts in the model, parameterization of ABAQUS input files would have been very tedious. The task was easily achieved by parameterization of a batch file, which is used to run a command line version of the plug-in. After that three output vectors and three output variables had to be defined. Total strain LE11, plastic strain PE11 and maximum stress S11 have been selected as output vectors and ranges of these vectors were defined as output variables since these values are needed to estimate fatigue life. The overall workflow defined in OPTIMUS is shown in Figure 11.
Figure 11. Process Flow for DOE study
In the current version of OPTIMUS information is retrieved by the program from ASCII input and output files. To create output vectors we had to request printing of results in certain elements to a *.dat file and after that the file had to be cleaned and only needed information was extracted with
2006 ABAQUS Users’ Conference 415
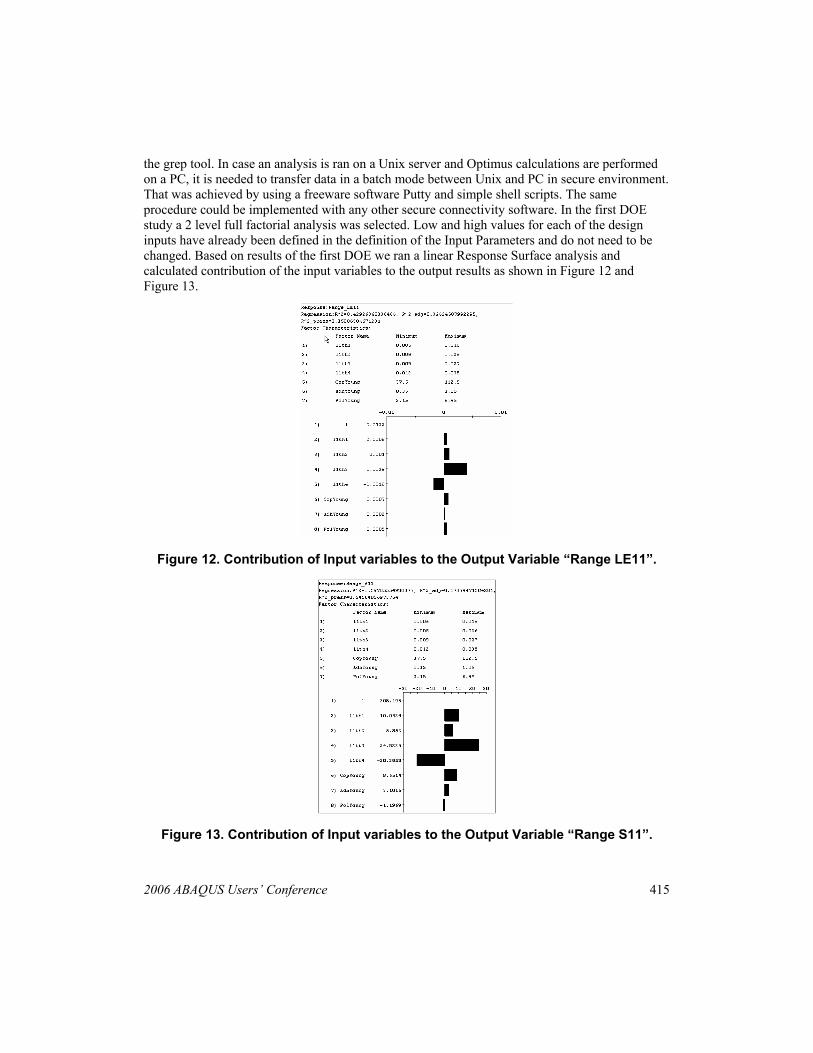
the grep tool. In case an analysis is ran on a Unix server and Optimus calculations are performed on a PC, it is needed to transfer data in a batch mode between Unix and PC in secure environment. That was achieved by using a freeware software Putty and simple shell scripts. The same procedure could be implemented with any other secure connectivity software. In the first DOE study a 2 level full factorial analysis was selected. Low and high values for each of the design inputs have already been defined in the definition of the Input Parameters and do not need to be changed. Based on results of the first DOE we ran a linear Response Surface analysis and calculated contribution of the input variables to the output results as shown in Figure 12 and Figure 13.
Figure 12. Contribution of Input variables to the Output Variable “Range LE11”.
Figure 13. Contribution of Input variables to the Output Variable “Range S11”.

416 2006 ABAQUS Users’ Conference
5. Conclusions
A methodology that enables detailed finite element analysis of certain types of FPCs to be done quickly and in a fully parameterized way has been presented. A first simplified attempt to conduct fatigue analysis of the FPCs using strain-life method has shown that the method can be used provided more detailed test results are available both on a material and FPC level. Preliminary Design of Experiments study has revealed the most important geometrical and material parameters. Next step in the study would be an optimization analysis to find out the optimum design of the FPC from the fatigue point of view.
6. Acknowledgements
The author wishes to acknowledge the contributions of his colleagues at Nokia in Finland Pirkitta Koponen and Jukka Seppänen who provided test data and valuable comments.
7. References
1. ABAQUS, version 6.5-3, 2005. 2. Merchant, H.D., et al, “Mechanical Fatigue of Thin Copper Foil,” Journal of Electronic
Materials, Vol. 2, No. 9, 1999. 3. Hutchinson, J. W., “Plasticity at the micron scale”, International Journal of Solids and
Structures, vol. 37, pp. 225-238, 2000. 4. Low T. H., Pang J.H. L., Lin C. W. C., Chiang S. C. L. and Yang T. K. A., “Modeling Plated
Copper Interconnections in a Bumpless Flip Chip Package”, Electronics Packaging Technology Conference, 2003.
5. Yu D., Spaepen F., “The Yield Strength of Thin Copper Films on Kapton,” Journal of Applied Physics,vol. 95, No. 6, 2004.
6. Hayes C., “Characterization of Electrodeposited Copper for Dynamic Flex Applications”, Insight, pp. 34-37, 2001.
7. Douta K., Miyaake C., Miyake K., “Development of Flexible Printed Circuit Boards using Fatigue Life Prediction”, Nitto Denko Technical Report, vol . 39 , no. 1 , 2001.
8. Martynenko E., Zhou W., Chudnovsky A., Li R., Poglitsch L., “High Cycle Fatigue Resistance and Reliability Assessment of Flexible Printed Circuitry”, Journal Of Electronic Packaging, vol. 124, pp. 254-260, 2002.
9. Zehnder A., Swenson D., Pienkos T., “Polymer Reinforcements for Retarding Fatigue Crack Growth in Metals”, International Journal of Fracture, vol. 84, pp. 307–323, 1997.
10. N. E. Dowling, Mechanical Behavior of Materials: Engineering Methods for Deformation, Fracture, and Fatigue (2nd Edition), Prentice-Hall, NJ, 1999.
11. OPTIMUS 5.1 Documentation - Version 1.0, Noesis Solutions NV, 2005.
View publication statsView publication stats


![[PPT]How to Design Printed Circuits Boards - University of ... · Web viewTitle How to Design Printed Circuits Boards Last modified by Robert Kressin Document presentation format](https://img.dokumen.tips/doc/110x75/5b0803ca7f8b9af0438baab7/ppthow-to-design-printed-circuits-boards-university-of-viewtitle-how-to.jpg)