Embed Size (px)
Citation preview

Delft University of Technology
A review of the fatigue behavior of 3D printed polymers
Safai, Lauren; Cuellar Lopez, Juan; Smit, Gerwin; Zadpoor, Amir A.
DOI10.1016/j.addma.2019.03.023Publication date2019Document VersionFinal published versionPublished inAdditive Manufacturing
Citation (APA)Safai, L., Cuellar Lopez, J., Smit, G., & Zadpoor, A. A. (2019). A review of the fatigue behavior of 3D printedpolymers. Additive Manufacturing , 28, 87-97. https://doi.org/10.1016/j.addma.2019.03.023
Important noteTo cite this publication, please use the final published version (if applicable).Please check the document version above.
CopyrightOther than for strictly personal use, it is not permitted to download, forward or distribute the text or part of it, without the consentof the author(s) and/or copyright holder(s), unless the work is under an open content license such as Creative Commons.
Takedown policyPlease contact us and provide details if you believe this document breaches copyrights.We will remove access to the work immediately and investigate your claim.
This work is downloaded from Delft University of Technology.For technical reasons the number of authors shown on this cover page is limited to a maximum of 10.

Green Open Access added to TU Delft Institutional Repository
'You share, we take care!' - Taverne project
https://www.openaccess.nl/en/you-share-we-take-care
Otherwise as indicated in the copyright section: the publisher is the copyright holder of this work and the author uses the Dutch legislation to make this work public.
Contents lists available at ScienceDirect
Additive Manufacturing
journal homepage: www.elsevier.com/locate/addma
A review of the fatigue behavior of 3D printed polymers
Lauren Safai⁎, Juan Sebastian Cuellar, Gerwin Smit, Amir A. ZadpoorDepartment of Biomechanical Engineering, Faculty of Mechanical, Maritime and Materials Engineering, Delft University of Technology, Mekelweg 2, Delft, 2628CD, theNetherlands
A R T I C L E I N F O
Keywords:3D printingPolymersMechanical behaviorCyclic loadingFatigue fracture
A B S T R A C T
As additive manufacturing of polymeric materials is becoming more prevalent throughout industry and researchcommunities, it is important to ensure that 3D printed parts are able to withstand mechanical and environmentalstresses that occur when in use, including the sub-critical cyclic loads that could result in fatigue crack propa-gation and material failure. There has so far been only limited research on the fatigue behavior of 3D printedpolymers to determine which printing or material parameters result in the most favorable fatigue behavior. Tobetter understand the effects of the printing technique, printing materials, and printing parameters on the fatiguebehavior of 3D printed materials, we present here an overview of the data currently available in the literatureincluding fatigue testing protocols and a quantitative analysis of the available fatigue data per type of the AMtechnology. The results of our literature review clearly show that, due to the synergism between printingparameters and the properties of the printed material, it is challenging to determine the best combination ofvariables for fatigue resistance. There is therefore a need for more experimental and computational fatiguestudies to understand how the above-mentioned material and printing parameters affect the fatigue behavior.
1. Introduction
The use of additive manufacturing (AM), or 3D printing, has beenincreasing due to the growing interest from both industry and researchcommunities [1]. As additive manufacturing technology improves, highquality prints can be produced quickly and inexpensively. With a widerrange of polymer materials available, the development and fabricationof products are continuously changing with technological advancementand consumer use [1]. Innovators and inventors are now able to buildprototypes or complex geometries efficiently at minimal costs with thereduction of production time from weeks to hours [2]. As a result ofthese improvements in AM, various industries such as biomedical[3–10], aerospace [11], apparel [12,13], dentistry [14], automotive[15], electronics [2,16], and oceanography [17] are researching thistechnique to produce parts.
As additive manufacturing becomes more widely used, parts mustwithstand both mechanical and environmental stresses that occurduring use. Understanding the required strengths for specific loadingconditions is vital for any load-bearing applications [18,19]. Since amaterial may fail due to fatigue conditions, it is also important to un-derstand a material’s resistance to cyclic loading and unloading [20].Repetitive sub-critical loading of material may result in fatigue damage,i.e. a progressive accumulation and permanent structural change,
which could lead to cracking or rupturing of the part after a certainnumber of cycles. Polymers are susceptible to fatigue at applied stressesbelow yield, which can cause microcracking and eventual failure [21].Understanding the fatigue behavior of AM parts is therefore essentialfor predicting and preventing fatigue failure.
This paper will review current literature investigating the fatiguelife of 3D printed polymers (Appendix A). The aim is to see if there aretrends between experiments that provide insight into which printingparameters and material properties lead to the best fatigue life for 3Dprinted polymers.
2. Fatigue
As previously mentioned, fatigue is the development of structuraldamage as a result of repetitive loads (i.e. cyclic loading) that are lessthan ultimate tensile strength and possibly yield strength. Fatiguefailure in polymers occurs in two ways [22,23]: (1) thermal failure dueto softening and melting from hysteretic heating, or (2) mechanicalfailure from crack initiation and propagation. As a result of highdamping, viscoelasticity, and low thermal conductivity, high fre-quencies or strain rates cause hysteretic heating in thermal fatigue[24,25]. The hysteretic energy is mainly dissipated as heat, whichcauses the specimen temperature to increase and the stiffness to
https://doi.org/10.1016/j.addma.2019.03.023Received 26 October 2018; Received in revised form 19 March 2019; Accepted 23 March 2019
⁎ Corresponding author.E-mail address: [email protected] (L. Safai).
Additive Manufacturing 28 (2019) 87–97
Available online 06 April 20192214-8604/ © 2019 Elsevier B.V. All rights reserved.
T
decrease. Stiffness loss causes an increase in specimen deflection anddeformation. From a macroscopic viewpoint, the process of fatiguefailure in polymers resembles that of metals [26,27]: it starts with in-itial microcracks on the surface or stress concentrator that grow intomacroscopic cracks and cause the final failure. Depending on the typeof polymer, the crack may originate in different ways. In semi-crystal-line polymers, for example, the crack is likely to initiate in spherulites.Once the crack growth enters the micro-structurally independent stage,the crack continues until the final rupture of the material [28,29].According to reference [30], thermal failure does not necessarily have acrack at failure, while mechanical failure is a result of physical se-paration.
3. Fatigue testing
3.1. Objectives of fatigue testing
There are several objectives when fatigue testing: material typetesting, structural type testing, and actual service type testing [31].Material testing investigates the material response to repeated stresses,various environments, geometrical factors, or surface finishes. Instructural testing, different materials or structural designs are tested toanalyze stress concentrations, fatigue life, or fabrication processes. Fi-nally, actual service type testing is used for reliability or quality ver-ification.
3.2. Types of fatigue testing
Fatigue testing machines are classified based on the applied stressmethod. For axial loading, a uniform stress or strain is directly appliedto the cross-section of the specimen in tension or compression. Thespecimen is held at both ends and loaded cyclically between minimumand maximum values. During repeated or reciprocating bending, oneend of the specimen is fixed while a stress or strain is applied to theother end such that the specimen bends in the same plane. In rotatingbending, the specimen is revolved at a constant frequency while a loadis applied at two clamping points on the either side of the specimen. Inevery rotational cycle, the stresses change from compressive to tensileand from tensile to compressive, making sure that the specimen ex-periences the full cycle of flexural stresses. For fracture mechanicaltesting, a notch is made in the specimen to examine fracture initiationand propagation during cyclic loading. In torsion fatigue, each end ofthe specimen is either clamped or twisted to specified values through astress or strain. Other types of fatigue tests include combined bendingand torsion fatigue and biaxial and triaxial fatigue, which are used inmore complicated fatigue analyses [31,32].
3.3. Stress amplitude in fatigue testing
The simplest stress sequence uses a constant stress amplitude whereall load cycles, or cycles, are identical (Fig. 1). For each cycle, σ is thealternating stress, σm is the mean stress, σmax is the maximum stress,and σmin is the minimum stress. Load cycles can be expressed as σm± σ,with compressive loads taken as negative. It follows that:
= +σ σ σmax m (1)
= −σ σ σmin m (2)
=+σ σ σ2m
min max(3)
For constant amplitude loading, the stress range, S, and stress ratio,R, are expressed as:
= = −S σ σ σ2 max min (4)
=R σσ
min
max (5)
Depending on stress level, constant amplitude loading can be clas-sified into several different testing categories [31]. Routine tests arechosen so the specimen fails at a moderate number of cycles (i.e. 104-107). In short-life tests, applied stress is chosen to surpass yield stress sostatistically some specimens fail at the application of the load, while inlong-life tests, load is set to be just above or below the fatigue limit sosome specimens do not fail after an assigned number of cycles. The aimof the long-life test is to examine the distribution of fatigue strength at apre-assigned cycle number, which is beneficial for determining the fa-tigue limit.
In contrast to constant amplitude loading, variable amplitudeloading (Fig. 2) has complicated loading sequences that are more rea-listic to what structures and components experience [28,31]. Variableloading is used for cumulative damage analysis or the simulation ofservice life. Cumulative damage testing is performed at several stresslevels with a simplified loading sequence, while service simulationshave a more complicated loading pattern [31].
3.4. Stressing sources
In fatigue testing, force-controlled or displacement-controlledmethods can be implemented, which is where a specific force or dis-placement is increased and decreased at a specified and controlled rate,respectively. Loads are produced by one of the following techniques:mechanical deflections, dead weights or constant springs, centrifugalforces, electromagnetic forces, hydraulic forces, or pneumatic forces.Load choice depends on factors such as frequency, control systems,required forces, costs, and simplifications of working loads [31].
3.5. Presentation of fatigue data
During fatigue testing, cyclic loads are applied with varied or con-stant stresses, which can be either positive or negative. A series of fa-tigue tests are conducted at several stress levels to create a stress-cycleplot or S-N curve, which is the conventional method of presenting fa-tigue behavior of polymers. Since current theories do not explain themechanical behavior of polymers, empirical methods have been appliedto analyze polymer fatigue [33]. S-N curves plot the stress enduredagainst the number of cycles until failure. By lowering the stress valueduring testing, a fatigue limit can be established with the S-N curve,which is a value that does not result in failure and is sometimes referredto as fatigue limit, endurance limit, or fatigue strength [28]. The fatiguelimit is affected by material surface conditions, such as roughness, da-mage, treatment, and residual stresses [28].
4. Fatigue testing machines and specimens
4.1. Components
Each fatigue-testing machine consists of the same basic structuralcomponents: (1) a load train that consists of a load-producing me-chanism to generate the desired load or displacement and a load-transmitting mechanism to produce the desired stress distribution; (2)controllers to set the upper and lower load limits and maintain the loadthroughout the test; (3) a counting and shut-off apparatus to stop themachine after failure or the pre-assigned number of cycles; and (4) aframework to support all of the necessary parts and reduce vibrations inthe system [31,32].
4.2. Specimens
Fatigue test specimens typically have three sections, including twogrip ends and the test section [32]. The grips of the specimen are de-signed to transfer load from the test machine to the test section, and,depending on the test, may not be identical. Transitions between thegrips and test section are designed with large radii so no stress
L. Safai, et al. Additive Manufacturing 28 (2019) 87–97
88

concentrations build-up. The desired type of test and the objectivesaffect the design of the fatigue test specimen. Several fatigue test spe-cimens are shown in Fig. 3.
5. Fatigue testing of 3d printed polymers
5.1. Factors affecting fatigue characterization
Fatigue testing in 3D printed specimens is challenging due to the
anisotropic properties and residual stresses that result from layer de-position [19]. Different variables associated with each type of printingtechnique affect the mechanical characterization of the specimens. Thevariables for extrusion-based printing include: raster orientation, buildorientation, layer height and bead width, and air gap between filaments[19,34–37]. The mechanical properties of powder bed fusion-basedspecimens are affected by the laser power, scan length, layer height,build orientation, recycled powder content, powder bed temperature,and crystallization temperature [19,38]. Parts printed with materialjetting techniques are affected by the presence of additives, unknownmanufacturer resin formulations, printed on an over-cured surface, andthe physics and chemistry of polymer fusion [19]. Due to the synergismbetween these variables, fatigue is challenging to predict. All of thesevariables influence the microstructure of the part that, in turn, maysignificantly affect the mechanical behavior and failure mechanism.There was no literature regarding the fatigue testing of polymers fab-ricated using other categories of 3D printing techniques.
5.2. Standardization of fatigue testing
The American Society for Testing and Materials (ASTM) and theInternational Standards Organization (ISO) are two institutes that ad-dress the standardization of mechanical testing of AM specimens [19].Currently, there is limited standardization in terms of the fatigue testingof 3D printed polymers.
With no ISO equivalent, the ASTM D7774 standard addresses uni-axial fatigue in tension or compression [39]. While it is recommended
Fig. 1. Nomenclature that describes testing parameters in constant amplitude loading.
Fig. 2. An example of a general variable amplitude loading.
Fig. 3. Four examples of fatigue testing specimens that include A) an axial loading specimen, B) a rotating bending specimen, C) a reverse bending specimen, and D) afracture mechanical test specimen.
L. Safai, et al. Additive Manufacturing 28 (2019) 87–97
89

to test below a frequency of 5 Hz to reduce heat generation, specimenscan be cycled between 1–25 Hz. The fatigue limit is defined when thespecimen fails or reaches 107 cycles. Stress or strain is applied so thematerial does not experience plastic behavior. In addition to the pre-vious standard, ASTM D3479 investigates tension fatigue for polymermatrix composites for specific loading and environmental conditions[40].
Two standards, ASTM D7791 and ISO 13003, address flexural fa-tigue in plastics [41,42]. Both standards have sinusoidal loading, butare technically different. ASTM D7791 tests specimens using three- orfour-point bending, while ISO 13003 is applicable to all testingmethods. For ASTM D7791, cyclic loading alternates between positiveand negative values so that R is -1 and the stress or strain remainswithin the elastic limit. The fatigue limit is characterized in the samefashion as the previous standard. In ISO 13003, fiber-reinforced plasticcomposites undergo cyclic loading at a constant amplitude and fre-quency at four different stress or strain levels. For displacement control,the termination of the test is characterized as reaching the cycle limit orthe specimen stiffness is reduced by 20%.
There are two standards, ASTM D6115 and ISO 15850, that addresscrack propagation (fatigue delamination) in the interlaminar region of afiber composite [43,44]. Since both standards are defined specificallyfor composites, it is unclear if 3D printed materials would fulfill thesupporting assumptions. Finally, in order to perform statistical analysesof fatigue data, the standard ASTM E739 can be used [45].
6. Analysis of fatigue experiments
This section reviews the literature associated with the fatiguetesting of 3D printed polymers, namely those printed using extrusion-based printing, selective laser sintering, and material jetting (e.g.,polyjet printing). The topics of interest include the effects of printingparameters, material properties, production methods, and geometricconsiderations on the fatigue life. Tables 1–3, following each section,summarize the experiments of each study and the conclusions drawnabout fatigue life.
6.1. Extrusion-based printing
6.1.1. Axial loading fatigueVarious printing parameters, such as raster orientation, printing
orientation, layer thickness, and feed rate, have been found to influencefatigue life of 3D printed parts. In several studies conducted by Ziemianet al., the effects of raster orientation were examined when printingwith acrylonitrile butadiene styrene (ABS) [46–48]. In the first study[46], rectangular prism specimens (190×12.7×2.6 mm3) were
printed with four raster orientations of 0° (Fig. 4A), 45° (Fig. 4C), 90°(Fig. 4B), and 45°/45° (Fig. 4D). The results indicated that the 45°/45°raster orientation has the best fatigue life. In the subsequent studies[47,48], ASTM D638 dog bone specimens were printed with raster or-ientations of 0° (Fig. 4A), 45° (Fig. 4C), 90° (Fig. 4B), 45°/45° (Fig. 4D),30°/60°, 15°/75°, and 0°/90° (for conventions used in defining rasterorientations, see Fig. 4) [49]. In accordance with the first study, the45°/45° raster orientation exhibited the best performance (Fig. 6).
Both [50] and [51] investigated the effects of raster orientation, butin polylactic acid (PLA) specimens according to references [41] and[49], respectively. Three raster orientations of 0° (Fig. 4A), 45°(Fig. 4C), and 90° (for conventions used in defining raster orientations,see Fig. 4) (Fig. 4B) were cyclically loaded at 2 Hz in [50] and 1 Hz inreference [51]. Both studies had similar results, where the 45° or-ientation had the best fatigue life. In a different study [52], the effectsof printing orientation on fatigue life in ABS and ABSplus specimens[53] were investigated. Nine specimens were printed in varying direc-tions, where each print orientation dictated the raster orientation usedby the printer (Fig. 5). It was found that printing the specimen in theFlat-x (Fig. 5) direction had the best fatigue life. In Fig. 6, the S-Ncurves for the best results from [47,50–52] are presented. From thecurves, it can be concluded that ABSplus had better fatigue resistancethan ABS since, at each stress level, the ABSplus material had a largernumber of cycles. Comparing ABS and PLA, it was inconclusive whichmaterial had the better fatigue life, since the PLA and ABS curves be-tween studies provided conflicting results. Finally, in a cumulativestudy, reference [54] explored which printing parameter (layer thick-ness, extruder width, print orientation, feed rate) has the most influenceon the fatigue life. Rectangular prisms (150× 20×3mm) of ABS weretested with 0.2 or 0.3 mm layer thickness, 0.35 or 0.45mm extruderwidth, Flat-x or Flat-y (Fig. 5) print orientation, and 2000 or 4000mm/min feed rate. It was found that printing in the Flat-x direction andusing a smaller layer height resulted in the best fatigue life. For feedrate and extruder width, while it appeared that smaller values resultedin better fatigue life, neither parameter had a significant impact onfatigue life. Printing parameters were found to have a substantial im-pact on the fatigue life in polymers.
Material properties and production methods, such as fabricationwith injection molding or 3D printing and surface treatments, wereinvestigated to see how fatigue life was affected. Both [55] and [56]studied and compared the fatigue lives of injection molded and 3Dprinted specimens [49] of ABS and polycarbonate urethane (75 A, 85 A,and 95 A), respectively. In conflicting results [55], found that the 3Dprinted specimens had worse fatigue life, while [56] found that 3Dprinted parts had a better fatigue life (Fig. 7 and 8). From Figs. 7 and 8,it can be seen that the ABS injected molded specimens had the best
Table 1A summary of fatigue testing parameters and results from the studies that used extrusion-based printing.
Testing Method Material Specimen Geometry Results Study
Tension-tension fatigue ABS Rectilinear Box The 45°/45° fiber orientation had the best fatigue life Ziemian et al. (2012)Tension-tension fatigue ABS Dog Bone The 45°/45° fiber orientation had the best fatigue life Ziemian et al. (2015)Tension-tension fatigue ABS Dog Bone The 45°/45° fiber orientation had the best fatigue life Ziemian et al. (2016)Tension-tension fatigue PLA Dog Bone Flat printing orientation at 45° had the best fatigue life Afrose et al. (2015)Tension-compression fatigue PLA Dog Bone Flat printing orientation at 45° had the best fatigue endurance
limitLetcher and Waytashek(2014)
Tension-relaxation fatigue ABS Dog Bone Flat printing orientation in X had the best fatigue life Lee and Huang (2013)Tension-tension fatigue ABS Rectilinear Box Print orientation, layer thickness, and feed rate influenced
fatigue life the mostCorbett et al. (2014)
Tension-tension fatigue ABS Dog Bone 3D-printed parts had worse fatigue life than injection molding Padzi et al. (2017)Tension-relaxation fatigue Polycarbonate Urethane Dog Bone 3D-printed parts had better fatigue life than injection molding Miller et al. (2017a)Tension-tension fatigue Ultem 9085 Dog Bone Surface treatment did not affect fatigue life Fischer and Volker (2016)Tension-relaxation fatigue Polyurethane Rectilinear Box Circular pores had the best fatigue life Miller et al. (2017b)Compression Fatigue PLA Rectilinear Box Circular pores had the best fatigue life Gong et al. (2017)Rotating Bending Fatigue PLA Hourglass Fill density and layer height influenced fatigue life the most Gomez-Gras et al. (2018)Rotating Bending Fatigue ABS Hourglass Cycling at higher stresses led to worse fatigue life Zhang et al. (2017)Fracture Mechanical Fatigue PLA Compact Tension The 0°/90° fiber orientation had the best fatigue life Arbeiter et al. (2018)
L. Safai, et al. Additive Manufacturing 28 (2019) 87–97
90

fatigue life, but the injection molded polycarbonate specimens had aslightly worse fatigue life when compared with their 3D printedcounterparts. In the case of polycarbonate urethane, the authors arguedthat the high temperature and cooling process of the 3D printing pro-cess may have affected the internal structures of the samples, therebyincreasing its capacity to experience strain crystallization. This wouldlead to less strain hardening effects and could explain the small im-provements in the fatigue behavior of 3D printed specimens. Overall, itwas unclear whether or not injection molding had better fatigue re-sistance than 3D printing, since each study drew a different conclusion.Overall, it was unclear whether or not injection molding had betterfatigue resistance than 3D printing, since each study drew a differentconclusion. Aside from comparing injection molding and 3D printing,reference [57] examined the differences in chemically post-treated andnon-treated specimens from the commercially available polymer Ultem9085. Ultem 9085 is manufactured by Stratasys, and is a high-perfor-mance thermoplastic composed of a polyetherimide and polycarbonatecopolymer blend (Stratasys Ltd., Minnesota, USA). The results indicatedthat surface treatment did not have an effect on fatigue life.
Finally, the effects of topological design on the fatigue behavior of3D printed porous scaffolds have been investigated in a few studies. Inone of these studies [58], the effects of pore geometry and notch shapeon the fatigue life in polycarbonate urethane (95 A) and polyurethane68 A (EPU40) dog bone specimens was investigated, while anotherstudy [59] examined the effects of scaffold geometry in PLA. The testresults from [58] indicated that pore geometry influenced fatigue life,with circular pore geometry and a circular notch shape having the bestperformance. In accordance with [58,59,61], also found that poregeometry affected fatigue life with a greater influence at high cycles. Aswell, for a crosshatch pattern, line spacing had a negligible effect onfatigue life.
6.1.2. Rotating bending fatigueThe influence of four different printing parameters, i.e. layer height
(0.1, 0.2, 0.3mm), fill density (25, 50, 75%), nozzle diameter (0.3, 0.4,0.5 mm), and printing velocity (25, 30, 35mm/min), were examined in[60] for two different infill patterns, i.e. rectilinear and honeycomb, incylindrical, PLA test specimens. Fill density was found to have the mostimpact on fatigue life, while the effects of the layer height and nozzlediameter were dependent on the infill pattern, and velocity did not havea significant impact on fatigue. According to the authors, certain valuesof the layer height and nozzle diameter lead to an insufficient cohesionbetween layers, resulting in a reduced fatigue life. The influence ofdensity was not linear between the three values, with the jump from 50to 75% density having a larger impact. The best combination of para-meters was 75% density, 0.5mm nozzle diameter, 0.3 mm layer height,and a honeycomb infill.
Reference [61] examined the mechanical properties of how cy-lindrical ABS specimens failed during fatigue testing. Each test spe-cimen broke at the smallest cross section with both static and fatiguefractures. As stress was increased, the amount of static fatigue also in-creased.
ABS had better a fatigue life as compared with PLA in rotatingbending fatigue (Fig. 9), since at higher stress levels, the ABS specimenswere able to last for a larger number of cycles.
6.1.3. Fracture mechanical fatigueIn reference [62], the effects of raster orientation on fatigue life in
PLA compact tension specimens were examined. The specimens wereprinted in three different orientations with 0° (Fig. 4A), 90° (Fig. 4B),and 0°/90° (for conventions used in defining raster orientations, seeFig. 4). The study concluded that raster orientation did not affect fa-tigue life, and that the fatigue behavior was dominated by crack pro-pagation at high loads, and crack initiation at low loads.
Table 2A summary of fatigue testing parameters and results from the studies that used selective laser sintering.
Testing Method Material Specimen Geometry Results Study
Tension-compression fatigue PA12 Hourglass Orientation did not affect fatigue life, but notched specimensperformed better than un-notched
Hooreweder and Kruth(2014)
Tension-tension fatigue PA12 Dog Bone Density and surface roughness did not affect fatigue life Amel et al. (2014)Tension-compression fatigueTension-compression fatigue PA12 Hourglass Lower density samples led to more crack initiation Hooreweder et al. (2010)Tension-compression fatigue PA12 Hourglass 3D-printed specimens had similar fatigue life to injection molded
samplesHooreweder et al. (2013)
Tension-tension fatigue PA12 Dog Bone Fatigue life increased with section thickness, and larger sectionthicknesses depended on density
Amel et al. (2016)Tension-compression fatigueRotating Bending Fatigue PA12 Hourglass Specimens had an endurance limit of 15MPa Munguia and Dalgarno
(2014)Rotating Bending Fatigue PA12 Hourglass Specimens showed isotropic material behavior Munguia and Dalgarno
(2015)Bending Fatigue PCL Rectilinear Box Smaller particles with a higher degree of sintering had better fatigue
lifeSalmoria et al. (2014)
Bending Fatigue PA6/PA12 Rectilinear Box There was poor affinity between PA6 and PA12 Salmoria et al. (2012)Bending Fatigue PA12/PBT Rectilinear Box The 90%/10% blend of PA12/PBT had the best fatigue life Salmoria et al. (2018)Fracture Mechanical Fatigue PA12 Compact Tension 3D-printed specimens had a longer fatigue life than injection molded Blattmeier et al. (2012)Fracture Mechanical Fatigue Neat PA12 and
PA12-fRectilinear Box PA12-f had better fatigue life at lower temperatures Salazar et al. (2014a)
Fracture Mechanical Fatigue PA12 and PA11 Rectilinear Box Independent of environment and temperature, PA11 had betterfatigue life than PA12
Salazar et al. (2014b)
Table 3A summary of fatigue testing parameters and results from the studies that used material jetting.
Testing Method Material Specimen Geometry Results Study
Tension-tension fatigue Veroclear 720 Dog Bone Build orientation affected fatigue life Suresh et al. (2017)Tension-relaxation fatigue TangoBlackPlus Dog Bone Interface specimens had a higher fatigue life than no interface Moore and Williams (2012)Tension-relaxation fatigue TangoBlackPlus Dog Bone “Glossy” finish specimens had a longer fatigue life than matte finish Moore and Williams (2015)
L. Safai, et al. Additive Manufacturing 28 (2019) 87–97
91
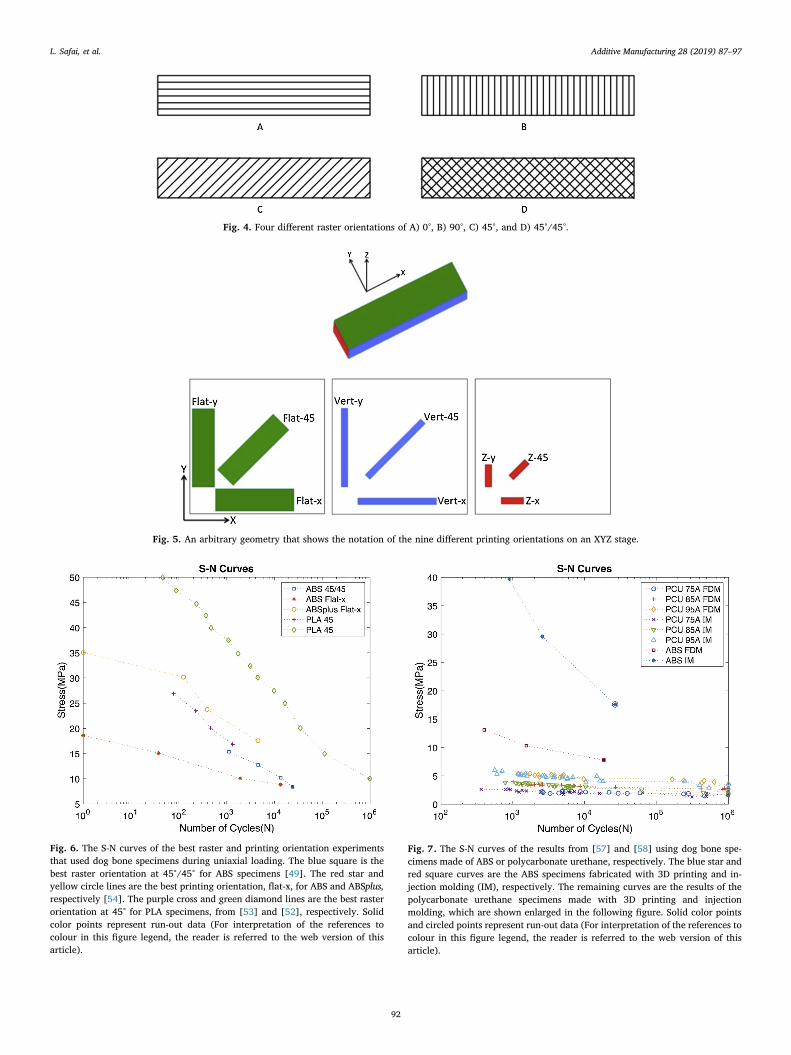
Fig. 4. Four different raster orientations of A) 0°, B) 90°, C) 45°, and D) 45°/45°.
Fig. 5. An arbitrary geometry that shows the notation of the nine different printing orientations on an XYZ stage.
Fig. 6. The S-N curves of the best raster and printing orientation experimentsthat used dog bone specimens during uniaxial loading. The blue square is thebest raster orientation at 45°/45° for ABS specimens [49]. The red star andyellow circle lines are the best printing orientation, flat-x, for ABS and ABSplus,respectively [54]. The purple cross and green diamond lines are the best rasterorientation at 45° for PLA specimens, from [53] and [52], respectively. Solidcolor points represent run-out data (For interpretation of the references tocolour in this figure legend, the reader is referred to the web version of thisarticle).
Fig. 7. The S-N curves of the results from [57] and [58] using dog bone spe-cimens made of ABS or polycarbonate urethane, respectively. The blue star andred square curves are the ABS specimens fabricated with 3D printing and in-jection molding (IM), respectively. The remaining curves are the results of thepolycarbonate urethane specimens made with 3D printing and injectionmolding, which are shown enlarged in the following figure. Solid color pointsand circled points represent run-out data (For interpretation of the references tocolour in this figure legend, the reader is referred to the web version of thisarticle).
L. Safai, et al. Additive Manufacturing 28 (2019) 87–97
92

6.2. Selective laser sintering
6.2.1. Axial loading fatigueSimilar to extrusion-based printing, printing parameters, such as
printing orientation, affect parts built using selective laser sintering. Inone study [63], the effects of printing orientation on notched and un-notched Nylon-12 (PA12) hourglass specimens [64] were investigated.The results indicated that orientation does not affect the fatigue life, butthat notched specimens had a longer fatigue life. This is a result of thereduced thermal load that the notched specimens experience, since a
smaller volume is subjected to cyclic loading.In addition to printing parameters, material properties, such as
density, surface roughness, and printing with injection molding or 3Dprinting, also influence fatigue life. Studies conducted by [65] and [66]investigated the effects of density on the fatigue life. According to re-ference [65], there is no relationship between the fatigue life anddensity or surface roughness in the dog bone Nylon-12 (PA12), sincedifferent samples provided contrasting behaviors. In order to verifywhether fabrication defects caused this, more testing was needed.However [66], concluded that lower density PA12 hourglass specimenshad a lower fatigue life (Fig. 10). As seen from the curve, there was apositive relationship between the density and fatigue life. Aside fromdensity, reference [67] studied the differences in the fatigue life be-tween notched and un-notched injection molded and 3D printed PA12parts [64], where the 3D printed parts were built in the Vert-x and Z-xdirections (Fig. 5). The results found that notched injection molded and3D printed parts had similar fatigue lives (Fig. 11). Moreover, therewere no substantial differences in the fatigue life of the specimensprinted in the Vert-x and Z-x directions when using SLS.
In [68], the effects of geometry on the fatigue life was investigatedby varying the section thickness (2, 4, and 6mm) in dog bone PA12specimens under tension-tension and tension-compression uniaxialloading. In both cases, the fatigue life increased with the sectionthickness, but these results were not statistically significant for tension-tension loading. This may be due to temperature increasing more insmaller section thicknesses than in larger thicknesses.
6.2.2. Rotating bending fatigueThe effects of printing orientation was investigated in references
[69] and [70] for PA12 hourglass specimens [71]. In reference [69], thespecimens were printed in the direction of the X and Z-axes (Fig. 5) andtested at two frequencies of 30 and 50 Hz. The results indicated thatprinting in the Z direction, though not significant, and testing at 50 Hzboth reduced fatigue life (Fig. 12). In reference [70], specimens forrotating bending [71] and reverse bending [72] were printed parallel tothe Y and Z-axes (Fig. 5). The results of both types of tests and or-ientations showed no significant differences, indicating isotropic be-havior from the specimens (Fig. 12). The curves seen in Fig. 12 includeboth printing orientations that were tested.
6.2.3. Bending fatigueIn [73], two printing parameters, namely laser energy density and
particle size, were varied to see their influence on the fatigue life of
Fig. 8. The S-N curves of the polycarbonate urethane 3D printed and injectionmolded (IM) specimens for [58]. The specimens were printed in three differenttypes of polycarbonate urethane, 75 A, 85 A, and 95 A. The blue circle, redcross, and yellow diamond are the curves of the 3D printed specimens madewith 75 A, 85 A, and 95 A, respectively. The purple cross, downward greentriangle, and upward blue triangle are the injection molded specimens made of75 A, 85 A, and 95 A, respectively. Solid color points and circled points re-present run-out data (For interpretation of the references to colour in this figurelegend, the reader is referred to the web version of this article).
Fig. 9. The S-N curves for the best combination of printing parameters from[62] for PLA hourglass and ABS hourglass specimens from [63]. The red starcurve represents the ABS specimen, while the blue square represents the PLAspecimen (For interpretation of the references to colour in this figure legend,the reader is referred to the web version of this article).
Fig. 10. The results of [68], indicating that as part density increases so does thenumber of cycles that the specimen is able to withstand.
L. Safai, et al. Additive Manufacturing 28 (2019) 87–97
93
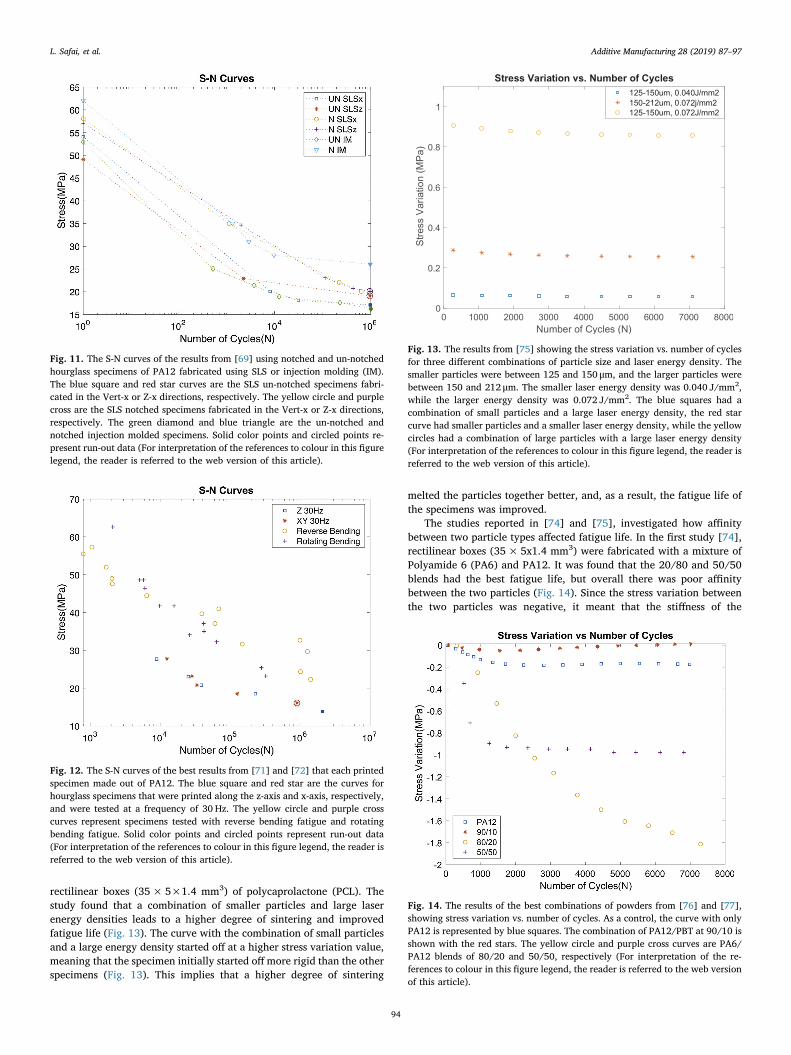
rectilinear boxes (35× 5×1.4 mm3) of polycaprolactone (PCL). Thestudy found that a combination of smaller particles and large laserenergy densities leads to a higher degree of sintering and improvedfatigue life (Fig. 13). The curve with the combination of small particlesand a large energy density started off at a higher stress variation value,meaning that the specimen initially started offmore rigid than the otherspecimens (Fig. 13). This implies that a higher degree of sintering
melted the particles together better, and, as a result, the fatigue life ofthe specimens was improved.
The studies reported in [74] and [75], investigated how affinitybetween two particle types affected fatigue life. In the first study [74],rectilinear boxes (35×5x1.4 mm3) were fabricated with a mixture ofPolyamide 6 (PA6) and PA12. It was found that the 20/80 and 50/50blends had the best fatigue life, but overall there was poor affinitybetween the two particles (Fig. 14). Since the stress variation betweenthe two particles was negative, it meant that the stiffness of the
Fig. 11. The S-N curves of the results from [69] using notched and un-notchedhourglass specimens of PA12 fabricated using SLS or injection molding (IM).The blue square and red star curves are the SLS un-notched specimens fabri-cated in the Vert-x or Z-x directions, respectively. The yellow circle and purplecross are the SLS notched specimens fabricated in the Vert-x or Z-x directions,respectively. The green diamond and blue triangle are the un-notched andnotched injection molded specimens. Solid color points and circled points re-present run-out data (For interpretation of the references to colour in this figurelegend, the reader is referred to the web version of this article).
Fig. 12. The S-N curves of the best results from [71] and [72] that each printedspecimen made out of PA12. The blue square and red star are the curves forhourglass specimens that were printed along the z-axis and x-axis, respectively,and were tested at a frequency of 30 Hz. The yellow circle and purple crosscurves represent specimens tested with reverse bending fatigue and rotatingbending fatigue. Solid color points and circled points represent run-out data(For interpretation of the references to colour in this figure legend, the reader isreferred to the web version of this article).
Fig. 13. The results from [75] showing the stress variation vs. number of cyclesfor three different combinations of particle size and laser energy density. Thesmaller particles were between 125 and 150 μm, and the larger particles werebetween 150 and 212 μm. The smaller laser energy density was 0.040 J/mm2,while the larger energy density was 0.072 J/mm2. The blue squares had acombination of small particles and a large laser energy density, the red starcurve had smaller particles and a smaller laser energy density, while the yellowcircles had a combination of large particles with a large laser energy density(For interpretation of the references to colour in this figure legend, the reader isreferred to the web version of this article).
Fig. 14. The results of the best combinations of powders from [76] and [77],showing stress variation vs. number of cycles. As a control, the curve with onlyPA12 is represented by blue squares. The combination of PA12/PBT at 90/10 isshown with the red stars. The yellow circle and purple cross curves are PA6/PA12 blends of 80/20 and 50/50, respectively (For interpretation of the re-ferences to colour in this figure legend, the reader is referred to the web versionof this article).
L. Safai, et al. Additive Manufacturing 28 (2019) 87–97
94
specimen was decreasing, leading to a poor fatigue life (Fig. 14). Si-milarly, [75] fabricated rectilinear boxes of PA12 and BASF poly-butylene terephthalate (PBT). The blend of 90/10 had the best fatiguelife (Fig. 14). The stress variation in the 90/10 blend stayed relativelyconstant, meaning that the specimen was neither hardening or soft-ening under cyclic loading.
6.2.4. Fracture mechanical fatigueSeveral studies investigated how different material properties af-
fected fracture fatigue life by comparing 3D printed and injection-molded specimens, varying materials, and changing environments. In[76], compact tension specimens [77] made of PA12 were built with 3Dprinting and injection molding. The results found that the SLS parts hadlonger fatigue lives, with less deformation. In [78], compact tensionspecimens (50×48×10 mm3), made of neat PA12 (PA12) and shortglass fiber PA12 (PA12-f), were tested in a dry environment at 23 °C and-50 °C. At 23 °C, both materials had similar fatigue lives, but PA12-f hadgreatly improved fatigue life at -50 °C. In [79], compact tension speci-mens (50× 48×10 mm3) were fabricated of PA12 and PA11, a bio-based polymer, and tested in a dry environment at 23 °C, a dry en-vironment at 50 °C, and a wet environment at 23 °C. Independent of thetemperature and environment, PA11 showed improved fatigue crackpropagation. Testing in water significantly reduced the fatigue life forboth samples.
6.3. Material jetting
6.3.1. Axial loading fatigueIn one study, [80], the effects of build orientation were investigated
in parts printed with a material jetting printer. Veroclear 720 dog bonespecimens [41] were fabricated parallel to the X and Y-axes (Fig. 5),and cycled at 20 Hz. Veroclear 720 is a translucent, rigid acrylic-basedphotopolymer produced by Stratasys. The specimens that were fabri-cated parallel to the Y-axis (Fig. 5) had better fatigue resistance, butmore experimentation was required to have statistical validity.
Material properties, such as material interfaces and surface treat-ments, were investigated to see how they affect the fatigue life. In twostudies reported in [81] and [82], dog bone specimens [83] were fab-ricated using TangoBlackPlus and VeroWhitePlus. The first study [81],examined the effects of no interface, a single interface, and a dual in-terface on the fatigue life. TangoBlackPlus is an elastomeric acrylic-based photopolymer fabricated by Stratasys. The results of the studyindicated that interface specimens do not have a shorter fatigue life ascompared with the pure material itself. In a continuation study [82],dual interface specimens were used to see how surface finish affects thefatigue life. It was found that smoother, “glossy” finish specimens had alonger fatigue life as compared to matte finish, though not statisticallysignificant.
7. Discussion
7.1. Extrusion-based printing
Throughout the literature for fatigue of extrusion-based printing, itappeared that printing and material parameters all affect the fatigue lifeof specimens. Focusing on printing parameters, it was found that theraster orientation had the most influence on the fatigue life. All of thestudies investigating raster orientation concurred that printing at 0°(Fig. 4A) or 90° (Fig. 4B) resulted in the worst fatigue life than printingat 45° (Fig. 4C) or 45/45° (Fig. 4D). One possibility as to why 45/45°had the best fatigue life is that in uniaxial loading shear tends to occurat an angle of 45°, but during loading it is constantly counteracted bythe -45° configuration [47]. This development could delay or prevent acrack from fully propagating through the material. Another possibilityis that as the specimens are cyclically loaded, the 45/45° configurationstart to rotate into a 0/90° orientation, resulting in the structure being
better aligned with the loading direction so strand strength becomesmore prevalent [47]. Aside from raster orientation, other parameterssuch as the printing orientation, layer height, and infill all influence thefatigue life. Printing orientation determines the stress-carrying direc-tion, layer height affects the cohesion between the layers, and infillaffects the stiffness and density of the part, all of which impact how thematerial behaves during fatigue testing [60]. Due to the synergy be-tween all of the parameters, it was challenging to characterize the bestsettings for maximizing the fatigue life. While the general consensusbetween studies was that printing with 45/45° (Fig. 4D) results in thebest fatigue life, the best settings for the remainder of the printingparameters remain inconclusive.
The material parameters did not seem to have as substantial of aninfluence as the printing parameters due to the inconclusive nature ofthe results. Examining whether or not injection molding or 3D printedparts had better fatigue life yielded two conflicting results. This may bedue to the differing printing parameters chosen by each study, wherechanging printing parameters could generate a different outcome.Looking at the chosen materials throughout the literature seemed to beinconclusive as to whether ABS or PLA had the best fatigue resistance.This can be seen in Figs. 6,7, and 9, in which ABS specimens typicallyhad the longest fatigue life, but there were also instances where PLA hasthe best fatigue resistance. This fluctuation in which material is bettermay be due to the different printing parameters each test has used,which affect the mechanical behavior of the specimen.
7.2. Selective laser sintering
As with extrusion-based printing, both printing parameters andmaterial properties impacted the fatigue life of SLS parts. Looking at theprinting parameters, several studies concluded that the printing or-ientation did not affect the fatigue life, since there was as an isotropicmaterial response. This can been seen in Figs. 11 and 12. This isotropicresponse may be due to the localized heating and deformation thatcause a uniform microstructure at the eventual fracture site through insitu drawing and/or an annealing process [70]. Another printingparameter that affects fatigue is the laser energy density, which wastested in [73]. Laser energy density affects the mechanical properties,such as porosity and microstructure, of parts built using SLS. As thelaser energy density is increased, the degree of sintering increases,which leads to a denser morphology in parts.
Unlike extrusion-based printing, the material properties seemed tohave a larger impact on fatigue life of SLS polymers. Throughout theliterature, there seemed to be a consensus in SLS parts that an increasein the density leads to better fatigue resistance. This can be seen inFigs. 10 and 13. The density of the SLS parts influences the mechanicalproperties, and at lower densities, with more unfused powder particles,there is a higher chance of crack initiation [66]. Looking at the dif-ferences in the injection molded and 3D printed parts did not lead to adefinitive conclusion of one method being better than the other, as seenin Fig. 11. The fatigue lives of both parts were found to be similar, withneither one having significantly better fatigue resistance. The affinity oftwo powders was essential to the success of the part. As can be seen inFig. 14, when there is poor affinity between powders, the part begins tolose stiffness and fail sooner. Finally, the majority of the studies usedPA12 due to its desirable mechanical properties. It is interesting to notethat the PA12/PBT blend of 90/10 had a higher fatigue strength thanpure PA12 due to the addition of 10% PBT, which leads to an increasein stiffness and resistance to plastic deformation.
7.3. Material jetting
Due to the limited number of studies on material jetting, only ma-terial properties were investigated. As previously mentioned, the stu-dies found that interface specimens did not have shorter fatigue lives ascompared with no interface specimens, and that although the ‘glossy’
L. Safai, et al. Additive Manufacturing 28 (2019) 87–97
95

surface had better fatigue resistance, it was not statistically relevant.This might be due to the lower roughness of the glossy surface ascompared to the matt surface [84]. A lower roughness decreases thepotential sites of crack initiation [86].
7.4. General remarks
As is clear from the previous chapters, there is no clear answer as towhich 3D printing technique or set of printing parameters results inparts that are optimized for maximum fatigue performance. Many of therelevant parameters strongly depend on the 3D printing process and thepolymer used. For every polymer, a set of specimens fabricated withdifferent processing parameters should be tested for fatigue followingexperimental design techniques such as Taguchi that allow for frac-tional factorial designs [84]. Other optimization processes include thefull factorial, gray relational, artificial neural network (ANN), fuzzylogic, genetic algorithm (GA), and response surface methodology (RSM)and have been used for different outputs like part strength, surfacequality, dimension accuracy, etc. [85]. Most of these techniques havenot been used for fatigue analyses but could also be considered. Theslicing algorithm used is another parameter that has not been in-vestigated thoroughly and could have a significant effect on the me-chanical properties of the resulting parts.
8. Conclusions
In this literature review, the aim was to interpret all of the papers tosee, whether there are trends in the data that could lead to conclusionsabout which printing parameters and material properties resulted in thebest fatigue life. For extrusion-based printing, it was found that printingwith a 45/45° raster orientation had the best fatigue life, while it wasinconclusive as to if ABS or PLA was the most fatigue resistant material.The synergy between all of the printing parameters such as printingorientation, raster orientation, layer height, and infill made it challen-ging to determine the best parameters. In selective laser sintering, theprinting orientation did not have an impact on the fatigue life of thespecimens, with the specimens showing isotropic behavior. Higherdensities in the parts also led to better fatigue resistance. In both ex-trusion-based printing and selective laser sintering, there was not en-ough information to determine if 3D printing yielded better fatigueresults as compared with injection molding. Due to the lack of testing ofparts made by material jetting, no conclusions could be made. Whilesome conclusions about the influence of the printing parameters andmaterial properties were made, there still is a need for more fatiguetesting of 3D printed polymers. Understanding the mechanical proper-ties of 3D printed polymers could aid in predicting and preventing fa-tigue failure.
References
[1] J.R.C. Dizon, A.H. Espera, Q.Y. Chen, R.C. Advincula, Mechanical characterizationof 3D-printed polymers, Addit. Manuf. 20 (2018) 44–67.
[2] E. Macdonald, R. Salas, D. Espalin, M. Perez, E. Aguilera, D. Muse, R.B. Wicker, 3Dprinting for the rapid prototyping of structural electronics, IEEE Access 2 (2014)234–242.
[3] S.E. Bakarich, R. Gorkin, M.I.H. Panhuis, G.M. Spinks, Three-dimensional printingFiber reinforced hydrogel composites, Acs. Appl. Mater. Interfaces 6 (18) (2014)15998–16006.
[4] J.L. Ifkovits, J.A. Burdick, Review: photopolymerizable and degradable biomater-ials for tissue engineering applications, Tissue Eng. 13 (10) (2007) 2369–2385.
[5] S.J. Kalita, S. Bose, H.L. Hosick, A. Bandyopadhyay, Development of controlledporosity polymer-ceramic composite scaffolds via fused deposition modeling,Mater. Sci. Eng. C-Bio. Sci. 23 (5) (2003) 611–620.
[6] F.P.W. Melchels, J. Feijen, D.W. Grijpma, A review on stereolithography and itsapplications in biomedical engineering, Biomaterials 31 (24) (2010) 6121–6130.
[7] V.B. Morris, S. Nimbalkar, M. Younesi, P. McClellan, O. Akkus, Mechanical prop-erties, Cytocompatibility and manufacturability of chitosan:PEGDA hybrid-gelscaffolds by stereolithography, Ann. Biomed. Eng. 45 (1) (2017) 286–296.
[8] S.V. Murphy, A. Atala, 3D bioprinting of tissues and organs, Nat. Biotechnol. 32 (8)(2014) 773–785.
[9] F. Rengier, A. Mehndiratta, H. von Tengg-Kobligk, C.M. Zechmann,R. Unterhinninghofen, H.U. Kauczor, F.L. Giesel, 3D printing based on imagingdata: review of medical applications, Int. J. Comput. Assist. Radiol. Surg. 5 (4)(2010) 335–341.
[10] G.H. Wu, S.H. Hsu, Review: polymeric-based 3D printing for tissue engineering (vol35, pg 285, 2015), J. Med. Biol. Eng. 36 (2) (2016) 284-284.
[11] R. Liu, Z. Wang, T. Sparks, F. Liou, J. Newkirk, Aerospace applications of laseradditive manufacturing, Woodh. Pub. Ser. Elect. (88) (2017) 351–371.
[12] R. Melnikova, A. Ehrmann, K. Finsterbusch, 3D printing of textile-based structuresby fused Deposition Modelling (FDM) with different polymer materials, Iop. Conf.Ser.-Mater. Sci. 62 (2014).
[13] R.H. Sanatgar, C. Campagne, V. Nierstrasz, Investigation of the adhesion propertiesof direct 3D printing of polymers and nanocomposites on textiles: effect of FDMprinting process parameters, Appl. Surf. Sci. 403 (2017) 551–563.
[14] J.W. Stansbury, M.J. Idacavage, 3D printing with polymers: challenges among ex-panding options and opportunities, Dent. Mater. 32 (1) (2016) 54–64.
[15] J.Y. Lee, J. An, C.K. Chua, Fundamentals and applications of 3D printing for novelmaterials, Appl. Mater. Today 7 (2017) 120–133.
[16] J.V. Crivello, E. Reichmanis, Photopolymer materials and processes for advancedtechnologies, Chem. Mater. 26 (1) (2014) 533–548.
[17] J.S. Mohammed, Applications of 3D printing technologies in oceanography,Methods Oceanogr. 17 (2016) 97–117.
[18] W. Gao, Y.B. Zhang, D. Ramanujan, K. Ramani, Y. Chen, C.B. Williams,C.C.L. Wang, Y.C. Shin, S. Zhang, P.D. Zavattieri, The status, challenges, and futureof additive manufacturing in engineering, J. Technol. Comput. Aided Des. Tcad 69(2015) 65–89.
[19] A.M. Forster, Materials Testing Standards for Additive Manufacturing of PolymerMaterials: State of the Art and Standards Applicability, US Department ofCommerce, National Institute of Standards and Technology, 2015.
[20] L. Pruitt, L. Bailey, Factors affecting near-threshold fatigue crack propagation be-havior of orthopedic grade ultra high molecular weight polyethylene, Polymer 39(8-9) (1998) 1545–1553.
[21] J.A. Sauer, M. Hara, Effect of molecular variables on crazing and fatigue of poly-mers, Crazing Polym. 2 (1990) 69–118.
[22] R.J. Crawford, P.P. Benham, Some fatigue characteristics of thermoplastics,Polymer 16 (12) (1975) 908–914.
[23] R.W. Hertzberg, R.P. Vinci, J.L. Hertzberg, Deformation and Fracture Mechanics ofEngineering Materials, Wiley, 2012.
[24] I. Constable, J.G. Williams, D.J. Burns, Fatigue and cyclic thermal softening ofthermoplastics, Arch. J. Mech. Eng. Sci. 12 (1) (1970) 20–29.
[25] R.J. Crawford, P.P. Benham, Cyclic stress fatigue and thermal softening failure of athermoplastic, J. Mater. Sci. 9 (1) (1974) 18–28.
[26] J.A. Sauer, G.C. Richardson, Fatigue of polymers, Int. J. Fract. Mech. 16 (6) (1980)499–532.
[27] M.T. Takemori, Polymer fatigue, Annu. Rev. Mater. Sci. 14 (1984) 171–204.[28] J. Schijve, Fatigue of structures and materials in the 20th century and the state of
the art, Int. J. Fatigue 25 (8) (2003) 679–702.[29] P. Chowdhury, H. Sehitoglu, Mechanisms of fatigue crack growth - a critical digest
of theoretical developments, Fatigue Fract. Eng. Mater. Struct. 39 (6) (2016)652–674.
[30] J.M. Schultz, Fatigue behavior of engineering polymers, Treat. Mater. Sci. Technol.10 (1977) 599–636.
[31] W. Weibull, Fatigue Testing and Analysis of Results Elsevier, (2013).[32] A.Sf. Metals, Atlas of Fatigue Curves, ASM International, 1985.[33] K.R. Chandran, Mechanical fatigue of polymers: a new approach to characterize the
SN behavior on the basis of macroscopic crack growth mechanism, Polymer 91(2016) 222–238.
[34] K.C. Ang, K.F. Leong, C.K. Chua, M. Chandrasekaran, Investigation of the me-chanical properties and porosity relationships in fused deposition modelling-fabri-cated porous structures, Rapid Prototyp. J. 12 (2) (2006) 100–105.
[35] A. Equbal, A.K. Sood, S.S. Mahapatra, Prediction of dimensional accuracy in fuseddeposition modelling: a fuzzy logic approach, Int. J. Product. Qual. Manag. 7 (1)(2010) 22–43.
[36] A.K. Sood, R.K. Ohdar, S.S. Mahapatra, Parametric appraisal of mechanical propertyof fused deposition modelling processed parts, Mater. Des. 31 (1) (2010) 287–295.
[37] A.K. Sood, R.K. Ohdar, S.S. Mahapatra, Experimental investigation and empiricalmodelling of FDM process for compressive strength improvement, J. Adv. Res. 3 (1)(2012) 81–90.
[38] H. Zarringhalam, N. Hopkinson, N.F. Kamperman, J.J. de Vlieger, Effects of pro-cessing on microstructure and properties of SLS Nylon 12, Mater. Sci. Eng. a-Struct.435 (2006) 172–180.
[39] ASTM, D7774-17 Standard Test Method for Flexural Fatigue Properties of Plastics,ASTM International West Conshohocken, PA, (2017).
[40] ASTM, D3479/D3479M-12 Standard Test Method for Tension-Tension Fatigue ofPolymer Matrix Composite Materials, ASTM International West Conshohocken, PA,(2012).
[41] ASTM, D7791-12 Standard Test Method for Uniaxial Fatigue Properties of Plastics,ASTM International, West Conshohocken, PA, (2017).
[42] ISO, 13003:2003 Fibre-reinforced Plastics – Determination of Fatigue PropertiesUnder Cyclic Loading Conditions, ISO, Switzerland, (2003).
[43] ASTM D6115-97(2011) Standard Test Method for Mode I Fatigue DelaminationGrowth Onset of Unidirectional Fiber-Reinforced Polymer Matrix Composites,ASTM International West Conshohocken, PA, 2011.
[44] ISO, 15850:2014 Plastics – Determination of tension-tension Fatigue CrackPropagation – Linear Elastic Fracture Mechanics (LEFM) Approach, ISO,Switzerland, (2014).
L. Safai, et al. Additive Manufacturing 28 (2019) 87–97
96

[45] ASTM, E739-10 Standard Practice for Statistical Analysis of Linear or LinearizedStress-Life (S-N) and Strain-Life (ε-N) Fatigue Data, ASTM International, WestConshohocken, PA, 2015.
[46] C.W. Ziemian, M. Sharma, S. Ziemian, Anisotropic mechanical properties of ABSparts fabricated by fused deposition modelling, Mech. Eng., InTech (2012).
[47] S. Ziemian, M. Okwara, C.W. Ziemian, Tensile and fatigue behavior of layered ac-rylonitrile butadiene styrene, Rapid Prototyp. J. 21 (3) (2015) 270–278.
[48] C.W. Ziemian, R.D. Ziemian, K.V. Haile, Characterization of stiffness degradationcaused by fatigue damage of additive manufactured parts, Mater. Des. 109 (2016)209–218.
[49] ASTM D638-10 Standard Test Method for Tensile Properties of Plastics, ASTMInternational West Conshohocken, PA, 2010.
[50] T. Letcher, M. Waytashek, Material property testing of 3d-Printed specimen in Plaon an entry-level 3d printer, Proc. Asme Int. Mech. Eng. Cong. Expos. Vol 2a (2014)(2014).
[51] M.F. Afrose, S.H. Masood, P. Lovenitti, M. Nikzad, I. Sbarski, Effects of part buildorientations on fatigue behaviour of FDM-Processed PLA material, Prog. Addit.Manuf. 1 (1-2) (2016) 21–28.
[52] J. Lee, A. Huang, Fatigue analysis of FDM materials, Rapid Prototyp. J. 19 (4)(2013) 291–299.
[53] UNI EN ISO, 527-1 Plastics-Determination of Tensile Properties-General Principles,Italy, (1977).
[54] T. Corbett, T. Kok, C. Lee, J. Tarbutton, Identification of Mechanical and FatigueCharacteristics of Polymers Fabricated by Additve Manufacturing Process, Proc.2014 ASPE Spring Topical Meeting: Dimensional Accuracy and Surface Finish inAdditive Manufacturing. (2014).
[55] M.M. Padzi, M.M. Bazin, W.M.W. Muhamad, Fatigue characteristics of 3D printedacrylonitrile butadiene styrene (ABS), 4th International Conference on AdvancedMaterials, Mechanics and Structural Engineering (4th Ammse 2017) 269 (2017)(2017).
[56] A.T. Miller, D.L. Safranski, K.E. Smith, D.G. Sycks, R.E. Guldberg, K. Gall, Fatigue ofinjection molded and 3D printed polycarbonate urethane in solution, Polymer 108(2017) 121–134.
[57] M. Fischer, V. Schoppner, Fatigue behavior of FDM parts manufactured with ultem9085, JomUs 69 (3) (2017) 563–568.
[58] A.T. Miller, D.L. Safranski, C. Wood, R.E. Guldberg, K. Gall, Deformation and fa-tigue of tough 3D printed elastomer scaffolds processed by fused deposition mod-eling and continuous liquid interface production, J. Mech. Behav. Biomed. Mater.75 (2017) 1–13.
[59] B.M. Gong, S.H. Cui, Y. Zhao, Y.T. Sun, Q. Ding, Strain-controlled fatigue behaviorsof porous PLA-based scaffolds by 3D-printing technology, J. Biomater. Sci.-Polym. E28 (18) (2017) 2196–2204.
[60] G. Gomez-Gras, R. Jerez-Mesa, J.A. Travieso-Rodriguez, J. Lluma-Fuentes, Fatigueperformance of fused filament fabrication PLA specimens, Mater. Des. 140 (2018)278–285.
[61] H.Y. Zhang, L.L. Cai, M. Golub, Y. Zhang, X.H. Yang, K. Schlarman, J. Zhang,Tensile, creep, and fatigue behaviors of 3D-printed acrylonitrile butadiene styrene,J. Mater. Eng. Perform. 27 (1) (2018) 57–62.
[62] F. Arbeiter, M. Spoerk, J. Wiener, A. Gosch, G. Pinter, Fracture mechanical char-acterization and lifetime estimation of near-homogeneous components produced byfused filament fabrication, Polym. Test. 66 (2018) 105–113.
[63] B. Van Hooreweder, J.P. Kruth, High cycle fatigue properties of selective lasersintered parts in polyamide 12, Cirp. Annu.-Manuf. Technol. 63 (1) (2014)241–244.
[64] ISO 1352 Metallic Materials - Torque-controlled Fatigue Testing, ISO, Switzerland,(2011).
[65] H. Amel, H. Moztarzadeh, J. Rongong, N. Hopkinson, Investigating the behavior of
laser-sintered Nylon 12 parts subject to dynamic loading, J. Mater. Res. 29 (17)(2014) 1852–1858.
[66] B. Van Hooreweder, F. De Coninck, D. Moens, R. Boonen, P. Sas, Microstructuralcharacterization of SLS-PA12 specimens under dynamic tension/compression ex-citation, Polym. Test. 29 (3) (2010) 319–326.
[67] B. Van Hooreweder, D. Moens, R. Boonen, J.P. Kruth, P. Sas, On the difference inmaterial structure and fatigue properties of nylon specimens produced by injectionmolding and selective laser sintering, Polym. Test. 32 (5) (2013) 972–981.
[68] H. Amel, J. Rongong, H. Mortarzadeh, N. Hopkinson, Effect of section thickness onfatigue performance of laser sintered nylon 12, Polym. Test. 53 (2016) 204–210.
[69] J. Munguia, K. Dalgarno, Fatigue behaviour of laser-sintered PA12 specimens underfour-point rotating bending, Rapid Prototyp. J. 20 (4) (2014) 291–300.
[70] J. Munguia, K. Dalgarno, Fatigue behaviour of laser sintered Nylon 12 in rotatingand reversed bending tests, Mater. Sci. Technol.-Lond. 31 (8) (2015) 904–911.
[71] BS 3518-3 Methods of Fatigue Testing: Direct Stress Fatigue Tests, British StandardsInstitution, (1963).
[72] ASTM D671-93 Standard Test Method for Flexural Fatigue of Plastics by Constant-Amplitude-of-Force (Withdrawn 2002), ASTM International West Conshohocken,PA, 1993.
[73] G.V. Salmoria, D. Hotza, P. Klauss, L.A. Kanis, C.R.M. Roesler, Manufacturing ofporous polycaprolactone prepared with different particle sizes and infrared lasersintering conditions: microstructure and mechanical properties, Adv. Mech. Eng.(2014).
[74] G.V. Salmoria, J.L. Leite, L.F. Vieira, A.T.N. Pires, C.R.M. Roesler, Mechanicalproperties of PA6/PA12 blend specimens prepared by selective laser sintering,Polym. Test. 31 (3) (2012) 411–416.
[75] G.V. Salmoria, V.R. Lauth, M.R. Cardenuto, R.F. Magnago, Characterization ofPA12/PBT specimens prepared by selective laser sintering, Opt. Laser Technol. 98(2018) 92–96.
[76] M. Blattmeier, G. Witt, J. Wortberg, J. Eggert, J. Toepker, Influence of surfacecharacteristics on fatigue behaviour of laser sintered plastics, Rapid Prototyp. J. 18(2) (2012) 161–171.
[77] ASTM E399-17 Standard Test Method for Linear-Elastic Plane-Strain FractureToughness KIc of Metallic Materials, ASTM International West Conshohocken, PA,2017.
[78] A. Salazar, A. Rico, J. Rodriguez, J.S. Escudero, R. Seltzer, F.M.D. Cutillas, Fatiguecrack growth of SLS polyamide 12: effect of reinforcement and temperature,Compos Part B-Eng. 59 (2014) 285–292.
[79] A. Salazar, A. Rico, J. Rodriguez, J.S. Escudero, R. Seltzer, F.M.D. Cutillas,Monotonic loading and fatigue response of a bio-based polyamide PA11 and apetrol-based polyamide PA12 manufactured by selective laser sintering, Eur. Polym.J. 59 (2014) 36–45.
[80] J.A. Suresh, G.S. Kumar, P. Ramu, J. Rengaswamy, Fatigue life characterization ofadditively manufactured acrylic like poly-jet printed parts, Adv. Struct. Integr.(2018) 623–632.
[81] J.P. Moore, C.B. Williams, Fatigue Characterization of 3D Printed ElastomerMaterial, 19th Annual International Solid Freeform Fabrication Symposium (SFF),(2008).
[82] J.P. Moore, C.B. Williams, Fatigue properties of parts printed by PolyJet materialjetting, Rapid Prototyp. J. 21 (6) (2015) 675–685.
[83] ASTM D4482-11(2017) Standard Test Method for Rubber Property—ExtensionCycling Fatigue, ASTM International West Conshohocken, PA, 2017.
[84] G. Taguchi, S. Chowdhury, Y. Wu, Taguchi’s Quality Engineering Handbook, JohnWiley & Sons, Hoboken, NJ, 2005.
[85] O.A. Mohamed, S.H. Masood, J.L. Bhowmik, Optimization of fused depositionmodeling process parameters: a review of current research and future prospects,Adv. Manuf. 3 (1) (2015) 42–53.
L. Safai, et al. Additive Manufacturing 28 (2019) 87–97
97