Embed Size (px)
Citation preview

European Congress on Computational Methodsin Applied Sciences and Engineering (ECCOMAS 2012)
J. Eberhardsteiner et.al. (eds.)Vienna, Austria, September 10-14, 2012
FATIGUE ANALYSIS OF FIBRE-REINFORCED POLYMERS
S. Vervoort1
1Hottinger Baldwin Messtechnik GmbHCarl-Zeiss-Ring 11-13, 85737 Ismaning, Germany
e-mail: [email protected]
Keywords: Fatigue, durability, short fibre composites, polymer, nCode DesignLife, CAE
Abstract. The utilization of fibre composite materials has become more important over the lastyears, because they can be specifically designed for the requirements of the application. Thiscould be a combination of different material properties of the individual materials or entire newmaterial properties. In particular, a fundamental advantage of short fibre-reinforced polymersis the combination of lower weight with adequate strength.
In modern product development processes more and more traditional metal materials aresubstituted with short fibre-reinforced polymers. The material-specific design of the final prod-uct has to cover durability or reliability aspects in addition to structural strength aspects. Afatigue life prediction of fibre-reinforced components identifies critical areas for the develop-ment at a very early stage.
The lecture shows a virtual durability product development process (VDPD) to predict fa-tigue life of short fibre-reinforced materials. The multi-disciplinary process consists of a manu-facturing simulation, followed by a finite element structural analysis and a fatigue calculation.
The lecture focusses on the fatigue analysis of short fibre composites which applies finite el-ement results, cyclic loads and fatigue material properties as inputs. The calculation is carriedout using nCode DesignLife, one of the leading commercial durability software tools worldwide[1],[2].
The lecture ends with an example of a correlation between virtual and physical fatigue re-sults.

S. Vervoort
1 INTRODUCTION
Over recent years, numerous computer-based test and analysis systems have been developedto enhance durability evaluation. The current methods used by the automotive industry for eval-uating durability product development include proving ground testing, testing in the laboratoryand analytical prediction methods.
By adopting ”virtual testing”, an approach that integrates physical testing with analyticalprocedures through integrated durability product development, manufacturers can develop moreefficient and cost-effective ways of ensuring product durability [3].The pay-off is substantial. By integrating the best features and information gleaned througheach approach, manufacturers can overcome the limitations of a single approach and develop acomprehensive understanding of durability performance and product behaviour prior to finaliz-ing designs and committing to volume production tooling.
The traditional physical ”build - test - fix” approach to optimizing product life is time con-suming and extremely costly. Historically, this has led to designs that are far from being op-timized. They are either over or under designed. Test and evaluation departments, not designdepartments, have traditionally carried out durability evaluation late in the design/developmentprocess, when changes are expensive to implement.
A durability product development requires a multi-disciplinary team approach where no sin-gle activity is more or less important than another. For the automotive industry, critical inter-relationships must be established between original equipment manufacturers and their key sup-pliers, so tasks could be shared. It is essential that consistent methods and tools be used, so thatinformation can be moved within and between these organizations with minimal confusion anddifficulty.
The following document concentrates on the virtual part of the durability product develop-ment for lifetime predictions of automotive components. It is built from short fibre-reinforcedpolymers, but could easily transfer to other materials. The process takes place in the conceptdesign phase to minimize costs and should manage as few physical testing as possible.
2 VIRTUAL DURABILITY PRODUCT DEVELOPMENT PROCESS
The Virtual Durability Product Development Process (VDPD) is shown in figure 1 and con-sists of multi-disciplinary engineering areas, hot press flow analysis, structural analysis, multi-body dynamics and fatigue analysis.
The aim is to predict the life of a component of short fibre-reinforced polymers, especiallyshort fibre-reinforced thermoplastic. The process devotes resources of an existing CAE envi-ronment, which sets limits of the simulations and confine the quality of the fatigue results.
The simulation of the production of the component initiates the virtual durability productdevelopment process. It is followed by a structural analysis. The fatigue analysis constitutesthe main part of the process. At the end of the process the lifetime is predicted and criticallocations in the design are identified. Based on the results the design could be optimized beforevarious prototypes have to be built and physically tested. The use of the virtual durabilityproduct development process reduces the number of prototypes.
The single steps of the process are characterized in details below on a basis of an automotivecomponent of a passenger car, the bottom of the spare wheel compartment of a passenger car.In the past this kind of automotive component was built of sheet metal.
2

S. Vervoort
Figure 1: Virtual durability product development process of short fibre-reinforced polymers [4]
The competition on the automotive market requires a more cost efficient solution. In this casethe sheet metals were substituted with short fibre-reinforced polymers. The exchange of sheetmetal for short fibre-reinforced materials results in different production processes and stylingof the design.
2.1 Geometry
Figure 2: Design of the automotive component
3
S. Vervoort
The model is created for a number of different purposes. The modelling requirements dependon its intended use and to achieve acceptable levels of accuracy. Fatigue analysis results are verysensitive to the accuracy of the calculated stresses in local regions of a component.
The finite element model based on an existing CAD design for sheet metal was quickly mod-ified to consider fibre reinforced plastic material. The model consists of 10140 shell elements.A key requirement is that the finite element model must be of good quality with sufficient meshrefinement (figure 2).
2.2 Flow Simulation
The flow simulation represents the manufacturing process of the component. It is a sheetmolding compounds (SMC) process technique based on glass fibre-reinforced thermoplasticswith good mechanical properties. The initial shape of the basic raw material is a pre-plate.They consist of random glass fibre orientated polypropylene. In the process one or more pre-plates, depending on the thickness of the final component, are pressed in tempered form.
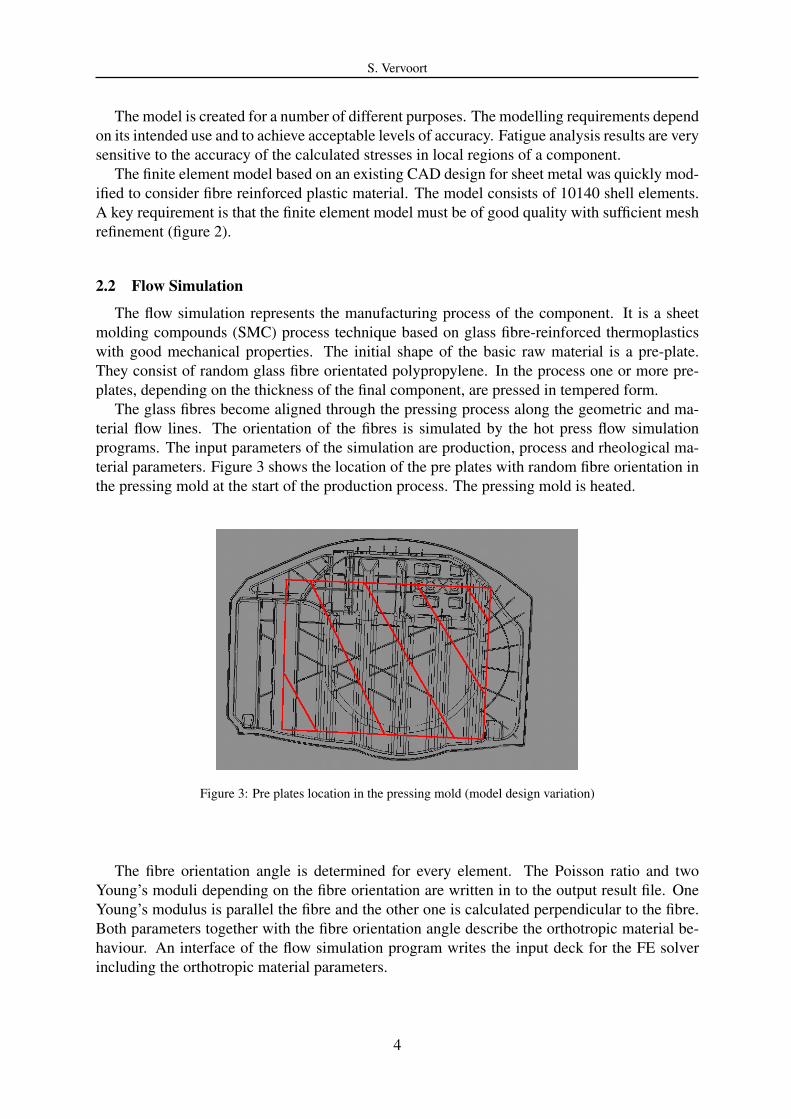
The glass fibres become aligned through the pressing process along the geometric and ma-terial flow lines. The orientation of the fibres is simulated by the hot press flow simulationprograms. The input parameters of the simulation are production, process and rheological ma-terial parameters. Figure 3 shows the location of the pre plates with random fibre orientation inthe pressing mold at the start of the production process. The pressing mold is heated.
Figure 3: Pre plates location in the pressing mold (model design variation)
The fibre orientation angle is determined for every element. The Poisson ratio and twoYoung’s moduli depending on the fibre orientation are written in to the output result file. OneYoung’s modulus is parallel the fibre and the other one is calculated perpendicular to the fibre.Both parameters together with the fibre orientation angle describe the orthotropic material be-haviour. An interface of the flow simulation program writes the input deck for the FE solverincluding the orthotropic material parameters.
4

S. Vervoort
2.3 FEM Simulation
The FE solver MSC.Nastran is used for the structural analysis. A linear-elastic finite elementsimulation is carried out. The anisotropic material parameters of the flow simulation wereincluded in MAT8 and PCOMP cards. The MAT8 card defines the shell element orthotropicmaterial property and the PCOMP card defines layered composite element properties for everysingle element. The PCOMP card could divide the element into different layers, but only thesurface layers were factored into the calculation as top and bottom surface of the component[5].
Every element has its own ID also a unique property ID due to the fact that an elementhas its own fibre orientation and orthotropic material properties. Additionally the ortothropicmaterial properties can be saved by the use of Digimat [6] into a material orientation tensor ofeach element in preparation for the fatigue analysis afterwards. If no material orientation tensorcould be created by the finite element solver the material orientation information could be savedinto an ASCII file for following analyses. Digimat supports different commercial solver like e.g.Abaqus, ANSYS, RADIOSS.
For the loading conditions nine independent, static displacement sub cases are attached tothe model. These unit loads are attached to three locations in three directions and balanced onthe model. The x- and y-axis describe the plane of the model while the z-direction describesperpendicular axis of the model. Built in the passenger car the z-axis is vertical to the groundsurface.
Figure 4: VON MISES stress distribution (load case: z-axis, top)
Figure 4 shows the VON MISES stress result of one sub case (z-Axis loading) as an example.A complete stress tensor was calculated for every shell element. To achieve the best fatigueresults the finite element analysis must provide stresses that are as accurate as possible, partic-ularly with critical locations at free surfaces where fatigue cracks are expected to initiate.
Anything that compromises the accuracy of the stresses in critical areas can have a signifi-cant effect on the calculated life. According to a rule of thumb: 10 % stress tolerance induces100 % difference in life.
5

S. Vervoort
2.4 Fatigue Simulation
The fatigue analysis represents the main part of the virtual durability product developmentprocess. It presumes a finite element geometry and stress result. In principle a modern CAEfatigue analysis is based on three primary input parameters (figure 5):
• FE geometry and results
• Cyclic loading time histories
• Material properties
The accuracy of all three inputs influences life or damage results and can be optimized duringpost processing to extend the life of a part or system, independently of each other up to a point[7].
The following chapters below describe only the fatigue details of the analysis parameters,loading and material properties; the geometry and FE results were already described before.
Figure 5: CAE based fatigue analysis
2.4.1 Analysis parameters
The FE-based total life, or S-N, method of fatigue analysis is executed for predicting life anddamage. Total life methods are typically more applicable to high cycle fatigue situations. Thefatigue program nCode DesignLife superposes the nine displacement time histories for everyelement and transforms the FE stress tensor into principle stresses by an internally critical planemethod [2]. Next rainflow cycle counting [8] and GOODMAN mean stress correction [9] areapplied. Finally the damage is calculated by use of the linear damage accumulation theory ofPALMGREN and MINER [10, 11].
6

S. Vervoort
The most popular result of stress based CAE life prediction is life (unit: repeats of appliedload spectrum) or damage (no unit) result for every element diagrammed in a fringe plot or atable form. The critical locations are highlighted and can be eliminated by local optimizationof shape.
2.4.2 Loading
The loading of the fatigue analysis is represented by displacement time histories of thecomponent. An example of three time histories, out of nine applied, attached to one node isshown in figure 6. The cyclic displacements come from a multi-body dynamics simulation(MSC.Adams). A simulation of a real existing test rig is created in the multi-body dynamicsprogram. Figure 7 shows the assembly of the test rig.
Figure 6: Displacements time histories at one attachment point (x-, y- and z-axis)
The input loading of the multi-body system analysis is extracted from a real durability testof a fibre-reinforced prototype component.
Figure 7: Simulation of a physical durability test
7

S. Vervoort
2.4.3 Materials
The third input parameter of the fatigue analysis is the material property. In this case atleast one WOHLER curve (SN curve or BASQUIN curve) is required to define it for the total lifemethod. To limit the time and costs of material characterization, curves are measured at a zeromean and adjust by a mean stress correction equation.
Figure 8: Fibre orientation depended Basquin curve
As the reinforced polymer is fibre orientation dependent, one SN curve is not sufficient todescribe the material properties and feed the fatigue analysis. For fibre reinforced polymers thefatigue strength of different fibre orientations was investigated.
Special plates are manufactured with fixed fibre orientation at which the base material andthe production process was the same as for the automotive component. The flow of the mate-rial is controlled during the pressing process in defined directions to produce material with adominant fibre orientation. Specimens are cut out of these plates in different directions to getunidirectional fibre orientation in the specimens. Stress based fatigue tests are carried out onspecimens with 0◦, 20◦, 45◦ and 90◦ degrees fibre angles to loading direction at room temper-ature. Figure 8 shows the BASQUIN curves for each fibre angle of the short fibre-reinforcedpolymer.
The fatigue software program nCode DesignLife has an intelligent internal interpolationmethod for the fibre orientation dependent SN curves. A fibre share parameter takes the anglebetween fibre orientation and loading direction and material orientation tensor into account forthe interpolation.
8

S. Vervoort
3 RESULTS
The result of the fatigue analysis is a life time contour plot, which is shown in figure 9.A life value is calculated for every element and the red color indicates the minimum life and thecritical areas in the fringe plot. Blue coloured areas indicate values below the endurance limit.
Figure 9: Life time calculation based on orthotropic material properties
The plot shows in details possible failures in different areas, mostly on the peripheral regionsor surface pleats of the component. In general the z-axis motion, causing the component to flex,dominates the fatigue damage.
4 CORRELATION
To interpret the quality of the fatigue calculation the result has to be correlated. The resultsof the damage calculation based on orthotropic material properties (shown in figure 9) cancompared to the FE structural analysis results (figure 4), damage calculation using isotropicmaterial properties (figure 10) and real fatigue test results (figure 11).
The comparison between the VON MISES stress result of the dominant static load case (z-direction) of the FE structural analysis (figure 4) and life time calculation (figure 9) based onorthotropic material properties as described in this paper is valuably, because often CAE depart-ments are carrying out only structural analysis and make their decision based on their resultsonly. Compared to the fatigue results, which gives detailed information about various localfailures the FE analysis is missing this detailed information. A decision based on the FE resultsmay lead to wrong decisions.
Figure 10 shows a results of a fatigue analysis base on isotropic material properties. Forthe isotropic material calculation one SN curve is used. The fatigue tests are carried out withspecimens of random fibre orientation. A fibre orientation is not considered.
A comparison between the results the of fatigue analysis using isotropic (figure 10) andorthotropic (figure 9) show differences in critical locations. The orthotropic fatigue analysis is
9

S. Vervoort
detecting more details and show clearer the critical locations. Decisions based on an analysisbased on isotropic material parameter may fail.
Figure 10: Life time calculation based on isotropic material properties
An final comparison between simulation and reality is performed. A prototype of the bot-tom of the spare wheel compartment was manufactured, placed in a passenger car and the carwas tested on the proving ground. According to a defined test schedule the component wasafterwards inspected for cracks and failures.
Figure 11: Comparison of life time prediction with real failures
10

S. Vervoort
Figure 11 shows the comparison between the orthotropic fatigue simulation and cracks foundin components tested on the proving ground. The comparison shows a good correlation betweensimulation and reality.
5 CONCLUSION
The virtual durability product development process helps to indicate weakness or criticallocations of the design at the early state in the concept phase. An optimized fatigue simulation
• Gives additional model information, which is previously not available.
• Gives more realistic results using fibre orientation material parameter compared to simplerandom material properties.
• Illustrates the advantages of the design.
The process combines standard software tools and is easy to integrate in existing CAE en-vironments. It will save costly re-designs and re-tests. Beside the information of structuralanalysis and multi-body system analysis fatigue information based on fibre orientation depen-dent material properties gives new insight into material performance.
REFERENCES
[1] N. N.: nCode DesignLife 8 User Guide, HBM United Kingdom Limited 2012
[2] N. N.: nCode DesignLife 8 Theory Guide, HBM United Kingdom Limited 2012
[3] B. Dabell, C. Musiol: Integrated Durability Management in the Automotive Industry, In-house documentations, nCode International Ltd., Southfield, MI, USA, 2005
[4] P. Heyes: Lightweight - Composites - Fatigue Life Assessment, 3. Symposium on Struc-tural Durability, Darmstadt, Germany 2011
[5] N. N.: Quick Reference Guide, MSC.Software 2005
[6] N. N.: Digimat for Engineering Plastics, e-Xstream Engineering 2010
[7] N. N.: The nCode Book of Fatigue Theory, Technical Reference Book, nCode Interna-tional Ltd., Sheffield 2005
[8] M. Matsuishi, T. Endo: Fatigue of metals subjected to varying stress (in Japanisch), PaperJapan Soc. Mech. Eng., Fukuoka, Japan, March 1968
[9] J. Goodman: Mechanics Applied to Engineering, Longmans, Green & Co, New York1899; Reprint of 9. edition 1954
[10] A. Palmgren: Die Lebensdauer von Kugellagern, VDI-Z. 68 (1924) 14, 339 - 341
[11] M. A. Miner: Cumulative damage in fatigue, J. Appl. Mech. (ASME) 12 (1945) 3, A159 -A164
11