Embed Size (px)
Citation preview
4/28/15 FAST 4615 W. Sunset Road, Las Vegas, NV 89118 • 702-432-5300
FAST Signal Performance Measurement (SPM)
Purdue Coordination Diagrams (PCD’s)
Between Yellow and red line the phase is yellow.
From zero to green line the phase is red.
Long vertical red lines – Main street is resting in green; side street or left turns get skipped.
Short vertical red lines – Skipping street or left turns; late start of green for side street.
PR – platoon ratio. From HCM 2000 Equation 15-4.
The Higher the value, the better the progression.
Approach Volumes
Detector approximately 350-400 feet upstream of stopbar.
Detection zone is in advance of the turning lanes, so don’t know if vehicles are turning left, right or going thru.
Accuracy – tends to undercount.
4/28/15 FAST 4615 W. Sunset Road, Las Vegas, NV 89118 • 702-432-5300
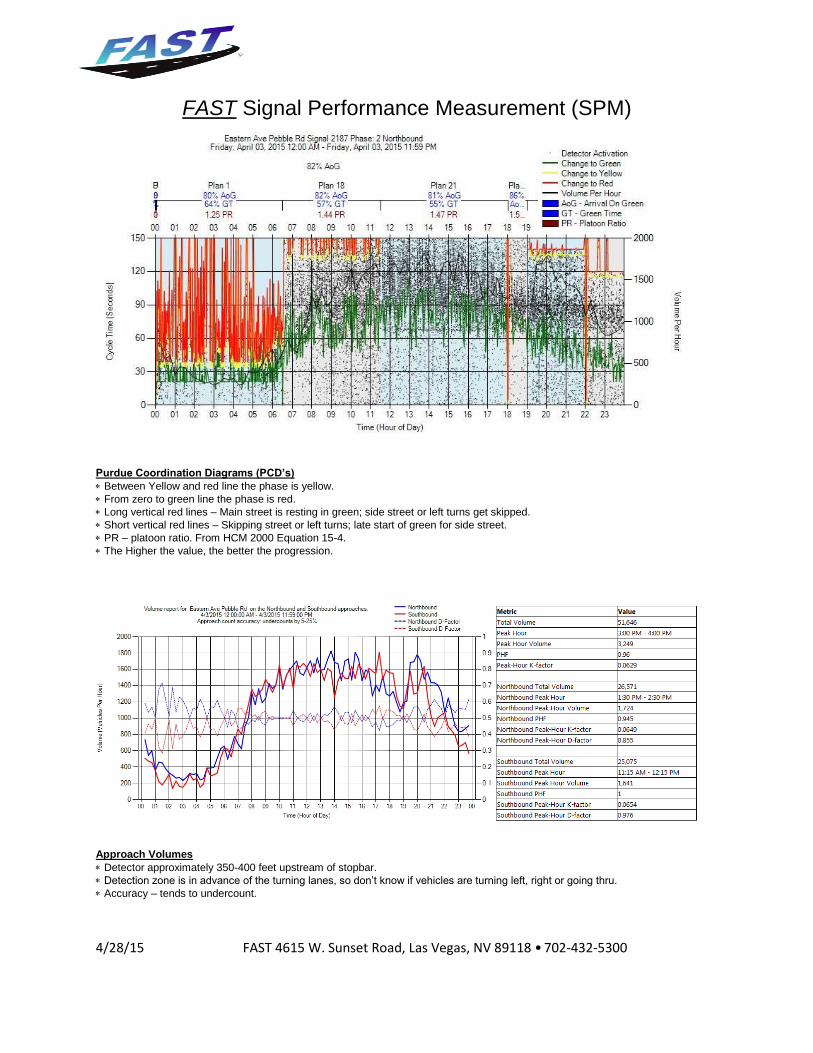
Purdue Phase Termination Charts (ATC Traffic Signal Controller Data)
Shows how phases terminate in the sequence.
Blue are max-outs (all programmed time is used up) during coordination.
Reds are max-outs during fully actuated (free).
Greens are gap-outs (not all the programmed time is being used).
Blanks are skips (the phase was skipped (i.e. no demand)
Orange dots are pedestrian activations.
Split Monitor (ATC Traffic Signal Controller Data)
Shows the amount of split time (green, yellow & all-red time) used by the various phases at the intersection.
Greens are showing gap-outs; blues and reds are showing max-outs; yellows/ oranges are showing pedestrian activity; the line is showing the programmed split time.
4/28/15 FAST 4615 W. Sunset Road, Las Vegas, NV 89118 • 702-432-5300
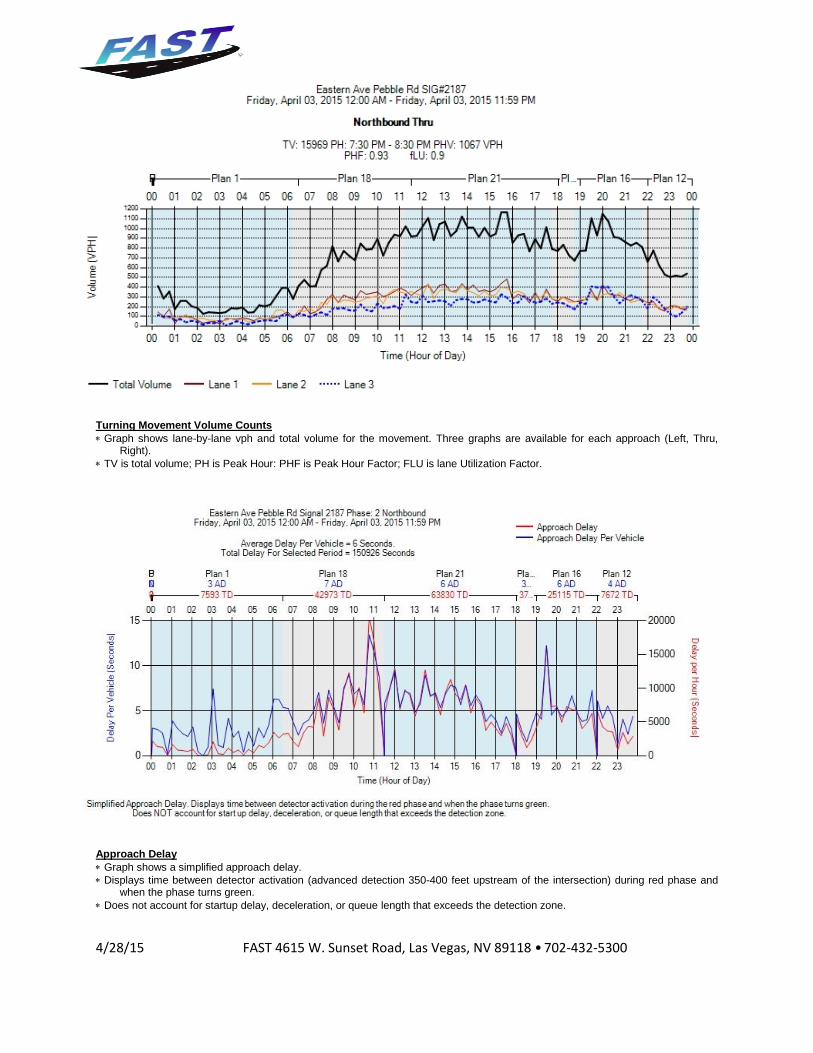
Turning Movement Volume Counts
Graph shows lane-by-lane vph and total volume for the movement. Three graphs are available for each approach (Left, Thru, Right).
TV is total volume; PH is Peak Hour: PHF is Peak Hour Factor; FLU is lane Utilization Factor.
Approach Delay
Graph shows a simplified approach delay.
Displays time between detector activation (advanced detection 350-400 feet upstream of the intersection) during red phase and when the phase turns green.
Does not account for startup delay, deceleration, or queue length that exceeds the detection zone.
4/28/15 FAST 4615 W. Sunset Road, Las Vegas, NV 89118 • 702-432-5300
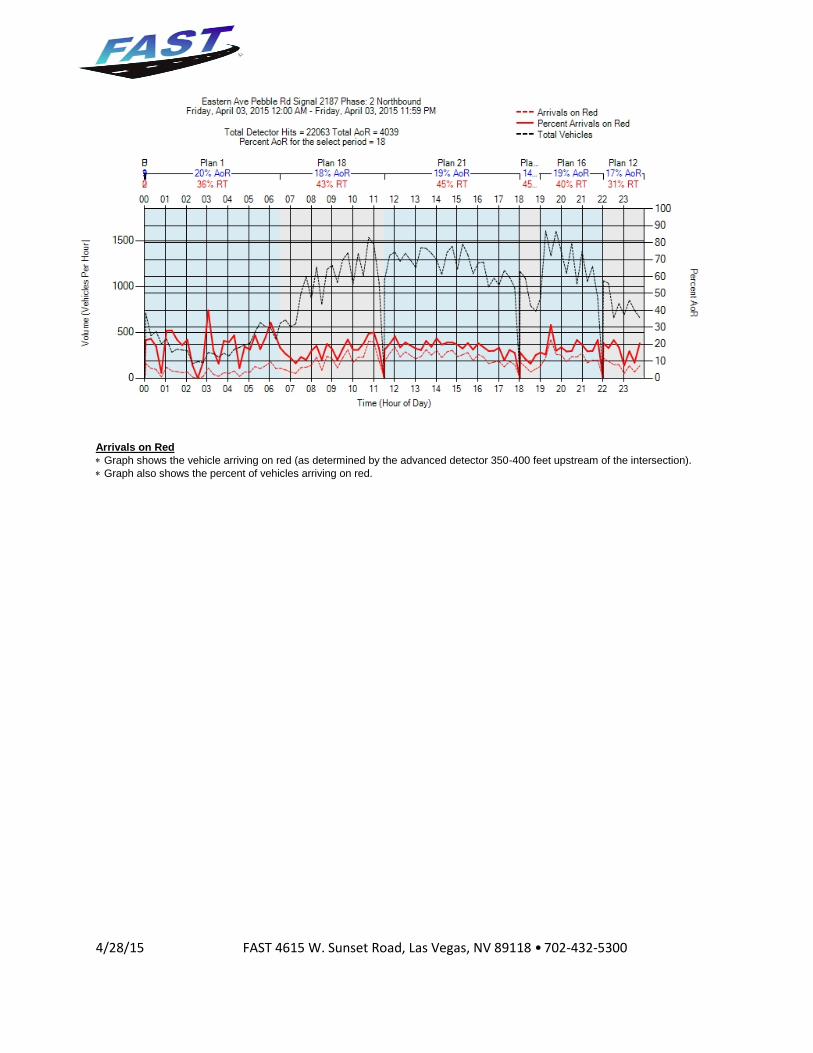
Arrivals on Red
Graph shows the vehicle arriving on red (as determined by the advanced detector 350-400 feet upstream of the intersection).
Graph also shows the percent of vehicles arriving on red.