Embed Size (px)
Citation preview

Farmland Values & Cash Rent
Craig Dobbins

2011 Purdue Land Value SurveyCash Rent Results
Land Yield Value ($/a) % Quality Bu/A 2010 2011 Change
Top 188 202 230 13.9%
Aver. 157 161 182 13.0%
Poor 126 124 141 13.7%

Average Quality Cash Rent, 1975 - 201119
7519
7619
7719
7819
7919
8019
8119
8219
8319
8419
8519
8619
8719
8819
8919
9019
9119
9219
9319
9419
9519
9619
9719
9819
9920
0020
0120
0220
0320
0420
0520
0620
0720
0820
0920
1020
11
0
50
100
150
200
250
300
350
Nominal Inflation Adj. (2011)
Year
Valu
e pe
r acr
e

Cash Rent Comparison2002 - 2006 & 2007 - 2011
1 2 3 4 50.00%
2.00%
4.00%
6.00%
8.00%
10.00%
12.00%
14.00%
Percent change in average farmland cash rent
2007-112002-06
Perc
ent c
hang
e

Cash rent per bu. – Average soil
1970 1975 1980 1985 1990 1995 2000 2005 2010 20150.55
0.65
0.75
0.85
0.95
1.05
1.15
1.25
Year
$/B
u.

Preliminary 2011 Purdue Land Value Survey – Land Value Results
Land Yield Value ($/a) % Quality Bu/A 2010 2011 Change
Top 188 5,310 6,521 22.8%
Aver. 157 4,419 5,468 23.7%
Poor 126 3,501 4,368 25.3%

Average Quality Land Value, 1970 - 201119
7019
7119
7219
7319
7419
7519
7619
7719
7819
7919
8019
8119
8219
8319
8419
8519
8619
8719
8819
8919
9019
9119
9219
9319
9419
9519
9619
9719
9819
9920
0020
0120
0220
0320
0420
0520
0620
0720
0820
0920
1020
11
0
1,000
2,000
3,000
4,000
5,000
6,000
7,000
Nominal Inflation Adj. (2011)
Year
Valu
e pe
r acr
e

Comparison of Change in Farmland Value2002 – 2006 & 2007 - 2011
1 2 3 4 50.00%
2.00%
4.00%
6.00%
8.00%
10.00%
12.00%
14.00%
Percent change in average farmland cash rent
2007-112002-06
Perc
ent c
hang
e

Farmland Value per Bu. of CornAverage Land
1974
1975
1976
1977
1978
1979
1980
1981
1982
1983
1984
1985
1986
1987
1988
1989
1990
1991
1992
1993
1994
1995
1996
1997
1998
1999
2000
2001
2002
2003
2004
2005
2006
2007
2008
2009
2010
2011
0.00
5.00
10.00
15.00
20.00
25.00
30.00
35.00
40.00

Value/Rent multiple – Average land
1975
1976
1977
1978
1979
1980
1981
1982
1983
1984
1985
1986
1987
1988
1989
1990
1991
1992
1993
1994
1995
1996
1997
1998
1999
2000
2001
2002
2003
2004
2005
2006
2007
2008
2009
2010
2011
7
12
17
22
27
32
Year
Value/Rent Multiple
+2 STD
Mean
Mean = 18.6
Current = 30.1

2012 Projections - Prepared August 10, 2011Item Rotation Corn Rotation Soybeans
Per acre Per bu. Per acre Per bu.
Yield 161 49
Price $5.90 $5.90 $12.40 $12.40
Direct payment $26.00 $0.16 $14.00 $0.29
Gross Revenue $976 $6.06 $622 $12.70
Production cost $462 $2.87 $246 $5.02
Contribution margin $514 $3.19 $376 $7.67
Machinery overhead $80 $0.50 $80 $1.63
Labor $39 $0.24 $39 $0.80
Return to land & risk $395 $2.45 $257 $5.24
2011 Cash rent – average land $187 $1.16 $187 $3.82
Profit $208 $1.29 $70 $1.42

New Price PlateauCorn ($/bu.) Soybeans ($/bu.)
$6.70 $17.56
$4.60 $10.58
$3.00 $7.51
Source: Dr. Scott Irwin
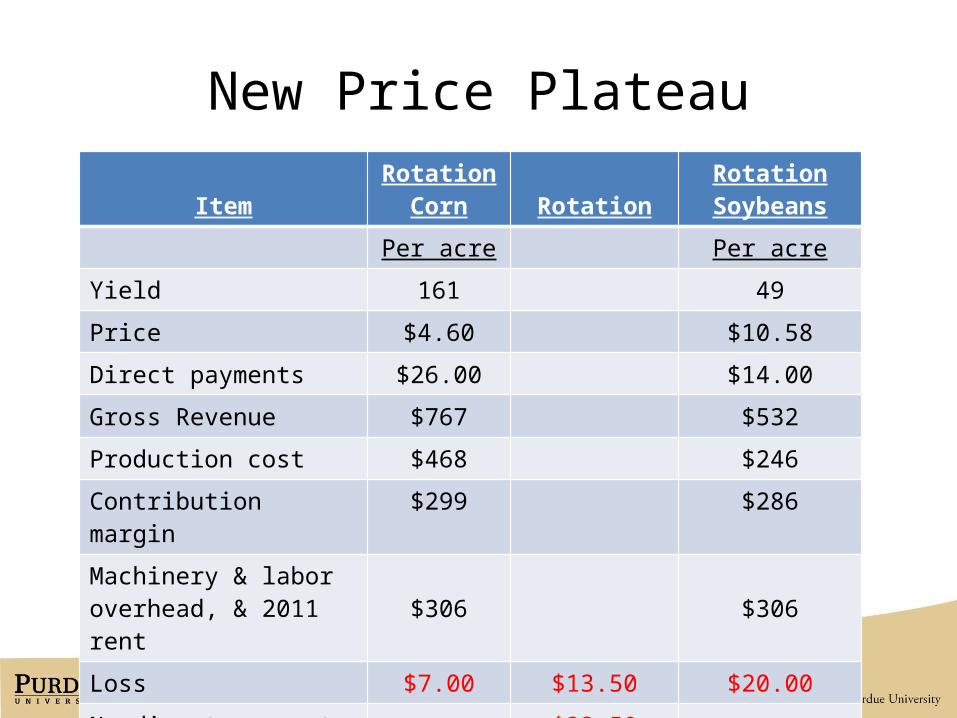
New Price Plateau
ItemRotation
Corn RotationRotation Soybeans
Per acre Per acre
Yield 161 49
Price $4.60 $10.58
Direct payments $26.00 $14.00
Gross Revenue $767 $532
Production cost $468 $246
Contribution margin $299 $286
Machinery & labor overhead, & 2011 rent $306 $306
Loss $7.00 $13.50 $20.00
No direct payments $33.50

Farmland ValueScenario Return to land Value/income
multipleFarmland value
Continue estimated 2012
$340 30 $10,200
New price plateau $174 30 $5,220

Annual Percent Change in Average Land 1972 - 2011
19
72
- 7
3
19
73
- 7
4
19
74
- 7
5
19
75
- 7
6
19
76
- 7
7
19
77
- 7
8
19
78
- 7
9
19
79
- 8
0
19
80
- 8
1
19
81
- 8
2
19
82
- 8
3
19
83
- 8
4
19
84
- 8
5
19
85
- 8
6
19
86
- 8
7
19
87
- 8
8
19
88
- 8
9
19
89
- 9
0
19
90
- 9
1
19
91
- 9
2
19
92
- 9
3
19
93
- 9
4
19
94
- 9
5
19
95
- 9
6
19
96
- 9
7
19
97
- 9
8
19
98
- 9
9
19
99
- 0
0
20
00
- 0
1
20
01
- 0
2
20
02
- 0
3
20
03
- 0
4
20
04
- 0
5
20
05
- 0
6
20
06
- 0
7
20
07
- 0
8
20
08
- 0
9
20
09
- 1
0
20
10
- 1
1
-30%
-20%
-10%
0%
10%
20%
30%
40%
50%
60%
Year
Per
cen
tag
e

Continue Higher
• Strong demand for corn from the ethanol industry because of biofuel mandates
• Strong soybean export demand • 2011 U.S. corn and soybean crop that is average or
below average• Moderate increases in input costs for corn and
soybeans, keeping crop production margins well above historic average
• Low long-term interest rates • Little change in the amount of land available for sale

Steady or Decline• Sharp decline in corn and/or soybean export demand• Sudden change in the U.S. policy away from providing biofuel
subsidies and mandating usage• Sharp rise in interest rates because of a downgrade in the credit
rating of U.S. government debt obligations or increased inflation fears• Exceptionally large 2011 corn and soybean crop • Sharp rise in crop input prices reducing crop production margins• Further slowing of world growth because of sovereign debt problems,
including the U.S.• Strong supply response resulting from new capital investments in
agricultural production• U.S. recession• Some combination of the above or some unknown development