Embed Size (px)
Citation preview

Evaluation
Enterprise Ireland
Company Expansion
Supports 2005-2010
April 2015
Department of Jobs, Enterprise and Innovation
An Roinn Post, Fiontar agus Nuálaíochta
Strategic Policy Division

EVALUATION OF BUSINESS DEVELOPMENT PROGRAMMES
1
2. Enterprise Ireland Company Expansion Supports
2005-2010
Programme logic model
Objectives
Improving company competitiveness
Increasing Gross Output
Increasing Value Added
Increasing Exports
Providing New Employment
Maintaining Existing Employment
Increasing Productivity
Supporting R&D
Inputs
Enterprise Ireland Financial Support
Non Grant inputs such as Enterprise Ireland Staff Inputs and Other Enterprise Ireland Resources
Private sector/Assisted Company Investment
Activities
Grant supports assigned to clients is
dependent on specific needs as determined
by EI and client company
EI assessor appointed to evaluate proposal
and expenditure. Typical support to clients is
in form of preference shares or direct grant
payments.
Commercial and financial assessment, market
analysis and clarification on legal issues.
Outputs
No. of client companies assisted
Financial support approved and paid
Outcomes and Impacts
Increase no. of business with capability to sell to international markets
Growth of export sales and turnover
Employment creation
Productivity improvements
Enhanced management capabilities
Increased firm survival

2
Evaluation aim
The aim of this evaluation of Enterprise Ireland’s Company Expansion Supports (CES) is to assess
their appropriateness, efficiency and effectiveness. The evaluation timeframe covers approvals
over the period 2005 to 2010 and outcomes and impacts up to 2012. Indecon consultants were
commissioned by Forfás to undertake research and analysis for this evaluation in line with Forfás
Evaluation Framework.
Programme background, objectives and target population
The CES comprises a suite of programmes that support firms that are undertaking or planning an
ambitious expansion with the objective of creating employment and growing exports. The
supports are aimed at established firms involved in manufacturing or eligible internationally
traded services activities. Typically CES-assisted firms are existing Enterprise Ireland clients,
though this is not a prerequisite. Over the period of this evaluation CES were delivered by
Enterprise Ireland via two channels:
as tailored and structured company expansion packages, primarily to existing client firms,
on the basis of decisions made by Enterprise Ireland’s investment committee; or
as stand-alone grants or funds geared towards a specific purpose (e.g. to support
productivity improvements), with funding often allocated on the basis of competitive calls.
An important feature is that CES utilise a holistic approach, drawing on a range of individual
measures to deliver tailored support packages to client companies depending on their specific
requirements (see table 2.1). It should be noted that client firms perceive Enterprise Ireland’s
offering as ‘Tailored Company Expansion Packages’ and they are not familiar with the specific
instruments applied by Enterprise Ireland under this heading.

EVALUATION OF BUSINESS DEVELOPMENT PROGRAMMES
3
Table 2.1 Company expansion supports by client offer/constituent support – 2005-2010
Tailored Company Expansion Packages approved by Investment Committee
Company Expansions (pre April 2008) and including and excluding R&D (April 2008 - January 2009)
Scaling (including and excluding R&D) (January 2009 - June 2012)
Commercial Terms
Investment De Minimis Established
Specific and Stand-alone Complementary Funding Instruments
Productivity Improvement Fund (2005-2008)
Growth Fund (2008-2010)
Key Manager Grants
Strategic Consultancy
Source: Enterprise Ireland
Tailored company expansion packages
The objective of the tailored packages is to support companies with ambitious plans to grow
employment and exports. Tailored expansion packages are designed to support new or incremental
investment in:
Capital assets and job creation;
R&D;
Training;
Management Development; and/or
Consultancy.
In considering the application an appropriate level of due diligence is carried out, typically
including a commercial and financial assessment, market analysis, clarification on any equity or
legal issues (where relevant) and third party validations. Following a successful approval by the
appropriate decision-making committee, a formal letter of offer is issued to the client company
detailing the associated terms and conditions and outlining how payment will be made.
Investment de minimis established
De Minimis aid involves small amounts of assistance not exceeding €200,000 over any three fiscal
years, and provided usually in the form of equity, to a company.

4
Growth fund
The Growth Fund operated from 2008, when it replaced its precursor, the Productivity
Improvement Fund (see below). This fund operated on the basis of a competitive call – and was
therefore geared more toward attracting potential new clients. The Growth Fund provided a
range of supports to help companies grow and innovate and develop export sales through:
a) Developing capacity - investment in capital and technology acquisition;
b) Developing capability within the company – investment in people skills and recruiting key
managers; and
c) Implementation of the growth plan – developing the right processes, culture and
structures to implement the growth plan through investment in workplace innovation and
consultancy.
A maximum funding of up to €200,000 was available for capacity building projects which had to
have a minimum scale of €150,000 (€50,000 for technology acquisition), and up to €150,000 for
training-related projects (of minimum size of €25,000). These funding envelopes were subject to
regional grant rate maxima of between 27.5 percent and 70 percent depending on the region,
company size, size of grant and nature of the project. Companies applying for grants were
required to demonstrate how the investments would lead to improvements in terms of
productivity, competitiveness etc., as relevant. Applications were considered at the Enterprise
Ireland Growth Fund Committee.
Productivity improvement fund
The Productivity Improvement Fund (PIF) was the precursor to the Growth Fund. The objective of
the PIF was to support client SMEs to improve their competitiveness by increasing the company’s
gross output, value added and/or exports, while providing new employment or maintaining
existing employment. It was intended that through this support a sustainable improvement in
productivity would be embedded in the recipient companies, thereby establishing a base from
which they could develop their exports. In order to meet the objectives of the PIF, project
applications submitted by client companies had to demonstrate how they would:
Help the company meet specific measurable productivity improvements;
Build the existing export capability in the company or have the potential to generate new
export opportunities for the company in the future;
Be an integral part of the strategic development plan of the company;
Be additional to the current level of activities, improve the company’s productivity and
develop export capability;
Increase gross output while maintaining and/or increasing employment in the company in
the longer term; and
Demonstrate how the company plans to undertake the project, particularly in relation to
the resources required to develop the project.
The PIF operated on a similar basis to the Growth Fund, with funding allocated following
competitive calls.

EVALUATION OF BUSINESS DEVELOPMENT PROGRAMMES
5
Key manager grant
The Key Manager Grant is a non-competitive, specific grant-based support. Examples of key
manager positions include Chief Financial Officer (CFO), Chief Technical Officer (CTO), R&D
Manager, Production Manager, and Business Development Manager.1 Key Manager Grants are not
intended to be a mechanism to subsidise general recruitment and it must be demonstrated that
the individual will contribute to significant and measurable improvements in company productivity
and/or changes in its output to meet defined market requirements. The maximum grant available
at the time was equivalent to one year’s salary cost to a maximum salary of €80,000.
Strategic consultancy grant
The Strategic Consultancy grant is a non-competitive, specific support which may be provided as
part of a package of supports approved by the investment committee, or approved independently
by Enterprise Ireland line management. The objective of the grant is to improve the strategic
capability of established SME clients by encouraging them to engage outside consultants to assist in
the development and implementation of strategic initiatives within the company. The support is
designed to facilitate business growth insofar as consultants can act as coaches, mentors,
counsellors, facilitators, analysts and/or negotiators for the company.2
Programme rationale
Considered as a whole, the constituent measures within the CES suite of supports share the same
overall objectives, namely to create employment and increase exports. According to Enterprise
Ireland, they represent a holistic approach to supporting expansion of established client firms,
with funding packages being tailored to companies’ specific needs, and drawn from the individual
instruments. It is not appropriate, or indeed feasible, to attempt to evaluate the impacts and
effectiveness of the individual instruments applied by Enterprise Ireland in delivering CES, and this
evaluation therefore assesses CES as a bundle of supports that share the same overall objectives.
In relation to the description, rationale and objectives of the CES an issue concerns the extent of
available documentation and detailed information. Greater detail is available on individual stand-
alone supports, such as the Productivity Improvement Fund and its successor the Growth Fund, Key
Manager and Strategic Consultancy grants, although there remains an absence of information on
rationale in terms of how these supports are addressing specific market failures. However, the
available documentation on tailored company expansion packages, which represent the main
channel through which expansion supports have been delivered by Enterprise Ireland over the
evaluation period, is limited to what is provided on Enterprise Ireland’s corporate website and
summary material provided for the purposes of this evaluation. This does not, however, provide
sufficient detail in terms of addressing specific market failures, objectives and targets. This is an
important area where future programme design and monitoring systems would benefit from
enhanced detail to facilitate ongoing evaluation.
1 It is explicitly stated that sales/sales management roles are ineligible for support
2 Routine or ongoing outsourced consultancy costs such as PR; marketing, legal, financial costs are not
eligible for support

6
Acknowledging the gaps in documentation, this evaluation concludes that the programmes were
addressing market failures particularly in respect of information asymmetries and addressing
capability deficits. Irish owned firms face considerable barriers to internationalisation including,
for example, language, culture, regulatory frameworks and legal systems that are distinctive to
geographic markets. Companies may not always invest optimally in training given the inherent
risks in not realising the benefits of investment through staff turnover. The state has a role to play
in stimulating such investments, given that the benefits accrue to the economy and society beyond
the individual and firm level.
Alignment with national policy
Earlier enterprise strategy and policy context
Ireland’s National Development Plan 2007-2013 states that Enterprise Ireland “is acutely aware of
the significant challenges and indeed opportunities that indigenous companies face in this new
economy. Their lack of scale is a key issue, as is their need for improved management skills, their
need to develop international marketing and sales capabilities, their need to exploit state-of-the-
art technology and business processes, and their need to forge strategic alliances and partnerships.
The focus of Enterprise Ireland’s overall strategy for the period of this Plan will be to maximise
export sales through the utilisation of applied research, technology and innovation while wishing
to promote regionally balanced economic development.”
The earlier enterprise policy context within which Enterprise Ireland’s company expansion
supports were being developed is best described by reference to the report of the Enterprise
Strategy Group (ESG) in 2004, entitled ‘Ahead of the Curve, Ireland’s Place in the Global
Economy’.3 The ESG report highlighted the changing context of global trade and economic
development, noting that future economic growth would be strongly influenced by the following
factors:
The shift toward services as a major driver of GDP growth; and
The increasing role of knowledge providers as a driver of economic development and an
influencer of new products.
The report identified sources of future competitive advantage for Ireland, and set out
recommendations to develop and exploit these sources, which included:
Expertise in markets;
Expertise in Technology and Product and Service Development; and
World-class skills, education and training.
The ESG report also identified essential overarching conditions for business development including
cost competitiveness, infrastructure, innovation and management capability.
The ESG report represented a key policy context for the development and application of business
development programmes and Enterprise Ireland’s CES. In particular, the aims and objectives of
the CES were consistent with the need for indigenous firms to enhance management capability,
innovate, internationalise/develop export markets and increase productivity.
3
Enterprise Strategy Group - Ahead of the Curve, Ireland’s Place in the Global Economy, 2004

EVALUATION OF BUSINESS DEVELOPMENT PROGRAMMES
7
A number of other subsequent policy documents and strategies also reinforced these requirements.
These included the ‘Report of the High Level Group on Manufacturing’ (2008), which also
highlighted the need for innovation and enhanced management capabilities in Irish owned firms.4
‘Catching the Wave – A Service Strategy for Ireland’ (2008) highlighted the need to diversify Irish
service exports across a broader range of sectors and activities.5 The ‘National Skills Strategy’
(2007) provided an important policy framework for enhancing capability and in-employment
education and training, which, inter alia, highlights the importance of R&D and innovation, and
the development of marketing and management skills.6
Impact of economic cycle and enterprise policy during the recession
The evaluation period for the CES spans the period between the economic boom which Ireland
experienced between the mid-1990s and mid-2000s, and the deep recession which has unfolded
since 2008/2009. This economic cycle has shaped a number of aspects of enterprise policy and
strategy. During the boom period, enterprise strategy focussed on the need regain
competitiveness through a combination of reducing costs nationally and helping firms to increase
productivity. A range of business development measures were introduced to drive productivity
improvements, including management development, training, R&D, innovation and technological
supports. The Productivity Improvement Fund, Growth Fund, and Key Manager Grant supports
within the CES are examples of such measures.
When economic recession unfolded in 2008, the Government was presented with a new set of
challenges and priorities and economic policy had to refocus on recovery and, in particular,
employment creation and retention. It was also clear that recovery would have to be predicated
on an export-led growth model. The importance of developing new export markets to support job
creation was emphasised in a number of subsequent policy documents, including:
‘Building Ireland’s Smart Economy’ (2008) set out the Government’s medium-term economic
recovery strategy, based around the concept of the ‘smart economy’;7
‘Making it Happen - Growing Enterprise for Ireland’ (2010) highlighted exports as being the
key driver of sustainable growth for Ireland and the need for enterprises to internationalise,
to grow to scale and to achieve growth through exports.8
The importance of job creation is also clear in the Government’s Action Plan for Jobs, which was
first launched in February 2012 and in the years following 2013 and 2014.9
The annual plans stress
the importance of Irish owned companies and of supporting companies to establish, to grow and to
build competitive advantage. The plans also focus on the need to address issues facing micro firms
and SMEs in terms of access to finance.
4 Report of the High Level Group on Manufacturing, Forfás, 2008
5 Catching the Wave – A Service Strategy for Ireland, Forfás, 2008
6 National Skills Strategy, Expert Group for Future Skills Needs, 2007
7 Building Ireland’s Smart Economy, Department of An Taoiseach, December 2008.
8 Making it Happen - Growing Enterprise for Ireland, Forfás, 2010
9 Department of Jobs, Enterprise and Innovation – Action Plan for Jobs, 2012, and 2013

8
Conclusions re policy context
Taking into account the rapidly evolving economic and policy context over the period relevant to
this evaluation, it is reasonable to conclude that Enterprise Ireland’s Company Expansion Supports
are broadly aligned with, and remain appropriate in the context of, national economic and
enterprise policy. However, while there is a broad consistency in terms of high-level objectives,
there may be an absence of a sufficiently clear connection between individual measures,
Enterprise Ireland’s corporate strategy and national policy. This partly reflects the definition of
Enterprise Ireland’s mandate, but also the high-level nature of descriptive documentation
available which does not explicitly relate individual measures to corporate strategy or wider policy
goals, or provide sufficient specificity around objectives and rationale. This is an issue requiring
consideration in future programme design and monitoring if effective ongoing evaluation is to be
facilitated.
Evaluation methodology
The methodological approach applied in undertaking the evaluations in this report reflects and is
consistent with the Forfás Evaluation Framework and, in particular, the Business Development
Template within this framework.
Figure 2.1: Schematic summary of methodological approach to evaluations
Data sources Data was anonymised and confidentiality was assured at all stages of analysis. Data sources
included:
Enterprise Ireland client company grants database – firm-level dataset covering period 2003
to 2012;
Forfás Annual Employment Survey (AES) – detailed firm-level data for Enterprise Ireland
client companies covering the period 1972 to 2012;
Forfás Annual Business Survey of Economic Impact (ABSEI) – detailed firm-level dataset
covering period 2000-2012 and including data in relation to sales, export sales,
inputs/purchases, payroll, profits and other relevant economic dimensions; and
Data/information gathered through new primary/survey research undertaken by the
appointed consultants.
A linked database was developed to support the detailed analysis and modelling undertaken.
Forfás Evaluation Framework
Steps 1 & 2
•Phase 1: Project inception; Identification of data and primary research requirements; Overview of objectives and description of programme
Evaluation Framework
Step 3
•Phase 2: Identify and collate data to support evaluations; complete primary research
Evaluation Framework
Step 4
•Phase 3: Data analysis, Modelling and Evaluation
Evaluation Framework
Step 5
•Phase 4: Evaluation Conclusions; Findings and reporting
EVALUATION OF BUSINESS DEVELOPMENT PROGRAMMES
9
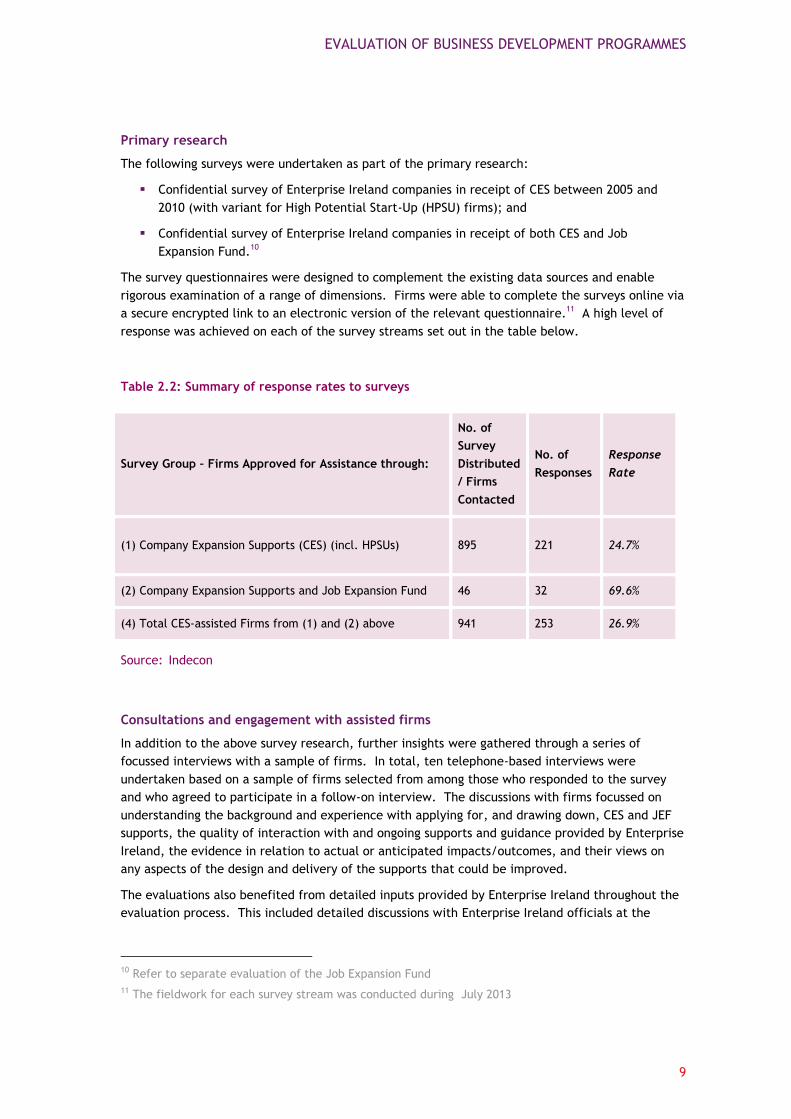
Primary research
The following surveys were undertaken as part of the primary research:
Confidential survey of Enterprise Ireland companies in receipt of CES between 2005 and
2010 (with variant for High Potential Start-Up (HPSU) firms); and
Confidential survey of Enterprise Ireland companies in receipt of both CES and Job
Expansion Fund.10
The survey questionnaires were designed to complement the existing data sources and enable
rigorous examination of a range of dimensions. Firms were able to complete the surveys online via
a secure encrypted link to an electronic version of the relevant questionnaire.11
A high level of
response was achieved on each of the survey streams set out in the table below.
Table 2.2: Summary of response rates to surveys
Survey Group – Firms Approved for Assistance through:
No. of
Survey
Distributed
/ Firms
Contacted
No. of
Responses
Response
Rate
(1) Company Expansion Supports (CES) (incl. HPSUs) 895 221 24.7%
(2) Company Expansion Supports and Job Expansion Fund 46 32 69.6%
(4) Total CES-assisted Firms from (1) and (2) above 941 253 26.9%
Source: Indecon
Consultations and engagement with assisted firms
In addition to the above survey research, further insights were gathered through a series of
focussed interviews with a sample of firms. In total, ten telephone-based interviews were
undertaken based on a sample of firms selected from among those who responded to the survey
and who agreed to participate in a follow-on interview. The discussions with firms focussed on
understanding the background and experience with applying for, and drawing down, CES and JEF
supports, the quality of interaction with and ongoing supports and guidance provided by Enterprise
Ireland, the evidence in relation to actual or anticipated impacts/outcomes, and their views on
any aspects of the design and delivery of the supports that could be improved.
The evaluations also benefited from detailed inputs provided by Enterprise Ireland throughout the
evaluation process. This included detailed discussions with Enterprise Ireland officials at the
10 Refer to separate evaluation of the Job Expansion Fund
11 The fieldwork for each survey stream was conducted during July 2013

10
outset of the evaluation, in addition to ongoing interaction and provision of inputs on both
programmes.
Counterfactual analysis of programme impact using control groups
A robust programme evaluation requires the examination of programme impacts compared to an
appropriate counterfactual reference group. A control group of non-assisted Enterprise Ireland
client firms is utilised as well as applying econometric modelling using a range of statistically
selected control groups.
For further detail on methodology please see the Technical Annex.
Inputs
Expenditure by constituent company expansion support client offer – 2005 – 2010
Between 2005 and 2010, a total of €311.5 million in CES was approved by Enterprise Ireland to
support 1,589 different firms (Table 2.3). The direct costs are broken down by category. The
largest of these is Company Expansions pre-2008 which accounts for 32.4 percent of approvals and
36.8 percent of payments. Combining this category with the Productivity Improvement Fund, the
Growth Fund and Company Expansions including R&D, these represent over 80 percent of approvals
and 79.5 percent of payments from 2005 – 2010.

EVALUATION OF BUSINESS DEVELOPMENT PROGRAMMES
11
Table 2.3: Value of grants approved (€) and grants paid (€) by company expansion
support client offer/constituent part 2005 - 2010
Client Offer/Constituent CES Part Amount
Approved (€)
% of
Total
Approved
Amount Paid
(€)
% of Total
Paid
Company Expansions pre 2008 100,977,150 32.4% 75,330,739 36.8%
Productivity Improvement Fund 66,211,163 21.3% 41,269,585 20.1%
Growth Fund 41,520,914 13.3% 23,647,500 11.5%
Company Expansions including R&D 41,741,964 13.4% 22,773,270 11.1%
Company Expansions (April 2008 - Jan 2009) 21,875,314 7.0% 16,192,089 7.9%
Recruitment of Key Manager Employment Grant
for SMEs 16,668,940 5.4% 10,575,353 5.2%
Strategic Consultancy 9,072,874 2.9% 6,509,597 3.2%
Company Expansions excluding R&D 6,243,659 2.0% 3,739,860 1.8%
Scaling including R&D (January 2009 - June
2012) 3,440,566 1.1% 1,950,964 1.0%
Job Expansion Fund (May 2010 - Jun 2011) 1,622,478 0.5% 874,402 0.4%
Commercial Terms 1,000,000 0.3% 1,000,000 0.5%
Investment De Minimis Established 721,000 0.2% 721,000 0.4%
Pre-Productivity Fund Consultancy 241,363 0.1% 149,829 0.1%
Scaling excluding R&D (January 2009 - June
2012) 201,986 0.1% 201,986 0.1%
Total 311,539,370 100.0% 204,936,174 100.0%
Source: Enterprise Ireland grant approvals data
It is important to stress from the outset that in most cases firms can only draw down supports after
they undertake expenditure on supported projects. This means that assisted firms must access
their own cash flows initially. Issues may arise if a firm’s cash flows are constrained (e.g., because
of the impact of the recession) and they may be forced to postpone projects - therefore funding
payments are impacted. It may also be the case that the recession impacts on the initial grant
level sought and approved, as firms may not apply to Enterprise Ireland for funding if they think
that they are unlikely to be in a position to draw down this funding within the stipulated time
periods. However, where the funding to the client is provided in the form of equity, this funding is
available upfront to assisted firms, thereby helping to ease cash flow constraints on expansion.

12
It is also important to note that the implications arising from Enterprise Ireland’s funding process
mean that the behavioural effect occurs at the approvals stage rather than the payment stage. In
practice, when a firm is approved for a grant by Enterprise Ireland, it is at this approvals stage
that the firm undertakes its expenditure on a project. After the firm’s own expenditure has been
incurred, Enterprise Ireland can then release funding to the firm.
On an annual basis, CES approvals and payments increased substantially in the early part of the
period under evaluation (Table 2.4). In 2006 and 2007 alone, nearly 50 percent of CES approvals
and payments were made. Approvals and payments have declined year on year and in 2010 only
€31,648,962 in grants were approved with €15,548,968 in payments made. The period in question
has also witnessed a steady decline in grants paid as a percentage of grants approved from 80
percent in 2005 to only 49 percent in 2010. This decline may have reflected the impact of the
recession on both the level of application for funding and the extent of drawdown of approved
funding.
Table 2.4: Value of grants approved and grants paid by year (€) - firms in receipt of
company expansion supports
Year Amount
Approved
% of Total
Approved Amount Paid
% of Total
Paid
Grants Paid as a
% of Grants
Approved
2005 31,744,651 10.2% 25,503,090 12.4% 80%
2006 87,680,472 28.1% 61,113,360 29.8% 70%
2007 60,333,558 19.4% 38,467,054 18.8% 64%
2008 57,911,015 18.6% 36,018,383 17.6% 62%
2009 42,220,713 13.6% 28,285,319 13.8% 67%
2010 31,648,962 10.2% 15,548,968 7.6% 49%
Total 311,539,370 100% 204,936,174 100% 66%
Source: Enterprise Ireland grant approvals data
The year of grant approvals and payments has implications for the evaluation of such grants. For
example, for a company that has been approved for funding in 2005, sufficient time will have
elapsed so that the impact of this grant will be measurable in terms of changes to exports and
employment in later years. However, this may not be the case (or may be less so) for a company
approved in 2010. For such firms there is a smaller evaluation window.
Programme indirect costs
In addition to programme direct costs, there are also indirect costs associated with the operation
of Enterprise Ireland’s CES. These costs relate to the human resource inputs provided by
Enterprise Ireland staff members who are engaged in the process of project screening and approval
(including development managers, development advisers, market advisers, technical assessors, and

EVALUATION OF BUSINESS DEVELOPMENT PROGRAMMES
13
human resource development advisers), as well as Enterprise Ireland overhead costs. The
estimates for indirect costs are presented in the table below for each year over the funding period
2005 to 2010. In total over this period, estimated indirect costs amounted to €17.6 million,
representing 5.6 percent of the overall value of CES funding approved.
Table 2.5 Enterprise Ireland indirect costs associated with approval of company
expansion supports - 2005-2010 - € million
2005 2006 2007 2008 2009 2010 Total
Estimated overall
EI Indirect Costs* €2.71 €3.95 €4.13 €3.37 €2.70 €0.69 €17.56
Source: Estimates derived based on data provided by Enterprise Ireland and Forfás. Estimated
overall indirect costs include costs related to staff time as well as overhead costs
Impact of recession on funding approaches
Before the recession, Enterprise Ireland’s CES offer related only to established companies seeking
to expand. However, since the recession, the criterion was changed with Enterprise Ireland also
considering applications from companies who were vulnerable but viable and supported them on
projects which helped sustain their business. This was a shift in strategy highlighted by Enterprise
Ireland. An increased focus and value is being placed on projects which create additional
employment as the recession has unfolded.
Enterprise Ireland also increased the amount of funding provided through equity funding (upfront
payment) versus grant funding (payment after expenditure has been incurred), with the objective
of easing cash flow constraints. The proportion of overall CES funding which was paid out via
equity increased from 18.3 percent in 2008 to 34.3 percent in 2010.
Status of company expansion projects
As part of the survey undertaken for this evaluation, firms were asked about the status of the
projects for which they have been approved. In almost 70 percent of cases, companies indicate
that their projects are fully completed. A further 26 percent of companies have started their
projects but, as yet, have not completed them. 3.1 percent have been cancelled with the
remaining 1.8 percent yet to start.
Among the most commonly cited factors that companies did not draw down funding included that
the anticipated level of business activity did not materialise; the economic downturn had delayed
the planned expansion; or the project was completed below the anticipated budget.
Private funding and funding leverage
An important factor impacting on overall funding efficiency is the extent to which supports can
leverage private funding through assisted firms’ own resources. Firms were asked to indicate the
proportion of the overall investment in company expansion projects that was funded by Enterprise
Ireland. While there is significant variation across firms, on average, the proportionate

14
contribution from CES funding was in the range of 24 percent-29 percent. This indicates that the
majority of investment in company expansion projects is funded through assisted firms’ own
resources and this suggests that CES is likely to have resulted in leveraging of private sources of
funding.
The fact that 32.5 percent of survey respondents indicated that they have received assistance in
the form of other grants during this period raises a number of issues in terms of programme
evaluation. An immediate concern relates to the added complexity that is evident if a company is
in receipt of a number of grant types and the resulting difficulty in identifying the effect (if any)
of one or other or both grants.
Outputs and activities
Programme activities describe the processes and tasks supported by Enterprise Ireland in
delivering the CES programme. These can be summarised as:
Support for firms in identifying suitable assistance measures;
Support for firms through grant application process;
Thorough review and decision making process by company expansion supports approving
committee;
Support for developing capacity in firms through investment in capital and technology
acquisition;
Support for developing capability within the firm through investment in people skills and
recruiting key staff; and
Support for implementation of growth plans including development of appropriate
structures and processes.
Programme outputs
Firms supported
Overall, a total of 1,589 different companies have been assisted by Enterprise Ireland through the
CES from 2005 to 2010. However, this masks the fact that firms can receive a number of CES grants
in the same year, as well as in multiple years, therefore Table 2.6 also highlights the number of
individual CES firms that are supported each year.
In summary, over the six-year period from 2005 to 2010, a total of €311.5 million in direct funding
was approved by Enterprise Ireland to support a total of 1,589 different firms. Further detail by
sector and company size is provided in Appendix I. Of the approved amounts, a total of €204.9
million was drawn down by assisted firms by 2012.

EVALUATION OF BUSINESS DEVELOPMENT PROGRAMMES
15
Table 2.6: Number of firms assisted through company expansion supports - 2005 – 2010
Year
Individual Company
Expansion Firms
Supported in Each Year
New Company Expansion
Firms Supported in Each
Year*
Cumulative Total Unique
Company Expansion Firms
Supported
2005 267 267 267
2006 448 376 643
2007 430 303 946
2008 448 305 1,251
2009 377 229 1,480
2010 177 109 1,589
Source: Enterprise Ireland grant approvals data. Notes: The new company expansion firms
supported in each year column does not include any firms that were also supported in previous
years.
The economic recession has impacted significantly on both the volume of approvals and the rate of
drawdown by companies from 2009 onwards. Companies have cited declining business activity and
cash flow constraints as factors explaining this decline. In total Enterprise Ireland staff time and
overhead-related indirect costs associated with funding approval amounted to €17.6 million,
representing 5.6 percent of the overall value of CES funding approved over this period.
The majority of investment in company expansion projects has been funded through assisted firms’
own resources, and this suggests that CES is likely to have resulted in leveraging private sources of
funding. Further analysis shows that, on average, 81 percent of firms in receipt of CES employ
fewer than 50 persons. Funding has also been approved across a diversified sectoral profile of
companies.
Impacts and outcomes
The impact of CES is undertaken using a range of methodologies, including:
Counterfactual analysis;
Assessment based on primary research surveys; and
Econometric modelling to estimate the net impact of supports.
Combining these strands of analyses enables conclusions to be drawn as to the impact and
effectiveness of the CES over the period 2005 to 2010.

16
Econometric analysis
Control groups
A range of possible control groups were considered, with the objective of understanding the
counterfactual, i.e., what would likely have occurred in the absence of the provision of supports
to assisted firms. Three different control groups were selected:
Propensity score matching (PSM) (Control Group 1) using various firm characteristics to
produce a range of results including, for example age, R&D spend, average wages, export
intensity, region etc.;
Based on the PSM analysis comparing the CES firms with companies that are almost exactly
matched based on a number of selection characteristics. This method essentially reduces
the size of the sample to only include observations that have clear matching observations
based on the chosen selection variables. (Control Group 2); and
Firms who were approved for the CES support but chose not to draw down any funding
(Control Group 3).
Through this analysis a range of results are produced. Each of the above methodologies has
strengths and weaknesses. On balance, the PSM methodology (Control Group 1) is considered the
most appropriate in the context of the firm population under evaluation, as it seeks to control for
selection bias effects.12
The baseline econometric results are summarised in Table 2.7.
Table 2.7: Summary of baseline results from econometric modelling of CES net impacts
% premium Employment Sales/Turnover Export Sales
Control Group 1 8.2% 12.0% 11.3%
Control Group 2 5.0% 2.4% 5.1%
Control Group 3 4.4% 5.1% 3.4%
Source: Indecon analysis
Employment
The results of applying the various estimated employment premiums due to the CES are shown in
Table 2.8. These are based on taking the average employment level of ‘treated’ firms (i.e.
companies that received company expansion supports) in pre-treatment period of 2002-2004. The
results indicate that between three and five incremental jobs are associated with firms who
received the treatment in the year of grant approval.
12 Selection effects may occur if the design of the scheme is specifically tailored to a certain type of
firm who are likely to perform better in terms of outcomes regardless

EVALUATION OF BUSINESS DEVELOPMENT PROGRAMMES
17
These results can be converted into an estimated grant cost per job by dividing by the average
grant amount in the sample. Again, these estimates range from €14,329 - €26,704.13
Table 2.8: Interpretation of outcomes from econometric modelling – employment impacts
Variable Control
Group 1
Control
Group 2
Control
Group 3
Average Employment (2002-2004) 65.55 65.55 65.55
Premium (due to CES support) 8.20% 5% 4.40%
No. of Jobs (due to support) per supported firm 5.4 3.3 2.9
Average Grant (€s) 77,018 77,018 77,018
Spend per Job (created or saved) (€s) 14,329 23,499 26,704
Source: Indecon analysis. Note: The estimated percentage premium is based on a midpoint
calculation of the results of the econometric modelling. Also, the average employment is based on
firms who are included in the econometric estimation.
Sales
The same approach can be applied to overall sales turnover. The overall sales levels of treated
firms in the pre-treatment period were significantly lower than non-supported firms. Also, there is
a wider range of estimates of sales premiums from the econometric modelling. This creates a
much wider variability in the estimates of the monetary increase in the level of sales for treated
firms. The estimates for sales indicate that treated firms were associated with incremental sales
of between €270,000 and €1.35 million compared with untreated firms. As these untreated firms
have been matched in terms of characteristics to the treated firms, these sales premiums are
considered as being directly associated with the provision of CES (Table 2.9)
13 The enterprise agencies also report a cost per job sustained in their annual report. The cost per job
sustained is calculated on a consistent basis across the agencies and takes into account all agency
expenditure on all firms in the period. Only jobs created during, and sustained at the end of each
seven year period are credited in the calculations

18
Table 2.9: Interpretation of outcomes from econometric modelling – sales turnover
impacts
Variable Control
Group 1
Control
Group 2
Control
Group 3
Average Sales (€000s) 11,229 11,229 11,229
Premium (due to CES support) 12.0% 2.4% 5.1%
Increase in Sales (due to support) per supported firm
per year (€000s) 1,347.5 269.5 572.7
Source: Indecon analysis. Note: The estimated percentage premium is based on a midpoint
calculation of the results of the econometric modelling.
Export Sales
The final outcome variables examined are the impact of the treatment on export sales. As noted
previously, not all of treated firms will be exporters. The higher level of export sales for the
treated firms lies between €200,000 and €750,000 in the year of treatment (Table 2.10).
Table 2.10: Interpretation of outcomes from econometric modelling – export sales impacts
Variable Control
Group 1
Control
Group 2
Control
Group 3
Average Export Sales (€000s)* 6,568 6,568 6,568
Premium (due to CES support) 11.3% 5.1% 3.4%
Average Increase in export sales (due to support) per
supported firm per year (€000s) 742.2 334.9 223.3
Source: Indecon analysis. Note: the percentage premium is based on a midpoint calculation of the
results from the econometric modelling. *Note only include firms who indicated some level of
export sales between 2002 and 2004. Also, note that the exports are based on mean exports.
Estimated implied levels of deadweight
Using the econometric analysis of premiums associated with firms that received a CES support, it
has been possible to derive an estimate for deadweight. The total impacts are based on taking the
average percentage premium in the year of support (Table 2.11).

EVALUATION OF BUSINESS DEVELOPMENT PROGRAMMES
19
Table 2.11: Estimates of Deadweight based on PSM model (Control Group 1) (2005-2010)
Outcome variable Additionality
A
Total Impact
B
% Additionality
A divided by B *100 % DWL
Employment 8.2% 28% 29.3% 70.7%
Sales/Turnover 12.0% 39% 30.8% 69.2%
Export Sales 11.3% 47% 24.0% 76.0%
Source: Indecon analysis.
Summary of findings from econometric modelling
The key findings from the modelling undertaken include:
Overall, it was found that the CES has had a positive impact on the outcomes for the firms
that it has supported.
Analysis of the preferred PSM model (control group 1) indicates an employment premium of
approximately 8.2 percent for CES-assisted firms. This indicates that for every incremental
job that was created, the associated average cost in grant payments was around €14,000.
The fundamental aims of the CES are to increase sales and stimulate employment growth
within assisted firms. The results of the detailed econometric modelling suggest that the
CES supports incremental sales, indicating that firms increased overall sales by about 12
percent in net terms (i.e., in terms of additionality after adjusting for deadweight) and
export sales by approximately 11 percent in comparison to non-assisted firms.
Cost benefit analysis
Modelling approach and assumptions
The approach applied in the cost benefit analysis (CBA) model involved utilising data on CES
funding costs over the period 2005 to 2010, together with estimates of the indirect costs
associated with provision of these supports.14
Economic benefit metrics cover the period 2005-2012
inclusive and measures the following benefit components:
15
Direct expenditure on wages and salaries/payroll;
Indirect expenditure on wages and salaries/payroll (utilising multiplier impacts);
Irish profits;
Taxes on direct and indirect payroll;16
and
14 Sourced from the Enterprise Ireland grants database
15 See Murphy, Anthony; Walsh, Brendan M.; and Frank Barry, The economic appraisal system for
projects seeking support from the industrial development agencies, Forfás, 2003 16 The net contribution to overall benefits arising from payroll and taxes is adjusted to avoid double-
counting of payroll and related tax receipts

20
Reduction in deadweight burden of taxation via payroll taxes.
A number of assumptions governing key parameters have been applied, which are consistent with
the latest guidance from the Department of Public Expenditure and Reform (see Appendix II for
further detail on CBA assumptions).
Application of econometric results
The Benefit-Cost Ratio (BCR) has been set out based on three alternative scenarios on net impact
informed by the econometric modelling (Table 2.12)
Central Scenario (6.6 percent): takes the average of the central estimates from the PSM
model and the ‘matched’ panel data model;
High-Impact Scenario (8.2 percent): based on central estimates from the PSM model; and
Low-Impact Scenario (4.4 percent): based on the central estimates from the ‘selected’
control group analysis of companies who were approved for CES support but did not
drawdown any funds as a control group.
Table 2.12: Cost-benefit analysis of Enterprise Ireland company expansion supports (2005-
2010) - summary
Benefit-Cost Ratio (BCR) (X : 1)
Impact Scenarios
CES-assisted Firm Cohort/Year Central Low Impact High Impact
2005 2.09 1.84 2.26
2006 4.22 3.94 4.41
2007 1.24 1.02 1.39
2008 2.99 2.68 3.20
2009 2.02 1.63 2.30
2010 1.39 1.11 1.59
2005-2010 - Weighted Average 2.81 2.55 3.00
Scenario - net impact on employment – econometric
modelling 6.6% 8.2% 4.4%
Weighted average BCRs based on applying share of overall CES funding approved (2005-2010) in each year.
The results show positive BCRs for each cohort of firms assisted and across each of the central,
high-impact and low-impact scenarios, indicating that CES provided during the period 2005-2010
have delivered a net economic return. The low-impact scenario also indicates that the outcomes
remain robust in the face of a lower assumption on net payroll-related impacts. An average BCR is

EVALUATION OF BUSINESS DEVELOPMENT PROGRAMMES
21
calculated, which is weighted according to the share of overall CES funding approved in each year.
This indicates an overall BCR of 2.81:1 over 2005-2010 under the central scenario.
Firm survival
In addition examining impacts in terms of cost-benefit, an important issue concerns the extent to
which firms are surviving or ceasing to trade, particularly given the context of recession in the
Irish economy since 2008/09.
Analysis indicates that of the total of 1,589 firms assisted by CES between 2005 and 2010, 303 have
ceased trading, implying an exit rate of 19.1 percent or a survival rate of 80.9 percent.17
Of the
exits, it is notable that 82.8 percent of these occurred between 2009 and 2012, most likely
reflecting the impact of the recession on trading conditions. By comparison, the analysis of the
non-assisted cohort of Enterprise Ireland client firms indicates that a total of 1,575 exits occurred
out of an overall total of 4,322 firms, implying an exit rate among this cohort of 36.4 percent or an
implied survival rate of 63.6 percent.
Findings from primary research among firms
In addition to the detailed analyses and modelling presented previously, primary research among
assisted firms was undertaken with the objective of complementing the data sources and capturing
firms’ views on a range of aspects. This section sets out the findings in relation to the impact of
the supports, deadweight and displacement, and the extent of satisfaction among firms in relation
to the processes surrounding delivery of the supports.
Programme impact
The impacts of supports were examined through the following measures, based on firms’ views:
the significance or otherwise of CES in contributing to increased Export Sales;
the levels of Export Sales which firms believed they would likely have sustained relative to
current levels in the absence of CES;
the significance or otherwise of CES in contributing to increased Employment;
the levels of Employment which firms believed they would likely have sustained relative to
current levels in the absence of CES; and
the wider impacts and benefits of CES supports.
Export sales impacts
Almost two-thirds (65.8 percent) of firms responding to the survey indicated that CES played a
significant or very significant role in contributing to increased export sales. Only 7.7 percent of
firms stated that CES had no impact on export sales.
17 The figures include firms that have been acquired or merged with other entities, as these have not
ceased trading

22
In terms of quantifying the impacts on assisted firm performance, the table below summarises the
findings from the survey research in relation to the levels of Export Sales which firms believed they
would likely have sustained relative to current levels in the absence of CES. A range of impacts
are evident from the responses, with 75 percent of respondents overall indicating that their export
sales would have been lower than their current level in the absence of funding. However, it is
estimated that on a weighted average basis, export sales among assisted firms would on average
have been approximately 18.3 percent below their current levels in the absence of CES.
Table 2.13: Estimated export sales that would have been sustained without CES funding
In the absence of Company Expansion Support funding,
what level of export sales do you believe your business
would have sustained relative to current levels?
% of Respondents
Same as Current Level 25.0%
Lower than Current Level 75.0%
Of which:
5-10% Lower 12.7%
11-20% Lower 22.6%
21-30% Lower 20.3%
31-50% Lower 17.0%
50-100% Lower 2.4%
Total 100%
Weighted Average % Lower Export Sales* 18.3%
Source: Company Survey. Note: Estimated on basis of assuming the midpoints in each of the
ranges indicated multiplied by the percentage response in each range.
Employment impacts
Table 2.14 summarises the results in relation to firms’ views on the significance or otherwise of
CES in contributing to increased workforce/employment levels. The research indicates that 79.3
percent of firms considered that CES has had a significant or very significant impact on
employment levels in their firm. Less than 5 percent indicated that CES had no impact on
employment levels.
As in the case of export sales, firms have reported a range of estimates, with 79.5 percent of firms
overall indicating that their workforce levels would have been lower in the absence of the
supports. Indecon estimates that on a weighted average basis employment levels would have been
approximately 18 percent below current levels if firms had not received CES.

EVALUATION OF BUSINESS DEVELOPMENT PROGRAMMES
23
Table 2.14: Views of firms on estimated workforce/employment levels that would have
been sustained in the absence of CES funding
In the absence of Company Expansion Support funding, what level of
workforce/employment do you believe your business would have
sustained relative to current levels?
% of Respondents
Same as Current Level 20.5%
Lower than Current Level 79.5%
Of which:
5-10% Lower 15.5%
11-20% Lower 25.1%
21-30% Lower 18.7%
31-50% Lower 19.6%
50-100% Lower 0.5%
Total 100%
Weighted Average % Lower Employment* 18.1%
Source: Company survey. * Estimated on basis of assuming the midpoints in each of the ranges
indicated multiplied by the % response in each range.
Wider impacts and benefits of Company Expansion Supports
Figure 2.2 sets out reported wider benefits arising from CES supports. A high proportion of firms
indicated that CES assisted them across a range of areas, including:
Increasing the strategic ambitions of the company, with 75 percent reporting a significant or
very significant impact;
Contributing to the overall viability of the company, where 72 percent indicated that CES
played a significant or very significant role;
Assisting in entering new (export) markets, with 67 percent indicating that CES had a
significant or very significant impact; and
Developing new products – where 64 percent of firms stated that CES had a significant or
very significant impact.
In addition, a majority of firms in each case indicated that CES had played a significant or very
significant role on aspects such as encouraging investment in R&D and innovation, enhancing
management capability, and improving the skills base of employees, while proportions also
indicated significant impacts in relation to improving productivity and cost competitiveness, and
helping to identify and respond to commercial risks.

24
Figure 2.2: Significance of reported wider impacts of company expansion supports on firm
performance
Source: Company survey
Another important aspect in the context of the current external environment facing firms concerns
the extent to which the provision of CES by Enterprise Ireland may have helped assisted firms to
weather the economic downturn/recession. In this regard, it is notable that 71.4 percent of CES-
assisted firms surveyed were in agreement that these supports have helped their businesses to
weather the negative consequences of the recession.
Survey estimation of deadweight and displacement
Deadweight
As presented earlier, deadweight was measured through econometric analysis. However, it is
important to distinguish between ‘full/pure’ and ‘partial’ deadweight in order to understand in
what way the project may have progressed in the absence of support.18
This therefore
complements the econometric measurement of deadweight by providing a deadweight range.
Partial deadweight occurs through any one of the following possibilities, or a combination thereof:
Where the firm would have proceeded with the project but at a later date;
Where the firm would have proceeded with the project but at a different location; and
Where the firm would have proceeded with the project but on a reduced scale.
18 See, for example, Lenihan, H., and Mark Hart (2003), Evaluating the impact of Enterprise Ireland
assistance: methodological considerations when estimating deadweight and displacement, University
of Limerick (see: http://hdl.handle.net/10344/3142); and Lenihan, H. (2004), ‘Evaluating Irish
industrial policy in terms of deadweight and displacement: a quantitative methodological approach’,
Applied Economics, 36, 229 – 252
75.1%
71.9%
66.7%
63.6%
62.0%
59.0%
55.8%
44.0%
41.8%
35.3%
0.0% 20.0% 40.0% 60.0% 80.0%
Assisted increasing strategic ambitions for thecompany
Contributed to overall viability of the company
Assisted company to enter new markets
Assisted in developing new products
Encouraged investment in research, development andinnovation
Enhanced management development and capability
Improved skill base of employees
Improved productivity (work processes andefficiencies)
Improved cost competitiveness
Helped to identify and respond to commercial risks

EVALUATION OF BUSINESS DEVELOPMENT PROGRAMMES
25
Firms were asked to provide an indication of their likely actions in the absence of Enterprise
Ireland Company Expansion Supports (Table 2.15). The results indicate that 11.5 percent of firms
would have undertaken the expansion project unchanged. Thus, it can be deduced that 11.5
percent represents an estimate of the extent of full deadweight attached to the provision of CES
to firms during the period 2005-2010. It is also found that 17.3 percent of firms indicated that
they would not have undertaken any expansion project without the assistance of Enterprise Ireland
CES, which would imply zero deadweight among these firms. A substantial proportion of firms
indicated various outcomes that would suggest varying degrees of partial deadweight, including:
22.1 percent of firms would have gone ahead with the expansion but at a reduced
scale/size;
13.3 percent of firms would have gone ahead with the expansion but at a later date;
4.9 percent of firms would have gone ahead with the expansion but at a different location;
and
31 percent of firms indicated that they would likely have pursued some combination of the
above outcomes.
Table 2.15: Views of firms on likely courses of action in absence of Company Expansion
Supports
In the absence of Company Expansion Support funding from Enterprise Ireland,
which of the following courses of action do you believe your company would
most likely have undertaken?
% of
Respondents
a) Would have gone ahead with the expansion project unchanged, i.e., on the
same scale, time and location 11.5%
b) Would have gone ahead with the expansion but at a different location (e.g.
outside of Ireland) 4.9%
c) Would have gone ahead with the expansion but at a later date (i.e.
delayed the expansion) 13.3%
d) Would have gone ahead with the expansion but at a reduced scale/size 22.1%
e) Combination of (c) and (d) above 31.0%
f) Would not have undertaken any expansion 17.3%
Total 100%
Weighted Average Estimate of Deadweight 47.1% - 75.6%*
Source: Company survey * Weighted average estimates derived through assuming category (a)
equates to 100 percent deadweight, category (f) denotes zero deadweight, whiles alternative
scenarios relating to categories (b) to (e) were assumed, where these equate to 50 percent, 70
percent and 90 percent deadweight.

26
Given the timeframe of this evaluation (covering the period 2005-2010), many firms genuinely may
not be in a position to accurately recollect the context prevailing at an earlier date or to provide a
reasonable judgment on likely alternative courses of action.19
Certain assumptions have been
made regarding the likely levels of deadweight applying to the intermediate/partial deadweight
categories. Applying this approach, the overall level of deadweight is estimated at between 47.1
percent and 75.6 percent. This compares with estimates of deadweight pertaining to employment
and export sales developed from the econometric modelling presented earlier in this section of
between 69 percent and 76 percent. It should also be noted that the existing appraisal system
applied by the development agencies in ex ante appraisal of projects recommends utilising an
assumption for grant deadweight of between 70 percent and 80 percent for expansion projects.20
Displacement
Displacement refers to the possibility that provision of assistance to one firm could displace sales
or employment in other firms in the national economy. This may occur even in a situation where
there is judged to be zero deadweight, meaning that displacement could also reduce the overall
level of additionality arising from the provision of supports.
The issue of displacement is assessed by seeking information from assisted firms on the following
dimensions as part of the survey research:
The proportion of business’s main competitors that are based on Ireland;
The extent to which CES contributed to the business increasing its market share; and
The extent to which any increase in market share has been at the expense of (a) other Irish-
based companies and (b) competitors based overseas.
On average firms indicated that between 10 percent and 31.6 percent of their competitors were
based in Ireland. This suggests that for firms assisted by Enterprise Ireland’s CES, the majority of
their competitors are based overseas. This limits the extent to which an increase in sales of
assisted firms is likely to be at the expense of domestic competitors.
Extent of overlap with other supports
Another aspect of Enterprise Ireland’s CES examined concerns the degree to which they are
complementary to and/or interact with other business development supports on offer from
Enterprise Ireland. This is important from the perspective of ensuring that each support type is
correctly targeted and duplication is minimised, and also in order to assess whether there may be
certain synergies that can be fostered or achieved in the future operation of the programme.
The survey findings show that the majority (62.2 percent) of responding firms are of the view that
CES represent one component of a range of inter-related and integrated business supports
provided by Enterprise Ireland. While 12.4 percent believe CES are independent initiatives with no
relationship to other Enterprise Ireland supports, 21.7 percent consider that CES have some
19 For example, it would be necessary to reach judgment on complex dimensions such the extent of any
delays on implementing expansion projects, the extent to which the scale of a project may have been
reduced, or the nature of any alternative location (including whether in Ireland or in another
jurisdiction)
20 See Murphy et al, Op. Cit., page 54

EVALUATION OF BUSINESS DEVELOPMENT PROGRAMMES
27
synergies/ and/or complementarities with other Enterprise Ireland supports. It is notable that
only 3.7 percent of firms were of the view that there is significant duplication/overlap between
CES and other Enterprise Ireland business supports.
Table 2.16: Views of firms on extent to which CES interact with and complement other
business supports or grants provided by Enterprise Ireland
Extent to which CES Interact with and Complement Other Business
Supports or Grants Provided by Enterprise Ireland: % of Respondents
CES are independent initiatives with no relationship to other EI business
supports 12.4%
CES are one component of a range of inter-related and integrated business
supports provided by EI 62.2%
CES have some synergies/complementarities with other EI business supports 21.7%
There is significant duplication/overlap between CES and other EI business
supports 3.7%
Total 100%
Source: Company survey
Satisfaction levels among assisted firms
Levels of satisfaction or otherwise among firms with the quality and delivery of these supports
were considered in terms of the following aspects:
The quality of interaction with the Enterprise Ireland team involved in development of
company investment proposals;
The design of the support;
The administrative process associated with applying for the support;
The administrative processes associated with claiming payment following funding approval;
and
The quality of support available to firms in relation to ongoing queries etc.
The findings indicate that overall a very high proportion of firms assisted through CES are satisfied
or very satisfied with the level and quality of interaction with Enterprise Ireland. In relation to
the extent to satisfaction with the process of applying for funding versus the process of drawing
down funding, a minority of companies indicated that the overall cost of the claims process as a
factor. However, as shown in Table 2.17, at an overall level, there is no evidence to suggest a
statistically significant variation in satisfaction levels between the application process and
subsequent process of drawdown of approved funding.

28
Table 2.17: Extent of Satisfaction/Dissatisfaction of Firms with Level and Quality of
Interaction with Enterprise Ireland with Regard to Company Expansion
Supports
Extent of
Satisfaction/Dissatisfaction
% of Respondents
Very
Satisfied Satisfied
Neither
Satisfied
Nor
Dissatisfied
Dissatisfied Very
Dissatisfied
Interaction with EI team
involved in development of
your company’s Investment
Proposal
60.2% 23.9% 11.1% 3.1% 1.8%
Design of the support 37.4% 43.2% 13.1% 4.1% 2.3%
Administrative process
associated with applying for
the support
33.5% 40.2% 15.6% 6.7% 4.0%
Administrative processes
associated with claiming
payment
38.1% 36.8% 13.9% 5.4% 5.8%
Support for queries etc. 41.0% 41.9% 14.4% 0.5% 2.3%
Source: Company survey
Conclusions and findings
Appropriateness
The policy context for this evaluation of Enterprise Ireland’s Company Expansion Supports has
been influenced strongly by the changing external economic environment. During the 2005 to 2008
period, the emphasis was on addressing deficiencies in the existing industrial base in Ireland
(including for example the high cost base and decreasing international competitiveness) by
promoting RD&I, marketing and management capabilities and skills, and continuing to develop new
export market opportunities. The objectives of Enterprise Ireland’s CES were appropriate within
this earlier context.
In the context of the economic downturn post 2007, enterprise policy explicitly set out the need to
return to a model of export–led growth. Targeted and tailored supports, such as Enterprise
Ireland’s CES, which are designed to enhance the capabilities of indigenous SMEs planning
significant expansions through export market development and associated employment creation,
are appropriate to realising this policy objective. A further rationale for state intervention though
CES post-2008 is that these supports should enable SMEs to access funding in an environment
where traditional commercial funding markets have become dysfunctional due to the problems
facing the Irish banking sector.

EVALUATION OF BUSINESS DEVELOPMENT PROGRAMMES
29
Overall, taking into account the rapidly evolving economic and policy context over the period
relevant to this evaluation, it is reasonable to conclude that Enterprise Ireland’s CES have been,
and continue to be, aligned with and appropriate to national economic and enterprise policy.
Programme funding and efficiency
Over the six-year period from 2005 to 2010, a total of €311.5 million in company expansion support
funding was approved by Enterprise Ireland to a total of 1,589 different firms. Of the funding
approved, a total of €204.9 million was drawn down by assisted firms by 2012. CES funding has
been spread across firms of different size, with on average 81 percent of participating firms
employing fewer than 50 persons, while supports have also been approved across a diversified
sectoral profile of companies. The economic recession appears to have impacted significantly on
both the volume of approvals and the rate of drawdown by companies from 2009 onwards. These
factors may have the effect of delaying anticipated impacts from supports provided in the latter
years of the evaluation period.
An important factor impacting on overall funding efficiency is the extent to which supports can
leverage private funding through assisted firms’ own resources. It is notable in this respect the
majority of investment in company expansion projects has been funded through assisted firms’
own resources.
Programme effectiveness
The assessment of programme net impacts suggests that Enterprise Ireland’s CES have been
effective, in that the funding provided has delivered strong performance among assisted firms in
terms of sales, exports and employment.
The initial analysis of comparative performance, based on a counterfactual relating to a control
group of non-assisted Enterprise Ireland client companies, suggests that CES-assisted firms
significantly outperformed in terms of export and employment growth, while they also appear to
have weathered the recession better than non-assisted firms. On average for firms assisted by CES
between 2005 and 2010, the analysis suggests a positive employment growth differential in favour
of supported companies, amounting to 8.1 percent.
The rigorous econometric modelling, using a range of statistically selected control groups,
indicated that, overall, CES has had a positive net impact on the outcomes for the firms that it has
supported. The results indicate that supported firms increased overall sales of up to
approximately 12 percent and export sales of up to approximately 11 percent in net terms in
comparison to non-assisted firms. In addition, the preferred model indicated an employment
premium – or net additionality after deadweight – of up to approximately 8 percent for CES-
assisted firms compared with the counterfactual, implying an average cost per job of around
€14,000.
The analysis considered the extent to which firms are surviving or ceasing to trade, particularly
given the context of the recession since end 2007. An overall survival rate of 80.9 percent is
evident among firms assisted by CES over the period 2005-2010, which compares favourably with
the survival rate of non-assisted Enterprise Ireland clients of 63.6 percent. Of those firms that
ceased to operate, it is notable that 82.8 percent of these occurred between 2009 and 2012, most
likely reflecting the impact of the recession on trading conditions.
Based on primary research among assisted firms, the estimated overall level of deadweight is at
between 47.1 percent and 75.6 percent. This compares with higher estimates of deadweight

30
pertaining to employment and export sales developed from the econometric modelling of between
69 percent and 76 percent.
CES-assisted firms’ competitors are primarily international rather than domestic. In addition,
while firms indicated that CES has had a significant impact in terms of helping to increase market
shares, they also stated that a low proportion of this has been at the expense of domestic/Irish
competitors, suggesting that the extent of displacement arising from the provision of CES is likely
to be low.
The CBA of the CES found a positive overall benefit-cost ratio for firms assisted in the period
between 2005 and 2010 of 2.81:1 (based on a central impact scenario), indicating that the CES
have delivered a positive net economic return.
In terms of wider impacts and benefits, the research showed that a high proportion of firms
indicated that CES assisted them across a range of areas, including increasing the strategic
ambitions of the company; contributing to the overall viability of the company; and assisting in
entering new (export) markets and in developing new products.
High levels of satisfaction are also found among Enterprise Ireland client firms in relation to the
operation and delivery of CES, in terms of the quality of interaction with the Enterprise Ireland
team involved in development of company investment proposals; the design of the supports; the
administrative process associated with applying for the supports; the administrative processes
associated with claiming payment following funding approval; and the quality of support available
to firms in relation to ongoing queries etc.
Synergies/overlap
Research among assisted firms indicated that the majority of CES-assisted firms consider that CES
represent one component of a range of inter-related and integrated business supports provided by
Enterprise Ireland, while over one-fifth of companies indicate that CES have some
synergies/complementarities with other Enterprise Ireland supports. Only 3.7 percent of firms
were of the view that there is significant duplication/overlap between Company Expansion
Supports and other Enterprise Ireland business supports.
An issue in relation to the objectives of the CES concerns the extent to which they are clearly and
precisely specified. The overall rationale for the provision of expansion supports is clear, namely
to create employment and support indigenous companies to grow their companies and increase
their exports. However, the precise role played by each of the wide range of constituent
measures, and how these are designed to interact within the tailored packages provided to client
firms, may not be sufficiently clear.
It would be important that the setting of programme objectives is informed by the application of
‘SMART’ (Specific, Measurable, Achievable, Relevant and Time-bound) principles, to ensure clarity
in relation to intended role and targeting of each measure, to minimise potential overlap with
other supports, and to facilitate ongoing evaluation of outputs and outcomes against appropriate
targets.
Overall conclusion
Enterprise Ireland’s suite of CES appears to be functioning effectively and delivering on objectives.
The evaluation suggests that CES funding provided over the period 2005 to 2010 has resulted in
positive outcomes and net impacts in terms of export sales and employment growth. Assisted

EVALUATION OF BUSINESS DEVELOPMENT PROGRAMMES
31
companies also report significant wider benefits, including that the supports have helped their
businesses to weather the impact of the current recessionary environment, and generally high
levels of satisfaction with the design and delivery of the supports.
Recommendations
Notwithstanding the fact that the CES are delivering on objectives and have been found to be
appropriate and effective, there are a number of recommendations aimed at enhancing the
programme monitoring and processes.
Objectives and connection to EI strategy and national policy objectives
An aspect which this evaluation highlighted concerns the extent to which the objectives of the CES
are clearly and precisely specified. The overall rationale for the provision of company expansion
supports is clear, namely to create employment and support indigenous companies to grow their
companies and increase their exports. However, that the precise role played by each of the wide
range of constituent measures may not be sufficiently clear. This is most notable in the case of
tailored company expansion packages, which represent the main channel through which expansion
supports are delivered by Enterprise Ireland, where existing documentation is limited. This is an
important area where future programme design and monitoring systems would benefit from
enhanced detail to facilitate ongoing evaluation.
Recommendation
Set programme specific objectives informed by the application of ‘SMART’ (Specific,
Measurable, Achievable, Relevant and Time-bound) principles, to ensure clarity in relation
to intended role and targeting of each measure, to minimise potential overlap with other
supports, and to facilitate ongoing evaluation of outputs and outcomes against appropriate
targets.
Also as part of the evaluation, a review was undertaken of the extent to which the CES
programmes are aligned with national enterprise policy, and whether the objectives of the
supports remain valid and appropriate given the present economic and policy context. It was
concluded that taking into account the rapidly evolving economic and policy context, the
programmes are broadly aligned with and remain appropriate in the context of national economic
and enterprise policy. This is evidenced particularly in the increased focus given to employment
creation and expansion of exports within the aims and objectives of the supports. However, while
there is a broad consistency in terms of high-level objectives, there is an absence of a sufficiently
clear connection between individual measures, Enterprise Ireland’s corporate strategy and
national policy.
Recommendation
At programme design stage (and subsequent modifications) explicitly document the
connection between the programme and its objectives and national policy in order to
facilitate effective ongoing evaluation.
Application and drawdown processes
As part of the engagement with firms assisted under the CES programmes, an issue that was
highlighted in survey research and interviews by a number of firms concerns the processes around
application for, and drawdown of, funding approved. In discussing these aspects with assisted

32
firms, the vast majority of firms acknowledge the need to rigorous systems to ensure proper
governance around the operation of publicly funded supports. However, a number of firms also
highlighted the extent of paperwork/documentation required and queried whether this could be
streamlined. They also noted that the online/web-based application process could be difficult to
navigate and complete. It was noted that while the approval process typically involved a two-to-
three-month period, the overall process involved in accessing funds could take significantly longer.
Where smaller levels of funding were involved, this was seen by some firms as being
disproportionate and could impact on firms’ incentive to apply for funding in the future while also
impacting on cash flows.
Understandably, these are issues facing all companies but are more commonly raised among
smaller companies, where the time and costs involved in preparing funding applications and
subsequently in submitting documentation required to claim approved funding can appear
disproportionate given their size, whereas larger firms and firms that have had a longer-term
relationship with Enterprise Ireland tend to be more experienced in managing these processes. It is
accepted that there is the need to ensure that appropriate procedures are applied in the approval
and drawdown of publicly funded supports such as those provided under the CES.
Recommendation
Examine the scope to further streamline the processes, particularly around the drawdown of
approved funding, to help speed up access to funding and to minimise cash flow
implications for companies.
Additional advice during implementation phase
A wider issue also highlighted concerns the ‘softer’, non-financial aspect of provision of CES. This
was particularly the case among smaller firms and firms with no previous experience of working
with Enterprise Ireland, where it was often felt that they lacked the knowledge and experience
required to prepare funding applications and to maximise the successful implementation of
projects. In many cases perceptions and levels of satisfaction among assisted firms was also
influenced significantly by their relationship with their Enterprise Ireland DA.
Recommendation
Consider providing appropriately targeted further support and guidance during funding
application and implementation stages to address issues raised and enhance the overall
prospects for successful implementation of projects. It is accepted, however, that any
additional supports would be subject to resource constraints.

EVALUATION OF BUSINESS DEVELOPMENT PROGRAMMES
33
Appendix I – CES firms by size and sector
CES Firms by company size
The majority of firms assisted under CES, in all years, employ fewer than 100 people and over 75
percent of firms supported employ fewer than 50 people. Another potentially important feature is
the growth in the proportion of the smallest firms’ category, i.e., those employing one to nine
people. In 2005, just over 30 percent of firms supported employed from one to nine staff. This has
increased to over 40 percent in 2010. Overall, a trend can be seen towards smaller firms within
this data.
Number of Companies by Company Size – Firms in Receipt of Company Expansion Supports –
2005 - 2010
Company Size
(Employment) 2005 2006 2007 2008 2009 2010
Average 2005 -
2010
1 to 9 30.6% 27.4% 34.7% 41.1% 37.4% 41.7% 35.5%
10 to 49 49.6% 49.1% 47.1% 44.6% 44.1% 37.5% 45.3%
50 to 99 14.5% 16.3% 13.8% 9.1% 12.3% 10.7% 12.8%
100 to 250 4.0% 5.2% 4.1% 3.5% 5.3% 7.7% 5.0%
250+ 1.2% 1.9% 0.2% 1.6% 0.8% 2.4% 1.4%
Total 100% 100% 100% 100% 100% 100% 100%
Source: Enterprise Ireland grant approvals data and Annual Employment Survey data. Notes:
Companies for which data is not available through the Annual Employment Survey are not included
in the table. Data relates to the value of approvals.
Assisted company sector
An analysis of the sectoral profile of firms assisted by CES is provided in the following table,
showing the proportionate breakdown of the value of grants approved between 2005 and 2010.
The analysis indicates a diversified sectoral profile of companies assisted by Enterprise Ireland’s
CES. Among the main sectors in which CES-assisted firms have been supported include food and
drinks (21 percent of funding approved between 2005 and 2010), software and construction and
engineering (each accounting for 18 percent of approvals), electronics, consumer products and
internationally traded services (each representing 7 percent of approvals, and life
sciences/cleantech (5 percent of approvals).

34
Analysis of Characteristics of Grant Approvals – Share of Value of Grant Approvals by Company
Sector – Firms in Receipt of Company Expansion Supports
Sector 2005 2006 2007 2008 2009 2010 2005 - 2010
Food and Drinks 17% 35% 18% 31% 20% 6% 21%
Life Science /
Cleantech 2% 3% 3% 3% 15% 2% 5%
Electronics 8% 8% 4% 6% 7% 8% 7%
Construction
and Engineering 16% 18% 27% 24% 9% 14% 18%
Internationally
Traded Services 7% 8% 4% 4% 7% 12% 7%
Software 25% 9% 22% 16% 22% 14% 18%
Consumer
Products and
Other Misc
Manufacturing
10% 7% 10% 8% 4% 1% 7%
Other 4% 1% 1% 1% 3% 5% 3%
Sector
Unknown* 10% 11% 11% 8% 14% 36% 15%
Total 100% 100% 100% 100% 100% 100% 100%
Source: Enterprise Ireland grant approvals data and Annual Business Survey of Economic Impact
Data* ‘Sector Unknown’ relates to where data from the ABSEI does not identify the sector of the
respondent firm.

EVALUATION OF BUSINESS DEVELOPMENT PROGRAMMES
35
Appendix II CBA Assumptions
The CBA model includes assumptions in relation to parameters including the discount rate, shadow
cost of public funds, shadow price of labour, tax rate on labour incomes, income multipliers, and
deadweight. Multiplier impacts on payroll are calculated using NACE sector income multipliers
derived by Indecon using input-output analysis.21
The approach applied was to complete a separate CBA on each cohort of firms assisted by CES in
each of the years 2005 to 2010. The costs associated with each cohort included the value of grant
approvals to assisted firms in the cohort year and any CES approvals in subsequent years up to
2010, in addition to the estimated Enterprise Ireland indirect costs associated with the provision of
these supports. These costs are adjusted to reflect the shadow cost of public funds.
Cost-Benefit Analysis
Variable Level Assumed
Discount Rate 5%
Shadow Cost of Public Funds 130%
Shadow Price of Labour 80%
Tax Rate on Payroll/Labour 35%
Payroll Multiplier22 1.09 to 2.17, depending on sector
Deadweight - applied to Employment Factored into Scenarios on Net Impacts
Deadweight - applied to Irish profits23
70%
Source: DPER guidance and Indecon sectoral data and econometric modelling
On the benefits side, the annual incremental increase in payroll relative to a counterfactual
scenario is calculated by reference to the net impact (after deadweight) of CES supports on
employment, estimated from Indecon’s econometric modelling.24
Alternative scenarios on payroll-
related impacts are modelled, based on the range of econometric estimates developed.
21 Indecon’s sectoral data on the Irish economy includes Type I and II multipliers for output, GVA,
incomes, and employment. These have been derived from the CSO’s Supply and Use and Input-Output
Tables for the Irish Economy
22 In line with DPER guidance, multipliers applied relate to indirect impacts only and exclude induced
impacts
23 Deadweight related to payroll-related benefits is taken into account in the estimates of net impact
derived from Indecon’s econometric modelling
24 It is assumed for the purposes of the CBA model that the estimated net impact of supports on payroll
equates with the estimated net impact on employment

36
Payroll-related benefits are adjusted to reflect the shadow price of labour, while tax benefits are
adjusted to take into account the shadow cost of public funds.25
Irish profits are also included and
these are subject to the shadow price of labour and deadweight, as recommended in the appraisal
system for assessing projects used by the development agencies. 26
Benefits for each cohort were
measured up to the year 2012.
25 The application of the shadow cost of public funds to the additional payroll-related taxation reflects
the associated reduction in the deadweight burden of taxation that would otherwise have to be raised
26 A deadweight assumption of 70% is applied to Irish profits, based on econometric modelling and
primary research

EVALUATION OF BUSINESS DEVELOPMENT PROGRAMMES
37
Notes