Embed Size (px)
Citation preview

7 Westferry Circus ● Canary Wharf ● London E14 4HB ● United Kingdom Telephone +44 (0)20 7418 8400 Facsimile +44 (0)20 7418 8613 E-mail [email protected] Website www.ema.europa.eu An agency of the European Union
© European Medicines Agency, 2011. Reproduction is authorised provided the source is acknowledged.
23 June 2011 EMA/739355/2011 Committee for Medicinal Products for Human Use (CHMP)
Assessment report
Eurartesim
dihydroartemisinin / piperaquine phosphate
Procedure No.: EMEA/H/C/1199
Note
Assessment report as adopted by the CHMP with all information of a commercially confidential nature
deleted.

Table of contents
1. Background information on the procedure .............................................. 7 1.1. Submission of the dossier.................................................................................... 7 1.2. Steps taken for the assessment of the product ....................................................... 8
2. Scientific discussion ................................................................................ 9 2.1. Introduction ...................................................................................................... 9 2.2. Quality aspects ................................................................................................ 13 2.2.1. Introduction ................................................................................................. 13 2.2.2. Active substance ........................................................................................... 13 2.2.3. Finished medicinal product.............................................................................. 16 2.2.4. Discussion on chemical, pharmaceutical and biological aspects............................. 17 2.2.5. Conclusions on the chemical, pharmaceutical and biological aspects ..................... 18 2.3. Non-clinical aspects .......................................................................................... 18 2.3.1. Introduction ................................................................................................. 18 2.3.2. Pharmacology ............................................................................................... 18 2.3.3. Pharmacokinetics .......................................................................................... 22 2.3.4. Toxicology.................................................................................................... 25 2.3.5. Ecotoxicity/environmental risk assessment........................................................ 28 2.3.6. Discussion on non-clinical aspects.................................................................... 28 2.3.7. Conclusion on the non-clinical aspects .............................................................. 29 2.4. Clinical aspects ................................................................................................ 30 2.4.1. Introduction ................................................................................................. 30 2.4.2. Pharmacokinetics .......................................................................................... 30 2.4.3. Pharmacodynamics........................................................................................ 47 2.4.4. Discussion on clinical pharmacology ................................................................. 56 2.4.5. Conclusions on clinical pharmacology ............................................................... 56 2.5. Clinical efficacy ................................................................................................ 57 2.5.1. Dose response studies ................................................................................... 57 2.5.2. Main studies ................................................................................................. 57 2.5.3. Discussion on clinical efficacy .........................................................................104 2.5.4. Conclusions on the clinical efficacy..................................................................104 2.6. Clinical safety .................................................................................................104 2.6.1. Discussion on clinical safety ...........................................................................118 2.6.2. Conclusions on clinical safety .........................................................................119 2.7. Pharmacovigilance...........................................................................................120 2.8. User consultation ............................................................................................125
3. Benefit-Risk Balance............................................................................ 125
4. Recommendations ............................................................................... 127
Assessment Report EMA/739355/2011 Page 2/129

List of abbreviations
ACPR Adequate Clinical and Parasitological Response
ACT Artemisinin-based Combination Therapies
AE Adverse Event
AUC Area under the plasma concentration versus time curve
AUC0-24 Area under the plasma concentration versus time curve, from time 0 to 24h.
AUC0-42 Area Under the plasma Concentration versus time curve from 0 to42 hrs
AUC0-last Area Under the plasma Concentration versus time curve from 0 to last timepoint
AUC0-t Area Under the plasma Concentration versus time curve from 0 to the last measurable concentration, as calculated by a trapezoidal method.
AUC0-t / AUC0-∞ The ratio of AUC0-t to AUC0-∞
AUC0-∞ Area Under the plasma Concentration versus time curve from 0 to infinity. AUC0-
∞ was calculated as the sum of AUC0-t plus the ratio of the last measurable plasma concentration to the elimination rate constant.
BLQ Below the Level of Quantification BMI Body Mass Index Cb Concentration in blood Cp Concentration in plasma CI Confidence Interval CL Total Body Clearance CL/F The apparent total body clearance after extra-vascular administration, calculated
as Dose/AUC0-∞ CLd/F Apparent distributional clearance Cmax Maximum measured plasma concentration over the time span specified
Conc Concentration CV Coefficient of variation of the mean CYP450 Cytochrome P450 DBP Diastolic Blood Pressure DHA Dihydroartemisinin ECG electrocardiogram F Bioavailability FR Relative Bioavailability
GLP Good Laboratory Practice h Hour HR Heart Rate IC(50) Half Maximal inhibitory concentration LLOQ Lower limit of quantification LOD Limit of detection LOQ Limit of Quantification M Molar, mol per litre min Minute mM Millimolar mmHg Millimetres of Mercury ms Millisecond PCR Polymerase Chain Reaction PK Pharmacokinetic PQ Piperaquine (free drug measured in plasma) PQP Piperaquine phosphate (salt used in dosage form) SAE Serious Adverse Event SBP Systolic Blood Pressure SD Standard Deviation
Assessment Report EMA/739355/2011 Page 3/129

SOP Standard Operating Procedure t½ Apparent first-order terminal half-life was calculated as 0.693/kel. Tlag Duration of time before the drug starts to be detected in plasma following oral
administration Tmax Time of the maximum measured plasma concentration Varea/F The apparent total volume of distribution after extra-vascular administration,
calculated as Dose/(AUC0-∞* kel). Vc/F Apparent Volume of the Central Compartment Vd Volume of distribution Vd/F Volume of distribution relative to bioavailability Vdss/F Volume of distribution at steady state relative to bioavailability Vp/F Apparent volume of peripheral compartment Vss/F Total Apparent Volume of Distribution Vz/F Volume of Distribution associated with the terminal phase WBC White Blood Cell
Assessment Report EMA/739355/2011 Page 4/129

% Percent ∆ Difference °C Degree Centigrade ACPR Adequate Clinical and Parasitological Response ACT Artemisinin-based Combination Therapy AE Adverse event AIDS Acquired Immunodeficiency Syndrome A/L Artemether-lumefantrine AQ Amodiaquine AS Artesunate AS+MQ Artesunate + mefloquine regimens AUC Area Under the Curve CI Confidence Interval c-PCR PCR-corrected (cure rate) CTD Common Technical Document DBP Diastolic blood pressure DHA Dihydroartemisinin DMC Data Monitoring Committee ECG Electrocardiogram ETF Early Treatment Failure EU European Union FU Follow-up h Hour Hb Hemoglobin HIV Human Immunodeficiency Virus HR Heart rate ITT Intention-To-Treat (statistical analysis) Kg Kilograms LCF Late Clinical Failure LOCF Last Observation Carried Forward LPF Late Parasitological Failure LTF Late Treatment Failure MedDRA Medical Dictionary for Regulatory Activities mg Milligrams m-ITT Modified Intention-To-Treat (statistical analysis) MQ Mefloquine n Number NS Not significant od Once-daily OR Odds Ratio p Probability P. falciparum Plasmodium falciparum P. vivax Plasmodium vivax PC 50/90 Time to reduce initial parasite count by 50%/90%,
respectively PCR Polymerase-chain Reaction PCT Parasite Clearance Time PCV Packed cell volume PK Pharmacokinetic po per os (orally) PP Per Protocol (statistical analysis) PQP Piperaquine tetraphosphate QC Quality Control RBCs Red Blood Cells RD Risk Difference RR Respiratory Rate SAE Serious adverse event SAP Statistical analysis plan SBP Systolic blood pressure SD Standard Deviation t1/2 half-life TF Treatment Failure
Assessment Report EMA/739355/2011 Page 5/129

ULN Upper limit of normal u-PCR Uncorrected-PCR (cure rate) vs Versus WBC White Blood Cell WHO World Health Organisation
Assessment Report EMA/739355/2011 Page 6/129

1. Background information on the procedure
1.1. Submission of the dossier
The applicant Sigma-tau Industrie Farmaceutiche Riunite S.p.A. submitted on 06 July 2009 an
application for Marketing Authorisation to the European Medicines Agency (EMA) for Eurartesim,
through the centralised procedure falling within the Article 3(1) and point 4 of Annex of Regulation
(EC) No 726/2004. The eligibility to the centralised procedure was agreed upon by the EMA/CHMP on
25 March 2008.
Following the CHMP positive opinion and at the time of the review of the orphan designation by the
Committee on Orphan Medicinal Products (COMP), this product was withdrawn from the Community
Register of designated orphan medicinal products on 14 July 2011 on request of the sponsor.
The applicant applied for the following indication “For the treatment of uncomplicated Plasmodium
falciparum malaria and for reducing the risk of new infections”.
The legal basis for this application refers to
Article 8.3 of Directive 2001/83/EC
The application submitted is:
Composed of administrative information, complete quality data, non-clinical and clinical data based on
applicants’ own tests and studies and/or bibliographic literature substituting/supporting certain test(s)
or studies.
Information on paediatric requirements
Pursuant to Article 7 of Regulation (EC) No 1901/2006, the application included an EMA Decision on
the agreement of a paediatric investigation plan (PIP).
At the time of submission of the application, the PIP was not completed as some measures were deferred.
Information relating to orphan market exclusivity
Similarity
The application did not contain a critical report pursuant to Article 8 of Regulation (EC) No. 141/2000
and Article 3 of Commission Regulation (EC) No 847/2000, addressing the possible similarity with
authorised orphan medicinal products.
Derogation from market exclusivity
Not applicable.
Scientific advice
The applicant received Scientific Advice from a Member State (United Kingdom) on 30 December 2007.
Assessment Report EMA/739355/2011 Page 7/129

Licensing status
The product was not licensed in any country at the time of submission of the application.
1.2. Steps taken for the assessment of the product
The Rapporteur and Co-Rapporteur appointed by the CHMP were:
Rapporteur: Ian Hudson Co-Rapporteur: Martina Weise
The application was received by the EMA on 06 July 2009.
The procedure started on 22 July 2009.
The Rapporteur's first Assessment Report was circulated to all CHMP members
on 08 October 2009. The Co-Rapporteur's first Assessment Report was circulated to all CHMP
members on 14 October 2009.
During the meeting on 20 May 2010 and re-adoption on 24 June 2010, the CHMP agreed on the
consolidated List of Questions to be sent to the applicant. The final consolidated List of Questions
was sent to the applicant on 06 July 2010.
The applicant submitted the responses to the CHMP consolidated List of Questions on 28 May 2010
and 09 August 2010.
The summary report of the inspection carried out at the following sites Zambia, Kenya, and at the
sponsor site between 13-16 September 2010, 20-23 September 2010 and 05-09 July 2010 to the
conduct of trial DM040011, was issued on 29 October 2010. The final GCP Inspection report was
circulated to CHMP on 21 January 2011.
The Rapporteurs circulated the Joint Assessment Report on the applicant’s responses to the List of
Questions to all CHMP members on 01 October 2010.
During the CHMP meeting on 21 October 2010, the CHMP agreed on a list of outstanding issues to
be addressed in writing by the applicant.
The applicant submitted the responses to the CHMP consolidated List of Outstanding Issues on 22
December 2010.
During a meeting of an Ad-Hoc Expert Group on 14 January 2011, experts were convened to
address questions raised by the CHMP.
During the CHMP meeting on 14-17 February 2011, outstanding issues were addressed by the
applicant during an oral explanation before the CHMP.
During the CHMP meeting on 17 March 2011, the CHMP agreed on a follow-up outstanding issue to
be addressed in a further oral explanation by the applicant.
The applicant submitted responses to the CHMP on 13 June 2011.
During the CHMP meeting on 20-23 June 2011, remaining outstanding issues with reference to
cardiac safety were addressed by the applicant during an oral explanation before the CHMP.
During the meeting on 20-23 June 2011, the CHMP, in the light of the overall data submitted and
the scientific discussion within the Committee, issued a positive opinion for granting a Marketing
Authorisation.
Assessment Report EMA/739355/2011 Page 8/129

2. Scientific discussion
2.1. Introduction
Problem statement
Malaria remains a major cause of morbidity and death in endemic areas and substantial numbers of
travellers from non-endemic areas are exposed to the risk of malaria each year.
The most severe form of malaria, which is responsible for the great majority of malaria-related deaths
(most of which occur in children aged < 5 years who reside in endemic areas), is associated with
infection due to the species Plasmodium falciparum. Of the classical four Plasmodium species that
infect man, P. falciparum has the shortest exo-erythrocytic phase (7-10 days) and the merozoites
released after asexual reproduction of sporozoites in hepatic cells are able to invade erythrocytes at
any stage of their development.
Because of the relentless increase in resistance of P. falciparum to drugs such as chloroquine,
sulfadoxine–pyrimethamine and mefloquine, new agents have had to be developed. The World Health
Organization (WHO) has recommended that artemisinin combination treatment (ACT) should be
regarded as the “policy standard” for treatment of malaria in areas where P. falciparum is the
predominant infecting species. In developing ACT regimens the aim is to achieve rapid schizontocidal
activity by means of the selected artemisinin compound together with a longer antimalarial effect
associated with the different mechanism of action and longer half-life of the selected partner agent.
Thus far the only medicinal product approved in the EU that would meet this requirement is a fixed
combination of artemether and lumefantrine. Another widely recommended treatment option in non-
endemic areas, such as EU, is the fixed combination of atovaquone and proguanil.
Artemisinin and its derivatives
A crude extract of the wormwood plant Artemisia annua (qinghao) was first used as an antipyretic
2000 years ago in China and its specific effect on fever associated with malaria was reported in the
16th century. The active constituent of the extract was identified and purified in the 1970s and named
qinghaosu or artemisinin.
Although artemisinin proved effective in clinical trials in the 1980s, a number of semi-synthetic
derivatives were developed that had improvements in pharmacological properties, including
pharmacokinetics and activity against malaria parasites. While the artemisinin derivatives are active
per se against Plasmodia they undergo variable conversion to an active metabolite –
dihydroartemisinin (DHA) - which preferentially accumulates in P. falciparum-infected erythrocytes.
The bioavailability of dihydroartemisinin from oral artesunate has been estimated to be about 80%,
whereas the bioavailability of artesunate itself is only 15%.
The artemisinins are highly active against asexual forms of the four species of Plasmodium that infect
humans with very rapid reductions in parasitaemia but relatively short plasma half-lives. There is also
activity against the sexual forms (gametocytes) and therefore these agents have some potential to
reduce transmission rates.
Assessment Report EMA/739355/2011 Page 9/129

While the exact mechanism(s) of antimalarial activity of the artemisinins remains under investigation it
is clear that the presence of endoperoxide moieties within the active forms of these molecules is an
essential requisite for the antiparasitic effect. Evidence for this is provided by the lack of antimalarial
activity of deoxyartemisinin, which is a derivative that lacks the endoperoxide bridge moiety.
During the part of the life cycle of P. falciparum that occurs within human erythrocytes, the parasite
uses haemoglobin as a food source. Haemoglobin is imported into acidic food vacuoles and broken
down by proteolytic enzymes (plasmepsins) and cysteine proteases (falcipains) to amino acids. The
process generates haem, which is detoxified by conversion to an insoluble compound known as malaria
pigment or haemazoin. However, the haem also provides the ferrous iron that activates the
endoperoxide bridge moiety in artemisinin molecules to form cytotoxic free radicals. Subsequently,
covalent bonds are formed that alter the function of some essential parasite proteins such as
membrane transporters.
For many years experts in the field reported no apparent resistance of malaria parasites to the
artemisinins. However, a study published in New England Journal of Medicine (NEJM) (December 2008)
reported that 2/60 patients who received artesunate alone to treat P. falciparum were classified as
having artemisinin-resistant infection due to:
Re-emergence of parasitaemia between Day 21-28
Prolonged parasite-clearance times (133 and 95 hours versus a median of 52.2 hours for patients
who were cured) despite plasma drug concentrations after the first dose that were “adequate” (>
mean for cured patients minus 1 SD)
IC50 for DHA up to 4 times the geometric mean for cured patients and almost 10 times that for the
reference clone W2. Resistance did not appear to be mediated by the number of copies of the P.
falciparum multidrug resistance gene pfmdr1 or selected PfATPase6 polymorphisms.
In July 2009 a Lancet article reported on reports of high failure rates associated with ACT in specific
areas of Cambodia and Thailand. Clinical artemisinin resistance seems to have emerged along the
Thai–Cambodian border from around 2005 onwards. Efforts are being made to try to prevent the
spread of artemisinin-resistant strains outside of this region. Also in July 2009 an article was published
in the NEJM on the issue of resistance to the artemisinins as observed in two open-label, randomised
trials that compared oral artesunate 2 mg/kg for 7 days with a dose of 4 mg/kg for 3 days plus two
doses of mefloquine (total 25 mg/kg) for treatment of uncomplicated falciparum malaria in Western
Cambodia and in Northwest Thailand. Based on detailed study of 40 patients at each location, the
median parasite clearance times were 84 h and 48 h in respective sites. Recrudescence (PCR-
confirmed) occurred in 6/20 (30%) receiving artesunate monotherapy and 1/20 (5%) receiving
artesunate–mefloquine in Cambodia compared with 2/20 (10%) and 1/20 (5%) in Thailand.
The differences were not explained by age, artesunate or DHA PK, in-vitro sensitivity tests or putative
molecular correlates of P. falciparum drug resistance (relating to the PfMDR1 or PfSERCA genes). It
was concluded that P. falciparum has reduced in-vivo susceptibility to artesunate in Western Cambodia
compared with Northwest Thailand that results in slow parasite clearance.
The most common adverse effects associated with the various orally-administered artemisinin
derivatives are nausea, vomiting, bowel disturbance, abdominal pain, headache and dizziness. Mild and
reversible haematological and electrocardiographic abnormalities, such as neutropenia and 1st-degree
heart block, may be observed infrequently. Neurotoxicity, principally in the form of brainstem lesions,
was first identified in animals receiving high doses over long periods. Neurological side-effects such as
ataxia, slurred speech and hearing loss have also been reported in a small numbers of humans.
Assessment Report EMA/739355/2011 Page 10/129

Piperaquine
Piperaquine (PQ) was synthesised by the Shanghai Pharmaceutical Research Institute in the 1960s and
later developed in France by Rhone-Poulenc in the 1970s. Piperaquine replaced chloroquine as the
recommended treatment for P. falciparum malaria in China in 1978 and was used extensively for mass
prophylaxis and treatment.
PQ is an orally active bisquinoline that is structurally related to chloroquine. It is a highly lipophilic
molecule that is practically insoluble in water while the tetraphosphate salt (PQP) is soluble in hot
water.
PQ is slowly absorbed (probably due to its high lipophilicity). It has a large volume of distribution at
steady state relative to its bioavailability and a long plasma half-life. Clearance is markedly more rapid
in children than in adults, reflecting the higher rates of hepatic metabolism and/or biliary excretion in
children. The long half-life and large molecular size/weight suggest that PQ may undergo enterohepatic
recycling.
PQ has a similar mechanism of action as chloroquine that involves inhibition of haem detoxification by
the parasite. There have been several reports of low rates of cross-resistance between chloroquine and
piperaquine. Nevertheless, high rates of resistance to piperaquine have been reported from areas
where it has been used alone, especially in China.
About the product
The development of Eurartesim builds on the available experience with Artekin (and the paediatric
size tablets named Eurartekin). Both are provided as fixed dose combination (FDC) film-coated
tablets of DHA and PQP. Artekin was first approved in China and has subsequently been studied and
approved for use in several countries in SE Asia where multi-drug resistant P. falciparum infections are
common. The manufacture of Eurartesim is not identical to that for Artekin but the applicant has
proposed that the two are sufficiently similar that pharmacokinetic, safety and efficacy data generated
with the one formulation can be extrapolated to the other. It should be noted that in-vitro data suggest
that co-exposure of P. falciparum to DHA and PQ results in a similar phenomenon of inhibition of DHA
accumulation in erythrocytes as seen with chloroquine. It has also been suggested that DHA could
inhibit uptake of PQ. However, these in-vitro observations do not necessarily predict what might occur
in the infected patient at clinical doses.
Proposed indication (from the applicant):
Eurartesim is indicated for the treatment of uncomplicated Plasmodium falciparum malaria in adults,
children and infants 6 months and over and weighing 5 kg or more.
Consideration should be given to official guidance on the appropriate use of antimalarial agents.
Proposed posology and method of administration (from the applicant):
Posology
Eurartesim should be administered over three consecutive days for a total of three doses taken at the
same time each day.
Assessment Report EMA/739355/2011 Page 11/129

Dosage
Dosing should be based on body weight as shown in the table below.
Table 1
Daily dose (mg) Body weight (kg) PQP DHA
Tablet strength and number of tablets per dose
5 to <7 80 10 ½ x 160mg / 20mg tablet
7 to <13 160 20 1 x 160mg / 20mg tablet
13 to <24 320 40 1 x 320mg / 40mg tablet
24 to <36 640 80 2 x 320mg / 40mg tablets
36 to <75 960 120 3 x 320mg / 40mg tablets
75 to 100 1,280 160 4 x 320mg / 40mg tablets
>100 There are no data on which to base a dose recommendation in patients
weighing >100kg.
For patients unable to swallow the tablets, such as infants and young children, Eurartesim may be
crushed and mixed with water. The mixture should be used immediately after preparation.
If a patient vomits within 30 minutes of taking Eurartesim, the whole dose should be re-administered;
if a patient vomits within 30-60 minutes, half the dose should be re-administered. Re-dosing with
Eurartesim should not be attempted more than once. If the second dose is vomited alternative
antimalarial therapy should be instituted.
If a dose is missed, it should be taken as soon as realised and then the recommended regimen
continued until the full course of treatment has been completed.
There are no data on a second course of treatment.
No more than two courses of Eurartesim may be given within a 12 month period (see sections 4.4 and
5.3).
A second course of Eurartesim should not be given within 2 months after the first course due to the
long elimination half-life of piperaquine (see sections 4.4 and 5.2).
Hepatic and renal impairment
Eurartesim has not been evaluated in subjects with moderate or severe renal or hepatic insufficiency.
Therefore, caution is advised when administering Eurartesim to these patients (see section 4.4).
Elderly
Clinical studies of Eurartesim tablets did not include patients aged 65 years and over, therefore no
dosing recommendation can be made. Considering the possibility of age-associated decrease in liver
and fuction, as well as a potential for heart disorders (see sections 4.3 and 4.4), caution should be
exercised when administering the product to the elderly
Assessment Report EMA/739355/2011 Page 12/129
Paediatric population
See posology table above.
The safety and efficacy of Eurartesim in children aged less than 6 months and in children weighing less
than 5kg has not been evaluated. No data are available for these paediatric subsets.
Method of administration
Eurartesim should be taken orally with water and without food. Each dose should be taken no less than
3 hours after the last food intake. No food should be taken within 3 hours after each dose.
2.2. Quality aspects
2.2.1. Introduction
Eurartesim is presented as conventional immediate release film-coated tablets containing piperaquine
tetraphosphate (PQP) (as the tetrahydrate) and dihydroartemisinin (DHA) as active substances in the
strength combination of 320 mg/40 mg and 160 mg/20 mg. The other ingredients are pregelatinised
starch, dextrin, croscarmellose sodium, hypromellose and magnesium stearate. The film-coating
consists of hypromellose, titanium dioxide and macrogol 400. The film-coated tablets are marketed in
PVC/PVDC/aluminium blisters (PVC/PVDC/alu) blisters packed in cardboard boxes.
2.2.2. Active substance
Two active substances are used in this fixed combination product, dihydroartemisinin (DHA) and
piperaquine tetraphosphate (PQP).
Dihydroartemisinin (DHA)
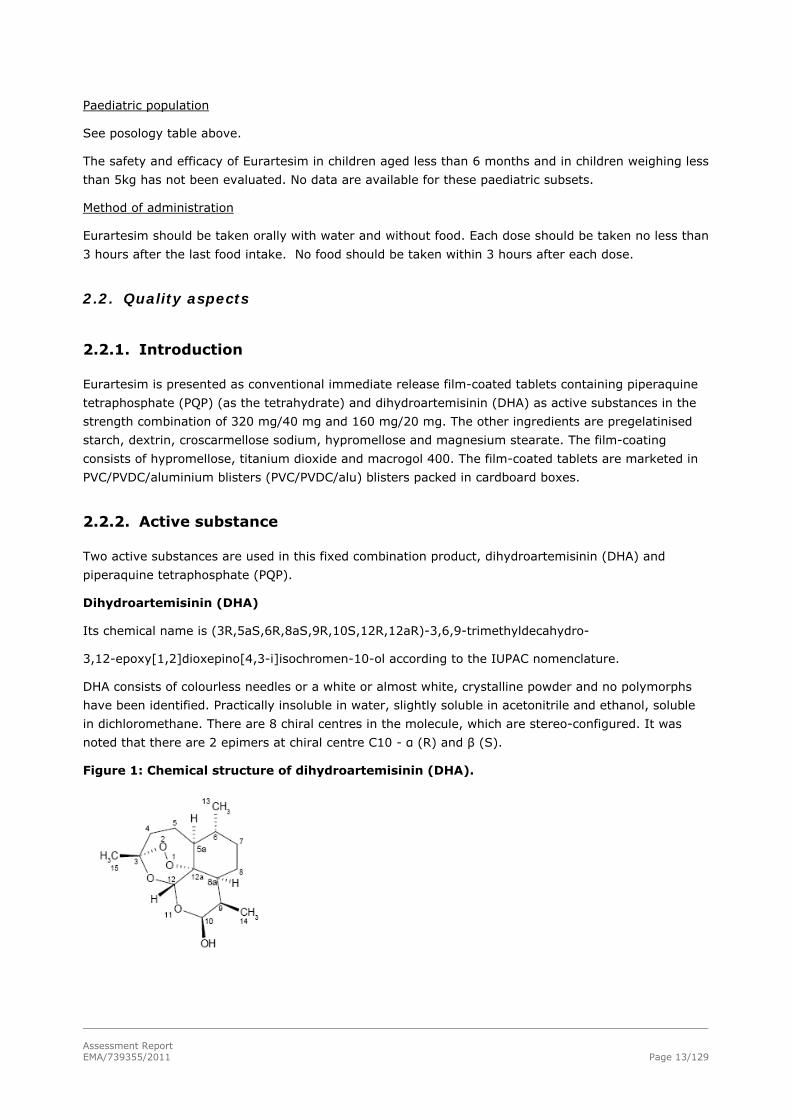
Its chemical name is (3R,5aS,6R,8aS,9R,10S,12R,12aR)-3,6,9-trimethyldecahydro-
3,12-epoxy[1,2]dioxepino[4,3-i]isochromen-10-ol according to the IUPAC nomenclature.
DHA consists of colourless needles or a white or almost white, crystalline powder and no polymorphs
have been identified. Practically insoluble in water, slightly soluble in acetonitrile and ethanol, soluble
in dichloromethane. There are 8 chiral centres in the molecule, which are stereo-configured. It was
noted that there are 2 epimers at chiral centre C10 - α (R) and β (S).
Figure 1: Chemical structure of dihydroartemisinin (DHA).
Assessment Report EMA/739355/2011 Page 13/129

Manufacture
Dihydroartemisinin (DHA) is a semisynthetic compound obtained by reduction of artemisinin extracted
from the leaves of Artemisia annua L followed by purification and blending. The manufacturing process
has been adequately described. Critical parameters have been identified and adequate in-process
controls included. Specifications for starting materials, reagents, catalysts and solvents have been
provided. Adequate control of critical steps and intermediates has been presented. The purified active
substance is packed in an inner and outer low density polyethylene (LDPE) bag. Both bags are closed
with a plastic fastener. The bags are inserted into a high density polyethylene (HDPE) drum, which is
closed with a lid equipped with a rubber gasket.
Structure elucidation has been performed by infrared spectroscopy, ultraviolet spectroscopy, 1H NMR
spectroscopy, 13C NMR spectroscopy and mass spectrometry. The solid state characteristics were
determined by FT-IR, XRPD, 1H NMR spectroscopy and optical microscopy.
Specification
The active substance (DHA) specification includes tests for physical appearance, identification (IR and
HPLC), water content (Karl Fischer), specific rotation (polarimetry), heavy metals (Ph.Eur.), sulphated
ash (Ph.Eur.), residual solvents (GC), assay (HPLC), impurities (HPLC), particle size distribution and
microbiological limit tests (Ph.Eur.). It was noted that all specifications reflect the relevant quality
attributes of the active substance. A detailed description for all analytical methods was provided. Full
method validation data was provided for the in-house analytical methods and are in accordance with
the relevant ICH guidelines. In general analytical methods proposed are suitable to control the quality
of the active substance. Impurities have been extensively described, classified as process related
impurities and possible degradation products, and qualified with reference to toxicological studies.
Data on five production scale batches of DHA have been provided and the requirements in the active
substance specification were met.
Stability
The stability results of clinical batches confirmed the thermal sensitivity of DHA. In this context, the
long-term stability studies with commercial batches were conducted at 5°C ± 3°C.
The stability results from long-term (5°C ± 3°C.) and accelerated studies (25°C ± 2°C /60 ± 5%RH)
were completed according to ICH guidelines . The following parameters were monitored during the
stability studies: appearance, water content, specific rotation, assay and related substances. Forced
degradation studies and photostability studies were conducted and it was noted that DHA is thermal,
photo and chemical stress sensitive. The results of the long-term studies fulfil the proposed
specification and for that reason support the proposed retest period when the active substance is
stored in the original packing material and stored under refrigeration at 5°C ± 3°C prior to
manufacture of the finished product.
Piperaquine tetraphosphate (PQP)
Its chemical name is 4,4'-(propane-1,3-diyldipiperazine-4,1-diyl)bis(7-chloroquinoline) tetrakis
(phosphate) according to the IUPAC nomenclature. PQP is an off-white or pale yellow crystalline
powder. This active substance is slightly soluble in water and practically insoluble in ethanol, methanol,
glycerol, THF, acetonitrile and dichloromethane. This active substance has no chiral centres.
Assessment Report EMA/739355/2011 Page 14/129

Figure 2: Chemical structure of Piperaquine tetraphosphate. (PQP)
Manufacture
The chemical synthesis of this active substance (PQP) takes place in three steps followed by
purification (recrystallisation). The manufacturing process has been adequately described. Critical
parameters have been identified and adequate in-process controls included. Specifications for starting
materials, reagents, catalysts and solvents have been provided. Adequate control of critical steps and
intermediates has been presented. The purified active substance is packed in an inner and outer low
density polyethylene (LDPE) bag. Both bags are closed with a plastic fastener. The bags are inserted
into a high density polyethylene (HDPE) drum, which is closed with a lid equipped with a rubber
gasket. Structure elucidation has been performed by infrared spectroscopy, ultraviolet spectroscopy, 1H NMR spectroscopy, 13C NMR spectroscopy, elemental analysis, X-ray powder diffraction and ESI(+)
mass spectroscopy. The results of the elemental analysis are consistent with the proposed molecular
formula.
Specification
The active substance (PQP) specification includes tests for appearance, identification (IR and HPLC),
water content (Karl Fischer), phosphate (Ph.Eur.), heavy metals (Ph.Eur.), pH (potentiometry Ph.Eur.),
residual solvents (GC), assay (HPLC), impurities (HPLC, LC-MS), particle size distribution and
microbiological limit tests (Ph.Eur.). It was noted that all specifications reflect the relevant quality
attributes of the active substance. A detailed description for all analytical methods was provided. Full
method validation data was provided for the in-house analytical methods and are in accordance with
the relevant ICH Guidelines. In general analytical methods proposed are suitable to control the quality
of the active substance. Impurities have been extensively described, classified as process related
impurities and possible degradation products, and qualified with reference to toxicological studies.
Data for one production scale batch and five small scale batches of PQP have been provided and the
requirements in the active substance specification were met.
Stability
Forced degradation studies were performed exposing active substance samples to acidic, alkaline,
oxidising conditions; thermal stress on solid sample, aqueous solution at 90°C, humidity and
photostability (exposure to visible and UV light). According to the results PQP is stable under alkaline
conditions and resistant to thermal stress and humidity. Under acidic conditions, a decrease in assay
was noted; several unknown impurities formed together with the known hydrolysis products and other
known and unknown impurities. Under oxidising conditions PQP degraded. Some known hydrolysis
products and other known impurities were observed when PQP is in aqueous solution at 90°C for 5
hours. Exposure of PQP to light results in coloration of the powder. However, no substantial changes in
the assay of PQP and its related substances could be observed.
Assessment Report EMA/739355/2011 Page 15/129

The stability results from long-term (25°C ± 2°C /60% ± 5%RH) intermediate (30°C± 2°C /65% ±
5%RH), and accelerated studies (40°C± 2°C /75% ± 5%RH) for one clinical trial batch were
completed according to ICH guidelines demonstrated adequate stability of the active substance. There
was a need to change the manufacturing process several times since the manufacturing process was
transferred to a new site. Therefore, three different stability studies were conducted, according to ICH
guidelines, using 3 different batches for each stability study. The stability results from long-term
(30°C± 2°C /65% ± 5%RH) and accelerated studies (40°C± 2°C /75% ± 5%RH) were completed
according to ICH guidelines and demonstrated adequate stability of the active substance. Based on the
stability data, it can be concluded that the active substance is stable when stored in the original
packing material. The results support the agreed re-test period without specific storage conditions.
2.2.3. Finished medicinal product
Pharmaceutical Development
All information regarding the choice of active substances and the excipients are sufficiently justified.
The development of Eurartesim film-coated tablets was based on the formulation and dosage form
developed for the Chinese market. The excipients selected for this formulation are commonly used in
pharmaceutical formulations. The Applicant decided to develop two strengths of Eurartesim film-coated
tablets (piperaquine tetraphosphate (PQP) and dihydroartemisinin (DHA) in the strength combination
of 320 mg/40 mg and 160 mg/20 mg). One pilot batch per strength for clinical trials was manufactured
from the same compression mixture. Later on in the development phase one additional tablet strength,
specific for the infant population corresponding to half paediatric strength 80 mg/10 mg was
considered. This third presentation has the same qualitative composition as the other tablets and
allows an improvement in the administration compliance and dispensing as well as a lower variability of
dosage. However, this strength was not authorised since there is no clinical and safety data available
for target paediatric subsets (< 6 months and in children weighing <5kg). It was noted that the film-
coating was changed during the pharmaceutical development. However, it was verified that the film-
coating does not have an impact on the physical properties of tablets or on their dissolution profile. In
other words, this change does not have an impact on the formulation quality or performance.
Manufacture of the product
The proposed commercial manufacturing process involves standard technology and it is divided into 7
main steps: wet granulation, drying phase, sizing/sieving, final mixing, tabletting, coating and
packaging.
Furthermore, the equipment used is commonly available in the pharmaceutical industry. The critical
steps in the manufacturing process have been identified and controlled.
The manufacturing process has been adequately validated for three commercial batches and the
results of the manufacturing validation reports were considered satisfactory.
Product specification
The product specification is standard for tablets and contains tests with suitable limits for appearance,
identification (HPLC, UV, colorimetric), identification titanium dioxide, assay of PQP (HPLC), assay of
DHA (HPLC), impurities (HPLC), PQP uniformity of dosage (Ph.Eur), DHA uniformity of dosage (Ph.Eur),
Assessment Report EMA/739355/2011 Page 16/129
water content (Karl Fischer), PQP dissolution, DHA dissolution, average mass, residual ethanol (GC),
microbial contamination (Ph.Eur).
Impurities and degradation products have been evaluated and found to be acceptable from the point of
view of safety. Their limits are justified by reference to stability studies.
All analytical procedures that were used for testing the finished product were properly described.
Moreover, all relevant methods were satisfactorily validated in accordance with the relevant ICH
guidelines.
The batch analysis results show that the medicinal product can be manufactured reproducibly and in
accordance with the agreed finished product specifications.
Stability of the product
A stability study was conducted an early stage of pharmaceutical development on the clinical batches
of Eurartesim for two initial strengths (i.e. adult - 320 mg/40 mg and paediatric - 160 mg/20 mg)
packaged in the material proposed for marketing. The stability studies were conducted under long term
conditions (25°C±2°C/60%±5%RH), intermediate conditions (30°C±2°C/ 65%±5%RH) and
accelerated conditions (40°C±2°C/ 75%±5%RH) under ICH conditions. The following parameters were
investigated: appearance, assay PQP and DHA, impurities, disintegration test, microbial limits. The
results the stability studies fulfil the proposed specification. Once the final formulation was defined,
more stability studies were conducted on three different batches for each of the Eurartesim strengths.
In this context, stability studies were conducted under long-term conditions (25°C±2°C/60%±5%RH),
intermediate conditions (30°C±2°C/ 65%±5%RH) and accelerated conditions (40°C±2°C/
75%±5%RH) under ICH conditions relevant to Climatic Zones I and II. It was noted that all the
stability batches were packed in the same material intended for marketing of the finished product.
Results of the stability studies are within specifications for long-term conditions
(25°C±2°C/60%±5%RH) and intermediate conditions (30°C±2°C/ 65%±5%RH).
It was noted that a forced degradation study has also been conducted on one batch per strength of the
finished product (high temperature and relative humidity). The results of a thermal stress stability
study confirm that DHA is sensitive to temperature when it is combined with PQP. One batch per
strength was stored under ICH photostability conditions and no significant changes were observed. It
can be concluded that the finished product is not affected by exposure to light. Based on the available
stability data relevant to ICH Climatic Zones I & II, the proposed shelf life and storage conditions as
stated in the SmPC are considered to be acceptable when the medicinal product is stored and used
within the EU.
In accordance with current EU data requirements no stability studies have been provided under (WHO)
Climatic Zones III & IV. Therefore, if the medicinal product is stored and used outside the EU, or in any
country where the climatic conditions are not represented by ICH climatic zones I & II, it cannot be
assumed that the above-mentioned shelf life and storage conditions will apply.
2.2.4. Discussion on chemical, pharmaceutical and biological aspects
Quality Development
The pharmaceutical development of the formulation, the manufacturing process, control of the active
substances and the finished product have been presented in a satisfactory manner and justified in
accordance with relevant CHMP and ICH guidelines. The manufacturing flow-chart was provided with
Assessment Report EMA/739355/2011 Page 17/129

suitable in-process controls. The manufacturing process is adequately validated for three commercial
batches at the proposed manufacturing site. The routine specifications and tests methods proposed for
the finished product will adequately control the quality of the finished product. Analytical methods were
well described and validated in agreement with relevant guidelines.
Batch analyses were presented and the results showed that the finished product meets the
specifications proposed.
The container-closure system was found to be suitable to ensure the quality of the finished product as
shown by the stability data.
The conditions used in the stability studies comply with the ICH stability guideline (climatic zones I and
II). The control tests and specifications for the finished product were adequately established.
2.2.5. Conclusions on the chemical, pharmaceutical and biological aspects
Information on development, manufacture and control of the active substance and finished products
have been presented in a satisfactory manner. The results of tests carried out indicate satisfactory
consistency and uniformity of important product quality characteristics, and these in turn lead to the
conclusion that the medicinal product should have a satisfactory and uniform performance in the clinic
when stored and used within the EU. At the time of the CHMP opinion, all quality issues have been
resolved.
2.3. Non-clinical aspects
2.3.1. Introduction
The majority of the studies conducted were performed in accordance with GLP. The following were not
conducted in accordance with GLP: 4 out of 14 of the pharmacokinetic studies; the hERG assay; the 2-
week repeated dose toxicity study in the rat; the single dose toxicity studies for qualification of the
DKA and DOA degradation products.
2.3.2. Pharmacology
In the treatment of malaria, both DHA and PQP have well established clinical therapeutic usage as does
the combination of both compounds (DHA/PQP). As such additional specific non-clinical pharmacology
studies were not deemed necessary for Eurartesim. The pharmacological data for DHA, PQP and the
DHA/PQP combination are provided from the available literature.
Primary pharmacodynamic studies
DHA is the active metabolite of artesunate and artemether, which are both artemisinin-derived anti-
malarial drugs. Typical of artemisinins, DHA has a very short plasma half-life of approximately 1 hour,
and therefore, its use as monotherapy requires a multiple dosing regimen of seven days duration.
PQ is structurally related to chloroquine with a similar mechanism of action through the chemical
inhibition of parasite haem detoxification. PQ is reported to have a very prolonged half-life (20-22
days in humans), and hence facilitates a shorter treatment regimen.
Assessment Report EMA/739355/2011 Page 18/129

Eurartesim has been developed combining two drugs with different complimentary half-lives, one short
and one long allowing a dosing regimen of 3 days duration while avoiding the recrudescence normally
associated with short-course therapy. In addition DHA is stated to be rapidly effective against 95% of
the parasite population leaving the PQP with only a few parasites with a very low risk of resistance to
eliminate, thus reducing the emergence of Eurartesim resistant strains.
Secondary pharmacodynamic studies
No non clinical studies providing data on secondary or general pharmacology of the DHA/PQP
combination product were conducted. This is considered to be acceptable in view of the clinical
experience of the two compounds as well as their combination.
Safety pharmacology programme
DHA - Potential Neurotoxicity
The potential for neurotoxicity has been well documented. In animals, neurotoxicity is related to the
dose, the route of administration and the pharmacokinetic properties of the different DHA pro-drugs.
Sustained CNS exposure from slowly absorbed or eliminated artemisinins is considerably more
neurotoxic than intermittent brief exposure. Thus, the oil-based intramuscular (IM) artemether and
arteether appear more neurotoxic than those given orally.
Two reviews on artemisinin derivative neurotoxicity concluded that the prolonged presence of
artemisinins from the oil-based, intramuscular formulations was the main cause of the observed
neurotoxicity in laboratory animals. Other neurotoxic factors were the high doses of artemisinin
compounds used in animal studies and the different pharmacokinetic profiles following different routes
of administration.
The potential neurotoxicity in man of orally administered DHA, (the active metabolite of the majority of
atemisinin derivatives) was concluded to be highly unlikely given the rapid clearance of DHA and the
short exposure (3 days of treatment). These conclusions are also consistent with those of the WHO
Informal Consultation on Clinical Neurological Investigations Required for Patients Treated with
Artemisinin Compounds and Derivatives 1998.
Assessment Report EMA/739355/2011 Page 19/129

DHA- QT Prolongation
In studies with artemether and arteether ECG effects have been noted: prolongation of QTc and
changes on ECG with bizarre ST-T segment changes in rats and dogs administered artemether. Further
studies in rat (12.5-50mg/kg/day for 28 days) confirmed ECG changes. Both IM and PO exposure to
artemether at high dose levels was associated with a prolongation of mean QT interval of ECG in dogs.
In dogs given 50mg/kg/day of artesunate, by IV route, for 14 days, no ECG changes were observed.
The applicant states that cardiovascular sinus bradycardia and a reversible prolongation of the QT
interval have been reported (Meyler’s Side Effects of Drugs; SEDA-21, 293) with artesunate. The
applicant further states that in WHO monographs such adverse effects from extensive clinical trials
were not reported.
PQP Cardiovascular Effects
In a recent publication it was reported that in rabbits, acute cardiovascular toxicity of PQP was
compared with that of chloroquine by determining the cumulative intravenous dose that caused a fall
in blood pressure, or electrocardiographic abnormalities. Using this determination, it was observed
that, in general, PQP had a better cardiovascular toxicity profile than chloroquine.
A hERG study was carried out for PQ as part of the investigation into the QTc prolongation potential of
PQ. This is to support the extensive analyses performed in the clinical studies. This study (0083-2009)
was carried out by Sigma-tau to assess the effect of the antimalarial drugs chloroquine (CQ), PQ and
mefloquine (MQ) on hERG tail current. Exposure to CQ, PQ and MQ reduced hERG residual tail current
in a dose related manner and the dose response curves for the test items gave IC values of 5.28, 4.03
and 19.88μM, respectively. All the test items decreased IKr in a dose related manner; CQ and PQ had
nearly identical hERG IC50 values, suggesting a similar potential interference on cardiac repolarization.
DHA/PQP
As a result of the above data from literature, the applicant states that the cardiovascular (CVS) and
central nervous system (CNS) effects have been specially monitored in the clinical trials.
Targeted CNS exploration during the clinical trials was stated not to reveal any abnormalities.
An evaluation of the torsadogenic risk of DHA and PQP in response to a question during assessment of
the dossier revealed that although there was such a risk, it was lower than for CQ and halofantrine and
in the same range as for MQ and lumefantrine. The torsadogenic risk indices of anti-malarial drugs
were evaluated as ratios between IC50 values obtained in the hERG study and the free therapeutic
plasma concentrations (FTPC) in patient studies, higher risk being associated with lower ratio value.
For this ratio, the IC50 values derive from the study at 37°C (Zenas/Craven AS 2009-1).
For comparison, additional antimalarial drugs were evaluated in the hERG assay by Zenas/Craven (AS
2009-1), as reported in Table hereafter.
Assessment Report EMA/739355/2011 Page 20/129

Table 2: Torsadogenic risk index (ratio A/B) of antimalarial drugs with respect to the free
therapeutic plasma concentration (FTPC)
Drug hERG IC50 (µM)*
A
FTPC (µM)
B
Ratio
A/B
DHA 9.62 0.24 40.1 PQP 0.182 0.00828 21.9 Chloroquine 0.96 0.41# 2.34 Mefloquine 1.03 0.05# 20.6 Lumefantrine 2,578 0.17# 15.16 Halofantrine 0.018 0.57# 0.03 * from Zenas/Craven electrophysiology studyAS 2009-1. # from Traebert et al., 2004.
The risk that DHA and PQP might induce Torsade de Pointes arrhythmias exists, but according to this
analysis the ratios for DHA and PQP are higher or in the same range than those for the other
antimalarial compounds tested (chloroquine, mefloquine and lumefantrine).
Also, the association of DHA and PQP did not produce hERG inhibition greater than that of the single
compounds.
According to ICH S7B guidelines, cardiovascular safety was assessed by using the hERG assay. No
indication of particular cardiovascular problems related to QT prolongations was evidenced after
Eurartesim administration during the dog toxicity studies (see further- repeat toxicity studies).
In human subjects, QT prolongation was reported after DHA plus PQP administration (Karunajeewa et
al., 2003; Mytton et al., 2007).
The applicant’s conclusion from the electrophysiology findings was that DHA/PQP does not cause
clinically relevant cardiotoxicity. The QTc prolongation observed was stated to be comparable with that
observed with other antimalarials, including drugs with no known cardiac effects, which suggests that
QT prolongation may have resulted from recovery from malaria and be unrelated to drug treatment.
However, the issue of the effect of DHA/PQP on QTc prolongation and the risk of cardiac arrhythmias
required further exploration. The CHMP requested additional non-clinical in-vitro experiments to further
elucidate:
The arrhythmogenic and torsadogenic potential of Eurartesim
The underlying mechanisms of the observed QT prolongation and
Whether a pharmacodynamic interaction exists between PQP and DHA.
The applicant submitted the following four studies:
Trafficking of hERG channels
Effects on cardiac IKs current
Effects on cardiac INa current
Isolated perfused rabbit left ventricular preparation
In addition the applicant submitted 12 references from the published literature and an expert
overview.
Assessment Report EMA/739355/2011 Page 21/129

Assessment Report EMA/739355/2011 Page 22/129
Block of hERG currents does not seem to be primarily responsible for the marked QT interval
prolongation observed in humans after administration of Eurartesim.
An inhibition of the trafficking of hERG channels by drugs has recently been identified as an important
mechanism for several torsadogenic drugs, but both DHA and PQP at clinically relevant concentrations
were shown to have no effects on hERG channel trafficking in HEK 293 cells.
A block of the cardiac slow delayed rectifier K+ current (IKs) may also be ruled out as a mechanism for
the marked QT interval prolongation induced by Eurartesim, since neither DHA, PQP nor the
combination of both had marked effects on IKs in isolated human atrial myocytes. Also, for
artemether/lumefantrine and chloroquine no such effect was observed.
A protective mechanism against the induction of TdP arrhythmias resulting from the block of cardiac
INa can be excluded, since neither DHA, PQP nor the combination of both had effects on peak INa
isolated human atrial myocytes. Such an effect was neither observed for the combination of
artemether/lumefantrine , However, chloroquine (10 µM) blocked cardiac I
in
Na by about 43%.
In the isolated perfused rabbit left ventricular preparation, DHA did not shown any torsadogenic
effects, but shortened the QT interval and Tp-e (an index of transmural dispersion of repolarisation and
proarrhythmias including early afterdepolarisation) at high concentrations of 30 and 100 µM (which
may indicate some protective effects against the induction of TdP arrhythmias). In contrast, PQP
concentration-dependently increased APD90, QT interval and Tp-e at clinically relevant nanomolar
concentrations and increased the TdP score at 3 µM. However, PQP did not induce early after-
depolarisations [EADs], an important surrogate parameter for the induction of Torsades de Pointes
[TdP] arrhythmias) even at a high concentration of 3 µM, about 1,000-fold higher when compared to
therapeutically effective free plasma concentrations of PQP. Similar effects on electrophysiological
parameters to those of PQP alone were obtained when PQP was combined with a low concentration
(2.4 µM) of DHA, but the effects of PQP on these parameters were less when combined with DHA at
concentrations much higher than those achieved in humans (7.2 µM). These observations indicate that
PQP has a torsadogenic potential, which is lower than that of chloroquine but higher than that of
artemether/lumefantrine.
Pharmacodynamic drug interactions
No non-clinical data relating to pharmacodynamic drug interactions were obtained.
2.3.3. Pharmacokinetics
The pharmacokinetics of both DHA and PQP are detailed in the literature. In addition, in-house studies
were performed by Sigma-tau to evaluate the pharmacokinetic profile of piperaquine (PQ) after single
and repeated administration of DHA/PQP in rats and dogs. The systemic exposure to PQ in rats in dogs
was assessed during 4-week toxicity studies. Absorption-distribution-metabolism-excretion (ADME)
and protein binding studies in rats were also performed using [14C]-PQP (co-administered with DHA).
In toxicology and pharmacokinetic studies, analyses of PQ in rat and dog plasma and DHA in dog
plasma were carried out using validated HPLC-MS/MS methods. However, due to the instability of DHA
in dog plasma during freeze-thaw cycles, the DHA toxicokinetics in dogs were not assessed.
In single-dose testing in male rats, systemic exposure following a single oral administration of
DHA/PQP at the dose of 270mg/kg (30mg/kg of DHA and 240mg/kg of PQP) using three different
formulations revealed that the PQ pharmacokinetics were characterised by a slow absorption and

elimination rate; the maximum plasma concentration was reached about 8 to 13 hours after treatment,
and the apparent elimination half-life was ~ 200 hours for each formulation.
In the 5 day oral pharmacokinetic study in Beagle dogs, in which DHA/PQP was given by the oral route
at 22.5mg/kg/day (2.5mg/kg of DHA and 20mg/kg of PQP), 45mg/kg/day (5mg/kg of DHA and
40mg/kg of PQP) in 5% methocel, the daily systemic exposure to PQ increased substantially after both
dose levels in direct proportion with the dose without gender difference. After repeated administrations
an accumulation ratio of about 5 based on AUC0-24h values, was observed. The PQ apparent
elimination half-life evaluated was ~ 70-210 hours.
The in vitro plasma protein binding of PQ evaluated in rat, dog and humans suggested that the binding
of PQ to plasma proteins could be considered virtually complete (>99%).
An in vivo study performed in rats to assess the tissue and organ distribution of total radioactivity after
a single oral dose of 80mg/kg [14C]-PQP and 10mg/kg of DHA indicated an extensive distribution of
[14C]-PQ. About 36% of the administered dose was still found in the body 168 hours after
administration both in male (albino and pigmented) and female rat. Apart from the gastrointestinal
tract, the highest concentrations of the radioactivity were measured in adrenal glands, bone marrow,
lachrymal glands, liver, lungs pituitary and spleen. High levels of radioactivity were also measured in
ovaries of the female rats. Overall, there was no qualitative gender difference in distribution of the
radioactivity. Concentrations of radioactivity in blood were higher than in plasma suggesting that an
association of radioactivity with blood cells occurred.
In the pigmented rats the maximal level of radioactivity in the eyes was approximately tenfold higher
than in the albino rats, indicating a significant binding of [14C]-PQ to melanin-containing tissues.
The autoradioluminography of the whole uterus of the pregnant animals showed a distribution of
radioactivity in the foetuses, mainly concentrated in the foetal liver, indicating a placental transfer after
administration.
The metabolite profile of PQ in human hepatocytes was not affected by the co-incubation of DHA. PQ
was the main compound detected after 2 hours incubation with mouse, dog and human hepatocytes,
accounting for 75-89% of total drug-related material. Conversely, with rat hepatocytes unchanged PQP
accounted for only 7%. PQ was mainly metabolized through oxidation. Four mono-oxidated metabolites
were detected. M1 was the main metabolite in rat and mouse, accounting for 75% and 14% of total
drug-related material, respectively. M3 was the main metabolite in dog and humans accounting for 7%
and 9%, respectively. This metabolite has already been identified in humans in vivo. In addition, M10,
M2 and M4 were present in low amounts (up to 3%). M4 was detected only in the dog.
No phase II metabolites of PQ were detected in any species.
DHA is the main active metabolite of artesunate. When administered intravenously to male rats
[14C]DHA was converted principally to the biologically inactive α-DHA-β-glucuronide (α-DHA-G). DHA
is also eliminated in bile as minor glucuronides of nonendoperoxide isomers, namely tetrahydrofurano
acetate and 3-hydroxydesoxy rearrangement product.
Studies using human liver microsomes showed that [3H]DHA-G was the only detectable metabolite of
[3H]DHA. From an in vitro study (Ilett et al 2002) it was verified that the main UDP-
glucuronosyltransferases (UGTs) involved in the DHA metabolism in humans were UGT1A9 and
UGT2B7.
In a mass balance study following a single dose of 90mgkg of [14C]PQP/DHA combination product to
male and female rats the recovery of the total radioactivity within 720 hours after administration
accounted for approximately 97.5% of the dose in both genders. About 80% of the dose was
eliminated in faeces, while the urinary excretion accounted for about 4% of the dose. Approximately Assessment Report EMA/739355/2011 Page 23/129

46% of the dose was eliminated in faeces within the first 24 hours. At the end of the collection period
of excreta (720 hours) about 13% of the dose was recovered from the carcasses.
After administration to male rats, the radioactivity in whole blood reached the maximal concentration
within 24 hours post-dosing. The radioactivity in blood was detectable up to 720 hours, resulting in an
average apparent terminal half-life of 222 hours.
In plasma, the maximal radioactivity concentration was achieved at 3 hours post-dosing. Detectable
levels of radioactivity were measured up to 24 hours post-dosing.
The half-life of piperaquine in plasma was similar to that of total radioactivity in blood, indicating that
both concentrations declined in parallel.
In blood, plasma and milk, mean maximal concentrations of radioactivity were achieved 24, 3 and 6 h
post dosing respectively. After the peak, blood and milk concentrations seemed to decline in parallel,
whilst the decay of the plasma concentrations seemed to be faster than those in blood and milk. In
milk, the maximal concentration of total radioactivity was attained 6 h post-dosing, indicating a rapid
distribution. In terms of AUC, total radioactivity in milk was two and seven times higher than those in
blood and plasma, respectively. Overall, the systemic exposure values indicated a rapid and extensive
distribution of total radioactivity in milk. In addition, relevant and time-dependent distribution of total
radioactivity into red blood cells was observed.
Three toxicology studies contributed additional pharmacokinetic data regarding PQ and the conclusions
are outlined below.
Following repeated oral dosing of DHA/PQP in male and female rats (90 and 270mg/kg/day over 14
days) the PQ plasma concentrations were found to be quite “flat” over the 24 hours observed following
last dose administered. Due to the long T1/2 observed in rats, PQ accumulated in plasma after multiple
dosing. No gender differences were observed. Cmax and AUC0-24h values of PQ increased linearly, but
without a clear proportionality with the dose in the dose range investigated.
After single and repeated administrations of DHA/PQP during the 4-week toxicity study in rats, no
relevant gender differences were observed in the PK of PQ. On Day 1, systemic exposure to PQ did not
deviate substantially from dose proportionality. After repeated oral administrations at all doses,
detectable concentrations of PQ were measured up to the end of the experiment (360 h post last
dosing). Systemic exposure increased with the dose in the dose range investigated. Average
accumulation ratio, based on AUC0-24h values, was in the range 2-4, suggesting accumulation after
repeated administrations.
During the 4-week toxicity study in dogs, no relevant gender differences were observed in the PK of
PQ. After single oral administration of DHA/PQP at 22.5mg/kg dose, dogs were exposed to PQ levels
below the limit of the quantification of the analytical method (10ng/mL). At the other two doses, 90
and 180mg/kg, the systemic exposure to PQ increased rather in direct proportion to the dose.
Following 27 days of repeated oral administration of PQP/DHA combination product, the animals
resulted exposed to PQ at all the three tested doses. Accumulation was observed at 22.5 and
90mg/kg, when the compound was administered daily. Conversely, at 180mg/kg every other day, PQ
accumulation was negligible.
In toxicity studies in animals, daily dosing was performed to conservatively evaluate toxicity during
repeated exposure over 2 and 4 weeks in rats and 4 weeks in dogs. It should be born in mind that
three days of dosing in humans is not too dissimilar to a single dose in pharmacokinetic terms (when
one considers exposure in relation to the very long half-life of PQ in adults and children, of about 21-
22 days). Eurartesim is not intended for chronic dosing, so animal studies using a chronic dosing
regimen should be interpreted with caution. Assessment Report EMA/739355/2011 Page 24/129

For the safety factor calculation the cumulative AUC over the entire period of treatment in rats and
dogs were compared to the cumulative therapeutic AUC in humans. This analysis shows that at the
30mg/kg/day dose in rat and the 22.5mg/kg/day dose in dogs, the exposure levels in animals exceed
those in humans during the clinical dosing regimen. Animals tolerated exposures over of the duration
of treatment at Maximum Tolerated Dose (MTD) that were at least 11-17 fold above the human
exposure during the clinical dosing regimen.
2.3.4. Toxicology
DHA/PQP and its individual components DHA, PQP and the DHA degradation products ST3463 (DKA)
and ST5126 (DOA), have been tested in single-dose and repeat-dose toxicity studies in mice, rats and
Beagle dogs. The toxicokinetics of PQP has been determined in rats and in Beagle dogs. The genotoxic
potential of DHA and PQP has been assessed in vitro in bacterial reverse mutation assays, but not for
chromosomal aberration.
Single dose toxicity
Single doses of 270mg/kg DHA/PQP in rats, and 200mg/kg DHA in mice showed no clinical adverse
reactions.
In addition to DHA, the potential toxicity of DKA given alone or in combination with DHA (DHA + 5%
DKA) was also assessed. At doses of 100 and 200mg/kg, the combination of DHA and 5% DKA did not
cause any adverse clinical reactions. DKA given alone did not show any toxicity at the doses tested.
The potential toxicity of a single-dose of DHA or its degradation product DOA given alone was
assessed. DHA and DOA were given to CD-1 male mice as a single oral administration at the doses of
400, 800 and 1200mg/kg each. DHA did not show signs of overt toxicity up to 1200mg/kg. After
administration of the high dose of 1200mg/kg, DOA only induced a slight transient hypoactivity.
Repeat dose toxicity
DHA/PQP from 14 to 28 days repeated dosing to rat and Beagle dog.
The five-day repeat-dose oral toxicity study in mice revealed no significant differences in toxicity of
DHA, when given alone or in combination with DKA.
In the corresponding study for the qualification of DOA CD-1 male mice were administered doses of
200, 400 or 800mg/kg DHA alone or in combination with DOA (DHA+ 3% DOA) for five days. The low
dose of 200mg/kg/day of DHA given alone or in combination with DOA at 6mg/kg/day, under the
conditions applied in the present study, was considered the NOAEL.
An additional 5 day repeat-dose toxicity study was carried out in Beagle dogs as part of the
qualification of DHA degradation products (0487-2008). Animals were administered doses of 45 or
90mg/kg DHA/PQP alone or in combination with 10% DKA+ 3% DOA. The high dose of 90mg/kg/day
of DHA/PQP alone or in combination with DHA degradation products, under the experimental conditions
applied in the study was considered the NOAEL.
In the two-week repeat-dose toxicity study 270mg/kg/day DHA/PQP given to rats was regarded as the
MTD. Further increase of the dose to 540mg/kg/day caused acute toxicity to progress to lethal effects,
accompanied by decreases in reticulocytes, increases in AST and ALT, and most severe clinical signs in
high dose animals. Morphological changes were dose dependent from 90 to 540mg/kg/day and were
Assessment Report EMA/739355/2011 Page 25/129

mainly characterized by infiltration of macrophages, and by intracytoplasmic deposition of basophilic
granular materials in macrophages. These changes were consistent with phospholipidosis.
The results from the 14-day rat study were confirmed in the 28-day rat oral toxicity study at dose
levels of 30mg/kg/day, 90mg/kg/day and 270mg/kg/day. The top dose of 270mg/kg/day DHA/PQP
was lethal in the week 4 of treatment. 90mg/kg/day of DHA/PQP was considered the MTD.
In the 4-week study one group of animals was treated with chloroquine. Because of early mortality in
this group, the dose was reduced from 90mg/kg/day to 30mg/kg/day. Similar infiltration of foamy
macrophages was observed, although it was less prominent than with DHA/PQP. Chloroquine also
induced morphological changes such as myofibre degeneration mainly in diaphragm and skeletal
muscles. These findings were not observed in the DHA/PQP groups.
In a 4-week oral toxicity study 22.5mg/kg/day, 90mg/kg/day, and 180mg/kg/day DHA/PQP (enriched
with 5% ST3463) were administered to Beagle dogs. From day 8 onwards, 180mg/kg was only
administered every second day. Animals being treated with 180mg/kg every second day showed
similar adverse reactions to those treated with 90mg/kg/day. The main findings in 90mg/kg/day
treated animals were some sporadic variations in clinical characteristics such as a decrease in activity
or food intake, some variations in clinical chemistry (decrease in albumin or increase of globulin and
cholesterol) and the appearance of foamy macrophages in various organs. Consistently, all repeated
dose toxicity studies showed morphological alterations in a dose dependent manner. The 22.5mg/kg
dose was regarded to be the NOAEL.
Phospholipidosis was observed after administration of PQP in all repeat-dose toxicity studies and is a
well known morphological finding from preclinical studies with cationic amphiphilic drugs. Chloroquine
is a cationic amphiphilic drug, which can also induce formation of lamellar bodies in cells. It has been
suggested that the induction of lamellar bodies, and phospholipidosis, respectively, are independent of
toxicity. Indeed, phospholipidosis has been observed in cells without signs of toxicity. Phospholipidosis
does not seem to be predictable with regard to severity and incidence, but lipid composition of the cells
affected and half-life or potential for accumulation may determine the likelihood of phospholipidosis.
The prolonged pharmacological effect of PQP may account for the higher level of phospholipidosis in
animals treated with PQP at 270mg/kg compared to those treated with chloroquine at a dose of
90mg/kg.
No significant differences were observed between PQP and chloroquine treated animals at 90mg/kg.
Observations in chloroquine treated animals such as the presence of inclusion bodies in the cornea
epithelium, and opacities in the lens of the eyes, have not been observed in PQP treated animals in the
current studies.
The applicant provided a profound discussion on the deaths observed in dogs and rats in the repeated
dose toxicity studies. Mortality data and the results of post-mortem examination obtained in toxicity
studies after administration of DHA/PQP for 2 or 4 weeks in rats and for 4 weeks in dogs, have been
thoroughly reviewed. This review indicates that (i) the death of a dog was probably induced by poor
general condition and intestinal symptoms; and (ii) the death of the rats at the highest dose level (270
mg/kg) was most probably the result of very poor condition due to the accumulation of PQP in almost
all the tissues. Moreover, there was no evidence that the cause of these deaths was linked to either
cardiotoxicity or neurotoxicity.
Assessment Report EMA/739355/2011 Page 26/129

Genotoxicity
The genotoxic potential of PQP, DHA, DKA and DOA was studied in four Salmonella typhimurium
reverse mutation assays. It was demonstrated that neither DHA nor PQP or DKA have any mutagenic
potential in the bacterial mutation assays performed. In response to questions concerning the potential
genotoxicity of the above compounds, the applicant re-evaluated all the historical data. The applicant
also conducted, with DHA and PQP, in vitro chromosomal aberration assays in human lymphocytes and
micronucleus tests in rat and in CHO cells. When considered together, the data demonstrate that DHA
and PQP are not genotoxic.
Carcinogenicity
No data is available in the literature on the carcinogenicity of DHA or PQP or the combination. As
treatment is only intended to be given for three days, carcinogenicity tests are not required.
Reproduction Toxicity
Concerning reproductive toxicity, non-clinical data on the effects of DHA in pregnancy is available in
the literature and no further non clinical studies were deemed necessary. DHA/PQP is to be
administered according to WHO 2006 guidelines. The applicant states that they are conducting studies
to assess the use of DHA/PQP in pregnant women.
There is non-clinical data on reproductive toxicity available on the effect of PQP from recently
completed studies carried out by Sigma-tau. The final reports from these studies have now been made
available which show that PQP did not show any teratogenic effects in rats or rabbits when treated with
a dose of 80mg/kg during the embryofoetal stage (GD6 to GD17) or in the rat when treatment was
continued through gestation until the first day of parturition (GD6 to GD21). PQP also did not affect the
course of pregnancy. In the rabbit Segment II study (0140-2008) no plasma levels of PQ were
detected at dose levels below 80mg/kg. The applicant provided a plausible explanation for this finding.
There was no effect of PQP on delivery at doses below 80mg/kg in rats. However in animals receiving
either an interrupted treatment of 80mg/kg or continuous treatment some effects were observed.
These animals exhibited prolonged gestation, altered modality of delivery and increased perinatal
mortality. Individual variation was observed with some animals delivering normally and others showing
complications. Of the animals who delivered normally, PQP did not interfere with lactation or pup
growth (body weight gain). Food consumption, behavioural development or sexual maturity up to
weaning was also unaffected, even when pups were exposed to PQP during the suckling period.
The role of embryonic erythroblasts in the developmental toxicity of artemisinin derivatives has been
investigated in vivo in rats (White et al 2006, Longo et al. 2006a), in monkeys (Clark et al 2008a), and
in vitro in rat whole embryo culture (Longo et al 2006a, 2006b). This literature has recently been
summarized by Clark (2009). The depletion of primitive red blood cells in the embryo is likely a
primary cause of developmental toxicity by artemisinins. Antiangiogenic properties of this class of
compounds may contribute to their developmental toxicity, although in vitro and in vivo data suggest
that effects on angiogenesis occur after effects on primitive RBCs have been observed.
There were no studies in juvenile animals. The applicant states that although children are included in
the target patient population, studies on juvenile animals were not deemed necessary, in view of the
existing clinical experience in children with the combination. The need for juvenile animal studies has
been superseded by clinical experience.
Assessment Report EMA/739355/2011 Page 27/129

Other toxicity studies
Concerning PQP impurities ST3106, ST3590, ST3593, ST3591, ST3592, ST5701, ST5702 the limits of
these impurities has now been tightened to not more than the ICH Q3A/Q3B qualification threshold,
except for ST3590. Appropriate qualification studies were conducted on this impurity which can be
considered to be toxicologically qualified.
2.3.5. Ecotoxicity/environmental risk assessment
The applicant has conducted an ERA for DHA and PQP.
Eurartesim is indicated for the treatment of an orphan condition in the EU. Consequently the default
Fpen value is assumed to be 0.0005. The share prediction is assumed to be 100%. The applicant was
requested to provide a clear explanation as to the provenance of the values used in the calculation of
the ERA and to consider the issue of the dosing schedule of Eurartesim.
The applicant asserted that proposed dosing schedule is no more than once a year. Consequently, in
the calculation, the following is considered: One treatment per year, and the maximal dose i.e. 4
tablets (320 mg of PQP + 40 mg of DHA) once a day over three consecutive days. The total daily dose
is 1,280 mg of PQP and 160 mg of DHA. The total dose for one treatment is 3,840 mg of PQP and 480
mg of DHA. For a total of 8,000 treatments that means per year: 30.720 kg of PQP, that means about
18 kg of PQ and 3.840 kg of DHA. Considering the 20,000 treatments /year (Orphan drug status),
76.800 kg of PQP, or 45 kg of PQ and 9.300 kg of DHA. Whatever the mode of calculation the PECs
remain below the limit of 0.01.
According to Wu J. et al, the log Kow for DHA is 2.19. (Wu J et al. 1982). Using the software DEREK,
(Derek for Window Ver 12.0.0; Lhasa Ltd), Log Kp calculation is 2.4508. With both sources, the log
Kow is below 4.5.
The value of the Log Kow (or Log P) for PQP is 5.8 as fully reported in Report N° CAD-PCPS-ST3073-
09-023. Based on the Log Kow value of 5.8, piperaquine is being evaluated for persistence,
bioaccumulation and toxicity according to the EU TGD. The potential for persistence will be evaluated
based on transformation of piperaquine in water-sediment systems as per OECD 308. Bioaccumulation
potential will be determined based on the fish bioconcentration study following OECD 305. The toxicity
of piperaquine to aquatic organisms will be determined based on data from the fish early life stage
study (OECD 210), the reproductive toxicity to Daphnia magna (OECD 211), and toxicity to green alga
(OECD 201).
In the context of the obligation of the MAH to take due account of technical and scientific progress, the
CHMP recommends the following points for further investigation to be addressed:
The applicant should submit all the relevant final audited end-of –study reports and an updated
overview of the ERA to take into account the new data.
2.3.6. Discussion on non-clinical aspects
Due to the long history, extensive clinical exposure in the target population, as well as data available
on PQP and DHA, the traditional battery of formal non-clinical studies has not been performed. The
non-clinical studies focused on areas of concern.
Additional studies have been performed as per request by the CHMP (hERG study, further mechanistic
studies on QT prolongation, tests evaluating chromosomal damage to have a robust evaluation of
Assessment Report EMA/739355/2011 Page 28/129

clastogenicity) as well as mandatory tests to qualify impurities/degradation products according to
updated specifications.
Neither block of hERG currents, nor inhibition of hERG channel trafficking, nor block of cardiac IKs
seem to be responsible for the marked QT interval prolonging effects of Eurartesim observed in
humans (see further). The results of the studies in the isolated perfused rabbit left ventricular
preparation indicate that the marked QT interval prolongation observed in humans after administration
of Eurartesim is primarily caused by the PQP component, although PQP did not induce early-after-
depolarisations. The results of these in vitro experiments indicate that the torsadogenic potential is low
for the PQP component and does not increase when PQP is co-administered with DHA.
Neurotoxicity is a potential risk of artemisinin derivatives, further considered as part of the RMP.
However, there was no evidence of DHA-induced lesions in the specific nuclei in rats or dogs, even at
lethal dose. Neurotoxicity of orally administered DHA in humans can be considered highly unlikely,
given the rapid clearance of DHA and its short exposure.
Experience with DHA demonstrated that DHA has a low toxicity and that the most sensitive index of
DHA toxicity is the decrease in reticulocyte count. In the non-clinical studies performed with
Eurartesim, no decrease in reticulocyte count was seen which implies, the dose levels given for DHA
were not sufficient to achieve toxicity.
As main nonclinical safety findings after repeated dosing of Eurartesim were phospholipidosis and
degenerative lesions in numerous organs and tissues. These adverse reactions were seen in animals at
exposure levels similar to clinical exposure levels and with possible relevance to clinical use. It is not
known whether these toxic effects are reversible. Hence, an appropriate statement has been added to
section 5.3 of the SmPC.
Information that no reproductive toxicity studies had been performed with the combination of DHA and
PQP is also included into section 5.3 of SmPC. Embryotoxic risk in humans is minimised via an SmPC
warning (see SmPC section 4.6). Additional risk minimisation measures are planned in this regard
(pregnancy registry; educational outreach programme to health care workers).
2.3.7. Conclusion on the non-clinical aspects
Eurartesim cardiovascular effects and the associated clinical findings were concluded to derive mainly
from the effects of PQP. As part of the investigation into the QTc prolongation potential of PQP, the
applicant submitted data from mechanistic studies. These experiments indicate that the torsadogenic
potential of Eurartesim is not as high as expected from the clinical QT studies performed with
Eurartesim. However, reference is made to section 3.4 (Clinical) for further discussion of the issue of
QTc prolongation.
Reproductive toxicity is a potential concern flagged in the Risk Management Plan (RMP).
Assessment Report EMA/739355/2011 Page 29/129

2.4. Clinical aspects
2.4.1. Introduction
GCP
The study reports contain statements to the effect that they were conducted in accordance with the
World Medical Association Declaration of Helsinki and ICH Topic E6, Guideline for Good Clinical
Practice, including the archiving of essential documents.
The applicant has provided a statement to the effect that clinical trials conducted outside the
community were carried out in accordance with the ethical standards of Directive 2001/20/EC.
GCP inspection
At the time of review of the responses to the Day 120 List of Questions (LoQ) a GCP inspection was
triggered. The CHMP endorsed the inspection report on 21 January 2011. The final conclusion was that
there were no findings that would preclude acceptance of the safety and efficacy data provided from
sponsored studies.
2.4.2. Pharmacokinetics
There were three sponsored pharmacokinetic studies included in the initial application dossier as shown
below. The three studies involved administration of Artekin (40 mg DHA plus 320 mg PQP
[tetraphosphate] = 181 mg free PQ) or Eurartekin tablets (20 mg DHA and 160 mg PQP).
Table 3
Plasma concentrations of DHA and piperaquine (PQ) were determined. DHA was measured by LC-
MS/MS for which the validated assay had a LLOQ at 10 ng/mL. PQ was measured by LC-MS/MS that
could only be validated to 20% at all levels and to 25% at the LLOQ. The validated assay had a LLOQ
at 5 ng/mL.
The single dose study in 16 healthy male Caucasian volunteers (ART-DFM-05-002) was conducted in
Switzerland during 2005 and involved sampling up to Day 90. However, due to the insensitive assay
the AUC DHA could not be calculated for 8/16 individuals and PQ was < LLOQ between 12 and 72 h
post-dose with the exception of one subject with quantifiable PQ at 96 h post-dose and one at 144 h
post-dose.
Assessment Report EMA/739355/2011 Page 30/129

The study in adults with P. falciparum malaria (DM04-009) was conducted in Thailand during 2005-
2006. The ratio of AUC0-t/AUCinf for DHA was > 90% in all patients and plasma concentrations
declined rapidly in a mono-exponential manner. The mean clearance value (1.34 L/h/kg) corresponded
to 67 L/h in an adult malaria patient population weighing approximately 50 kg. The mean Vss/F was
determined to be approximately 0.8 L/kg, which is about 40 L for a 50 kg individual.
Table 4: Pharmacokinetic Results for DHA in Plasma
The CV% estimates for PQ were high (Cmax PQ 61.6% and AUC0-24 47.0%), probably because there
were multiple peaks observed for many individuals.
Table 5: Pharmacokinetic Results for PQ in Plasma
The data from these 25 adult malaria patients were included in PK compartmental analyses with
separate modelling for the two actives.
PK DHA was best described in a one-compartment model with first-order elimination and three
first-order absorption processes with different absorption rate constants. Many patients exhibited
multiple peaks in plasma concentration-time profiles, most likely to be due to intra-patient
variability in DHA absorption from the gastrointestinal tract. It was estimated that about 28% of
the bioavailable dose was absorbed with an absorption half-life of 0.617 hours. DHA exhibited “flip-
flop” kinetics and this was considered to explain a mean non-compartmental t½ of 1.04 hours
whereas the mean elimination half-life determined from the model was 0.448 h.
PQ PK was best described by a three-compartment model with first-order elimination and two first-
order absorption processes. The model indicated that the relative bioavailability of PQ on D1 was
Assessment Report EMA/739355/2011 Page 31/129

87.4% compared to D0, while that on D2 was 121% of the D0 value. During the first 12 h many
patients exhibited multiple peaks (or distinct phases) that suggested enterohepatic recirculation or
variations in absorption through various segments of the gastrointestinal tract. The mean apparent
total clearance (CL/F) was 1.12 L/h/kg. The total volume of distribution comprised a small central
volume (26.7 L/kg), an intermediately sized peripheral space (76.8 L/kg) and a very large
(second) peripheral space of 617 L/kg. The between patient variability was relatively high with an
apparent total clearance coefficient of variability of 53% and individual estimates ranging from
0.192 to 2.68 L/h/kg. The total volume of distribution was a little less variable with a coefficient of
variation of 37.5% and individual estimates ranging from 254 to 1238 L/kg. The terminal
elimination half life was very long at 576 hours (24 days) as a consequence of the very extensive
distribution of PQ.
The study in children with P. falciparum malaria (DM04-008) was conducted in Burkina Faso during
2006. Dosing was as shown in the table with whole or crushed tablets administered with/in 120 mL of
water.
Table 6: DHA/PQP Dosing Regimen
DHA again showed multiple-peak phenomena due to three absorption processes with slow and fast
absorption rate constants varying from 0.76 to 6.20 l/h. The total (apparent) volume of distribution of
DHA was 0.705 L/kg and the apparent total clearance (CL/F) was approximately 1.45 L/h/kg. The
mean elimination half-life of DHA was 0.36 hours, although in many subjects flip-flop pharmacokinetics
was occurring.
PQ also exhibited multiple-peak phenomena. The first absorption process involved 67% of the PQ dose,
the second had a lag time of 3.8 h and occurred with a rate constant of approximately 199 L/h. The
total Vss/F was very large (623 L/kg) compared to the Vc/F (27 L/kg), suggesting extensive
distribution in peripheral tissues. The mean elimination half-life was about 23 days and the apparent
total clearance (CL/F) was approximately 1.3 L/h/kg. The relative bioavailability for D1 was slightly
lower than for D0 with a geometric mean of 95.1%, which was ascribed to inter-occasion variability.
The relative bioavailability for D2 compared to D0 was higher with a geometric mean of 119%.
Due to sparse blood sampling a non compartmental analysis was not performed for DHA and PQ. As a
consequence individual AUCINF values were calculated as Dose/CL/F) from the estimated Bayesian
parameters. The correlations between CL/F or AUCINF versus BW or age were estimated and positive
correlations were demonstrated between DHA and PQ CL/F with BW (Pearson correlation
coefficient=0.703 for DHA and =0.691 for PQ, p-values <0.001 for both). CL/F of these drugs
increased as the BW increased at least in the range about 7 to 18 kg. The CL/F correlation with age
was considered likely to reflect the correlation between age and BW. Conversely, no correlations were
observed between AUCINF values for DHA or PQ vs. BW or age, indicating comparable DHA and PQ in
children who took 1 or 2 tablets of Eurartesim. From these analyses the applicant considered that the
BW correction of the dose adopted for the paediatric population was justified from a pharmacokinetic
point of view.
Assessment Report EMA/739355/2011 Page 32/129

The comparison of Asian adults versus African children showed that in children the CL/F and Vss/F for
PQ were within 20% of the adult values. The large volume of distribution of PQ led to very long half-life
values (medians were 531 h and 468 h in adults and children, respectively). The apparent clearance
was faster and the apparent total volume of distribution was smaller for the paediatric population,
although the applicant considers that the differences (<20%) were not clinically important.
Table 7: Bayesian PK Parameters: PQ in The Adult And Paediatric Populations
Relatively small differences were observed for DHA PK between paediatric and adult populations. The
mean CL/F was slightly higher while the mean Vss/F was smaller for children versus adults and the
elimination rate constant was slightly faster. Again, the applicant concluded the differences were
minor.
Table 8: Bayesian PK Parameters: DHA In The Adult And Paediatric Populations
During the assessment period the applicant provided additional PK data from three sponsored
studies that had been initiated since submitting the licensing application.
These were as follows:
DM09-006
PK data were obtained during this parallel group study of effects on QTc vs. Riamet (arthemeter/
lumefantrine)(Group 2) and vs. placebo (Group 3) in healthy male and female subjects. In the four
initial study groups Eurartesim was administered daily for 3 days after high fat/low kcal (Group 1) or
high fat/high kcal (Group 4) meals. Two additional groups provided data on dosing in the fasted state
(Group 5) vs. placebo Group 6). The study design and findings are reported under
“Pharmacodynamics” (see below) along with the correlations between plasma levels and effects on
QTc.
While the plasma profiles for DHA were comparable between Groups 1 and 4 (Eurartesim in the two
fed states) there were some differences vs. Group 5 (fasted). There were no clear gender differences.
After repeated oral administration of Eurartesim over 3 days there was no accumulation of DHA in
plasma with ratios (Day 3 / Day 1) of about 0.98 and 0.96 for Cmax and AUC0-t, respectively, in
Group 1. Similarly, Group 4 data gave ratios (Day 3 / Day 1) of about 1.02 for Cmax and 1.03 for
AUC0-t and the ratios for Group 5 (fasted) were 0.87 for Cmax and 0.91 for AUC0-t.
Assessment Report EMA/739355/2011 Page 33/129

Figure 3: Mean plasma concentration of DHA vs. time profiles obtained on Day 3 after
repeated oral administration of Eurartesim™ in male and female volunteers
for group 1, group 4 and group 5 (linear scale)
On
Day 3 there were no significant differences observed between the two groups dosed in the fed state for
mean Cmax and AUC values. However, the Day 3 comparison of the fed and fasted Groups 1 vs. 5
gave a statistically significant (p<0.05) increase of about 40% in mean DHA Cmax in the fed state.
Similarly dosing with food gave an average difference of about 35% or 30% for AUC0-t and AUC0-∞,
respectively, compared with dosing in the fasted state (p<0.05). Therefore the study demonstrated a
negative effect on plasma exposure to DHA when Eurartesim was dosed in the fasted state.
Mean PQ plasma profiles on Days 1 and 3 obtained in the fed state (Groups 1 and 4) followed a
comparable pattern. PQ was quite slowly absorbed with a median Tmax at 4 h post-dose in the fed
state and 3 h in the fasted state. Multiple peaks were seen in the concentration-time profiles,
suggesting enterohepatic recycling. After repeated dosing and regardless of fed/fasted states mean
plasma PQ tended to be higher in female subjects. Repeated oral administration of Eurartesim over 3
days resulted in an increase in PQ plasma concentrations irrespective of the dosing conditions so that
ratios for mean Cmax (Day 3/Day 1) were 2.43-, 2.46- and 3.03- fold higher on Day 3 for Groups 1, 4
and 5, respectively. The same evaluation cannot be made for AUC0-t because of the different sampling
schemes on Days 1 and 3.
On Day 3 the mean Cmax was 34% lower and mean AUC was 35% lower with a high-fat/low-Kcal
(Group 1) than high-fat/high-Kcal (Group 4) meal (p<0.05). Comparison between Groups 1 and 5
(fasted) showed that mean Cmax was doubled when dosing was with food and there were increases of
about 46% and 77% for AUC0-t and AUC0-24.
Assessment Report EMA/739355/2011 Page 34/129

Figure 4: Mean plasma concentration of PQ vs. time profiles obtained on Day 3 after
repeated oral administration of Eurartesim™ in male and female volunteers
for group1, group 4 and group 5 over the first 24 h post-dose (linear scale)
DM09-007
The study directly compared PK between healthy Asian (A) and Caucasian (C) subjects of both genders
and ≤ 65 kg dosed with Eurartesim (3 days) at 15 minutes after the start of a meal (360 kcal; 25%
kcal from fat) and with 200 ml water.
Mean DHA AUC values on D0 (table) and on D2 (figure) were numerically higher for Asians (A). There
were numerically higher exposures in female subjects. Statistically significant differences were found
for Tmax on D0, t1/2 on D0 and D2 and AUC and CL/F on D2, giving a slightly shorter t/1/2 and higher
CL/F in male subjects. The applicant proposed that the differences could be related to greater
metabolic induction in male subjects since there was a more substantial decrease in AUC by D2
compared to female subjects.
Figure 5: Mean Dihydroartemisinin Concentration Profiles, Day 2 – by Ethnicity and
Gender
Assessment Report EMA/739355/2011 Page 35/129

Table 9: Mean (CV%) by Ethnicity, Gender and Body Weight for Pharmacokinetic
Parameters of Dihydroartemisinin – Day 0
The PQ data showed no significant differences in PK according to ethnicity but CV% tended to be
greater among the Caucasians. PQ did not show consistently higher AUCs in female subjects but there
was a statistically significantly higher Cmax in females on D2 with a longer t1/2.
Assessment Report EMA/739355/2011 Page 36/129

Figure 6: Mean Piperaquine Concentration Profiles, Day 2 – by Ethnicity and Gender
Table 10 Mean (CV%) by Ethnicity, Gender and Body Weight for Pharmacokinetic
Parameters of Piperaquine – Day 0
Assessment Report EMA/739355/2011 Page 37/129

Table 11: Mean (CV%) by Ethnicity, Gender and Body Weight for Pharmacokinetic
Parameters of Piperaquine – Day 2
In overall comparisons between subjects grouped by ethnicity, gender, body weight range and dose
level, the only differences in PK found to be statistically significant were:
For PQ in female subjects
higher Cmax for PQ in female subjects on D2
For DHA in female subjects
lower Tmax at D0
longer half-life on D0 and D2
higher AUC on D2 with corresponding lower CL/F
An additional cohort of 24 male Caucasians of body weight > 65 kg was enrolled and received 3 or 4
tablets daily (with the same light breakfast) according to weight ≤ or > 75 kg. The Caucasian male and
female subjects with BW ≤ 65 kg had numerically higher plasma exposures to DHA and PQ on D0 and
D2 vs. the additional cohort of Caucasian male subjects with BW > 65 kg.
Table 12: Mean (CV%) by BW for pharmacokinetic parameters of DHA – Day 2
Assessment Report EMA/739355/2011 Page 38/129

Assessment Report EMA/739355/2011 Page 39/129
Table 13: Mean (CV%) by BW for pharmacokinetic parameters of PQ – Day 0 and 2
The comparison between mixed gender groups that received 3 tablets/day and the male subjects who
received 4 tablets/ day showed no appreciable difference in AUCs on D0 or D2 for DHA. There was also
no difference between dose groups for AUCs on D2 for PQ although higher mean Cmax and AUC were
observed with 4 tablets on D0.
Table 14: Mean (CV%) pharmacokinetic parameters of DHA – D2
Group tmax
* (hr)
Cmax (ng/mL)
AUC0-12 (hr*ng/mL)
AUC0-last (hr*ng/mL)
λz (1/hr)
t1/2 (hr)
AUC0-∞ (hr*ng/mL)
Vz/F (L)
CL/F (L/hr)
C,M+F,3 tablets 3.0 216 612 596 0.675 1.11 646 310 208
(n=31) (1.5-
4) (46) (37) (38) (26) (30) (36) (22) (34)
C,M+4, tablets 2.0 223 595 576 0.665 1.19 616 484 295
(n=17) (1-4) (43) (35) (36) (30) (47) (36) (49) (39)
Table 15: Mean (CV%) pharmacokinetic parameters of PQ – D0 and 2
Day 0 Day 2
Group tmax
* (hr)
Cmax (ng/mL)
AUC0-24 (hr*ng/mL)
tmax*
(hr) Cmax
(ng/mL) AUC0-24
(hr*ng/mL) AUC0-last
(hr*ng/mL)
Day2/Day0
AUC0-24 (%)
C,M+F,3 tablets
4.0 461 3455 4.0 1074 9742 35568 3.6
(n=24) (3-6) (59%) (43%) (2-8) (48%) (33%) (28%) (89%)
C,M+4, tablets
4.0 616 4387 4.0 936 9855 34828 2.4
(n=16) (3-5) (47%) (34%) (3-8) (36%) (25%) (16%) (20%)
T exp th ed d stm by body weight at the 75 kg cut-off the appl
z/F positively correlated (p < 0.0001) with BW up to 75 kg. In the BW range 75
of drug were compared to BW due to the
ved
o further lore e propos ose adju ent icant
provided plots based on corresponding PK parameters vs. BW from DM09-006, 007 and 008 (see
below).
DHA CL/F but not V
to ~100 kg the CL/F seemed to be constant, which the applicant considers to be an indication that
a further dose adjustment for BW is not necessary.
For PQ mean Cmax and AUC0-24 after a single dose
different dose regimens, blood sampling schemes and the PQ half-life. Also, subjects who recei
Eurartesim without food (DM09008) were excluded from the plots so the analysis concerned only
subjects dosed with a light meal or a high fat meal. The plots indicate that Cmax and AUC values
were very variable but the spread of values was comparable regardless of whether subjects
received 3 or 4 tablets according to body weight.

Assessment Report EMA/739355/2011 Page 40/129
DM09-008
This was a food effect study in healthy Caucasian male subjects ≥ 75 kg. Subjects were randomised to
rallel groups to take a single dose of Eurartesim (4 tablets; 160 mg DHA and 1280 mg one of two pa
PQP) as follows:
The high fat meal provided 800-1000 kcal with 500-600 kcal derived from the fat content. No food and
nly water was allowed from 1-4 h after dosing. The two groups received tablets from different sub-
while
significant at the 5% level). There was also a significant
by
ion
o
lots. Blood samples were collected very frequently in the first 24 h and then at intervals to 60 h
followed by daily sampling out to 7 days.
For DHA, the AUC0-∞ was significantly greater in the fed state (mean ratio fed/fasted = 144%)
the Cmax ratio was 129% (not statistically
delay in median Tmax from 1 to 2 h.
Table 16: Mean (CV%) of Pharmacokinetic Parameters of Dihydroartemisinin –
Fed/Fasted Condit

Figure 7: Mean Dihydroartemisinin Concentration Profiles – by Fed/Fasted
For PQ, the Cmax, AUC0-24 and AUC0-last (Tlast = 168 h) were all significantly higher in the fed
state with mean ratios for fed/fasted of 317%, 317% and 277%, respectively. There was no difference
in median Tmax for PQ between the fed and fasted groups.
Table 17: Mean (CV%) of Pharmacokinetic Parameters of Piperaquine – by Fed/Fasted
Condition
Figure 8: Mean Piperaquine Concentration Profiles to 7 Days Post-dose – by Fed/Fasted
Assessment Report EMA/739355/2011 Page 41/129

From comparisons across sponsored studies (see tables below) the data suggested that plasma
exposures to DHA are greater in infected subjects vs. healthy volunteers whereas for PQ the effect of
acute malaria on plasma exposures was concluded to be minimal or negligible.
For DHA there is an effect of food. However there is overlap in values reported among the various
groups of healthy subjects dosed in fed and fasted states and a stark difference between all these
values and those for the subjects with acute malaria from whom PK data were obtained in the Phase 2
study DM04-009. This is especially notable when taking into account that the applicant claimed they
were likely dosed at least 3-6 h after any food intake.
For PQ the picture is quite different since the effect of food is much greater and this predominates over
the comparisons made, assuming that the low plasma exposures in Asians with malaria reflects the
fact that they were likely dosed on an empty or near empty stomach. The applicant considers that
dosing PQ in the fasted state was associated with a higher degree of inter-subject variability for PK
parameters than in fed subjects as shown in Table 113.2, which is proposed to reflect the lower and
more variable PQP absorption in the absence of concomitant food intake.
Table 18: DHA CV% of Cmax and AUCINF in sigma-tau studies in Healthy Volunteers and
Patients Ethnicity, Gender, Body Weight (Dose) and Dietary Intake
Table 19: PQ (CV%) of Cmax and AUC0-24 in sigma-tau studies in Healthy Volunteers and
Patients by Ethnicity, Gender, Body Weight (Dose) and Dietary Intake
Assessment Report EMA/739355/2011 Page 42/129

Factors that might contribute to the observed inter-subject variability include the PQ and DHA
concentrations in RBCs and the large volume of distribution for PQ. The concentrations of both drugs
determined in plasma represent a minor part of the total drug in circulation and inter-individual
variation in blood/plasma and/or tissue/plasma partition coefficients may produce variability in plasma
concentrations.
Absorption
Bioavailability
In a published study single oral doses of artesunate (3 x 50 mg tablets) and DHA (2 x 60 mg tablets)
and an IV dose of 120 mg artesunate were each administered to healthy subjects and subjects with P.
falciparum malaria in a cross-over design.
The absolute bioavailability of DHA was consistently lower after administration of DHA than after
administration of oral artesunate in the healthy volunteers (45% and 80%, respectively) and was
attributed to lower DHA absorption and/or a higher first-pass effect. The relative bioavailability of oral
DHA compared to oral artesunate in patients was 88%. Cmax and AUC were significantly greater in
patients with malaria than in healthy volunteers. This was possibly attributed to a lower first-pass
clearance. The terminal elimination half-life of DHA was about 1 h in healthy volunteers and patients.
Eurartesim tablets were administered whole or crushed in the Phase 3 studies in accordance with the
protocol. The applicant demonstrated that the dissolution profiles (as assessed at pH 1.2, 4.5 and 6.8,
with and without surfactant) for the crushed and un-crushed tablets were super-imposable, indicating
that the DHA absorption profile should be the same in children taking either a crushed or an un-
crushed tablet. The dissolution testing under similar conditions for PQP also showed no differences
between crushed and un-crushed tablets. Also, since the PQ absorption process is very slow with Tmax
at about 5 h so it is unlikely that the rate of dissolution would significantly influence PQ absorption.
Distribution
The applicant’s studies using a monolayer of a CLEFF9 sub-clone of human Caco-2 cells with high P-
glycoprotein-mediated efflux suggested that DHA (1 and 20 μM) and PQP (20 μM) are not substrates
for P-glycoprotein. Evaluation of the plasma protein binding of PQ in rat, dog and humans in vitro
indicated that binding in all species tested could be considered virtually complete (>99% at the highest
concentration tested). In another study reported by the applicant the blood to plasma ratio of PQ in
vivo in rat was found to be around 4.4 - 7.0 up to 8 h with a ratio of 26.5 at 24 h post-dosing with
14C-PQP/DHA in combination.
The in-vitro protein binding of DHA has been reported to be in the range of 47-76%. In one study 10-
[3H]-DHA was incubated with blood from 15 healthy volunteers (Vietnamese and Caucasian) and from
22 Vietnamese patients infected with P. falciparum or P. vivax previously treated with artesunate. The
results suggested that DHA is approximately 93% protein bound in patients with malaria and 88-91%
bound in healthy volunteers. [3H]-DHA is taken up and concentrated by isolated red blood cell
membranes but not by intact uninfected erythrocytes. There is no association of the drug with either
the membrane or cytoplasm of intact red cells. In addition, erythrocytes infected with P. falciparum
have been shown to take up artemisinin derivatives to concentrations greater than 100-fold those in
uninfected erythrocytes. This selective uptake has been demonstrated to involve a carrier-mediated
mechanism in contrast to the simple, passive diffusion of artemisinins into non-infected red blood cells.
Assessment Report EMA/739355/2011 Page 43/129

Elimination
Dose proportionality and time dependencies
Information was provided from the literature.
The pharmacokinetic properties of PQ were assessed from a 2008 study in which subjects received
single ascending oral doses of 500, 750, 1000, 1250 and 1500 mg PQP and also once-daily doses
of 500, 750, 1000 and 1500 mg for 3 consecutive days. The dose exposure relationship was linear
but less than proportional after single and multiple dosing.
A 2004 study included 20 healthy male and female Thai subjects who received a single dose of
DHA of 2 or 4 mg/kg, which corresponded to a total dose ~100 and 200 mg for a 50 kg person.
Analyses conducted according to non compartmental and (one) compartmental approaches gave
comparable values of dose-independent PK parameters at both doses tested. Linearity was
demonstrated by dose-proportional increases in Cmax and AUCINF.
Special populations
Regarding the effects of renal and hepatic impairment on the pharmacokinetics of DHA and/or PQ:
Malaria per se has an effect on DHA disposition, which may reflect malaria-associated impairment
of hepatic function causing an increase in DHA bioavailability (reduction in hepatic first-pass
extraction) without affecting its apparent elimination half-life, which is absorption rate limited.
Severe malaria can also have an impact on renal function but data from a study of intravenous
artesunate to treat severe and moderately severe malaria suggested that renal impairment
complicating falciparum malaria did not alter DHA clearance significantly.
It is considered unlikely that mild or moderate renal impairment would have an effect on the
disposition of PQ. A slight reduction in protein binding of neutral or basic compounds could slightly
increase CL/F and Vss/F but it is not thought this would occur to a clinically significant extent.
Hepatic impairment may influence PQ disposition. In cirrhotic patients, a decrease in protein
binding and metabolic clearance may have an impact on PQ plasma concentrations and on its
Vss/F, causing also a prolongation of PQ half-life. Furthermore in case of obstructive jaundice, the
excretion of PQ through the bile may be compromised.
In the absence of clinical data in patients with severe renal or hepatic impairment and the limited
experience in subjects with lesser degrees of insufficiency, the SmPC advises caution when
administering Eurartesim with a specific recommendation for ECG and blood potassium monitoring.
Specific studies in patients with moderate or severe renal and/or hepatic impairment are not
planned by the applicant given the very low frequency with which such patients are expected to
travel from Europe to malaria-endemic areas.
Regarding the potential for genetic polymorphism to affect the pharmacokinetics of DHA and/or PQ:
PQ - There is no evidence that CYP3A4 gene polymorphism plays a major role in establishing highly
variable CYP3A4 expression and function although, in very rare cases, defective CYP3A4 mutations
may cause drug toxicity. A small proportion of the population (up to 6% in different ethnic groups)
are CYP2C9 poor metabolisers while 2-7% of Africans, 10-30% of Asians and 2-5% of Caucasians
are CYP2C19 poor metabolisers. Poor metabolisers may exhibit a several-fold higher than average
area under the plasma concentration-time curve (AUC) after administration of compounds that are
Assessment Report EMA/739355/2011 Page 44/129

exclusive substrates of CYP2C9 or CYP2C19. However, considering the low clearance of PQ and the
minor contribution of CYP2C9 and CYP2C19 to its metabolism, significant differences in plasma
concentrations between poor and extensive metabolisers are not expected.
DHA - UGT2A9 and UGT2B7 are known to have genetic variants. The UGT1A9 poor metaboliser
phenotype occurs in < 1% of persons but 4-10% of Africans, 6-7% of Asians and 20-25% of
Caucasians are poor metabolisers for UGT2B7. Nevertheless, UGT2B7 makes only a minor
contribution to DHA metabolism so it is considered unlikely that variations in enzyme activity would
have a significant effect on plasma concentrations.
Pharmacokinetic interaction studies
No drug-drug interaction studies were performed. Regarding the potential for absorption-based drug-
drug interactions with DHA and/or PQ:
Published findings suggest that DHA (1 and 20µM) and PQ (20µM) are not substrates for P-gp. PQ
was shown to be a weak inhibitor of P-gp so it might affect the absorption of P-gp substrates (e.g.
digoxin). However, the mean IC50 was 74 µM in the B-A direction and 11 mM in the A-B direction
with the IC50 determined from the efflux of 3H-digoxin being 7 µM.
DHA is practically insoluble in water. Although DHA is sensitive to acidic conditions it is not
expected that antacids, H2-antagonists or proton-pump inhibitors would have an influence on
absorption and it is unlikely that DHA could affect the absorption of other drugs.
PQP is slightly soluble in water and its solubility is expected to decrease at increased pH. This
raises the possibility that antacids, H2-antagonists or proton-pump inhibitors might impact on PQ
bioavailability due to reduced solubility. However, the PQ absorption process is very slow (Tmax ~
5 h), suggesting that significant absorption does not occur in the stomach. Therefore, medicinal
products that increase gastric pH are not expected to have an effect.
The enterohepatic recirculation of PQ and influence of food indicate that bile production may play a
role in PQ absorption.
Results of the sponsor’s study of the potential for PQ and DHA to inhibit and/or induce enzymes of
possible metabolic importance are summarised in the table.
Assessment Report EMA/739355/2011 Page 45/129

Table 20
study 8740133 PQ DHA substrate inhibitor inducer Substrate inhibitor inducer CYP3A - yesa no - no no
CYP3A4 yes yesb - No no - CYP3A5 no - - No - -
CYP2C19 weak yes - No weak - CYP2C9 weak no - No no - CYP2B6 no weak no No no no CYP2C8 no weak - No no - CYP1A - no no - yes no
CYP1A2 no no - No yesd - CYP2D6 no no - No no - CYP2E1 no stimulator - No no - UGT1A1 no weak - No no - UGT2B7 - - - noc - - P-gp nc weak - No no - a) also time dependent b) PQ inhibited CYP3A4 with an IC50 of 5µM (Gigras R et al. 2008) c) UGT1A9 was the main isoform for DHA metabolism, although a contribution of UGT2B7 was observed. DHA was not substrate in UGT1A1 and UGT1A6 (Ilett et al 2002). d) Also observed by Bapiro et al. 2001 nc: the efflux ratio can not be calculated (test compound in the receiver samples was below the limit of quantitation)
PQ was mainly metabolised by CYP3A4 and to a lesser extent by CYP2C9 and CYP2C19. PQ at 10µM
inhibited CYP3A4 in a time-dependent fashion and CYP2C19 but stimulated the activity of CYP2E1. PQ
did not induce CYP1A, CYP2B6 or CYP3A at 0.1-10 µM. The fact that PQ was not an inducer of CYP2A
implies that it is also not likely to induce CYP2C8, CYP2C9 or CYP2C1. Furthermore, it is unlikely that
PQ is an inducer of P-gp since the induction of both CYP3A and P-gp are regulated by PXR.
PQ has the potential to increase plasma concentrations of CYP3A4 substrates, such as HMG CoA
reductase inhibitors and some drugs with a narrow therapeutic index might also be affected (e.g. anti-
retroviral drugs and cyclosporin). Co-administration might lead to increases in plasma levels of several
drugs that prolong the QT interval (e.g. macrolides, pimozide, terfenadine, astemizole, cisapride). PQ
may reduce the rate of metabolism of CYP2C19 substrates such as omeprazole and decrease plasma
concentrations of CYP2E1 substrates such as paracetamol and the anaesthetic gases (enflurane,
halothane, isoflurane).
In the applicant’s study DHA was not an inducer of CYP1A, CYP2B6 or CYP3A at 0.1-25µM). DHA was
not an inducer of CYP2A so it is not likely to induce CYP2C8, CYP2C9, CYP2C1 or P-gp. It has been
reported in the literature that DHA inhibits CYP1A2 in vitro while it showed a small effect in vivo on
some cytochrome P450 isoenzymes in terms of increasing CYP3A activity by a median factor of 1.25
(midazolam as substrate) and decreasing the activity of CYP1A2 (caffeine as substrate) and CYP2D6
(metoprolol as substrate) by median factors of 0.73 and 0.83, respectively. These effects were not
thought to have clinical significance but the applicant states that it is appropriate to exercise caution
when administering DHA concomitantly with CYP1A2 substrates with a narrow therapeutic index (e.g.
theophylline).
Regarding the possible effects of other drugs on DHA and PQ:
PQ clearance may be reduced by concomitant use of CYP3A4 inhibitors such as NNRTIs
(delavirdine, efavirenz), protease inhibitors (amprenavir, indinavir), calcium channel blockers
(diltiazem), H2-receptor antagonists (cimetidine), hormonal contraceptives (gestodene,
ethyloestradiol) or grapefruit juice.
Assessment Report EMA/739355/2011 Page 46/129

PQ clearance may be increased by CYP3A4 inducers including the NNRTI nevirapine, anticonvulsant
and antiepileptic agents (carbamazepine, phenobarbital, phenytoin), antibacterial agents
(rifampicin, rifabutin, rifapentine), glucocorticoids and St. John’s wort. However, since the PQ half-
life is >20 days and most of the drug is rapidly distributed to tissues rather than circulating in the
blood an alteration in its clearance would affect mostly the terminal phase when concentrations are
very low. In addition, while PQ pharmacokinetics might be affected by the listed drugs the
applicant does not expect clinically relevant implications and has not proposed specific SmPC text
on this topic.
Declining concentrations of DHA and its pro-drug artesunate have been reported after multiple
administrations to healthy volunteers and subjects with acute malaria but the mechanism behind
self-induction is unknown. It has been reported that systemic exposure (AUC0-∞) was not
statistically significantly reduced over a 3-day treatment period and there is currently no evidence
of impaired efficacy due to this phenomenon.
The applicant considers it is unlikely that inhibitors of UGT1A9 would increase DHA plasma
concentrations, in fact DHA is possibly metabolised also by UGT2B7. Inducers of UGT enzymes like
phenobarbital might decrease DHA plasma concentrations.
2.4.3. Pharmacodynamics
Mechanism of action
The applicant did not conduct studies but quoted published data on what is known about the
mechanism of action of the active substances. Details are noted in section “Primary
pharmacodynamics”.
Primary and Secondary pharmacology
Primary pharmacodynamics.
The endoperoxide bridge construct in the artemisinins is thought to be essential for their anti-malarial
activity, causing free-radical damage to parasite membrane systems. Specific actions include:
Inhibition of falciparum sarcoplasmic-endoplasmic reticulum calcium ATPase
Interference with mitochondrial electron transport
Interference with parasite transport proteins
Disruption of parasite mitochondrial function.
In addition, the artemisinins may reduce gametocyte carriage and the transmissibility of malaria,
which could contribute to malaria control in areas of low endemicity.
Piperaquine acts through the chemical inhibition of parasite haem detoxification and has a prolonged
duration of action because of its very long half life.
In a three-day ACT regimen, the artemisinin component is present in the body during only two asexual
parasite life-cycles for P. falciparum. While three days of artemisinin treatment greatly reduces the
number of parasites in the body complete clearance is dependent on the partner medicine persisting at
parasiticidal concentrations until all infecting parasites have been killed. Thus the partner compounds
in ACT regimens need to be relatively slowly eliminated. In Eurartesim the applicant claims that DHA is
Assessment Report EMA/739355/2011 Page 47/129

“protected” from resistance by PQP provided it is present at efficacious levels and that PQP is partly
protected by DHA. Courses of one or two days of ACT are not recommended because they are less
efficacious and provide less protection for the slowly eliminated partner drug (WHO 2006).
The relationship between plasma concentration and effect has not been assessed. Since the activity of
the antimalarials is not exerted in plasma and since erythrocyte sequestration changes as the parasite
load changes so investigations of effect related to plasma levels is not expected to be fruitful.
Secondary pharmacodynamic effects
The past experience and published data on the potential neurotoxic effects of DHA and the QT
prolongation potential of DHA and PQP received particular attention during the clinical trial programme.
Neurotoxicity of artemisinins
In the Phase I/II studies no specific effects on neurological examinations were detected. There has
been controversy regarding the neurotoxicity of artemisinin derivatives in man and animals. The
potential for neurotoxicity in animals seems to be related to the dose, the route of administration and
the PK properties of the different artemisinins (i.e. DHA and its pro-drugs). Sustained CNS exposure
from slowly absorbed or eliminated artemisinins was shown to be more neurotoxic than intermittent
brief exposure.
Thus, the oil-based derivatives that are given IM, such as artemether and arteether, appear to be
more neurotoxic than the derivatives that are given orally or intravenously. The potential for
neurotoxicity to occur in man with orally administered DHA (the active metabolite of all derivatives of
the artemisinin class) was concluded to be low given its rapid clearance and use in a 3-day regimen.
QT prolongation by artemisinins
Various studies in animals with different artemisinins have shown a potential to cause prolongation of
QTc intervals. Other changes in ECGs have been noted under some experimental conditions. PQ-
associated AV block and prolongation of the PR and QRS durations have all been observed. The
applicant conducted a study to compare the effects of PQ, chloroquine (CQ) and mefloquine on hERG
tail current. Exposure to these agents reduced hERG residual tail current in a dose related manner and
the dose response curves gave IC50 values of 5.28, 4.03 and 19.88 μM, respectively. Hence CQ and
PQ have nearly identical hERG IC50 values.
During the procedure the applicant performed study DM09-006 on QTc prolongation. ECG manual
readings performed by CardiaBase (Nancy, France) were to be made under blind conditions. The study
initially planned to include 208 healthy subjects as follows:
Group 1 (64 subjects): Eurartesim at the standard dose after a high-fat/low-kcal (400 kcal) meal
3 doses over three days, each of 3 or 4 tablets by body weight
Eurartesim placebo on D-1
Group 2 (64 subjects): Riamet (arthemeter/ lumefantrine) at the standard dose, each dose after high
fat/low kcal (400 kcal) meal
6 doses over three days, each of 4 tablets in the morning and evening;
Eurartesim placebo on D-2
Group 3 (40 subjects): Placebo (matching Eurartesim) after a high-fat/low-kcal (400 kcal) meal
Assessment Report EMA/739355/2011 Page 48/129

Doses as in Group 1 followed by one dose of moxifloxacin (Izilox) 400
mg on D4 after a high-fat/low-kcal meal
Group 4 (40 subjects): Eurartesim at the standard dose after high-fat/high-kcal (1000 kcal) meal
Doses as in Group 1 but after a high-fat/high-kcal meal;
Eurartesim placebo on D-1
After conducting an interim analysis on the first four groups it was planned to enrol two additional
groups (5 and 6) as follows:
Group 5 (40 subjects)
Subjects took 3 or 4 tablets (according to weight </> 75 kg) of placebo on Day -1 and 3 or 4 tablets of
Eurartesim once daily from Day 1 to Day 3 with intervals of 24 ± 0.5 h. Dosing was each morning at
around 08:00 a.m. with water and without any food intake. Dosing was followed at 3 h by breakfast
and at 6 h by lunch with a standard dinner around 08:30 p.m.
Group 6 (20 subjects)
Subjects took 3 or 4 tablets of placebo once daily from Day -1 to Day 3 and then 400 mg moxifloxacin
on Day 4. Other dosing features were as for Group 5 except that moxifloxacin was given after a high-
fat/low-Kcal meal.
For Groups 3 and 6 the largest mean effects of moxifloxacin on QTcF (Fridericia calculation method)
were reported at 4 and 6 h post-dose. The lower 90% CI were 12.5 and 13.3 ms and so assay
sensitivity was demonstrated.
Table 21: Assay sensitivity (QTcF) – Maximum effect
Based on uncorrected QT data the comparisons with respective placebo groups were as shown in the
figure and as follows:
Group 1 (Eurartesim high-fat/low-Kcal) vs. placebo (group 3) 39.3 ms (p < 0.0001)
Group 2 (Riamet) vs. placebo (group 3) 5.8 ms (p = 0.0065)
Group 4 (Eurartesim high-fat/high-Kcal) vs. placebo (group 3) 38.9 ms (p < 0.0001)
Group 5 (Eurartesim fasting) vs. placebo (group 3) 21.2 ms (p < 0.0001)
Assessment Report EMA/739355/2011 Page 49/129

Figure 9: Estimate of treatments effect over time on time-matched changes in QT (ms)
– Triplicate ECG analysis set
In the placebo groups the mean maximum time-matched changes in QTcF were 10.6 ms for Group 3
and 12.8 ms for Group 6 while CV% appeared to be slightly lower for Group 6 (53% vs. 63%).
The contrast between estimated means of the maximum time-matched changes from baseline in QTcF
between Group 1 (Eurartesim high-fat/low-Kcal) and Group 5 (Eurartesim fasting) was 12.6 ms with
lower 95% CI 7.4 ms. Thus dosing in the fasting state had a lesser effect on QTcF.
Consequently while the comparison between Group 4 (Eurartesim high-fat/high-Kcal) and Group 2
(Riamet) was 36.1 ms, the difference was reduced to 13.4 ms (95% CI [-17.1; -9.7]) between Group
5 (Eurartesim fasting) and Group 2 (Riamet). Also, the contrast of the estimated means of the
maximum time-matched changes from baseline in QTcF between Group 5 (Eurartesim fasting) and
Group 6 (placebo) was 21.0 ms (95% CI [15.7; 26.4]). However, this still exceeded the difference
observed on comparing Group 2 (Riamet) and Group 3 (placebo), which was 9.9 ms (95% CI [6.8;
12.9]).
As shown in the table below all the comparisons between treatments were statistically significant. The
p-values were always < 0.0001 except for the comparison between Group 1 (Eurartesim high-fat/low-
Kcal) and Group 4 (Eurartesim high-fat/high-Kcal) for which the p-value was 0.0025.
Stratification by body weight (i.e. comparing the subjects below or above 75 kg) did not change
significantly the results. No significant interaction between body weight and treatment was detected
and the estimates of treatment effects adjusted for body weight were consistent with those previously
obtained.
Assessment Report EMA/739355/2011 Page 50/129

A statistical difference between genders across treatments was detected. Also, the effect of Riamet on
QTc prolongation was nearly doubled in female vs. male subjects (maximum time-matched changes in
QTcF of 7.9 ms in male and 13.1 ms in female subjects).
Table 22: All treatments comparisons for maximum time-matched changes in QTcF (ms)
– Triplicate ECG analysis set
Figure 10: Estimate of treatments effect over time on time-matched changes in QTcF
(ms) – Triplicate ECG analysis set
Assessment Report EMA/739355/2011 Page 51/129

For the comparisons of the time-averaged time-matched changes in QTcF, these were:
Group 1 (Eurartesim high-fat/low-Kcal) vs. Group 2 (Riamet) = 21.8 ms (LL 95% CI 19.1 ms)
Group 4 (Eurartesim high-fat/high-Kcal) vs. Group 2 (Riamet) = 27.5 ms
Group 5 (Eurartesim fasting) vs. Group 2 (Riamet) = 12.5 ms
The duration of a contrast > 20 ms was shorter for Group 5 compared to Groups 1 and 4 but the
median times of occurrence of the maximum time-matched changes were roughly comparable for the
three Eurartesim Groups (5 to 7.5 h post-dose) but 7-8 h post-dose for placebo and 11.5 h for Riamet.
With regard to the analysis of late ECGs at Day 4 (corresponding to 36 h post-dose) QTcF mean
changes from baseline were all < 20 ms and varied from 15.9 ms (Group 1) to 12.2 ms (Riamet). At
120 h post dose all changes were between 3.4 and 5.5 milliseconds. Similar observations applied to
the QTcB and QTcP datasets.
Corresponding analyses were performed for the QTcB (Bazett calculation method) and QTcP datasets.
The categorical analysis of QTcF, QTcB and QTcP demonstrated that no subjects had QTc values above
450 ms in the two placebo groups. In the Riamet group one subject had a QTc value between 450 and
480 ms, regardless of the corrective method, and another subject had only a QTcB value between 480
and 500 ms. In the Eurartesim groups 23.4% (15/64) in Group 1 had maximum QTcF values above
450 ms and 10.0% (4/40) in Group 5. No values above 500 ms were recorded throughout the study.
There were no changes from baseline in QTcF values that exceeded 30 ms in the two placebo groups
and 7.8% (5/64) in the Riamet group had such a change. In contrast the Eurartesim groups included
89% (5764) in Group 1 and 95% (38/64) in Group 4 with changes > 30 ms compared to 65% (26/40)
of subjects who were dosed in the fasting state.
The contrast of the estimated means of the maximum time-matched changes in RR between Groups 1
and 4 vs. Group 3 (placebo) were 61.8 ms and 48.1 ms, respectively, while the contrast between
Group 5 (Eurartesim fasting) and Group 6 (placebo) was 24.3 ms. However, the differences between
the three Eurartesim groups and the Riamet group were 76.3 ms, 62.6 ms and 70.6 ms, respectively.
A similar pattern of observations applied to the estimated time-averaged time-matched changes in RR.
The estimated means of the maximum time-matched changes from baseline in HR showed only small
actual differences between groups. Nevertheless several of the comparisons made reached significance
as shown in the table below and the figure suggests that in comparison to placebo HR tended to be
higher with Riamet and lower with Eurartesim regardless of the dosing conditions.
The comparisons in maximum time-matched changes in PR revealed no statistically significant
differences between the treatments. Similarly, the analysis of the maximum time-matched changes in
QRS showed no statistically significant differences were observed between the treatments.
A correlation analysis for QTcF values and PQ PK parameters considered the following variables:
QTcF maximum time-matched changes from baseline to Day 3 and the values of Cmax and AUC0-
24 at Day 3 within study DM09-006 (low and high/kcal meal)
QTcF changes from Day 0 (h 0) to Day 2 (h 0) and the values of Cmax and AUC0-24 at Day 1,
combining the data of study DM09-006 (low and high/kcal meal) and study DM04-009 (fasting
conditions)
The results obtained for Cmax and AUC0-24 were closely comparable with a slightly stronger
correlation for the latter. In the figure below the AUC0-24 values for subjects with malaria in study
DM04-009 (Part a of the figure; Eurartesim without concomitant food) and subjects enrolled in study
Assessment Report EMA/739355/2011 Page 52/129

DM09-008 (Part b of the figure; Eurartesim under fasting conditions) have been projected along the
QTcF/PK regression line estimated within study DM09-006.
The AUC0-24 values for studies DM04-009 and DM09-008 were available only for Day 1. Therefore,
these values were multiplied by a conversion factor of three to obtain exposure parameters for Day 3.
The conversion factor was estimated after pooling data from all available PK studies and was deemed
to be conservative because it tended to overestimate Day 3 plasma exposure.
Correlation analysis (95% individual prediction boundaries) between QTcF maximum time-
matched changes from baseline to D3 and PQ AUC0-24 at D3 within study DM-09-006 (Low
& High/kcal)
Figure 11 Part a) DM04-009 (Eurartesim taken without concomitant food)
Assessment Report EMA/739355/2011 Page 53/129

Figure 12 Part b) DM09-008 (Fasting conditions)
From these figures the applicant concluded that:
There is a statistically significant correlation between the peak values of QTcF changes from
baseline and PQ AUC0-24 within DM09-006 (correlation coefficient equal to 0.60; p<0.0001).
On average, the predicted maximum QTcF time-matched changes for subjects taking Eurartesim
under fasting conditions or without concomitant food are lower than the observed QTcF changes for
subjects taking Eurartesim in fed conditions.
Approximately 75% of the predicted maximum QTcF time-matched changes from baseline for the
subjects taking Eurartesim under fasting conditions or without concomitant food are located in an
area of the regression line where the upper prediction boundary is below 60 ms. The remaining
patients/subjects (approximately 25%) have AUC0-24 values compatible with a predicted
maximum QTcF time-matched change from baseline potentially higher than 60 ms.
The plots for healthy subjects and those with malaria appear to be super-imposable.
The results shown in the next figure show a trend that is comparable to that in the previous analyses
although to a lesser degree. The applicant points out that the limitation of this analysis is the QTcF
change from D0 to D2, which measures the effect of Eurartesim after 12 h from the last treatment
intake.
Assessment Report EMA/739355/2011 Page 54/129

Correlation analysis between the QTcF changes from baseline to D2 and PQ AUC0-24 at D1
combining DM09-006 (low and high/kcal meal) and DM04-009 (Without concomitant food)
Figure 13
Assessment Report EMA/739355/2011 Page 55/129

2.4.4. Discussion on clinical pharmacology
The pharmacokinetics of PQP were characterised by a slow absorption process (its absorption being
influenced by food) and a very long half life of about 22 days. The long half-life is mainly due to the
very large volume of distribution observed in patients. PQP is poorly and very slowly metabolised in
humans.
The pharmacokinetics of DHA were characterised by rapid absorption and elimination. DHA volume of
distribution was quite low; it is known that DHA accumulates in erythrocytes. DHA was cleared mainly
by phase II metabolism to the glucuronide which was the main metabolite observed in vitro and in
vivo.
PQP undergoes enterohepatic recirculation and its absorption was influenced by food intake.
The effect of food on DHA absorption was investigated in a food interaction study to evaluate the effect
of food on both DHA and PQ after a single oral dose of Eurartesim in healthy male volunteers having a
body weight ≥75kg (ST3073 ST3074-DM09-008). A food effect for Eurartesim was found for both DHA
and PQP, on comparing the pharmacokinetic parameters administration following a high fat meal
compared with administration in the fasted state. This was clinically significant for PQP only.
Comparing the PQP pharmacokinetic parameters observed in this study and in adult patients, the
administration of Eurartesim without food is suggested, avoiding the overexposure caused by
concomitant food effect. The safety implications of different dosing conditions became apparent
following results obtained in newly conducted trial DM09-006, which showed a significant QTcF interval
prolongation effect compared to comparator (Riamet). This effect appeared to be emphasised by the
concomitant intake of Eurartesim with food which in turn increases the plasma concentration of PQP
The effect of concomitant administration of Eurartesim and known CYP3A4 inhibitors has not yet been
studied. In clinical trials conducted by the applicant, no difference in the safety profile of Eurartesim
became apparent in patients taking antibacterials, antimycotics and antivirals, when compared to
patients not exposed to these drugs. Nevertheless, the applicant has committed to perform three drug-
drug interaction studies with Eurartesim and other drugs that are metabolized via CYP 3A4
(clarithromycin, midazolam) and an oral contraceptive (ethinyl estradiol and levonorgestrel). These
studies are listed in the pharmacovigilance plan.
Data is currently missing from certain populations, including the European malaria patient population
and in particular Caucasian malaria patients. In healthy volunteer studies, 258 Caucasian subjects
were exposed to Eurartesim to date. Results from study ST3073/ST3074- DM09-007 revealed there
were no differences in PK between healthy Caucasian and healthy Asian volunteers.
2.4.5. Conclusions on clinical pharmacology
Data have shown that Eurartesim has a QT prolongation effect, especially if taken with food. Hence,
QTc prolongation is an identified important safety risk stated in the RMP. To minimise the potential
risk of cardiac arrhythmias, Eurartesim is contraindicated in patients who might be at particular risk of
developing cardiac arrhythmias. Additional risk minimisation measures are planned in this regard
(educational outreach programme to health care workers).
Neurotoxicity, albeit unlikely with orally administered DHA, is a potential concern flagged in the Risk
Management Plan (RMP).
Assessment Report EMA/739355/2011 Page 56/129

Missing data relate to some special populations and to drug interaction with CYP 3A4 metabolised
drugs / other antimalarial medicines. These concerns are noted in the RMP.
2.5. Clinical efficacy
2.5.1. Dose response studies
There were no dose-finding studies. The dose ratio of DHA and PQP and the dose regimen used for
adults and children in the two pivotal Phase III studies were selected based on previous published
studies.
2.5.2. Main studies
Data on the efficacy of Eurartesim in patients with uncomplicated P. falciparum malaria were
collected in four studies as shown in the table below.
The efficacy data available from the two Phase I/II studies were very limited.
Assessment Report EMA/739355/2011 Page 57/129

Table 24: Tabular Listing of the Sigma-Tau Clinical Studies to Support the Registration
of Eurartesim for Treatment of Uncomplicated P. falciparum Malaria.
Study
Dose*
Test Regimen
Comparator
Total No. of
Subjects
Subject Type
Main Efficacy Endpoint
Status
ST3073+ST3074 DM 04008 (Africa) Phase I/II
Dose range: 1.67-3.08 mg/kg/day DHA and 13.3-24.64 mg/kg /day PQP
20 mg DHA/160
mg PQP or 40 mg
DHA/ 320 mg PQP tablet.
3 oral doses in 48 hrs.
Not Applicable
32
Paediatric P.
falciparum malaria patients
To assess the PK of DHA and PQP by analysing serial blood samples during and after a therapeutic course in children with malaria
Completed
ST3073+ST3074 DM04009 (Asia) Phase I/II
Dose range: 1.6-3.64 mg/kg/day DHA and 12.8-29.12 mg/kg/day PQP
40 mg DHA/320 mg PQP tablet.
3 oral doses in 48 hrs.
Not Applicable
25
Adult P.
falciparum malaria patients
To assess the pharmacokinetics of DHA and PQP by analysing serial blood samples during and after a therapeutic course in adults with malaria.
Completed
ST3073+ST3074 DM040010 (Asia) Phase III
Dose range:1.67-3.33 mg/kg/day DHA and 13.3-26.7 mg/kg /day PQP
20 mg DHA/160 mg PQP
or 40 mg
DHA/320 mg PQP tablet.
3oral doses in 48hrs.
50 mg AS +250 mg
MQ
AS 4 mg/kg/day for 3 days + MQ 25 mg/kg divided into two doses
1150
Adult and paediatric
P. falciparum
malaria patients (even in
combination with other Plasmodia)
To demonstrate that the PCR-corrected cure rate of DHA/PQP at Day 63 is non-inferior to that of AS+MQ (non-inferiority margin=5%)
Completed
ST3073+ST3074 DM040011 (Africa) Phase III
Dose range: 1.6-3.64 mg/kg/day DHA and 12.8-29.12 mg/kg/day PQP
20mg DHA/160mg
PQP or
40mg DHA/320 mg PQP tablet
3 doses in
48 hrs
20 mg
A/120 mg L
2-6 tablets per day over 3 days
dependant on body weight
1553
Paediatric P.
falciparum malaria patients
To demonstrate that the PCR-corrected cure rate of DHA/PQP at Day 28 is non-inferior to that of A/L (non-inferiority margin=5%)
Completed
Each main phase III study included the following:
Clinical Development Committee (CDC): The CDC primarily addressed the scientific conduct, ethical
integrity and regulatory acceptability of the programme and comprised one representative from
Medicines for Malaria Venture (MMV), two from Sigma-Tau and the Co-ordinating Investigators of each
of the two Phase III studies.
Study Steering Committee (SSC): The SSC reported to the CDC and was responsible for protecting the
scientific conduct and integrity of the study. The SSC included at least one investigator from each
participating region in addition to the Co-ordinating Investigator.
Data Monitoring Committee (DMC): The DMC was responsible for performing an interim analysis for
sample size reassessment, monitoring all safety data during the course of the study and revising the
Assessment Report EMA/739355/2011 Page 58/129

primary efficacy data. The DMC included one statistician and four clinicians with malaria expertise who
were independent of Sigma-Tau and MMV.
Study DM040010 (Asia study)
A Phase III, Randomised, Non-Inferiority Trial, to Assess the Efficacy and Safety of
Dihydroartemisinin/Piperaquine (DHA/PQP, Artekin™) in Comparison with Artesunate +
Mefloquine (AS+MQ) in Patients Affected by Acute, Uncomplicated P. falciparum Malaria
Methods
This was a multi-centre, randomised, open label, two-arm parallel group study to determine whether
DHA/PQP was non-inferior to AS+MQ and to assess its safety and tolerability in Asian patients (adults
and children) with acute uncomplicated P. falciparum malaria. DM 040010 was conducted between
June 24 2005 and 7 April 2007 at 10 study sites spread across India (3), Laos (2) and Thailand (5).
Study Participants
DM 040010 was to enrol subjects aged between 3 months and 65 years (excluding pregnant or
lactating women) of body weight ≥ 5 kg who had microscopically confirmed mono-infection with P.
falciparum (parasitaemia 80 - 200,000/μL) or mixed infection in which the P. falciparum component
was to be 80-200,000/μL. They were also to have a history of fever or presence of fever (temperature
≥ 37.5°C).
Depending upon local practice, patients were admitted to hospital for either three or seven days and
then followed up as out-patients or all study visits were conducted as out-patients. The study report
states that the design of the study followed the 2003 WHO guidance regarding the minimum durations
of follow up according to local transmission. The study used the WHO-recommended follow-up periods
for regimens involving MQ (63 days) to accommodate the half-life. In addition, molecular genotyping
using PCR technology was used to distinguish between recrudescence and new infections and parasite
clearance was assessed from thick and thin blood smears.
Treatments
Subjects were randomised to DHA/PQP or comparator AS/MQ (Artequin).
Artequin was manufactured by Mepha, Switzerland.
DHA/PQP and AS were each given orally once daily for three days. The daily dose of AS was 4
mg/kg/day which equated to four 50 mg tablets/day for a 50 kg person or 4 ml/day of a 10 mg/mL
suspension (actually given as crushed or dissolved tablets in water) for a 10 kg child.
MQ was given once daily with AS on the second and third day of AS dosing. The dose of MQ was
25 mg/kg divided into two doses, which equated to a total of five 250 mg tablets for a 50 kg
person or 5 mL of a 50 mg/mL suspension (dissolved tablets in water) for a 10 kg child.
Doses were calculated by body weight as shown in the table below.
Assessment Report EMA/739355/2011 Page 59/129

Table 24: DHA/PQP Dosing Regimen
Body weight (kg DHA Dose/Tablet
(mg)
PQP Dose/Tablet
(mg)
No. Tablets/Dose
or/Day 4* - 6 10 80 ½ ** 7 – 12 20 160 1** 13 – 23 40 320 1 24 – 35 80 640 2 36 – 75 120 960 3
*5 kg was the minimum weight required for study entry. **Paediatric tablet
Dosing was with water and without regard to last food intake. Patients were observed for one hour
after dosing to ensure that the medication was not vomited or spat out. If the dose was vomited within
30 minutes of dosing, a further full dose was given. If the dose was vomited between 31 and 60
minutes after dosing, a further half dose was given. Patients who vomited twice were withdrawn.
During the study the following treatments were forbidden:
Any other anti-malarial treatment.
Antibacterial agents with antimalarial activity (e.g. erythromycin or other macrolides, co-
trimoxazole or other sulfonamides, any tetracycline, quinolones, clindamycin).
Patients were withdrawn from the study if any of the above drugs were taken.
Chloroquine was allowed for the treatment of non-falciparum infections occurring during follow up.
Parents and parents/guardians were discouraged from obtaining drugs from private pharmacies or
physicians.
Rescue Treatments
Patients with treatment failure were withdrawn from the study, treated and followed up as per local
practice. They did not have to undergo efficacy evaluation thereafter. Patients requiring rescue therapy
were treated with AS 2 mg/kg/day orally for seven days plus doxycycline (if there was no
contraindication) in accordance with the recommended second-line antimalarial treatment in the WHO
2006 treatment guideline. Any patient diagnosed with severe malaria or danger signs during follow-up
was referred for treatment with parenteral artesunate and supportive measures at the local facility or
hospital.
Objectives
The study aimed to demonstrate that the PCR-corrected cure rate of DHA/PQP was non-inferior to that
of the comparator. This cure rate was defined as the proportion of patients with adequate clinical and
parasitological response (ACPR) at Day 63 plus those treatment failures (TFs) identified as new P.
falciparum (by PCR) and non-falciparum infections.
In order to compare the study results with the historical ones, the criteria described by WHO (2003)
were used. These failure rates computed in each treatment group were judged against the efficacy
threshold of 90% (WHO 2006). An efficacy threshold of <90%, obtained in an analysis carried out in
accordance with the WHO requirements, indicates that a treatment should not be considered for first-
line treatment policy.
Assessment Report EMA/739355/2011 Page 60/129

Outcomes/endpoints
Thick and thin Giemsa stained blood smears were obtained to verify the presence of P. falciparum and
to calculate asexual and sexual parasite density. Films were examined at the study site with a
binocular light microscope under oil immersion at 1000x magnification. At least 100 thick film fields
were examined. Counting was based on at least 200 leucocytes on the thick blood film according to
WHO standards. The parasite density was calculated according to standard formulae.
Blood smears were collected using kits provided by MDS and a proportion was randomly chosen for QC
testing. However, errors at MDS resulted in its replacement by Muhimbili University of Health and
Allied Sciences, Department of Parasitology & Medical Entomology, Dar Es Salaam, Tanzania. The Data
Monitoring Committee (DMC) was responsible for evaluating the findings.
PCR was used to genotype P. falciparum at the Prince Leopold Institute of Tropical Medicine (ITM) in
Antwerp, Belgium. The QC plan was for 20% to be re-analysed at the MDS Central Laboratory in
Beijing but this laboratory did not use the same procedures and therefore the SMRU in Thailand was
appointed instead. All PCR gels were also read by an independent expert (Paris). The DMC was
responsible for providing a critical evaluation of the findings.
The study aimed to demonstrate that the PCR-corrected cure rate of DHA/PQP was non-inferior to
that of the comparator. This cure rate was defined as the proportion of patients with adequate clinical
and parasitological response (ACPR) at Day 63 plus those treatment failures (TFs) identified as new P.
falciparum (by PCR) and non-falciparum infections.
ACPR was defined as absence of parasitaemia through to Day 63 irrespective of temperature and not
meeting any of the criteria for early treatment failure (ETF) or late clinical (LCF) or parasitological
failure (LPF). TF was defined as the sum of early and late TFs (ETF+LTF).
ETF was defined as:
1. Development of danger signs or severe malaria on Days 0, 1, 2 or 3, in the presence of
parasitaemia.
2. Parasite density on Day 2 > Day 0 count, irrespective of temperature.
3. Presence of parasitaemia on Day 3 with fever (temperature ≥37.5°C).
4. Parasitaemia on Day 3 ≥25 % of count on Day 0.
LTF could be due to Late Clinical Failure (LCF) or Late Parasitological Failure (LPF):
LCF was defined as:
1. Development of danger signs or severe malaria after Day 3 in the presence of parasitaemia.
2. Presence of parasitaemia and fever on any day from Day 4 to Day 63, without previously meeting
the criteria of ETF or LCF.
LPF was defined as reappearance of parasitaemia after initial clearance between Day 7 and Day 63
(identified as recrudescent infection by PCR analysis) in the absence of fever (temperature <37.5°C)
without previously meeting the criteria of ETF or LCF.
According to the protocol, efficacy analyses were to be performed on the pure Intention-To-Treat
(pure-ITT; all treated), modified ITT (m-ITT; pure-ITT population with the exclusion of those patients
lost-to-follow up for unknown reasons before Day 63) and the Per Protocol (PP; pure-ITT with no major
protocol violations) populations. The m-ITT and the PP populations were the co-primary populations
Assessment Report EMA/739355/2011 Page 61/129

Sample size
The sample size was initially computed using the original formulation of the primary objective (with
two co-primary objectives) which required a simulation. From this simulation it was concluded that if
the PCR-corrected cure rate at Day 63 in the ITT population was in the range of 92-95% for AS+MQ, a
sample size of 350 patients in the AS+MQ arm and 700 patients in the DHA/PQP arm (1050 patients in
total) was needed. With the third protocol amendment a new formulation of the sample size
requirement was written.
Randomisation
A randomisation list was generated before the study started. Treatment allocation was concealed until
the subject had completed the screening procedures and was deemed eligible for the study. The
treatment allocation was contained in a sealed envelope. A procedure was established for opening a
sealed envelope.
Subjects were randomised to either DHA/PQP or AS+MQ in a 2:1 ratio
Blinding (masking)
This was a randomised open label study. The study used an open label design because of the
complexity of establishing a double-blind dosing schedule involving placebo tablets of DHA/PQP and
placebo tablets of AS+MQ. Procedures to minimise bias in the treatment comparison, especially to
reduce the investigator’s bias and the bias in the assessment of the primary endpoint are described.
All decisions pertaining to the allocation of patients to various analysis populations and the assessment
of the primary endpoint were conducted in blinded conditions and without knowledge of the PCR
results.
Statistical methods
The lower limit of the one-sided 97.5% confidence interval (CI; = lower limit of the two-sided 95% CI)
for the treatment difference in the percentage of PCR-corrected cure rates (ACPR) at Day 63 was
computed. In order to confirm non-inferiority of DHA/PQP versus the comparator the CI lower limit was
to be >-0.05 (i.e. within -5%) in both the m-ITT and the PP populations.
The PCR-corrected cure rates at Day 63 were to be described by country. The Breslow-Day test (if
each country has at least two failures for each treatment) or logistic regression (otherwise) were to be
used to evaluate homogeneity across countries. A similar approach was taken to analysis of outcomes
by age groups.
A range of sensitivity analyses was pre-defined. These included analyses in which:
All patients with missing parasitaemia were treated as failures
All patients with new infections as detected by PCR were excluded from the analysis (this analysis
was added post hoc) following the suggestion of the study investigators.
Assessment Report EMA/739355/2011 Page 62/129

Results
Participant flow (Figure 14)
Recruitment
In the Asian study, patients were recruited from India, Laos and Thailand. The distribution by country
is presented in table 21 below:
Assessment Report EMA/739355/2011 Page 63/129

Table 25: Patient Accountability by Country - Study ST3073+ST3074 DM040010
(Safety/ITT Population)
DHA/PQP AS+MQ Country
n % n %
Safety/ITT 767 381
India 101 13.17 49 12.86
Laos 200 26.08 98 25.72
Thailand 466 60.76 234 61.42
Conduct of the study
Overall there were four (stated in the study report but five actually listed) general protocol
amendments, one country-specific protocol amendment for India and one site-specific amendment for
SMRU in Thailand. Other changes in the study conduct versus the protocol were found a posteriori.
These included lack of standardisation of randomisation procedure, missed visit assessments, slight
changes in the definition of parasite clearance and in the lay-out of the mock tables/listings and the
addition of some statistical analyses not planned in the SAP.
General Protocol Amendments
The final protocol (10 January 2005) was amended twice before and three times after enrolment had
started. The three amendments after enrolment had started were as follows:
24 November 2005
The DMC advised harmonising the statistical approaches for the two Phase III studies. In addition, the
DMC had concerns about the co-primary endpoint the cure rate of DHA/PQP must be at least 90% and
considered that it was necessary to distinguish between the two objectives of proving non-inferiority
and of comparing the results with historical ones. As a consequence power was recalculated for each
objective separately.
For the Non-Inferiority Analyses
The clinical and statistical specifications for the sample size computations were as follows:
Primary endpoint = PCR corrected cure rate at Day 63
Primary analysis = based on 97.5% one-sided CIs for the difference in cure rates
Alpha = 0.025 (one-sided)
Power = 80% (for a null hypothesis of a treatment difference worse than -5% and an alternative
hypothesis of 0 difference between treatments)
PCR-corrected cure rate of DHA/PQP and AS+MQ in the pure-ITT population at Day 63 = at least
92%
Non-inferiority margin for the difference (test-reference) = -0.05 (equivalent to -5%)
Randomisation: based on a 2:1 allocation scheme (test vs. reference).
Rate of patient attrition in the m-ITT population compared to pure-ITT (i.e. rate of non-informative
withdrawals) = 5%. Expected 63 day PCR corrected cure rate in mITT = 93%.
Assessment Report EMA/739355/2011 Page 64/129

Rate of patient attrition in the PP population compared with the ITT population (i.e. rate of
withdrawals for any reason and protocol violations) = 20%. Expected 63 day PCR corrected cure
rate in this population = 95%
Primary analysis populations = both the m-ITT and the PP populations.
With these assumptions the sample size of 1050 patients (700 DHA/PQP and 350 AS+MQ) provided a
power of approximately 80% for the lower bound of a 97.5 one-sided CI for the treatment difference
being above -0.05 in the m-ITT and 84% for the same analysis in the PP population (for the power
calculation both continuity correction and the inequality of variances under the null hypothesis were
considered).
For the Historical Comparisons
A secondary objective of the study was that of estimating the failure rates within each treatment group
in accordance with WHO criteria. The clinical and statistical specifications for the sample size
computations for this analysis were as follows:
Anticipated population proportion of clinical failures = as high as 10%
Confidence level = 95% (two-sided interval)
Precision = 5 percentage points.
Rate of patient attrition in the PP population as compared to the ITT population (i.e. rate of
withdrawals for any reason and protocol violations) = 20%.
According to WHO (2003) a sample size of at least 175 patients would be required in each treatment
group for estimating the proportion of clinical failures to within a 5 percentage point of the true value
with 95% confidence.
This amendment also acknowledged that:
China would not be participating.
The number of sites in Laos would increase from one to two.
There would be no stratification by age in the study.
Persistent vomiting occurring on any day, not just Day 0, was a withdrawal criterion.
13 September 2006
This was required because delays in obtaining Thai regulatory approval for two of the five centres
resulted in patients being recruited over two malaria seasons. Thus it was necessary to add testing for
any cohort effect to the statistics section.
27 December 2006
This was required to increase the total number of patients to be recruited to from 1050 to 1150 (767
DHA/PQP, 383 AS+MQ) to fulfil an Indian regulatory requirement to ensure that at least 100 patients
recruited from Indian sites were exposed to DHA/PQP.
Thailand SMRU
This protocol amendment (6 January 2006) was required because the Thai MoPH EC did not want
children to be recruited to the study: only adults aged ≥18 years could be included.
India Country Specific
Assessment Report EMA/739355/2011 Page 65/129

This protocol amendment (21 April 2006) was required in order to accommodate local practices as
follows:
Recruitment restricted to adults aged ≥ 18 years.
Prohibition of chloroquine during the study because it was still effective against P. falciparum in
some regions of India.
Baseline data
Approximately 75% of the study population was male, all were Asian, the mean age was approximately
25 years and the mean body weight was 44 kg. In Laos the means were lower because both adults and
children were recruited to the study while only adults were enrolled in India and few children were
recruited in Thailand before the implementation of a protocol amendment restricting the study to
adults. In Laos approximately 60% were male compared with approximately 80% in India and
Thailand.
Geometric mean baseline parasite density was slightly higher in the AS+MQ treatment group compared
with the DHA/PQP group in all study populations. Baseline parasite density also varied between
countries, with the highest densities occurring in Laos and the lowest densities occurring in India.
Numbers analysed
The datasets analysed were as follows:
Table 26:
ST3073+ST3074 DM040010
Data Set DHA/PQP AS+MQ n % n % Randomized 769 381 Safety 767 99.74 381 100 ITT 767 99.74 381 100 m-ITT 726 94.41 361 94.75 PP 668 86.87 336 88.19
Outcomes and estimation
In the primary analysis the comparisons of PCR-corrected and uncorrected cure rates resulted in
97.5% CI within -3.1%, with and without continuity corrections. The differences between uncorrected
cure rates were statistically significant in the m-ITT (p = 0.006) and PP populations (p=0.002) in
favour of Eurartesim and the one-sided 97.5% CI exceeded zero for all comparisons of uncorrected
cure rates.
Assessment Report EMA/739355/2011 Page 66/129

Table 27: Summary of Cure Rates at Day 63 – (All Populations)
The effects of implementing the various pre-planned input strategies for patients who were lost-to-
follow-up and patients without a valid PCR result (pure-ITT population) gave PCR-corrected cure rates
that ranged from 90.55 - 97.25% for the DHA/PQP group and from 89.24 - 96.33% for the AS+MQ
group. For all strategies, the 97.5% one-sided CI was within -5%.
The sensitivity analysis in which patients with missing parasitaemia results were classified as TFs
resulted in a difference in PCR-corrected cure rate between treatments that was not statistically
significant. The 97.5% one-sided CI was within -5% in the m-ITT and PP populations. The difference
between the treatment uncorrected cure rates was statistically significant but the cure rates were
lower.
Excluding patients with new infection detected by PCR reduced the PCR-corrected cure rates but the
97.5% one-sided CI was within -5% in all populations. There was a higher proportion of new infections
in the AS+MQ group compared with the DHA/PQP group.
Rates of recrudescent infections were low. In the m-ITT, the proportion of patients classified as
recrudescence because of withdrawal or TF before Day 4 was 1.1% in the DHA/PQP group and 0.8% in
the AS+MQ group. In the PP population the proportions with new P. falciparum infections were
comparable between treatments but the proportions with infections due to other plasmodia were
12.9% in the DHA/PQP group compared to 19.3% in the AS+MQ group.
Assessment Report EMA/739355/2011 Page 67/129

Table 28: Details of the Classification of Patients by PCR-Corrected Cure Rates (ACPR) at
Day 63 – DHA/PQP (All Populations)
Table 29: Details of the Classification of Patients by PCR-Corrected Cure Rates (ACPR) at
Day 63 – AS+MQ (All Populations)
The minimum age was 6 months and very few children aged < 2 years were enrolled. The pure-ITT
population results showed a decrease in PCR-corrected rates with increasing age (to < 90% for
subjects aged 12 years or more) as shown below. In the m-ITT and PP populations, when stratified by
age, there was no statistically significant difference in the PCR-corrected cure rates between
treatments.
In the pure-ITT population shown below (p = 0.022) and in the m-ITT and PP populations (p = 0.013
for both) a statistically significant difference in the uncorrected cure rates was seen between
treatments in the 18-65 year age group with higher rates for DHA/PQP and one-sided 97.5% CI above
zero. This difference is stated to be due to more recrudescent infections and other plasmodial
infections in the AS+MQ group than in the DHA/PQP group. In each population the uncorrected cure
rates for both treatments in patients aged 18-65 years were lower than those seen in patients aged
<18 years, suggesting that they had more new infections than patients aged <18 years.
Assessment Report EMA/739355/2011 Page 68/129

Table 30: Summary of Cure Rates at Day 63 – by Age Classification (All Populations)
The difference between the PCR-corrected cure rates in Asian adults and adolescents vs. younger
patients in the Pure ITT population (which was apparent in both treatment groups) were accounted for
by the higher rates of LFU and missing PCR results. Subjects LFU and with missing PCR occurred more
often in some countries and because of the different age ranges enrolled the effect appeared to be
age-dependent when in fact it was a country-dependent effect. No significant effect of weight was
detected.
There were differences between the uncorrected cure rates in adults vs. younger subjects in all
analysis populations and such differences were apparent in both treatment groups. Within the
DHA/PQP group these differences were not explained by age itself but by country and body weight.
The applicant considered that the country effect could be explained by the variable transmission
rates in different geographical areas.
The applicant acknowledged that body weight appeared to have a role in predicting uncorrected
cure rates that is independent of country but stressed that the differences by class of body weight
still supported the efficacy of DHA/PQP vs. the comparator. On this basis the applicant considered
that the data supported a dose adjustment according to body weight.
The PCR-corrected and uncorrected cure rates showed some variations between countries for each
treatment. Within each country all rates were either comparable or slightly higher in the DHA/PQP
group versus the AS+MQ group. The 97.5% one-sided CI for the difference (DHA/PQP-AS+MQ) in PCR-
corrected cure rate adjusted by country was -0.84% in the m-ITT and -0.39% in the PP population.
Assessment Report EMA/739355/2011 Page 69/129

Table 31: Summary of Cure Rates (ACPR) at Day 63 by Country (All Populations)
Cure rates at Day 63 by country when non-interpretable, missing or not done PCRs were treated as
either failures, successes or led to the exclusion of the corresponding patients showed the largest
effect in Thailand. However, in each case the PCR-corrected and uncorrected cure rates for the m-ITT
population were statistically homogeneous across countries and the 97.5% one-sided CI for the
differences were within -5%.
In the Pure ITT population the overall PCR-corrected cure rates for DHA/PQP and for AS+MQ in India
and Thailand were lower than corresponding rates for Laos. This was not observed in the other analysis
populations. The applicant stated that the findings in the two treatment groups mainly reflected:
LFU rates: no Laotian subject was LFU compared to 15% of Indian and 5% of Thai subjects
(regardless of treatment group)
Missing PCR results: 0-3% in India, 7-8% in Thailand vs. only one patient in Laos
The PCR-corrected cure rates for India appeared to decrease with age and body weight but weight was
not found to be statistically significant in a logistic model based on the probability of cure that was
applied to Pure ITT subjects in the DHA/PQP group.
The country-specific uncorrected cure rates appeared to decrease with increasing age in India and
Thailand but there was little or no such effect in Laos. A trend for lower uncorrected cure rates with
increasing weight was most apparent in India, was less consistent in Thailand and there was no clear
trend in Laos. In a logistic model based on the probability to be cured in the DHA/PQP group the
weight factor was found to be statistically significant in all analysis populations whereas the age factor
was found to be statistically significant only in the Pure ITT population.
The proportions of patients with malaria due to other plasmodium species were similar between
treatment groups. The proportions with new infections at Thai centres 12, 18 and 19 were lower than
observed at all other centres, which suggested a lower malaria transmission rate although it should be
noted that some new infections might have been missed because parasite density was not measured
on Days 35, 49 or 56 at these three centres.
In addition, the uncorrected cure rates in the m-ITT and PP populations at centres 21 and 22 in
Thailand were much lower than those seen at other centres. In the m-ITT population the uncorrected
cure rates at centre 21 were 45.4% (DHA/PQP) vs. 31.3% (AS+MQ) and at centre 22 they were
43.7% (DHA/PQP) vs. 28.2% (AS+MQ) compared with 71.1% (DHA/PQP) and 62.9% (AS+MQ) for all
centres. The results indicated that there were more new infections at centres 21 and 22 during the
study compared with other centres including the other three Thai centres. Although patients at centres
Assessment Report EMA/739355/2011 Page 70/129

12, 18 and 19 were treated in Bangkok, all Thai patients were recruited from the Thai-Burmese border
region so it is unlikely that this difference was due to geographic location. Patients at centres 21 and
22 were only recruited to the second cohort and all were adults, so it was considered possible that
seasonal variation in the malaria transmission rate, with a higher transmission during the second
recruitment period, explained the lower uncorrected cure rates.
The early, late and true treatment failure rates at Day 63 were comparable between treatments in
each population. The rates for the pure-ITT population are shown below.
Table 32: Summary of Early and Late Treatment Failure and True Treatment Failure Day
63 (Pure-ITT Population)
At Day 28, there was a statistically significant difference between treatments (with lower rates for
DHA/PQP) for the sum of ETF and LTF in the m-ITT population, which reflected the difference in LTF.
Rates of ETF+LTF were also lower in the DHA/PQP group in the PP and pure-ITT populations. True TF
rates were also lower with DHA/PQP and statistically significantly different in the PP population (p =
0.003). The 95% two-sided CIs for this comparison was (-3.49, -0.38%). The Day 42 findings showed
the same pattern as at day 28.
There was no statistically significant difference between treatment groups in the proportion of
aparasitaemic patients up to Day 3 in either the m-ITT or PP populations. The apparent fall in the
proportion of aparasitaemic patients on Day 3 is because patients in Laos (approximately 25% of study
population) did not have Day 3 assessments. The median time to parasite clearance (Kaplan-Meier
estimate) was two days for DHA/PQP and AS+MQ in all three study populations.
Assessment Report EMA/739355/2011 Page 71/129

Table 33: Proportion of Aparasitaemic Patients Days 1 – 3 (m-ITT and PP Populations)
The apparent fall in the proportion of afebrile patients on Day 3 is also due to the lack of assessments
in Laos. The median time to fever clearance could not be calculated because of too few assessments.
Table 34: Proportion of Afebrile Patients Days 0 – 3 (m-ITT and PP Populations)
In the m-ITT population there was a statistically significant difference between treatments in fever rate
on Day 1 (5.65% for DHA/PQP compared with 9.14% for AS+MQ; p =0.031). However, there were
949/5039 person-fever-days in the DHA/PQP group compared with 478/2511 in the AS+MQ group.
Gametocytes were not assessed at Day 0. At Day 28 the proportion of patients with gametocytes was
1.24% (DHA/PQP) vs. 0% (AS+MQ) for the m-ITT and 1.05% vs. 0% (AS+MQ) for the PP population.
Patients from centres 12, 18 and 19 did not have gametocytes assessed at Days 35, 49 and 56.
Overall in the m-ITT population, gametocyte prevalence in the DHA/PQP group was 9.69% vs. 4.8% in
the AS+MQ group. Person-gametocyte-weeks for the DHA/PQP group were five times that seen in the
AS+MQ group (119/6276 person-weeks vs. 23/3052 person-weeks, which was statistically significant
(p = 0.026). Rates in the PP population were 101/5861 person-weeks vs. 23/2884 person weeks,
which was not a statistically significant difference (p = 0.064). These data indicated that DHA/PQP has
a lesser gametocytocidal effect than AS+MQ.
In the DHA/PQP group, the incidence of new infections was lower than seen in the AS+MQ group and
the Kaplan-Meier curves showed that new infections tended to occur earlier after comparative
treatment.
Assessment Report EMA/739355/2011 Page 72/129

Table 35: New Infections at Day 63 (All Populations)
In the m-ITT and PP populations there was no significant difference between treatments in Hb change
from baseline to either Days 28, 63 or to the last available data (LAD) using either the actual change in
Hb or the last observation carried forward (LOCF) method.
In the pure-ITT population the mean Hb fell from 118.2 g/L (DHA/PQP) and 120 g/L (AS+MQ) on Day
0 to a nadir of 107.3 g/L (DHA/PQP) 109.9 g/L (AS+MQ) on Day 7, before increasing steadily
thereafter. A similar trend was observed for Hct.
For the QC of PCR results the proportion of inconsistencies between the ITM laboratory and the
independent expert (Professor G. Snounou) was 11/156 (7.1%). In addition, 35 samples were re-
analysed by the SMRU laboratory and the proportion of inconsistencies between ITM and SMRU was
2/35 (5.7%), which was considered acceptable.
Results of the QC of parasitaemia slides at baseline and follow-up gave an estimated type 1
discrepancy rate (i.e. inversion of results among readers) between the site and the central laboratory
of 12.7% (95% CI 10.7, 14.9), which was considered to be at the upper limit of acceptability. The high
percentage of false positive results might have been due to deteriorating slide quality in the interval
between the initial reading and the QC reading. The high percentage of false positive results in India
might have led to an over-estimation of cure rates but the study report states that this would have
been accounted for by the ITT analysis.
Ancillary analyses
After application of the WHO criteria (WHO, 2003) in order to compare the study results with the
historical ones the Kaplan-Meier estimate of the true failure rates was less than 5% for both
treatments. Therefore, the PCR-corrected cure rates defined by WHO (100 - true failure rate) for both
treatments exceeded the 90% WHO threshold and the currently accepted 95% threshold on Days 63,
28 and 42. At Day 63 the PCR-corrected cure rates were 98.17% for DHA/PQP and 96.79% for
AS+MQ.
Assessment Report EMA/739355/2011 Page 73/129

Table 36: PCR-Corrected Cure Rates (ACPR) for Historical Comparisons (PP Population)
Study DM040011 (Africa study)
A phase III, randomised, non-inferiority trial to assess the efficacy and safety of
Dihydroartemisinin + Piperaquine (DHA/PQP, Artekin™) in comparison with Artemether +
Lumefantrine (A/L Coartem®) in children with uncomplicated P. Falciparum malaria
Methods
This was a multi-centre, randomised, open label, two-arm parallel group study to determine whether
DHA/PQP was non-inferior to Coartem (artemether-lumefantrine) and to assess its safety and
tolerability in African children with acute uncomplicated P. falciparum malaria. DM 040011 was
conducted between 16 August 2005 and 14 July 2006 at five study sites, one in each of five African
countries
Study Participants
DM 040011 was to enrol subjects aged between 3 and 59 months of body weight ≥ 5 kg who had
microscopically confirmed mono-infection with P. falciparum (parasitaemia 200 - 200,000/μL). They
were also to have a history of fever or presence of fever (temperature ≥ 37.5°C). The general
approach was as described for DM04010
Treatments
Subjects were randomised to DHA/PQP or comparator A/L (Coartem):
Coartem was manufactured by Novartis and only tablets containing artemether 20mg and lumefantrine
120mg were used. Dosing was as in the table followed immediately by a glass of milk.
Assessment Report EMA/739355/2011 Page 74/129

Table 37
The general approach to dosing was as in DM04010.
Objectives
The study aimed to demonstrate that the PCR-corrected cure rate of DHA/PQP was non-inferior to that
of the comparator. This cure rate was defined as the proportion of patients with adequate clinical and
parasitological response (ACPR) at Day 28 plus those treatment failures (TFs) identified as new P.
falciparum (by PCR) and non-falciparum infections.
In order to compare the study results with the historical ones, the criteria described by WHO (2003)
were used. These failure rates computed in each treatment group were judged against the efficacy
threshold of 90% (WHO 2006). An efficacy threshold of <90%, obtained in an analysis carried out in
accordance with the WHO requirements, indicates that a treatment should not be considered for first-
line treatment policy.
Outcomes/endpoints
Thick and thin Giemsa stained blood smears were obtained to verify the presence of P. falciparum and
to calculate asexual and sexual parasite density. The used methodology is as described for study
DM040010.
The study aimed to demonstrate that the PCR-corrected cure rate of DHA/PQP was non-inferior to
that of the comparator. This cure rate was defined as the proportion of patients with adequate clinical
and parasitological response (ACPR) at Day 28 plus those treatment failures (TFs) identified as new P.
falciparum (by PCR) and non-falciparum infections.
ACPR was defined as absence of parasitaemia through to Day 28 irrespective of temperature and not
meeting any of the criteria for early treatment failure (ETF) or late clinical (LCF) or parasitological
failure (LPF). TF was defined as the sum of early and late TFs (ETF+LTF).
ETF was defined as:
1. Development of danger signs or severe malaria on Days 0, 1, 2 or 3, in the presence of
parasitaemia.
2. Parasite density on Day 2 > Day 0 count, irrespective of temperature.
3. Presence of parasitaemia on Day 3 with fever (temperature ≥37.5°C).
4. Parasitaemia on Day 3 ≥25 % of count on Day 0.
Assessment Report EMA/739355/2011 Page 75/129
LTF could be due to Late Clinical Failure (LCF) or Late Parasitological Failure (LPF):
LCF was defined as:
1. Development of danger signs or severe malaria after Day 3 in the presence of parasitaemia.
2. Presence of parasitaemia and fever on any day from Day 4 to Day 28, without previously meeting
the criteria of ETF or LCF.
LPF was defined as reappearance of parasitaemia after initial clearance between Day 7 and Day 28
(identified as recrudescent infection by PCR analysis) in the absence of fever (temperature <37.5°C)
without previously meeting the criteria of ETF or LCF.
According to the protocol, efficacy analyses were to be performed on the pure Intention-To-Treat
(pure-ITT; all treated), modified ITT (m-ITT; pure-ITT population with the exclusion of those patients
lost-to-follow up for unknown reasons before Day 28) and the Per Protocol (PP; pure-ITT with no major
protocol violations) populations. The m-ITT and the PP populations were the co-primary populations
Sample size
For DM 040011 the simulation concluded that if the PCR-corrected cure rate at Day 28 in the ITT
population was in the range of 91 - 93% for A/L then a sample size of 500 patients in the A/L arm and
1000 patients in the DHA/PQP arm (1500 patients in total) was needed. A new formulation of the
sample size requirement was part of the second protocol amendment. It was initially intended that
each of the five sites would enrol 300 subjects to obtain the total of 1500 but this target was later
increased to 500 for Mozambique due to under-enrolment in Kenya and Uganda in response to
environmental conditions.
Randomisation
Subjects were randomised to DHA/PQP or comparator in a 2:1 ratio using sealed envelopes.
Blinding (masking)
An open label design was used because of the complexity of establishing a double-blind dosing
schedule involving placebo tablets of DHA/PQP and placebo tablets of the comparator A/L.
All decisions pertaining to the allocation of patients to various analysis populations and the assessment
of the primary endpoint were conducted in blinded conditions and without knowledge of the PCR
results. The approach was as in DM04010.
Statistical methods
The lower limit of the one-sided 97.5% confidence interval (CI; = lower limit of the two-sided 95% CI)
for the treatment difference in the percentage of PCR-corrected cure rates (ACPR) at Day 28 was
computed. In order to confirm non-inferiority of DHA/PQP versus the comparator the CI lower limit was
to be >-0.05 (i.e. within -5%) in both the m-ITT and the PP populations.
The PCR-corrected cure rates at Day 28 were to be described by country. The Breslow-Day test (if
each country has at least two failures for each treatment) or logistic regression (otherwise) were to be
used to evaluate homogeneity across countries. A similar approach was taken to analysis of outcomes
by age groups.
Assessment Report EMA/739355/2011 Page 76/129

A range of sensitivity analyses was pre-defined. These included analyses in which:
All patients with missing parasitaemia were treated as failures
All patients with new infections as detected by PCR were excluded from the analysis (this analysis
was added post hoc) following the suggestion of the study investigators.
Results
Participant flow
Figure 15: Patient Disposition
Of the 1039 patients randomised to DHA/PQP, 907 (87.3%) completed the study up to Day 28
compared to 390/514 (75.9%) patients randomised to A/L. Similarly, in the DHA/PQP group, 767
(73.8%) patients completed the study up to Day 42 compared to 332 (65%) in the A/L group.
Completing the study meant that patients either reached a failure outcome or reached the last day of
follow-up and the difference between treatments mainly reflected the failure rates
Recruitment
Five countries were involved in the African study, with 1 centre per country: Burkina Faso, Kenya,
Mozambique, Uganda, and Zambia.
Assessment Report EMA/739355/2011 Page 77/129

Table 38: Patient Accountability by Country – Study ST3073+ST3074 DM040011
(Safety/ITT Population)
DHA/PQP A/L Country
n % n %
Safety/ITT 1038 510
Burkina Faso 201 19.36 100 19.61
Kenya 150 14.45 72 14.12
Mozambique 299 28.81 146 28.63
Uganda 185 17.82 91 17.84
Zambia 203 19.56 101 19.80
Conduct of the study
Changes in the conduct of the study included two general protocol amendments but only one of these
occurred after enrolment had started. The amended protocol 21 June 2005 was issued on 15
November 2005 in response to the DMC who advised harmonising the statistical approaches for both
studies in the Phase III programme. The changes were similar to those employed for study DM 040010
in the November 2005 amendment.
Baseline data
The minimum age enrolled was about 6 months in accordance with the protocol with mean and median
ages of around 2.35 years. Some children in the DHA/PQP group were clearly older than the upper age
limit in the protocol. Baseline parasite density was similar between treatment groups in all study
populations but varied between countries, with the highest densities occurring in Kenya and Zambia
and the lowest densities occurring in Burkina Faso. The overall range was 10,000 – 66,000 expressed
per µL.
All patients had a history of fever which was of moderate severity in 81% in each treatment group.
Fever was the only symptom that was considered severe (in 1.8% and 1% per group). Cough was the
second most frequently reported symptom (45% per group). Mild weakness, anorexia, vomiting and flu
symptoms were reported by >10% of patients in both treatment groups.
Data on medications taken before recruitment are likely unreliable but show that antipyretic drugs
were by far the most frequent previous medications and mostly paracetamol was used. Fewer than
10% of patients had taken antimalarial drugs before recruitment.
Numbers analysed
The datasets analysed were as follows:
Assessment Report EMA/739355/2011 Page 78/129

Table 39
Outcomes and estimation
For the primary endpoint in the m-ITT and PP populations the PCR-corrected cure rates gave one-sided
97.5% CI for the difference DHA/PQP-A/L within -5%. This finding also applied in the pure-ITT
population. For each treatment and population the uncorrected cure rates were lower than the PCR-
corrected rates. In addition, the uncorrected cure rates were notably higher in each population for
DHA/PQP and in each case the one-sided 97.5% CI exceeded zero.
Table 40: Summary of Cure Rates at Day 28 (All Populations)
The rate of recrudescence due to withdrawal or TF before Day 14 was slightly higher in the DHA/PQP
group in both populations. The rate of new infections was much lower in the DHA/PQP group in both
populations.
Assessment Report EMA/739355/2011 Page 79/129

Table 41: Details of the Classification of Patients by PCR-Corrected Cure Rates (ACPR) at
Day 28 – DHA/PQP (All Populations)
Table 42: Details of the Classification of Patients by PCR-Corrected Cure Rates (ACPR) at
Day 28 – A/L (All Populations)
At Day 28, the proportions of true treatment failures were comparable between treatments. The sum
of the ETFs and LTFs was lower for DHA/PQP than for A/L in all populations. This was mainly because
of the difference in LTF rates between treatments.
The rates of ETFs were low but were higher in the DHA/PQP group. In the pure-ITT population 9/12
ETF patients in the DHA/PQP group and both patients in the A/L group were from Uganda and the most
frequent reason for ETF was persistent vomiting at Day 0. Other reasons for ETF in the DHA/PQP group
were a convulsion at Day 0, severe malaria on Day 0 requiring quinine and quinine given on Day 1 plus
missing parasitaemia counts on Days 7 and 14.
Assessment Report EMA/739355/2011 Page 80/129

Table 43: Summary of Early and Late Treatment Failure and True Treatment Failure at
Day 28 (Pure-ITT Population)
When stratified by age there was no difference between treatments in PCR-corrected cure rates in any
study population but there was a statistically significant difference between treatments in uncorrected
cure rates in the 12 - 24 and >24 month age groups in all study populations (the results for the pure-
ITT population are shown below). In both these age sub-groups the uncorrected cure rate was higher
in the DHA/PQP group. In contrast, there was no statistically significant difference between treatments
in the uncorrected or PCR-corrected cure rates in children aged <12 months in any study population.
Table 44: Summary of Cure Rates at Day 28 by Age Classification (All Populations)
The applicant stated that the expected rate of new infections is lower (and therefore the uncorrected
cure rate is higher) in children aged ≤ 1 year due to some degree of shielding from mosquito bites as a
result of close contact with the mother and maternal antibody (placental and milk-borne).
Assessment Report EMA/739355/2011 Page 81/129

The 97.5% one-sided CI for the difference (DHA/PQP-A/L) in PCR-corrected cure rate adjusted by
country was -4.56% in the m-ITT and -2.20% in the PP population. Cure rates were consistently lower
for DHA/PQP versus A/L in Kenya (32). Removal of these data from the analysis did not notably affect
the overall findings of the study.
Table 45: Summary of Cure Rates (ACPR) at Day 28 by Country (All Populations)
The age and weight distributions of the children in Kenya versus the Other Countries (i.e. Mozambique,
Burkina Faso, Zambia and Uganda) grouped together are provided in the next two tables for the Pure-
ITT population.
Table 46: Patient Distribution by Age for Kenya and Other Countries (Pure-ITT
Population)
Kenya Other Countries Class of Age (yrs) DHA/PQP
(N=150) A/L
(N=72) DHA/PQP (N=888)
A/L (N=438)
≤ 1 24 16.00 15 20.83 105 11.82 53 12.10
(1-2] 47 31.33 20 27.78 254 28.60 133 30.37
(2-5] 79 52.67 37 51.39 529 59.57 252 57.53
Table 47: Patient Distribution by Weight for Kenya and Other Countries (Pure-ITT
Population)
Kenya Other Countries Class of Weight (kg) DHA/PQP
(N=150) A/L
(N=72) DHA/PQP (N=888)
A/L (N=438)
< 7 2 1.33% 1 1.39% 17 1.91% 6 1.37% 7 to < 13 127 84.67 60 83.33 618 69.60 294 67.12
13 to < 24 21 14.00 11 15.28 252 28.38 138 31.51
24 to < 36 0 0 1 0.11% 0
In Kenya and in Other Countries the majority of patients were aged from 2 to ≤ 5 years and weighed
from 7 to < 13 kg. Age and weight distributions were comparable between treatment groups within
Kenya and within the Other Countries. However in Kenya more patients assigned to DHA/PQP were
aged ≤ 2 years with respect to the Other Countries (47.3% vs. 40.4%) and, in parallel with the shift in
age distribution, more fell into the weight band ≥ 7 to < 13 kg (84.7% vs. 69.6%). The same pattern
of differences in age and weight distributions between Kenyan and other children applied in the A/L
group.
Assessment Report EMA/739355/2011 Page 82/129

The Cure Rates at Days 28 and 42 in Kenya and Other Countries were provided by age group and
overall and by class of body weight and overall. The PCR-corrected cure rates at D28 and D42 among
the Kenyan DHA/PQP patients did not show a trend to vary with age or weight. The applicant considers
that the apparent variation in the size of the treatment differences across the classes of age and
weight was due to fluctuation of results in the A/L group, which was considered to be random in
nature. The same conclusion was drawn with regard to the uncorrected cure rates. Since age and
weight did not seem to explain the lower cure rates observed with DHA/PQP in Kenya the applicant
explored other factors (e.g. parasite density at baseline) that might contribute to the finding but was
not able to identify any clear explanation. The applicant considers that the finding occurred by chance
among the relatively low numbers enrolled in Kenya.
Treating m-ITT patients with non-interpretable, missing or not done PCRs as either failures, successes
or excluding them had no statistically significant effect on the PCR-corrected cure rates and the 97.5%
one-sided CI was within 5% in all instances. However, all three approaches gave a highly statistically
significant effect on the uncorrected cure rate that reflected the data from Burkina Faso and Zambia
where the greatest difference between treatments in uncorrected cure rates was observed.
The results of the pre-planned input strategies for patients who were lost-to-follow-up and for patients
without a valid PCR result (pure-ITT population) gave PCR-corrected cure rates that ranged from 90.94
- 93.43% for the DHA/PQP group and 91.27 - 94.90% for the A/L group. For all strategies, the 97.5%
one-sided CI was within -5%. When all patients with missing parasitaemia data were classified as
failures the 97.5% one-sided CI remained within -5%. Excluding patients with new P. falciparum
infection detected by PCR or new non-falciparum infection had minimal effects on the PCR-corrected
cure rates and the 97.5% one-sided CI remained within -5% in all populations.
At Day 14 in both the m-ITT and the PP populations the lower limits of the two-sided 95% CI for PCR-
corrected cure rates were within -5%. There were no statistically significant differences in uncorrected
cure rates between treatments and these resembled their corresponding PCR-corrected rates. At Day
42 the PCR-corrected cure rates in the m-ITT and PP populations were slightly higher in the A/L group.
The lower limits of the two-sided 95% CIs were within -5% in the pure-ITT and the PP populations but
the limit was -6.55 in the m-ITT population. However, the treatment differences in uncorrected cure
rates were significant in all study populations in favour of the DHA/PQP group.
In the m-ITT population the rates of recrudescent infection at Day 42 were generally comparable
between treatments. The statistically significant difference (p < 0.001) in uncorrected cure rates
(ACPR) between treatments reflected the lower rates of new P. falciparum or non-falciparum infections
by Day 42 for DHA/PQP compared to A/L with rates of 11.9% vs. 21.1% in the m-ITT population and
12.4% vs. 22.1% in the PP population.
By Day 42, the sum of ETFs and LTFs for DHA/PQP was lower than for A/L at 19.8% vs. 27.8% (p <
0.001) in the m-ITT population and 18.7% vs. 26.4% (p < 0.001) in the PP population. This was due
to fewer LTFs (LCF and LPF) in the DHA/PQP group. The late treatment failure rates were 18.6% vs.
27.4% (p < 0.001) in the m-ITT and 18.6% vs. 26.4% (p < 0.001) in the PP population for respective
treatments. The true treatment failure rates were 6.3% vs. 4% in the m-ITT and 5.6% vs. 3.7% in the
PP population.
Assessment Report EMA/739355/2011 Page 83/129

Figure 16: PCR-Corrected and Uncorrected Cure Rates at Days 14, 28 and 42 (m-ITT
Population)
In each of the m-ITT and PP populations higher proportions of patients in the DHA/PQP group were
aparasitaemic on Day 1 (24 h after starting treatment). The median time to parasite clearance
(Kaplan-Meier estimate) was two days for both treatments in all three study populations.
Table 48: Proportion of Aparasitaemic Patients Days 0 – 3 (m-ITT and PP Populations)
Slightly higher proportions in the DHA/PQP group were afebrile at Day 1. Three measurements over a
48 h period were too few to allow calculation of the median time to fever clearance.
Assessment Report EMA/739355/2011 Page 84/129

Table 49: Proportion of Afebrile Patients Days 0 – 3 (m-ITT and PP Populations)
While comparable proportions (11-13%) in the treatment groups and populations had gametocytes at
enrolment a higher proportion in the DHA/PQP group still had gametocytes at Day 2 (16.7% vs. 9.3%
in the m-ITT population). This difference persisted and was statistically significant until Day 21 in both
study populations indicating that DHA/PQP had a lesser gametocytocidal effect than A/L.
There was no significant differences between treatments in Hb change from baseline to either Day 28
or Day 42 but changes to last available data (LAD) were statistically significantly different between
treatments (17.3 g/L DHA/PQP vs. 14.8 g/L A/L, ANOVA, p = 0.016 m-ITT and similar results for the
PP population), which may reflect the higher number of new P. falciparum infections by PCR and new
non-falciparum infections and thus associated anaemia occurring in the A/L-treated patients.
Quality control of PCR analyses showed that the proportion of inconsistencies between the ITM
laboratory and the independent expert (Professor G. Snounou) was 37/317 (11.7%). The rate of
inconsistencies between the ITM and the SMRU laboratories was 2/58 (3.4%), which was considered
acceptable. The level of agreement between the independent observers was adequate.
Quality control of parasitaemia slides at baseline and follow-up gave an estimated percentage of type I
discrepancies (i.e. inversion of results among readers) between the site and the central laboratory
readings of 7.6% (95% CI 5.9, 9.8), which was similar to that reported in the literature. Kenya did not
participate in this exercise.
Ancillary analyses
After applying the WHO criteria (WHO, 2003) the Kaplan-Meier estimate of the true failure rates at Day
28 was 2.77 for both treatments. Therefore, the PCR-corrected cure rates defined by WHO (100- true
failure rate) of both treatments were equal to 97.23% and exceeded both the 90% WHO threshold and
95% threshold for new treatments. The study report states that the performance of A/L in the present
study was consistent with that expected from the literature. For example, true failure rates in the PP
populations at day 28 of 1.9%, 3.2 % and 2.7% were reported in different studies. Higher rates were
reported in two publications: (7.0%; von Seidlein L et al 1997 and 8.9%; Kamya MR et al 2007) but
both of these studies were conducted in areas and seasons with a particularly high transmission rate.
Assessment Report EMA/739355/2011 Page 85/129

Table 50: PCR-Corrected Cure Rates (ACPR) at Day 28 for Historical Comparisons (PP
Population)
Summary of main studies
The following tables summarise the efficacy results from the main studies supporting the present
application. These summaries should be read in conjunction with the discussion on clinical efficacy as
well as the benefit risk assessment (see later sections).
Table 51: Table Summary of Efficacy for trial DM040010
Title: A Phase III, Randomised, Non-Inferiority Trial, to Assess the Efficacy and Safety of
Dihydroartemisinin/Piperaquine (DHA/PQP, Artekin™) in Comparison with Artesunate + Mefloquine (AS+MQ) in
Patients Affected by Acute, Uncomplicated P.falciparum Malaria
Study identifier ST3073+ST3074-DM040010
multi-centre, phase III, randomised, open label, two-arm parallel group study
Duration of main phase: 63 days (planned)
Duration of run-in phase: not applicable
Design
Duration of extension phase: not applicable
Hypothesis Non-inferiority
DHA/PQP Dihydroartemisinin/Piperaquine. 3 days, 769 Treatment groups
AS+MQ Artesunate+Mefloquine. 3 days, 381
Co-primary
endpoints
COR-MITT-D63
COR-PP-D63
Day 63 PCR-corrected cure rates in modified-ITT
and Per Protocol populations
S1:
COR-<POP>-
<DAY>
PCR-corrected cure rates at Days 28 and 42 in all populations
S2:
UNC-<POP>-
<DAY>
Uncorrected cure rates at Days 28, 42 and 63 in all
populations
S3 Proportion of patients with treatment failure
S4 Proportion of aparasitaemic patients and time to
parasitaemia clearance
S5 Proportion of afebrile patients and time to fever
clearance
S6 Proportion of patients with gametocytes at various
time points
S7 Haematological recovery
Endpoints and
definitions
Secondary
endpoints
S8 Compliance with study treatment
Assessment Report EMA/739355/2011 Page 86/129

Note: <POP>=MITT (Modified-ITT), PP (Per Protocol),
ITT (Pure ITT/Safety); <DAY>=28, 42, 63
Database lock 06 November 2007
Results and analysis
Analysis description Primary analysis: COR-MITT-D63 and COR-PP-D63
Analysis population and
time point description
Modified-ITT Population
Day 63
Treatment group DHA/PQP AS+MQ
Number of subjects 726 361
Descriptive statistics
COR-MITT-D63
(N (%))
704 (96.97%)
344 (95.29%)
Comparison groups DHA/PQP – AS+MQ
97.5% one-sided CI LL -0.84%
Effect estimate per
comparison
Primary endpoint
P-value 0.161
Notes CI LL = Confidence Interval Lower Limit
Analysis population and
time point description
Per Protocol Population
Day 63
Treatment group DHA/PQP AS+MQ
Number of subjects 668 336
Descriptive statistics
COR-PP-D63
(N (%))
659 (98.65%)
326 (97.02%)
Comparison groups DHA/PQP – AS+MQ
97.5% one-sided CI LL -0.39%
Effect estimate per
comparison
Primary endpoint
P-value 0.074
Notes CI LL = Confidence Interval Lower Limit
Analysis description Secondary analysis S1:
COR-MITT-D28, COR-MITT-D42,
COR-PP-D28, COR-PP-D42,
COR-ITT-D28, COR-ITT-D42, COR-ITT-D63
Analysis population and
time point description
Modified-ITT Population
Day 28
Treatment group DHA/PQP AS+MQ
Number of subjects 726 361
Descriptive Statistics
COR-MITT-D28
(N (%))
715 (98.48%)
348 (96.40%)
Comparison groups DHA/PQP – AS+MQ
97.5% one-sided CI LL -0.03%
Effect estimate per
comparison
P-value 0.028
Analysis population and
time point description
Modified-ITT Population
Day 42
Treatment group DHA/PQP AS+MQ Descriptive Statistics
Number of subjects 726 361
Assessment Report EMA/739355/2011 Page 87/129

COR-MITT-D42
(N (%))
709 (97.66%)
346 (95.84%)
Comparison groups DHA/PQP – AS+MQ
97.5% one-sided CI LL -0.52%
Effect estimate per
comparison
P-value 0.096
Analysis population and
time point description
Per Protocol Population
Day 28
Treatment group DHA/PQP AS+MQ
Number of subjects 668 336
Descriptive Statistics
COR-PP-D28
(N (%))
667 (99.85%)
329 (97.92%)
Comparison groups DHA/PQP – AS+MQ
97.5% one-sided CI LL 0.38%
Effect estimate per
comparison
P-value 0.001
Analysis population and
time point description
Per Protocol Population
Day 42
Treatment group DHA/PQP AS+MQ
Number of subjects 668 336
Descriptive Statistics
COR-PP-D42
(N (%))
663 (99.25%)
328 (97.62%)
Comparison groups DHA/PQP – AS+MQ
97.5% one-sided CI LL -0.12%
Effect estimate per
comparison
P-value 0.031
Analysis population and
time point description
Pure ITT Population
Day 28
Treatment group DHA/PQP AS+MQ
Number of subjects 767 381
Descriptive statistics
COR-ITT-D28
(N (%))
719 (93.74%)
350 (91.86%)
Comparison groups DHA/PQP – AS+MQ
97.5% one-sided CI LL -1.36%
Effect estimate per
comparison
P-value 0.236
Analysis population and
time point description
Pure ITT Population
Day 42
Treatment group DHA/PQP AS+MQ
Number of subjects 767 381
Descriptive statistics
COR-ITT-D42
(N (%))
694 (90.48%)
336 (88.19%)
Comparison groups DHA/PQP – AS+MQ
97.5% one-sided CI LL -1.56%
Effect estimate per
comparison
P-value 0.228
Analysis population and
time point description
Pure ITT Population
Day 63
Assessment Report EMA/739355/2011 Page 88/129

Treatment group DHA/PQP AS+MQ
Number of subjects 767 381
Descriptive statistics
COR-ITT-D63
674 (87.87%)
330 (86.61%) (N (%))
Comparison groups DHA/PQP – AS+MQ
97.5% one-sided CI LL -2.87%
Effect estimate per
comparison
P-value 0.544
Notes CI LL = Confidence Interval Lower Limit
Analysis description Secondary analysis S2:
UNC-MITT-D28, UNC-MITT-D42, UNC-MITT-D63
UNC-PP-D28, UNC-PP-D42, UNC-PP-D63
UNC-ITT-D28, UNC-ITT-D42, UNC -ITT-D63
Analysis population and
time point description
Modified-ITT Population
Day 28
Treatment group DHA/PQP AS+MQ
Number of subjects 726 361
Descriptive Statistics
UNC-MITT-D28
693 (95.45%)
328 (90.86%) (N (%))
Comparison groups DHA/PQP – AS+MQ
97.5% one-sided CI LL 1.26%
Effect estimate per
comparison
P-value 0.003
Analysis population and
time point description
Modified-ITT Population
Day 42
Treatment group DHA/PQP AS+MQ Descriptive Statistics
Number of subjects 726 361
UNC-MITT-D42
(N (%)) 630 (86.78%) 291 (80.61%)
Comparison groups DHA/PQP – AS+MQ
97.5% one-sided CI LL 1.40%
Effect estimate per
comparison
P-value 0.008
Analysis population and
time point description
Modified-ITT Population
Day 63
Treatment group DHA/PQP AS+MQ
Number of subjects 726 361
Descriptive Statistics
UNC-MITT-D63
(N (%))
516 (71.07%)
227 (62.88%)
Comparison groups DHA/PQP – AS+MQ
97.5% one-sided CI LL 2.22%
Effect estimate per
comparison
P-value 0.006
Analysis population and
time point description
Per Protocol Population
Day 28
Treatment group DHA/PQP AS+MQ Descriptive Statistics
Number of subjects 668 336
Assessment Report EMA/739355/2011 Page 89/129

UNC-PP-D28
(N (%))
656 (98.20%)
315 (93.75%)
Comparison groups DHA/PQP – AS+MQ
97.5% one-sided CI LL 1.68%
Effect estimate per
comparison
P-value <0.001
Analysis population and
time point description
Per Protocol Population
Day 42
Treatment group DHA/PQP AS+MQ
Number of subjects 668 336
Descriptive Statistics
UNC-PP-D42
(N (%))
609 (91.17%)
287 (85.42%)
Comparison groups DHA/PQP – AS+MQ
97.5% one-sided CI LL 1.41%
Effect estimate per
comparison
P-value 0.006
Analysis population and
time point description
Per Protocol Population
Day 63
Treatment group DHA/PQP AS+MQ
Number of subjects 668 336
Descriptive Statistics
UNC-PP-D63
(N (%))
504 (75.45%)
223 (66.37%)
Comparison groups DHA/PQP – AS+MQ
97.5% one-sided CI LL 3.07%
Effect estimate per
comparison
P-value 0.002
Analysis population and
time point description
Pure ITT Population
Day 28
Treatment group DHA/PQP AS+MQ
Number of subjects 767 381
Descriptive statistics
UNC-ITT-D28
(N (%))
708 (92.31%)
336 (88.19%)
Comparison groups DHA/PQP – AS+MQ
97.5% one-sided CI LL 0.37%
Effect estimate per
comparison
P-value 0.022
Analysis population and
time point description
Pure ITT Population
Day 42
Treatment group DHA/PQP AS+MQ
Number of subjects 767 381
Descriptive statistics
UNC-ITT-D42
(N (%))
638 (83.18%)
295 (77.43%)
Comparison groups DHA/PQP – AS+MQ
97.5% one-sided CI LL 0.79%
Effect estimate per
comparison
P-value 0.019
Analysis population and
time point description
Pure ITT Population
Day 63
Assessment Report EMA/739355/2011 Page 90/129

Treatment group DHA/PQP AS+MQ
Number of subjects 767 381
Descriptive statistics
UNC-ITT-D63
(N (%))
516 (67.28%)
227 (59.58%)
Comparison groups DHA/PQP – AS+MQ
97.5% one-sided CI LL 1.75%
Effect estimate per
comparison
P-value 0.010
Notes CI LL = Confidence Interval Lower Limit
Analysis description Secondary analysis S3:
Early, Late and True Treatment Failures (ETF, LTF and True)
Analysis population and
time point description
Pure ITT Population
Day 63
Treatment group DHA/PQP AS+MQ
Number of subjects 767 381
ETF (N (%)) 4 (0.52%) 1 (0.26%)
LTF (N (%)) 101 (13.17%) 57 (14.96%)
ETF+LTF (N (%)) 105 (13.69%) 58 (15.22%)
Descriptive Statistics
True (N (%)) 16 (2.09%) 10 (2.62%)
Comparison groups DHA/PQP – AS+MQ
95% CI (-5.88% ; 2.82%)
ETF+LTF
P-value 0.483
Comparison groups DHA/PQP – AS+MQ
95% CI (-2.44% ; 1.36%)
Effect estimate per
comparison
True
P-value 0.564
Analysis population and
time point description
Modified-ITT Population
Day 63
Treatment group DHA/PQP AS+MQ
Number of subjects 726 361
ETF (N (%)) 4 (0.55%) 1 (0.28%)
LTF (N (%)) 101 (13.91%) 57 (15.79%)
ETF+LTF (N (%)) 105 (14.46%) 58 (16.07%)
Descriptive Statistics
True (N (%)) 16 (2.20%) 10 (2.77%)
Comparison groups DHA/PQP – AS+MQ
95% CI (-6.17% ; 2.97%)
ETF+LTF
P-value 0.486
Comparison groups DHA/PQP – AS+MQ
95% CI (-2.57% ; 1.44%)
Effect estimate per
comparison
True
P-value 0.565
Analysis population and
time point description
Per Protocol Population
Day 63
Treatment group DHA/PQP AS+MQ
Number of subjects 668 336
ETF (N (%)) 0 1 (0.30%)
Descriptive Statistics
LTF (N (%)) 86 (12.87%) 52 (15.48%)
Assessment Report EMA/739355/2011 Page 91/129

ETF+LTF (N (%)) 86 (12.87%) 53 (15.77%)
True (N (%)) 11 (1.65%) 10 (2.98%)
Comparison groups DHA/PQP – AS+MQ
95% CI (-7.55% ; 1.75%)
ETF+LTF
P-value 0.209
Comparison groups DHA/PQP – AS+MQ
95% CI (-3.39% ; 0.73%)
Effect estimate per
comparison
True
P-value 0.165
Analysis description Secondary analysis S4:
Aparasitaemic patients and time to parasitaemia clearance
Analysis population and
time point description
Modified-ITT Population
Treatment group DHA/PQP AS+MQ
Number of subjects 726 361
Aparasitaemic at Day
0 (N (%))
0
0
Aparasitaemic at Day
1 (N (%))
298 (41.05%)
143 (39.61%)
Aparasitaemic at Day
2 (N (%))
610 (84.02%)
306 (84.76%)
Descriptive Statistics
Aparasitaemic at Day
3 (N (%))
508 (69.97%)
257 (71.19%)
Kaplan-Meier estimate Median time to
parasitaemia
clearance (days)
2 2
Analysis population and
time point description
Per Protocol Population
Treatment group DHA/PQP AS+MQ
Number of subjects 668 336
Aparasitaemic at Day
0 (N (%))
0
0
Aparasitaemic at Day
1 (N (%))
279 (41.77%)
131 (38.99%)
Aparasitaemic at Day
2 (N (%))
569 (85.18%)
286 (85.12%)
Descriptive Statistics
Aparasitaemic at Day
3 (N (%))
464 (69.46%)
238 (70.83%)
Kaplan-Meier estimate Median time to
parasitaemia
clearance (days)
2 2
Analysis description Secondary analysis S5:
Afebrile patients and time to fever clearance
Analysis population and
time point description
Modified-ITT Population
Treatment group DHA/PQP AS+MQ Descriptive Statistics
Number of subjects 726 361
Assessment Report EMA/739355/2011 Page 92/129

Afebrile at Day 0
(N (%))
251 (34.57%)
119 (32.96%)
Afebrile at Day 1 (N
(%))
504 (69.42%)
245 (67.87%)
Afebrile at Day 2 (N
(%))
662 (91.18%)
321 (88.92%)
Afebrile at Day 3 (N
(%))
486 (66.94%)
250 (69.25%)
Kaplan-Meier estimate Median time to fever
clearance (days)
Not available (*)
Not available (*)
Notes (*) It could not be calculated because of too few assessment timepoints
Analysis population and
time point description
Per Protocol Population
Treatment group DHA/PQP AS+MQ
Number of subjects 668 336
Afebrile at Day 0
(N (%))
242 (36.23%)
109 (32.44%)
Afebrile at Day 1 (N
(%))
469 (70.21%)
230 (68.45%)
Afebrile at Day 2 (N
(%))
612 (91.62%)
299 (88.99%)
Descriptive Statistics
Afebrile at Day 3 (N
(%))
443 (66.32%)
232 (69.05%)
Kaplan-Meier estimate Median time to fever
clearance (days)
Not available (*)
Not available (*)
Notes (*) It could not be calculated because of too few assessment timepoints
Analysis description Secondary analysis S6:
Patients with gametocytes at various timepoints
Analysis population and
time point description
Modified-ITT Population
Treatment group DHA/PQP AS+MQ
Number of subjects 726 361
Day 7 52 (7.16%) 14 (3.88%)
Day 14 28 (3.86%) 3 (0.83%)
Day 21 12 (1.65%) 0
Descriptive Statistics
Number of patients with
gametocytes (N (%))
Day 28 9 (1.24 %) 0
Notes Gametocytes were not assessed at Day 0
Analysis population and
time point description
Per Protocol Population
Treatment group DHA/PQP AS+MQ
Number of subjects 668 336
Day 7 48 (7.19%) 14 (4.17%)
Day 14 25 (3.74%) 3 (0.89%)
Descriptive Statistics
Number of patients with
gametocytes (N (%))
Day 21 10 (1.50%) 0
Assessment Report EMA/739355/2011 Page 93/129

Day 28 7 (1.05 %) 0
Notes Gametocytes were not assessed at Day 0
Analysis description Secondary analysis S7:
Haematological Recovery
Analysis population and
time point description
Safety/Pure ITT Population
Treatment group DHA/PQP AS+MQ
Number of subjects 767 381
Day 0 (*) 118.17 (24.46) 119.98 (23.22)
Nadir (Day 7) 107.26 (21.30) 109.87 (21.97)
Descriptive Statistics
Hb Fractional (g/L)
mean (std)
Day 28 121.63 (16.47) 122.72 (17.77)
Notes (*) Day 0 values are taken from Table 12.4.1.2a of FSR, which is for Hb in the whole sample, while values for the other days have been taken from Table 12.4.1.2b which is for Hb Fractional in a subset of patients (~28% of the whole sample)
Analysis description Secondary analysis S8:
Compliance with study treatment: Patients having taken at least 80% of the
scheduled study treatment
Analysis population and
time point description
Safety/Pure ITT Population
Treatment group DHA/PQP AS+MQ
Number of subjects 767 381
Descriptive Statistics
Compliance 80% 764 (99.61%) 379 (99.48%)
Analysis population and
time point description
Modified-ITT Population
Treatment group DHA/PQP AS+MQ
Number of subjects 726 361
Descriptive Statistics
Compliance 80% 723 (99.59%) 359 (99.45%)
Analysis population and
time point description
Per Protocol Population
Treatment group DHA/PQP AS+MQ
Number of subjects 668 336
Descriptive Statistics
Compliance 80% 668 (100%) 336 (100%)
Table 52: Table Summary of Efficacy for trial DM040011
Title: A Phase III, Randomised, Non-Inferiority Trial, to Assess the Efficacy and Safety of Dihydroartemisinin +
Piperaquine (DHA/PQP, Artekin™) in Comparison with Artemether + Lumefantrine (A/L, Coartem®) in Children with
Uncomplicated P. falciparum Malaria
Study identifier ST3073+ST3074-DM040011
multi-centre, phase III, randomised, open label, two-arm parallel group study
Duration of main phase: 42 days (planned)
Duration of run-in phase: not applicable
Design
Duration of extension phase: not applicable
Assessment Report EMA/739355/2011 Page 94/129

Hypothesis Non-inferiority
DHA/PQP Dihydroartemisinin/Piperaquine. 3 days, 1039 Treatment groups
A/L Artemether/lumefantrine. 3 days, 514
Co-primary
endpoints
COR-MITT-D28
COR-PP-D28
Day 28 PCR-corrected cure rates in modified-ITT
and Per Protocol populations
S1:
COR-<POP>-
<DAY>
PCR-corrected cure rates at Days 14 and 42 in all populations
S2:
UNC-<POP>-
<DAY>
Uncorrected cure rates at Days 14, 28 and 42 in all
populations
S3 Proportion of patients with treatment failure
S4 Proportion of aparasitaemic patients and time to
parasitaemia clearance
S5 Proportion of afebrile patients and time to fever
clearance
S6 Proportion of patients with gametocytes at various
time points
S7 Fractional change in haemoglobin/haematocrit
(Hb/Hct)
S8 Compliance with study treatment
Endpoints and
definitions
Secondary
endpoints
Note: <POP>=MITT (Modified-ITT), PP (Per Protocol),
ITT=Pure ITT/Safety. <DAY>=14, 28, 42
Database lock 18 April 2007
Results and analysis
Analysis description Primary analysis: COR-MITT-D28 and COR-PP-D28
Analysis population and
time point description
Modified-ITT Population
Day 28
Treatment group DHA/PQP A/L
Number of subjects 1027 497
Descriptive statistics
COR-MITT-D28
(N (%))
952 (92.70%)
471 (94.77%)
Comparison groups DHA/PQP – A/L
97.5% one-sided CI LL -4.59%
Effect estimate per
comparison
Primary endpoint
P-value 0.128
Notes CI LL = Confidence Interval Lower Limit
Analysis population and
time point description
Per Protocol Population
Day 28
Treatment group DHA/PQP A/L
Number of subjects 951 462
Descriptive statistics
COR-PP-D28
(N (%))
910 (95.69%)
442 (95.67%)
Comparison groups DHA/PQP – A/L
97.5% one-sided CI LL -2.24%
Effect estimate per
comparison
Primary endpoint
P-value 0.988
Assessment Report EMA/739355/2011 Page 95/129

Notes CI LL = Confidence Interval Lower Limit
Analysis description Secondary analysis S1:
COR-MITT-D14, COR-MITT-D42,
COR-PP-D14, COR-PP-D42,
COR-ITT-D14, COR-ITT-D28, COR-ITT-D42
Analysis population and
time point description
Modified-ITT Population
Day 14
Treatment group DHA/PQP A/L
Number of subjects 1027 497
Descriptive statistics
COR-MITT-D14
(N (%))
972 (94.64%)
483 (97.18%)
Comparison groups DHA/PQP – A/L
97.5% one-sided CI LL -4.54%
Effect estimate per
comparison
Primary endpoint
P-value 0.025
Analysis population and
time point description
Modified-ITT Population
Day 42
Treatment group DHA/PQP A/L
Number of subjects 1027 497
Descriptive Statistics
COR-MITT-D42
(N (%))
921 (89.68%)
464 (93.36%)
Comparison groups DHA/PQP – A/L
97.5% one-sided CI LL -6.55%
Effect estimate per
comparison
P-value 0.019
Analysis population and
time point description
Per Protocol Population
Day 14
Treatment group DHA/PQP A/L
Number of subjects 951 462
Descriptive statistics
COR-PP-D14
(N (%))
924 (97.16%)
453 (98.05%)
Comparison groups DHA/PQP – A/L
97.5% one-sided CI LL -2.53%
Effect estimate per
comparison
Primary endpoint
P-value 0.319
Analysis population and
time point description
Per Protocol Population
Day 42
Treatment group DHA/PQP A/L
Number of subjects 951 462
Descriptive Statistics
COR-PP-D42
(N (%))
879 (92.43%)
436 (94.37%)
Comparison groups DHA/PQP – A/L
97.5% one-sided CI LL -4.63%
Effect estimate per
comparison
P-value 0.177
Analysis population and
time point description
Pure ITT Population
Day 14
Descriptive statistics Treatment group DHA/PQP A/L
Assessment Report EMA/739355/2011 Page 96/129

Number of subjects 1038 510
COR-ITT-D14
(N (%))
975 (93.93%)
486 (95.29%)
Comparison groups DHA/PQP – A/L
97.5% one-sided CI LL -3.71%
Effect estimate per
comparison
P-value 0.274
Analysis population and
time point description
Pure ITT Population
Day 28
Treatment group DHA/PQP A/L
Number of subjects 1038 510
Descriptive statistics
COR-ITT-D28
(N (%))
938 (90.37%)
459 (90.00%)
Comparison groups DHA/PQP – A/L
97.5% one-sided CI LL -2.80%
Effect estimate per
comparison
P-value 0.820
Analysis population and
time point description
Pure ITT Population
Day 42
Treatment group DHA/PQP A/L
Number of subjects 1038 510
Descriptive statistics
COR-ITT-D42
(N (%))
895 (86.22%)
442 (86.67%)
Comparison groups DHA/PQP – A/L
97.5% one-sided CI LL -4.06%
Effect estimate per
comparison
P-value 0.811
Notes CI LL = Confidence Interval Lower Limit
Analysis description Secondary analysis S2:
UNC-MITT-D14, UNC-MITT-D28, UNC-MITT-D42
UNC-PP-D14, UNC-PP-D28, UNC-PP-D42
UNC-ITT-D14, UNC-ITT-D28, UNC -ITT-D42
Analysis population and
time point description
Modified-ITT Population
Day 14
Treatment group DHA/PQP A/L
Number of subjects 1027 497
Descriptive Statistics
UNC-MITT-D14
(N (%))
969 (94.35%)
474 (95.37%)
Comparison groups DHA/PQP – A/L
97.5% one-sided CI LL -3.34%
Effect estimate per
comparison
P-value 0.405
Analysis population and
time point description
Modified-ITT Population
Day 28
Treatment group DHA/PQP A/L Descriptive Statistics
Number of subjects 1027 497
Assessment Report EMA/739355/2011 Page 97/129

UNC-MITT-D28
(N (%))
910 (88.61%)
391 (78.67%)
Comparison groups DHA/PQP – A/L
97.5% one-sided CI LL 5.84%
Effect estimate per
comparison
P-value <0.001
Analysis population and
time point description
Modified-ITT Population
Day 42
Treatment group DHA/PQP A/L
Number of subjects 1027 497
Descriptive Statistics
UNC-MITT-D42
(N (%))
769 (74.88%)
330 (66.40%)
Comparison groups DHA/PQP – A/L
97.5% one-sided CI LL 3.55%
Effect estimate per
comparison
P-value <0.001
Analysis population and
time point description
Per Protocol Population
Day 14
Treatment group DHA/PQP A/L
Number of subjects 951 462
Descriptive Statistics
UNC-PP-D14
(N (%))
924 (97.16%)
448 (96.97%)
Comparison groups DHA/PQP – A/L
97.5% one-sided CI LL -1.69%
Effect estimate per
comparison
P-value 0.841
Analysis population and
time point description
Per Protocol Population
Day 28
Treatment group DHA/PQP A/L
Number of subjects 951 462
Descriptive Statistics
UNC-PP-D28
(N (%))
884 (92.95%)
376 (81.39%)
Comparison groups DHA/PQP – A/L
97.5% one-sided CI LL 7.67%
Effect estimate per
comparison
P-value <0.001
Analysis population and
time point description
Per Protocol Population
Day 42
Treatment group DHA/PQP A/L
Number of subjects 951 462
Descriptive Statistics
UNC-PP-D42
(N (%))
746 (78.44%)
319 (69.05%)
Comparison groups DHA/PQP – A/L
97.5% one-sided CI LL 4.44%
Effect estimate per
comparison
P-value <0.001
Analysis population and
time point description
Pure ITT Population
Day 14
Assessment Report EMA/739355/2011 Page 98/129

Treatment group DHA/PQP A/L
Number of subjects 1038 510
Descriptive statistics
UNC-ITT-D14
(N (%))
975 (93.93%)
481 (94.31%)
Comparison groups DHA/PQP – A/L
97.5% one-sided CI LL -2.86%
Effect estimate per
comparison
P-value 0.764
Analysis population and
time point description
Pure ITT Population
Day 28
Treatment group DHA/PQP A/L
Number of subjects 1038 510
Descriptive statistics
UNC-ITT-D28
(N (%))
910 (87.67%)
391 (76.67%)
Comparison groups DHA/PQP – A/L
97.5% one-sided CI LL 6.82%
Effect estimate per
comparison
P-value <0.001
Analysis population and
time point description
Pure ITT Population
Day 42
Treatment group DHA/PQP A/L
Number of subjects 1038 510
Descriptive statistics
UNC-ITT-D42
(N (%))
769 (74.08%)
330 (64.71%)
Comparison groups DHA/PQP – A/L
97.5% one-sided CI LL 4.45%
Effect estimate per
comparison
P-value <0.001
Notes CI LL = Confidence Interval Lower Limit
Analysis description Secondary analysis S3:
Early, Late and True Treatment Failures (ETF, LTF and True)
Analysis population and
time point description
Pure ITT Population
Day 28
Treatment group DHA/PQP A/L
Number of subjects 1038 510
ETF (N (%)) 12 (1.16%) 2 (0.39%)
LTF (N (%)) 62 (5.97%) 85 (16.67%)
ETF+LTF (N (%)) 74 (7.13%) 87 (17.06%)
Descriptive Statistics
True (N (%)) 38 (3.66%) 14 (2.75%)
Comparison groups DHA/PQP – A/L
95% CI (-13.55% ; -6.31%)
ETF+LTF
P-value <0.001
Comparison groups DHA/PQP – A/L
95% CI (-0.91% ; 2.74%)
Effect estimate per
comparison
True
P-value 0.347
Analysis population and
time point description
Modified-ITT Population
Day 28
Assessment Report EMA/739355/2011 Page 99/129

Treatment group DHA/PQP A/L
Number of subjects 1027 497
ETF (N (%)) 12 (1.17%) 2 (0.40%)
LTF (N (%)) 62 (6.04%) 85 (17.10%)
ETF+LTF (N (%)) 74 (7.21%) 87 (17.51%)
Descriptive Statistics
True (N (%)) 38 (3.70%) 14 (2.82%)
Comparison groups DHA/PQP – A/L
95% CI (-14.00% ; -6.60%)
ETF+LTF
P-value <0.001
Comparison groups DHA/PQP – A/L
95% CI (-0.97% ; 2.74%)
Effect estimate per
comparison
True
P-value 0.373
Analysis population and
time point description
Per Protocol Population
Day 28
Treatment group DHA/PQP A/L
Number of subjects 951 462
ETF (N (%)) 1 (0.11%) 0
LTF (N (%)) 51 (5.36%) 74 (16.02%)
ETF+LTF (N (%)) 52 (5.47%) 74 (16.02%)
Descriptive Statistics
True (N (%)) 26 (2.73%) 12 (2.60%)
Comparison groups DHA/PQP – A/L
95% CI (-14.19% ; -6.91%)
ETF+LTF
P-value <0.001
Comparison groups DHA/PQP – A/L
95% CI (-1.65% ; 1.92%)
Effect estimate per
comparison
True
P-value 0.882
Analysis description Secondary analysis S4:
Aparasitaemic patients and time to parasitaemia clearance
Analysis population and
time point description
Modified-ITT Population
Treatment group DHA/PQP A/L
Number of subjects 1027 497
Aparasitaemic at Day
0 (N (%))
1 (0.10%)
1 (0.20%)
Aparasitaemic at Day
1 (N (%))
370 (36.03%)
142 (28.57%)
Aparasitaemic at Day
2 (N (%))
863 (84.03%)
420 (84.51%)
Descriptive Statistics
Aparasitaemic at Day
3 (N (%))
1003 (97.66%)
489 (98.39%)
Kaplan-Meier estimate Median time to
parasitaemia
clearance (days)
2 2
Analysis population and
time point description
Per Protocol Population
Assessment Report EMA/739355/2011 Page 100/129

Treatment group DHA/PQP A/L
Number of subjects 951 462
Aparasitaemic at Day
0 (N (%))
0
0
Aparasitaemic at Day
1 (N (%))
351 (36.91%)
133 (28.79%)
Aparasitaemic at Day
2 (N (%))
815 (85.70%)
392 (84.85%)
Descriptive Statistics
Aparasitaemic at Day
3 (N (%))
939 (98.74%)
457 (98.92%)
Kaplan-Meier estimate Median time to
parasitaemia
clearance (days)
2 2
Analysis description Secondary analysis S5:
Afebrile patients and time to fever clearance
Analysis population and
time point description
Modified-ITT Population
Treatment group DHA/PQP A/L
Number of subjects 1027 497
Afebrile at Day 0
(N (%))
413 (40.21%)
200 (40.24%)
Afebrile at Day 1 (N
(%))
919 (89.48%)
421 (84.71%)
Afebrile at Day 2 (N
(%))
1001 (97.47%)
483 (97.18%)
Descriptive Statistics
Afebrile at Day 3 (N
(%))
1000 (97.37%)
491 (98.79%)
Kaplan-Meier estimate Median time to fever
clearance (days)
Not available (*)
Not available (*)
Notes (*) It could not be calculated because of too few assessment timepoints
Analysis population and
time point description
Per Protocol Population
Treatment group DHA/PQP A/L
Number of subjects 951 462
Afebrile at Day 0
(N (%))
388 (40.80%)
185 (40.04%)
Afebrile at Day 1 (N
(%))
855 (89.91%)
394 (85.28%)
Afebrile at Day 2 (N
(%))
935 (98.32%)
451 (97.62%)
Descriptive Statistics
Afebrile at Day 3 (N
(%))
934 (98.21%)
459 (99.35%)
Kaplan-Meier estimate Median time to fever
clearance (days)
Not available (*)
Not available (*)
Assessment Report EMA/739355/2011 Page 101/129

Notes (*) It could not be calculated because of too few assessment timepoints
Analysis description Secondary analysis S6:
Patients with gametocytes at various timepoints
Analysis population and
time point description
Modified-ITT Population
Treatment group DHA/PQP A/L
Number of subjects 1027 497
Day 0 121 (11.78%) 66 (13.28%)
Day 7 91 (8.86%) 21 (4.23%)
Day 14 47 (4.58%) 1 (0.20%)
Day 28 6 (0.58%) 3 (0.60%)
Descriptive Statistics
Number of patients with
gametocytes (N (%))
Day 42 11 (1.07%) 7 (1.41%)
Analysis population and
time point description
Per Protocol Population
Treatment group DHA/PQP A/L
Number of subjects 951 462
Day 0 108 (11.36%) 60 (12.99%)
Day 7 86 (9.04%) 19 (4.11%)
Day 14 43 (4.52%) 1 (0.22%)
Day 28 4 (0.42%) 2 (0.43%)
Descriptive Statistics
Number of patients with
gametocytes (N (%))
Day 42 10 (1.05%) 7 (1.52%)
Analysis description Secondary analysis S7:
Haematological Recovery
Analysis population and
time point description
Safety/Pure ITT Population
Treatment group DHA/PQP A/L
Number of subjects 1038 510
Day 0 89.23 (18.15) 90.59 (18.20)
Nadir (Day 3) 85.86 (16.68) 85.72 (17.43)
Descriptive Statistics
Hb (g/L)
mean (std)
Day 28 104.90 (14.26) 104.79 (16.77)
Analysis description Secondary analysis S8:
Compliance with study treatment: Patients having taken at least 80% of the
scheduled study treatment
Analysis population and
time point description
Safety/Pure ITT Population
Treatment group DHA/PQP A/L
Number of subjects 1038 510
Descriptive Statistics
Compliance 80% 1027 (98.94%) 507 (99.41%)
Analysis population and
time point description
Modified-ITT Population
Treatment group DHA/PQP A/L
Number of subjects 1027 497
Descriptive Statistics
Compliance 80% 1016 (98.93%) 494 (99.40%)
Analysis population and
time point description
Per Protocol Population
Assessment Report EMA/739355/2011 Page 102/129

Treatment group DHA/PQP A/L
Number of subjects 951 462
Descriptive Statistics
Compliance 80% 951 (100%) 462 (100%)
Analysis performed across trials (pooled analyses and meta-analysis)
The applicant has not integrated or compared the efficacy data between the two Phase III studies due
to the many differences in population and the potential effects of geographical region and parasites on
the outcomes. This omission is considered to be appropriate.
Clinical studies in special populations
Not applicable
Supportive studies
The two phase I/II studies were single centre, single arm studies and were aimed at investigating the
PK profile of DHA/PQP and were definitively underpowered to draw any conclusion on cure rates.
Therefore, the analyses of all efficacy endpoints were carried out only at a descriptive level. Efficacy
was not the primary objective of these studies, but was examined as secondary objective.
A total of 32 patients were recruited into the African study (DM 04008) and 25 patients were recruited
in the Asian study (DM 04009). In general, the medical history for the patients in both Phase I/II
studies is consistent with acute malaria.
The same three day, weight-based dose regimen and timing of the dose was used in the Phase I/II
studies as for the Phase III studies. The dosing regimen in the African Phase I/II study provided for a
potential dose of between 1.6-3.6 mg/kg/day DHA and 12.8-29.1 mg/kg/day PQP. In the Asian Phase
I/II study, the regimen provided for a potential daily dose of 1.6-3.6 mg/kg/day DHA and 12.8-29.1
mg/kg/day PQP.
All secondary endpoints recorded in Phase III studies (with the exception of gametocytes) were
recorded also in the Phase I/II studies.
Results
In the African study there was one ETF. The number of LTF was equal to three at Day 28, 14 at
Day 42 and 25 at Day 90.
There was no ETF and only one LTF (at Day 56) in the Asian study.
The true treatment failures as defined by WHO were not estimated in the Phase I/II studies.
In the Asian study, all patients were clear of parasitaemia by Day 7, while in the African study all
patients were clear of parasitaemia by Day 2.
In the Asian study, all the patients were afebrile by Day 2, while in the African study all the
patients were afebrile by Day 1.
Assessment Report EMA/739355/2011 Page 103/129

2.5.3. Discussion on clinical efficacy
Design and conduct of clinical studies
The clinical development programme included two well conducted Phase III clinical trials. These were
designed to reflect the differences in baseline immunity and transmission risks for malaria in the
differing endemic regions. Thus, studies were considered separately due to the many differences in
populations and the potential effects of geographical region and parasites on the outcomes. Both trials
had an acceptable open label design.
Efficacy data and additional analyses
Both trials met the primary endpoint demonstrating non-inferiority of DHA/PQP to the appropriate
comparator for treatment of patients with uncomplicated P. falciparum malaria. The true treatment
failure rates in the two pivotal studies were 1.8% and 2.8% for studies DM 040010 and DM 040011
respectively. These are well within the current standard of 5% set by the WHO. Eurartesim was non-
inferior to comparators regarding the rates of recrudescence and new infection. Indeed, for both trials,
Eurartesim was statistically and clinically superior to the comparator combinations for uncorrected cure
rate and the rate of new infections at all time points starting from Day 28. Data indicated however that
for both studies, DHA/PQP has a lesser gametocytocidal effect than comparator.
2.5.4. Conclusions on the clinical efficacy
Eurartesim has been shown to be non-inferior to established standard-of-care comparator drugs in
each of two large, well-designed pivotal studies performed in two different malaria-endemic regions.
For both studies, the results have been shown to be robust based on several sensitivity analyses.
2.6. Clinical safety
Due to major differences between the studies, safety data have been addressed separately by study
under each sub-headings below. With very small numbers in the two preliminary studies in adults and
children, most attention was given to the data from the Phase III studies DM 040010 and DM 040011
Patient exposure
The safety database for exposure to DHA/PQP consists primarily of data from the five clinical studies
sponsored by Sigma-tau. The total database includes 1862 adult and paediatric patients with malaria.
The two pivotal Phase III clinical trials were designed to reflect the differences in baseline immunity
and transmission risks for malaria in the differing endemic regions. For these studies, the three study
populations investigated were: the pure-Intention to Treat (ITT), the modified ITT (m-ITT) and the per
protocol (PP) population. The ITT population was the same population as the safety population, which
was defined as all randomised patients who received at least one dose of the study treatment. This
definition was also used in the Phase I/II and in the healthy volunteer study.
Assessment Report EMA/739355/2011 Page 104/129

The demographic and baseline characteristics of the populations in Phase III trials are displayed in the
following table:
Table 53: Overall Demographic and Baseline Characteristics – Phase III Studies (Safety
Population)
DM 040010: In the m-ITT population the proportions vomiting within 30 min of dosing were 1.1%
for both treatments but the proportion of patients vomiting 30-60 min after dosing was higher in
the DHA/PQP group (1.5% vs. 0.3%). Vomiting was reported as a presenting complaint in 28% in
each treatment group so may have partly reflected acute malaria. Vomiting was reported as a
treatment emerging adverse event (TEAE) at any time during the study in 2.5% DHA/PQP and
6.3% AS+MQ patients groups while persistent vomiting leading to withdrawal before Day 63
occurred in four DHA/PQP patients.
DM 040011: The highest incidence of vomiting occurred within 30 min of taking the first dose on
Day 0 (10.6% and 9.6% per group). Over the three dosing days, 17.3% and 14.1% in respective
treatment groups vomited at least once. Vomiting was reported as a presenting complaint in
13.9% and 12.2% and was reported as a TEAE at any time during the study in 6.8% in each
group. Persistent vomiting led to study withdrawal before Day 28 in 22 children in the DHA/PQP
group and 4 in the A/L group.
Assessment Report EMA/739355/2011 Page 105/129

Adverse events
DM 040010: The proportions experiencing at least one TEAE were comparable between treatments
(69% DHA/PQP and 72% AS+MQ). The greater number of malaria AEs in the AS+MQ group was
consistent with more new P. falciparum and non-falciparum infections in this group.
The table shows some AEs for which differences in rates between treatment groups were ≥ 2%.
Table 54: TEAEs with Differences (>±2%) Between Treatment Groups (Safety
Population)
The table below shows some of the differences between treatments for certain types of drug-related
AEs. The rates of cardiac AEs considered related were 3.5% for DHA/PQP and 2.1% for AS+MQ.
Table 55: Related TEAEs with Differences (>±2%) Between Treatment Groups (Safety
Population)
Assessment Report EMA/739355/2011 Page 106/129

The higher rate of cardiac AEs (all and related) in the DHA/PQP group was explored further. The
individual preferred terms (PTs) are shown below by relationship and severity.
Table 56: TEAEs Summarised by Maximum Severity and Relationship to Study Treatment
Only Cardiac AEs Safety Population
The applicant stated that most cases of sinus bradycardia or tachycardia consisted of heart rates that
were borderline when measured by the core ECG laboratory and were deemed to be of minor clinical
significance. Also, some reports did not correspond to the heart rate measured by the physician during
the visit or that measured by the ECG core laboratory. In the DHA/PQP group there was a slightly
greater frequency of bradycardia, sinus tachycardia and arrhythmias as compared to the AS+MQ
group.
Sinus bradycardia, sinus tachycardia and sinus arrhythmia accounted for most of the overall difference
in “cardiac TEAEs” between the DHA/PQP and AS+MQ groups. All these TEAEs were considered by the
investigators to be of mild intensity but the basis for the investigators’ grading of these events is not
clear. In addition, rates for bradycardia and tachycardia were clearly higher in the DHA/PQP group.
Review of cases of sinus bradycardia and tachycardia showed that most were present on ECG but were
not identified by the physician at the corresponding study visit. In many cases the rates were just
outside of the normal limits and the subjects were asymptomatic. However, heart rates > 120 bpm
seem to have occurred in 35 subjects and rates > 130 bpm in 7 subjects.
The overall proportions with mild, moderate and severe TEAEs were comparable between treatment
groups (55.2%, 12.4% and 1.8% for DHA/PQP and 57.7%, 12.6% and 2.1% for AS+MQ). The most
frequently reported AEs (related and unrelated) in the DHA/PQP and AS+MQ groups were headache
(18% vs. 20%), malaria (14.5% vs. 22.6%), P. falciparum malaria (13.4% vs. 15.2%) and pyrexia
(10.6% vs. 11.3%).
Subjective fever was reported by 58.3% (mild), 18.4% (moderate) and 0.3% (severe) in the DHA/PQP
group and by 56.7% (mild), 20% (moderate) and 0.8% (severe) in the AS+MQ group. Headache was
reported by 41% (mild) and 18% (moderate) in the DHA/PQP group and by 37.8% (mild), 21%
(moderate) and 0.3% (severe) in the AS+MQ group. Nausea was reported less often in the DHA/PQP
group with rates of 11.3% mild and 0.4% moderate vs. 17.3% mild and 1.3% moderate. Similarly,
vomiting was reported with rates of 6.1% mild and 0.4% moderate (DHA/PQP) vs. 9.7% mild and
0.8% moderate (AS+MQ).
Assessment Report EMA/739355/2011 Page 107/129

Adverse event of special interest
In this study baseline and pre-dose Day 2 12-lead ECGs were obtained. These were viewed during
recording and transmitted directly to MDS Central Telemedicine Department in France for
interpretation and reporting except for ECGs from centre 19 (Thailand) where paper ECGs were printed
and then sent to MDS Pharma. The ECGs were measured semi-automatically on a superimposed
representative complex.
The descriptive analysis of mean values showed a highly statistically significant difference between
treatments in the change in QTcB and QTcF intervals from baseline to Day 2 (ANOVA, p <0.001) with
longer intervals in the DHA/PQP group. The Day 2 change in QTc from baseline was statistically
significantly different between treatments by both Bazett’s and Fridericia’s methods. At Day 7 the
difference in QTcF was significant but slightly fewer patients in the DHA/PQP group (1.8%) showed an
increase in QTc > 60 ms compared with the AS+MQ group (2.9%).
Table 57: Descriptive ECG Analyses (Mean) During the Study – DHA/PQP (Safety
Population)
Table 58: Descriptive ECG Analyses (Mean) During the Study – AS+MQ (Safety
Population)
There was no statistically significant difference between treatments in the proportion of patients with
QTc >500 ms by either method at any time during the study. Three patients experienced prolonged
(i.e. >500 ms) QTcF intervals and four patients experienced prolonged QTcB intervals. These patients
(five in total) were all recruited to the DHA/PQP group.
Assessment Report EMA/739355/2011 Page 108/129

Table 59: QTc (QTcB & QTcF) Values Classified as >500 msec or ≤500 msec. (Safety
Population)
The comparison of QTcB means on D0 and D2 shows that in both treatment groups the values were
greater for female subjects but the mean change from baseline in the DHA/PQP group was smaller for
female subjects (3.14 ms vs. 5.80 ms in male subjects) while corresponding values by gender in the
AS+MQ group were 4.73 ms and -2.44 ms. The overall comparison between treatments for changes
from baseline and the comparison for male subjects only were statistically significant (p < 0.001) with
larger changes in the DHA/PQP group. In contrast the comparison for female subjects only did not
reach significance (p = 0.610). The actual changes in QTcF values were greater than those observed
when using the QTcB data. Actual mean values on D0 and D2 were not consistently or notably greater
in female vs. male subjects. However, the same pattern of findings as for QTcB applied to the analysis
of changes from baseline overall and by gender.
Table 60: QTcF by Gender and Overall – Asian study (Safety Population)
Treatment Visit Gender N Nmiss Mean STD 95% CI
Females 185 0 390.87 29.01 386.66, 395.08
Males 579 3 386.69 24.17 384.72, 388.66
Day 0
Overall 764 3 387.70 25.47 385.89, 389.51
Females 179 6 410.06 27.66 405.98, 414.14
Males 575 7 411.12 24.78 409.09, 413.15
Day 2
Overall 754 13 410.87 25.48 409.04, 412.69
Females 179 6 18.60 24.25 15.03, 22.18
(¹)
Males 573 9 24.28 22.76 22.41, 26.15
(²)
DHA/PQP
Change
Overall 752 15 22.93 23.23 21.26, 24.59
(³)
AS+MQ Day 0 Females 85 1 383.64 26.89 377.84, 389.43
Assessment Report EMA/739355/2011 Page 109/129

Males 292 3 386.09 25.22 383.19, 389.00
Overall 377 4 385.54 25.59 382.95, 388.13
Females 83 3 404.02 23.18 398.96, 409.09
Males 290 5 399.30 20.70 396.91, 401.70
Day 2
Overall 373 8 400.35 21.34 398.18, 402.53
Females 83 3 19.12 22.90 14.12, 24.12
(¹)
Males 287 8 13.35 23.96 10.57, 16.14
(²) Change
Overall 370 11 14.65 23.81 12.21, 17.08
(³) (¹) test for the comparison DHA/PQP vs. AS+MQ for females: p-value = 0.868 (²) test for the comparison DHA/PQP vs. AS+MQ for males: p-value < 0.001 (³) test for the comparison DHA/PQP vs. AS+MQ overall: p-value < 0.001
Subjects aged < 16 years in both treatment groups showed greater mean QTcB values vs. older
subjects on D0 and D2 and greater changes from baseline. The comparison between treatments for
changes from baseline was statistically significant (p < 0.001) overall and for those aged ≥ 16 years
with greater changes in the DHA/PQP group but there was only a numerical difference for the younger
subjects. In contrast, the QTcF data on D0 and D2 showed that actual values were smaller in those
aged < 16 years. Nevertheless, as for QTcB, the comparison between treatments for changes from
baseline was significant (p < 0.001) overall and for those aged ≥ 16 years with greater changes in the
DHA/PQP group but there was only a numerical difference for the younger subjects. The magnitude of
the difference in change between treatment groups was 4.76 ms for those aged < 16 years and 9.25
ms for the older age group.
The applicant observes that there was no gender imbalance for total TEAEs in the two SOCs. In the
DHA/PQP group subjects aged < 16 years had a higher rate of cardio-vascular TEAEs (21.4% vs.
11.8%), which reflects the rates of sinus tachycardia (6.9% vs. 2.4%) and QTc prolongation (12.7%
vs. 5.7%).
DM 040011
The proportion of patients experiencing at least one TEAE was similar between treatment groups
(79.3% DHA/PQP and 80.6% A/L). The table shows some AEs for which differences in rates between
treatment groups were ≥ 2%.
Assessment Report EMA/739355/2011 Page 110/129

Table 61: TEAEs with Differences (>±2%) Between Treatment Groups (Safety
Population)
The proportions of patients with mild, moderate and severe TEAEs were comparable between
treatment groups at 50.3%, 25.6% and 3.4% respectively for DHA/PQP compared with 49.2%, 28.4%
and 2.9% respectively for A/L. The overall proportions of patients with treatment-related TEAEs were
also comparable between treatments (71% DHA/PQP and 72% A/L). The table shows some differences
for drug-related AEs that occurred at rates ≥ 2%.
Table 62: Related TEAEs with Differences (>±2%) Between Treatment Groups (Safety
Population)
In both treatment groups cough was the most frequently reported AE with rates of 39.8% and 32%
related for DHA/PQP compared to 38% and 31% related for A/L. However, it is not understood why
cough might have been considered drug-related by investigators. Cough was considered most often
associated with influenza, pneumonia and P. falciparum infection. Pyrexia was reported with rates of
29.1% and 22.4% related in the DHA/PQP group compared to 32% and 24.3% related in the A/L
group. Pyrexia was often temporally associated with cough, influenza, P. falciparum infection,
diarrhoea and vomiting. There were no arrhythmias reported during the study.
Using Bazett’s method the proportions of patients with normal, borderline or prolonged QTc intervals at
baseline were 80.4%, 14.6% and 3.7% for DHA/PQP compared to 79.8%, 13.9% and 5.5% for A/L.
Assessment Report EMA/739355/2011 Page 111/129

However, on Day 2 the pre-dose ECGs showed that a statistically significantly higher proportion of
patients in the DHA/PQP group (60.3%, 29.1% and 9.1% with normal, borderline and prolonged QTc
intervals) had borderline QTc intervals compared to the A/L group (72.2%, 19.8% and 6.9%
respectively) and the proportion with prolonged QTc was numerically higher.
There was no significant difference between treatment groups in the proportion of patients with QTc
intervals >500 ms (e.g. two per group on Day 2). Change in QTc interval from baseline to Day 2
showed less QTc shortening and more prolongation in the DHA/PQP group compared with A/L (Mantel-
Haenszel Chi-square test, p < 0.001). In the DHA/PQP group, 46.7% had an increase <30 ms, 19.6%
had a prolongation 30 - 60 ms and 2.7% had a prolongation >60 ms. These rates compare with
46.1%, 13.5% and 2%, respectively, in the A/L group.
Using Fridericia’s method the proportions of patients with normal, borderline and prolonged QTc
intervals were not significantly different between treatments at any visit and the only QTc value >500
ms occurred in one patient on Day 2 in the A/L group. However, as for QTcB, the increase in QTc
intervals from baseline was statistically significantly greater for DHA/PQP on Day 2.
Descriptive analyses showed a highly statistically significant difference between treatments in the
change in QT, QTc Bazett and QTc Fridericia values from baseline to Day 2.
Table 63: Descriptive ECG Analyses (Means) During the Study (Safety Population)
The study report states that the lengthening of QT from baseline to Day 2 was probably due to the fall
in HR. Patients were tachycardic throughout the study but particularly so at baseline.
The change in QTcB from baseline to Day 2 is said to be inconclusive and may have been over-
corrected whereas the change in QTcF may be clinically significant (i.e. associated with increased risk
of arrhythmia) particularly for DHA/PQP.
The QTcB data showed a trend for smaller mean changes from baseline as weight increased in the A/L
group. The treatment comparison for changes from baseline was statistically significant (p < 0.001) for
the weight class from 13 to < 18 kg and overall but not for other classes. The QTcF data did not show
a specific trend in either treatment group but the treatment comparison for change from baseline was
statistically significant (p < 0.001) overall and in the weight classes from 13 to < 18 kg and from 7 to
Assessment Report EMA/739355/2011 Page 112/129

< 13 kg with greater changes in each case in the DHA/PQP group vs. the A/L group. The comparison
for the other weight classes showed numerically greater changes in the DHA/PQP group.
Table 64: QTcF by Weight Class and Overall – African study (Safety Population)
Treatment Visit Weight N Nmiss Mean STD 95% CI
< 7 kg 18 1 350.83 30.97 335.43, 366.23 >=7 and <13 kg
734 11 351.98 24.13 350.23, 353.73
>=13 and <18 kg
266 0 358.60 22.19 355.92, 361.28
>=18 kg 7 1 365.14 22.33 344.49, 385.79
Day 0
Overall 1025 13 353.77 23.93 352.30, 355.23 < 7 kg 19 0 374.11 27.31 360.94, 387.27
>=7 and <13 kg
729 16 374.16 23.36 372.46, 375.86
>=13 and <18 kg
266 0 386.53 19.69 384.16, 388.91
>=18 kg 8 0 383.50 19.27 367.39, 399.61
Day 2
Overall 1022 16 377.45 23.13 376.03, 378.87 < 7 kg 18 1 23.11 24.10 11.13, 35.09 (¹)
>=7 and <13 kg
722 23 22.13 25.99 20.24, 24.03 (²)
>=13 and <18 kg
266 0 27.93 23.22 25.13, 30.74 (³)
>=18 kg 7 1 17.29 22.34 -3.37, 37.94 (4)
DHA/PQP
Change
Overall 1013 25 23.64 25.33 22.08, 25.20 (5) < 7 kg 7 0 356.43 45.03 314.78, 398.07
>=7 and <13 kg
350 4 350.74 24.02 348.21, 353.26
>=13 and <18 kg
142 0 362.51 24.03 358.53, 366.50
>=18 kg 7 0 359.71 20.05 341.17, 378.26
Day 0
Overall 506 4 354.25 24.84 352.08, 356.41 < 7 kg 7 0 372.00 27.98 346.12, 397.88
>=7 and <13 kg
348 6 368.83 23.72 366.33, 371.33
>=13 and <18 kg
142 0 377.70 18.72 374.60, 380.81
>=18 kg 7 0 371.71 22.08 351.29, 392.14
A/L
Day 2
Overall 504 6 371.41 22.74 369.42, 373.40
< 7 kg 7 0 15.57 33.13 -15.07, 46.21
(¹) >=7 and <13 kg
345 9 18.31 25.81 15.58, 21.04 (²)
>=13 and <18 kg
142 0 15.19 24.15 11.18, 19.20 (³)
>=18 kg 7 0 12.00 25.21 -11.32, 35.32
(4)
Change
Overall 501 9 17.30 25.42 15.07, 19.53 (5) (¹) test for the comparison DHA/PQP vs. A+L for patients having weight < 7 kg: p-value = 0.597 (²) test for the comparison DHA/PQP vs. A+L for patients having weight >=7 and <13 kg: p-value = 0.024 (³) test for the comparison DHA/PQP vs. A+L for patients having weight >= 13 and <18 kg: p-value < 0.001 (4) test for the comparison DHA/PQP vs. A+L for patients having weight >=18 kg: p-value = 0.685 (5) test for the comparison DHA/PQP vs. A+L overall: p-value < 0.001
The actual differences between treatments for the changes in QTcF from baseline were 7.54 ms, 3.82
ms, 12.74 ms and 5.29 ms for ascending weight classes. The applicant points out that only the two
middle weight classes included a reasonable sample size and considered the differences to be of a
random nature.
Assessment Report EMA/739355/2011 Page 113/129

Cardiac SOC TEAEs and those coded as ECG abnormalities by weight classes up to 18 kg (there were
no such AEs reported in the small numbers with weight > 18 kg) did not suggest any consistent excess
of TEAEs in the DHA/PQP group.
Overall view of ECGs
In the applicant’s summary and based on patient data (i.e. without taking into account the data from
DM09-006) it was concluded that Eurartesim does have a greater potential for QTc prolongation than
the comparator drugs against which it was tested but it is stated that the effect is short-lived since it is
not apparent at Day 7. It was stated that the cause is uncertain but the regression analysis performed
in the patients of the Asian Phase I/II study suggested that QTc prolongation does not correlate with
peak plasma concentrations of DHA but with those of PQP. This was later corroborated by the data
from DM09-006.
Nevertheless, the D0 and D2 ECGs in subjects with acute malaria were all obtained pre-dose. The
studies did not capture ECGs around Cmax of either active and therefore the changes from baseline
observed in each treatment group are very unlikely to be the maximal changes to be expected during
each dose interval.
The QTcF values showed a comparable treatment difference among subjects who were re-dosed due to
vomiting in the African study as in all other subjects. Among re-dosed patients there were no
statistically significant differences in QTcB values detected for changes from Baseline to Day 2 and Day
7. The QTcF values from Baseline to D2 (but not to D7) showed a statistically significant difference
(p=0.02) favouring A/L. No subject re-dosed with DHA/PQP had a QTcB or QTcF value over 500 ms on
D0, D2 or D7. The maximum change in QTcF was 102 ms on D2 and 78 ms on D7 but the actual
maximum QTcF observed was 436 ms on D2 and 430 ms on D7.
The summary also stated that there was no evidence of a corresponding increased risk of AEs
associated with QT prolongation. However, the actual numbers are shown below and, while small,
there are some imbalances.
Assessment Report EMA/739355/2011 Page 114/129

Table 65: Incidence of QT-associated TEAEs in Pivotal Studies (Safety Population)
Serious adverse event/deaths/other significant events
DM 040010
There were no deaths in this study. There were more patients with SAEs in the DHA/PQP group (1.6%)
compared with the AS+MQ group (0.8%) but the proportions with SAEs considered drug-related were
comparable at 0.8%. In the DHA/PQP group there were twelve SAEs in twelve patients of which six
were considered to be related to DHA/PQP (three ‘unlikely’ and three ‘possible’). In the AS+MQ group
there were three SAEs in three patients, with relatedness described as one ‘unlikely’, one ‘possible’ and
one ‘probable’.
The six SAEs categorised as related to DHA/PQP included two cases of worsening anaemia considered
unlikely to be related, a viral infection requiring hospitalisation on day 51 thought unlikely to be
related, a case of Wolff-Parkinson-White (WPW) diagnosed on Day 2 (which the investigator considered
possibly related to DHA/PQP even though this is a congenital cardiac conduction anomaly), a grand mal
convulsion three hours after the first dose in a 38 year-old male considered possibly related to
Assessment Report EMA/739355/2011 Page 115/129

DHA/PQP and a case of mild encephalitis on Day 45, which resulted in a left sided hemiplegia thought
to be possibly related.
DM 040011
The overall mortality rate was 0.13% (2/1548) with one death in each treatment group. The death in
the DHA/PQP group occurred in a 3 year-old whose condition deteriorated suddenly on Day 2. The
investigator thought that death was unlikely to be related to DHA/PQP and might have been caused by
hypoglycaemia secondary to severe malaria (but there is no glucose result available), hepatitis or
septicaemia. The Day 2 ECG was reported as abnormal and heart rate was 163 bpm. A post-mortem
examination was not performed.
In the DHA/PQP group 19 SAEs occurred in 18 patients (1.73%) of which 16 were considered related
to DHA/PQP but 14 were graded “unlikely”. In the A/L group there were five SAEs (1%) of which four
were deemed related to study treatment.
The study report states that the overall difference between treatments in SAE rates was mainly due to
the higher incidence of infections seen in the DHA/PQP group (n = 13, comprising P. falciparum
malaria n = 4, pyrexia n = 3, pneumonia = 3, severe malaria n = 1, bronchiolitis n = 1 and
gastroenteritis = 1) compared to none in the A/L group.
In the DHA/PQP group two cases of hepatitis were considered possibly and probably related to
DHA/PQP:
One patient aged 2 years developed moderate hepatitis on Day 3 (ALT 236 u/L, mild jaundice
(Days 6 - 21) and mild hepatomegaly (Days 7 - 14). On Day 7 hepatitis A serology was positive
and hepatitis B and C serology were negative. The hepatitis resolved without intervention by Day
28 and the investigator thought the hepatitis was probably related to DHA/PQP.
The other patient was aged 4 years and developed severe hepatitis on Day 38. ALT rose from 52
iu/L to 1300.45 iu/L and bilirubin rose from 0.12 mg/dL to 8.08 mg/dL on Days 28 and 42,
respectively. Hepatitis B serology was negative and hepatitis A and C serology was not performed.
The hepatitis resolved without intervention by Day 59 and the investigator thought this was
possibly related to DHA/PQP.
Laboratory findings
DM 040010
Patients were mildly thrombocytopenic at recruitment. Hb, Hct and platelet counts improved and
eosinophilia rates increased during the course of the study. All haematological changes were consistent
with recovery from malaria and during the course of the study the proportion of patients in both
treatment groups with Hct, Hb and platelet counts within the normal range increased.
At enrolment total and direct bilirubin were raised due to haemolysis associated with acute malaria. At
the end of the study all biochemical variables were within normal ranges and fewer than 3% of
patients showed signs of haemolysis, possibly associated with new infections.
Assessment Report EMA/739355/2011 Page 116/129

DM 040011
There were overall improvements in anaemia during the study. Non-clinically significant eosinophilia
developed in 3.5% per group and shifts in eosinophil counts of approximately 17% (DHA/PQP) and
14% (A/L) from low non-clinically significant to normal were seen.
ALT, total bilirubin and creatinine were measured at all centres. AST, GGT, alkaline phosphatase, direct
bilirubin, total protein, urea nitrogen, glucose and albumin were measured only in Burkina Faso, Kenya
and Zambia. Direct bilirubin was raised at baseline (in 4.7% and 5.1% per group) but within normal
limits by Day 42 and was probably due to haemolysis associated with malaria. The proportions with
raised bilirubin fell to 2.3% in both groups by the end of the study
Safety related to drug-drug interactions and other interactions
DM 040010
Paracetamol was taken by 66% and 68% of patients in the two groups. One quarter of all patients was
taking vitamin B-complex, one third received dextrose and sodium chloride and about one quarter
received a glucose injection.
DM 040011
Paracetamol was taken by 83% and 82% per group. Over half of all patients took an antibacterial
agent during the trial with amoxicillin prescribed most often (44% and 46%). Ferrous sulfate was
prescribed for anaemia associated with malaria in 15% per group.
Discontinuation due to adverse events
DM 040010
Four patients in the DHA/PQP group and one in the AS+MQ group stopped treatment prematurely due
to AEs. All AEs resolved completely. The table does not show all discontinuations from study
Table 66: Significant Adverse Events Causing Early Discontinuation of Study Treatment
(Safety Population)
Assessment Report EMA/739355/2011 Page 117/129

DM 040011
Five patients in Kenya in the DHA/PQP group stopped treatment prematurely due to AEs. None of these
AEs was serious and all resolved completely. One patient took Malarone for P. falciparum malaria on
Days 2-4 and Claritin for the skin reaction and pruritus on Days 2-6. Another took Malarone for P.
falciparum malaria on Days 2-4, paracetamol on Days 1-3 and Piriton for the skin reaction on Days 2-5
and one other took Piriton for allergic dermatitis on Days 2- 6. There was no history of chloroquine use
by these three patients. There were no early discontinuations in the A/L group at any centre.
Table 67: Significant Adverse Events Causing Early Discontinuation of DHA/PQP (Safety
Population)
Post marketing experience
No post-marketing data with Eurartesim are available. However, a short summary of the
postmarketing experience from similar combination drugs Artekin and DuoCotexim was provided.
Meta-analysis on safety of PQP
A meta-analysis on safety of PQP derived from published literature, compared the number of deaths
which occurred in 55 clinical trials in patients treated with PQP alone or in combination with any other
compound(s). In total 19,446 patients treated with DHA/PQP were considered (9,015 in controlled
studies and 561 in uncontrolled studies for the treatment of uncomplicated malaria, 192 in PK studies
and 9,678 in IPT studies). The results demonstrate no excess of risk of dying in the DHA/PQP group as
compared with all other considered treatment groups. However, due to several deficiencies, this meta-
analysis cannot rule out the possibility of differences between the different antimalarials.
2.6.1. Discussion on clinical safety
From the safety database all the adverse reactions reported in clinical trials have been included in the
Summary of Product Characteristics.
The safety database for Eurartesim consists of exposure to subjects enrolled in clinical studies
sponsored by the applicant and included 1862 adult and paediatric patients with malaria. Most data
are derived from the pivotal trials DM 040010 and DM 040011. Overall, Eurartesim treatment was well
tolerated in the studied patient populations. As an important TEAE, QTc prolongation was identified.
The QTc prolongation was asymptomatic in all cases and was not associated with more clinically
significant abnormalities. The applicant provided a meta-analysis of safety of piperaquine derived from Assessment Report EMA/739355/2011 Page 118/129

published papers that did not suggest an excess risk of death for Eurartesim vs. other antimalarial
agents. However, this meta-analysis cannot rule out the possibility of an excess risk.
In the Asian study, analysis of rates of all cardiac AEs and drug-related cardiac AEs in the DHA/PQP
group of arrhythmic nature (sinus bradycardia, sinus tachycardia and sinus arrhythmia) showed that
these were more frequent in the DHA/PQP group than AS+MQ group. However, all drug-related events
of arrhythmic nature were considered mild, not serious and occurred without concomitant
cardiovascular events.
The limitations of the safety database were influenced by eligibility criteria used in pivotal trials
The trials did not include elderly patients, pregnant or lactating women and patients with moderate or
severe liver or moderate to severe renal diseases.
The follow up of patients in the Phase III studies was too short to allow detection of long-term adverse
reactions.
Additional expert consultations
During the MA application, an Ad-Hoc Expert Committee was convened to discuss cardiac safety
aspects of Eurartesim. The questions posed to experts were as follows:
The possible risk of cardiac arrhythmia secondary to QTc prolongation even when Eurartesim is
administered in the fasting state
The possible effect of administration in the fasting state on efficacy
In light of their findings on these issues, the advisory group is requested to comment on the
possible role of Eurartesim in the management of acute uncomplicated falciparum malaria in the
EU
Overall, the experts advised that the significant QTc prolongation observed with Eurartesim
administration poses a problem and unpredictable risk for a small proportion of people. However, they
were reassured by the data when Eurartesim was administered in the fasting state and by the clinical
data that are available so far.
The data on efficacy whilst fasting were reassuring and permit recommendation for administration of
Eurartesim between meals.
Overall, Eurartesim would increase the available therapeutic armamentarium. It provides an additional
choice in treating uncomplicated falciparum malaria.
2.6.2. Conclusions on clinical safety
In clinical trials, Eurartesim was generally safe and well tolerated.
Treatment emergent QTc prolongation was asymptomatic in all cases. The magnitude of QTc
prolongation is reduced if dosing occurs between meals. The potential concern that the QTc
prolongation might lead to serious cardiac arrhythmias is addressed appropriately in the approved
RMP.
Limitations of the safety database include missing information on categories of patients belonging to
the target population. This shortcoming is reflected in the Product Information as stated in sections 4.3
or 4.4 of the SmPC and in the RMP.
The CHMP considers the following measures necessary to address issues related to safety: Assessment Report EMA/739355/2011 Page 119/129

To further substantiate the cardiac safety of Eurartesim use in patients with signs and symptoms of
uncomplicated malaria, including the effect of Eurartesim administration on QTc intervals, the MAH
shall provide the results of an epidemiological study addressing this issue, according to a CHMP agreed
protocol.
2.7. Pharmacovigilance
Detailed description of the pharmacovigilance system
The CHMP considered that the Pharmacovigilance system as described by the applicant fulfils the
legislative requirements.
Risk management plan
The applicant submitted a risk management plan, which included a risk minimisation plan.
Table 68: Summary of the risk management plan
Safety
concerns Agreed pharmacovigilance activities Agreed risk minimisation activities
Identified risk:
QTc
prolongation
Food interaction
Routine PV, special monitoring of cardiovascular AEs including QTc prolongation: 1. In-depth revision and analysis of individual
AE reports; 2. In-depth revision and analysis of
aggregated data during the periodic “Safety Surveillance Meeting” performed quarterly by the Applicant’s Corporate Safety Department, in order to monitor the identified risks;
3. In addition, these cases will be presented and discussed in the PSUR section “Overall Safety Evaluation” with additional reference from section “Analysis of individual case histories”.
Additional PV activities: For cases of reported QT prolongation or events, possibly related to QT prolongation and cardiac arrhythmia, ST have designed a specific questionnaire to get as much follow-up information as possible on these cases. The Applicant commits to performing a registry study in the European Union, aiming at assessing the incidence of treatment-emergent adverse events of special interest (torsade de pointes, sudden death, ventricular tachycardia, ventricular fibrillation and flutter, syncope, seizures and sustained arrhythmias), co-morbidities and concomitant medications, as well as at monitoring patterns of drug utilization.
Routine risk minimisation activities: Patients at increased risk for arrhythmias are described in Section 4.3 ‘Contraindications’ and 4.4 ‘Special warnings and precautions for use’ of the SPC and in Section 4.5 ‘Interaction with other medicinal products and other forms of interactions’. The SPC was amended to reflect the new findings from the food interaction studies: Eurartesim should only be taken with water and without food. Each dose should be taken no less than 3 hours after the last food intake. No food should be taken within 3 hours after each dose. Additional risk minimization activities: An Educational Guide for HCPs will describe the identified risk of QTc prolongation highlighting the need to take Eurartesim with water and without food. Each dose should be taken no less than 3 hours after the last food intake. No food should be taken within 3 hours after each dose. The recommendations for ECG monitoring and a warning of possible interactions. A checklist for contraindicated conditions for use and contraindicated concomitant medications (drugs known to prolong the QTc interval) will be included in the educational material provided to HCPs. Patients will be advised to contact their doctor about adverse events, and
Assessment Report EMA/739355/2011 Page 120/129

Once Eurartesim is registered in Africa, the applicant intends to participate in the large epidemiologic INESS (INDEPTH Effectiveness and Safety Studies) study to monitor the effectiveness/safety of DHA/PQP when used for treatment of uncomplicated P. falciparum malaria in endemic countries. The INESS study is a spontaneous observational study, which will include 10,000 patients with uncomplicated malaria and a sub-set of 1,000 patients with prospective ECG monitoring.
specifically any alterations in cardiac rhythm or symptoms (e.g. loss of consciousness). The Patient Information Leaflet will include a list of adverse events potentially associated with QT prolongation. Details of the registry (e.g. contact data for each country) will also be included with the educational material, in the countries where the registry will be run.
Potential risks:
Neurotoxicity
Routine PV, including surveillance of AEs regarding Neurotoxicity: 1. In-depth analysis of individual AE reports; 2. Revision and analysis of aggregated data
during the periodic “Safety Surveillance Meeting” performed quarterly by the Applicant’s Corporate Safety Department, in order to identify potential risks;
3. In addition, these cases will be presented and discussed in the PSUR section “Overall Safety Evaluation” with additional reference from section “Analysis of individual case histories”.
Monitor potential convulsions as part of INESS epidemiologic study of DHA/PQP in treatment of uncomplicated P. falciparum malaria in endemic countries.
Section 4.8 of the SPC ‘Undesirable Effects’ lists ‘Convulsion’ as an Uncommon ADR in Eurarteism clinical trials in both adult and paediatric patients. Section 5.3 of the SPC ‘Preclinical Safety Data’ advises that the potential for neurotoxicity of orally administered DHA in humans can be considered highly unlikely, given the rapid clearance of DHA and its short exposure (3 days of treatment for malaria patients). There was no evidence of DHA-induced lesions in the specific nuclei in rats or dogs, even at lethal dose.
Phototoxicity Routine PV, including surveillance of AEs regarding Phototoxicity: 1. In-depth analysis of individual AE reports; 2. Revision and analysis of aggregated data
during the periodic “Safety Surveillance Meeting” performed quarterly by the Applicant’s Corporate Safety Department, in order to identify potential risks;
3. In addition, these cases will be presented and discussed in the PSUR section “Overall Safety Evaluation” with additional reference from section “Analysis of individual case histories”.
No risk minimisation activities are proposed at this time.
Reproductive
toxicity
Routine PV; Two pregnancy registries are planned by the Applicant: one in the European Union (A European multi-centre pregnancy Registry for patients exposed to Eurartesim™ for the treatment of malaria whilst pregnant), and another in Africa (Assessment of the Safety of the Antimalarial Drug use During Early Pregnancy, ASAP); PREGACT study (ITMP0308): Safe and efficacious artemisin-based combination treatments for African pregnant women with malaria. Pharmacokinetics of piperaquine in pregnancy: spontaneous study to define the
Routine risk minimisation activities: Per Section 4.6 ‘Fertility, pregnancy and lactation’ of the SPC, Eurartesim should not be used during pregnancy in situations where other suitable and effective anti-malarials are available. Additional risk minimization activities: An educational outreach program will be conducted - educational materials will be provided to HCPs (HCP Information Pack) outlining the potential risk of reproductive toxicity and the action to take in the event of pregnancy. Details of the pregnancy registry (e.g. contact data for each country) will also be
Assessment Report EMA/739355/2011 Page 121/129

pharmacokinetic disposition of PQ in pregnant women; The results of spontaneous studies using Eurartesim will be added.
included with the educational material.
Development of
resistant
Plasmodium
strains
Routine PV; Close collaboration with international organizations (including BCRT and WWARN). The collaboration with Berlin Center for Travel & Tropical Medicine (BCRT) consists at present in a preliminary agreement which includes the outline of a protocol of a prospective study aimed to verify the efficacy and safety of Eurartesim in those patients with imported P. falciparum malaria treated at BCRT. The collaboration between the Applicant and the WWARN will be based on the acceptance to transfer the Applicant databases of the Phase 3 clinical studies to WWARN. The rules for this transfer will be defined by June 2011.
No risk minimisation activities are proposed at this time.
Missing information: Use in children below 6 months of age or below 5kg body weight
Routine PV; A study in infants (1 to 12 months of age) has been agreed upon with the PDCO to assess the safety/tolerability of an age-appropriate formulation.
Routine risk minimisation activities: Children below 6 months were excluded per Section 4.2. of the SPC. In clinical trials children from 6 months onwards were treated with no additional safety concerns detected.
Use in pregnant and lactating women
Routine PV; Two pregnancy registries are planned by the Applicant: one in the European Union (A European multi-centre pregnancy Registry for patients exposed to Eurartesim™ for the treatment of malaria whilst pregnant), and another in Africa (Assessment of the Safety of the Antimalarial Drug use During Early Pregnancy, ASAP); PREGACT study (ITMP0308): Safe and efficacious artemisin-based combination treatments for African pregnant women with malaria. Pharmacokinetics of piperaquine in pregnancy: spontaneous study to define the pharmacokinetic disposition of PQ in pregnant women; The results of spontaneous studies using Eurartesim will be added.
Routine risk minimisation activities: Per Section 4.6 ‘Fertility, pregnancy and lactation’ in the SPC, Eurartesim should not be used during pregnancy in situations where other suitable and effective anti-malarials are available. Additional risk minimization activities: An educational outreach program will be conducted - educational materials will be provided to HCPs (HCP Information Pack) outlining the potential risk of reproductive toxicity and the action to take in the event of pregnancy. Details of the registry will also be included.
Use in patients with moderate/severe renal or moderate/severe hepatic impairment Use in patients with cardiac impairment
Routine PV, including surveillance of AEs in Special Populations:
1. Revision and analysis of aggregated data during the periodic “Safety Surveillance Meeting” performed quarterly by the Applicant’s Corporate Safety Department, in order to identify potential risks.
2.In addition, these cases will be presented and discussed in the PSUR section “Overall Safety Evaluation – Special Populations”.
Routine risk minimisation activities: Per Section 4.2 ‘Posology and method of administration’ of the SPC, in patients with moderate or severe renal impairment, or moderate or severe hepatic impairment, caution is advised.
Use in patients with HIV/AIDS
Routine PV No risk minimisation activities are proposed at this time.
Use in elderly patients - patients >65 years
Routine PV, including AE surveillance in elderly >65 years.
Routine risk minimisation activities: Section 4.2 of the SPC advises that clinical studies of Eurartesim tablets did not include subjects aged 65 years and over.
Assessment Report EMA/739355/2011 Page 122/129

Use in patients with a BMI > 27 and overweight patients (>100 kg body weight)
Routine PV to capture potential insufficient efficacy in patients with body weight >100 kg. Dose for body weight >100 kg to be established.
Section 4.2 of the SPC ‘Posology and method of administration’ advises that ‘there are no data on which to base a dose recommendation in patients weighing >100kg’.
Use in patients of Caucasian Ethnicity
Routine PV.
No risk minimisation activities are proposed at this time.
Long-term AE data and repeated use of Eurartesim
Routine PV including surveillance of all AEs.
Per SPC, if more than two malaria infections occur within 12 months, alternative treatment is recommended. If a recurrent parasitaemia occurs within 2 months after the first Eurartesim treatment, an alternative antimalarial treatment is recommended.
Drug interaction with CYP3A4 metabolised drugs Drug interaction with other antimalarial drugs
With regard to CYP3A4 substrates, the applicant has agreed to provide Eurartesim to a third party organisation investigating the possibility of pharmacokinetic interactions between artemisinin combination therapies and anti-retroviral drug regimens. Although Sigma Tau will not be the sponsor of this study, it will have access to the results and these will be reported in the first PSUR to be submitted after the data become available. Usage in patients with HIV/AIDs will be kept under review in PSURs as a specific group. The following Drug-Drug Interaction studies are also planned (refer to Annex 3a for synopses): Concomitant administration of Eurartesim
and Clarithromicyn to assess the effect of this potent CYP3A4 inhibitor on the pharmacokinetics of Eurartesim, particularly on PQ.
Concomitant administration of Eurartesim and Midazolam, to assess the effect of Eurartesim on the pharmacokinetics of this CYP3A4 substrate.
Potential interaction of Eurartesim on the pharmacokinetics of oral contraceptives (ethinyl estradiol/levonorgestrel).
Routine risk minimisation activities: Drug interactions with potent CYP3A4 inhibitors, other CYP3A4 metabolised drugs and other drugs known to increase QTc interval are addressed in Section 4.3, 4.4 and 4.5 of the SPC. Concomitant treatment with other antimalarials is addressed in Section 4.4 of the SPC.
Use in patients with severe malaria
Routine PV. Routine risk minimisation activities: Eurartesim is contraindicated in patients with severe malaria according to WHO definition, SPC Section 4.3.
Assessment Report EMA/739355/2011 Page 123/129

The CHMP, having considered the data submitted, was of the opinion that the below pharmacovigilance
activities in addition to the use of routine pharmacovigilance are needed to investigate further some of
the safety concerns:
Description Due date
A post-marketing multi-centre registry study to be conducted in
European Union with the objective to investigate the association
between the Eurartesim induced QTc prolongation and possible
predictive factors, and estimate the incidence of treatment-emergent
adverse events of special interest. The information collected will include
data on:
- possible predictive factors such as age, gender, ethnicity, food intake,
co-morbidities and co-medication
- adverse events of special interest such as torsade de pointes, sudden
death, ventricular tachycardia, ventricular fibrillation and flutter,
syncope, seizures and sustained arrhythmias.
The study will also monitor the patterns of drug utilization for
Eurartesim.
Progress reports on
enrolment and intermediate
analysis results will be
provided yearly with PSURs
Final study report date
submission by 31 December
2015
An epidemiologic study on the safety of Eurartesim when used patients
with signs and symptoms of uncomplicated malaria confirmed by a
Rapid Diagnostic Test (RTD) or, when this test is not available, by WHO
diagnostic criteria (INESS study). The study will be conducted in
demographic sentinel sites investigating at least 10000 malaria cases. A
subset of at least 1000 patients will be investigated for the effect of the
administration of Eurartesim on blood biochemistry, full blood count and
QTc intervals.
Final study report submitted
by 31 December 2014
A post-marketing registry to be set-up in European countries with the
objective to gain additional information on the safety of Eurartesim
exposure during pregnancy. The prospective, observational registry
study will evaluate the live birth prevalence of minor and major
congenital birth defects and shall assess the foetal and maternal
outcomes of pregnancy in women who were exposed at any time during
pregnancy to Eurartesim for the treatment of malaria.
Yearly reports on patient
recruitment, at the time of
the PSUR submission.
Interim analysis reports
every two years, at the time
of the PSUR submission.
Final study report by
December 2018
The following additional risk minimisation activities were required:
A healthcare professional educational pack, to be provided to all physicians who are expected to
prescribe or use Eurartesim, containing the following:
- The Summary of Product Characteristics
- The Patient Information Leaflet
- The Physician Leaflet including the Contraindicated Conditions of Use and Contraindicated
Concomitant Medication checklist
In addition, the CHMP considered that the applicant should take the following minor points into
consideration when an update of the Risk management Plan is submitted:
The outstanding study protocols for studies included in the EU-RMP pharmacovigilance plan should
be submitted for CHMP assessment and approval.
Assessment Report EMA/739355/2011 Page 124/129

2.8. User consultation
The results of the user consultation with target patient groups on the package leaflet submitted by the
applicant show that the package leaflet meets the criteria for readability as set out in the Guideline on
the readability of the label and package leaflet of medicinal products for human use.
3. Benefit-Risk Balance
Benefits
Beneficial effects
Eurartesim meets the WHO recommendations for ACT since it comprises an artemisinin with a longer-
acting partner drug. The two Phase 3 studies have demonstrated acceptable clinical efficacy of
Eurartesim for the treatment of uncomplicated falciparum malaria in endemic areas.
Uncertainty in the knowledge about the beneficial effects
The possibility that dosing apart from food as recommended in the SmPC could have a negative impact
on efficacy cannot be wholly dismissed. There is no appreciable effect of food on DHA absorption,
which affects the early parasiticidal activity, but dosing Eurartesim with food greatly enhances
piperaquine plasma levels. In this regard, the timing of the three daily doses in relation to food intake
could not be discerned with confidence from the data collected during the Phase 3 clinical studies.
While it is likely that the first doses were often taken on an empty stomach due to acute illness, the
actual dosing conditions probably changed as clinical recovery ensued so that the second and third
doses were more likely to have been taken with or close to a meal.
It is not possible to be sure that the efficacy observed in subjects resident in endemic areas would
necessarily apply to returning EU travellers. EU travellers will comprise a mixture of ethnicities and a
proportion of EU residents who spent much of their early life in endemic areas may still have some
residual immunity to malaria but the majority will not. Plasma exposure to DHA and to PQP was at
least numerically higher in healthy Asians vs. Caucasian subjects and was higher for DHA in female vs.
male subjects on dosing after a light meal. However, the plasma levels of DHA are clearly very
different between subjects with acute malaria and healthy subjects, which makes it difficult to draw
any conclusions from these observations.
Risks
Unfavourable effects
With the exception of effects on QTc intervals, the types and rates of unfavourable effects documented
in the clinical studies were comparable between Eurartesim and the other ACTs that were evaluated.
Assessment Report EMA/739355/2011 Page 125/129

Uncertainty in the knowledge about the unfavourable effects
The current safety database is not sufficiently large to determine whether the QTc effect of Eurartesim
will translate into arrhythmias and, if so, how frequently these may occur. However, the non-clinical
data suggest that, despite the effect on QTc, the torsadogenic potential of Eurartesim may be low and
there are currently no clinical data (from sponsored or published studies) that indicate a signal for
clinically significant treatment-associated arrhythmias.
Benefit-risk balance
On current evidence, the risk-benefit balance of Eurartesim in treatment of uncomplicated falciparum
malaria could be deemed favourable. This position takes into account the risk for cardiac side effects
resulting from the pronounced Eurartesim-induced QTc-interval prolongation as demonstrated in the
thorough QTc-study as well as in the pivotal clinical studies. It is considered that these safety
concerns be sufficiently covered by the precautionary measures stated in the product literature.
Discussion on the benefit-risk balance
Malaria is a global problem with the greatest burden of disease and mortality occurring in tropical
countries. Malaria is particularly dangerous in children under 5 years of age, pregnant women and
previously unexposed visitors to endemic areas. P. falciparum is the most prevalent, treatment
resistant form of malaria and is responsible for the severe and most deadly forms of the disease in
children and adults.
A substantial number of EU residents are at risk of contracting malaria during leisure or business travel
and migration. Eurartesim is an artemisinin-containing combination (ACT) that is recommended by the
2010 WHO guidelines for the treatment of malaria and is currently expected to be active against P.
falciparum worldwide. In the two Phase 3 studies conducted in Asia (including areas with multiple
drug-resistant falciparum strains) and in Africa, Eurartesim showed comparable efficacy to other ACT
regimens in residents of endemic areas. However, based on pharmacokinetic data and plasma levels it
cannot be ruled out that efficacy might not be quite as good as observed in the Phase 3 studies in
subjects with no prior exposure to malaria and when Eurartesim is dosed apart from food.
The sponsored clinical studies indicated that, with the exception of the degree of effect on the QTc
interval, the safety profile of Eurartesim was comparable to that of other ACTs. The non-clinical data
and the available clinical data do not suggest that the effect on QTc is associated with serious cardiac
arrhythmias, including torsades de pointes, but this possibility cannot be dismissed. Hence the SmPC
and RMP take into consideration this possibility. In particular, the SmPC includes contraindications,
warnings and precautions that are intended to minimise any risk for serious cardiac arrhythmias to
occur.
Likewise as for other infective diseases, it is vital for the physician to have multiple treatment options.
As such, Eurartesim might offer a useful alternative to current lead treatments available in Europe.
Overall, Eurartesim provides a Europe-wide alternative in the armamentarium of uncomplicated P.
falciparum malaria treatment. The identified safety concerns are addressed in the Risk Management
Plan (RMP) and Annex II.
Assessment Report EMA/739355/2011 Page 126/129

4. Recommendations
Outcome
Based on the CHMP review of data on quality, safety and efficacy, the CHMP considers by majority
decision that the risk-benefit balance of Eurartesim in the treatment of uncomplicated Plasmodium
falciparum malaria in adults, children and infants 6 months and over and weighing 5 kg or more is
favourable and therefore recommends the granting of the marketing authorisation subject to the
following conditions:
Conditions or restrictions regarding supply and use
Medicinal product subject to medical prescription.
Conditions and requirements of the marketing authorisation
Risk management system and PSUR cycle
The MAH must ensure that the system of pharmacovigilance, presented in Module 1.8.1 of the
marketing authorisation, is in place and functioning before and whilst the product is on the market.
The MAH shall perform the pharmacovigilance activities detailed in the Pharmacovigilance Plan, as
agreed in version 11.0 of the Risk Management Plan (RMP) presented in Module 1.8.2 of the marketing
authorisation and any subsequent updates of the RMP agreed by the CHMP.
As per the CHMP Guideline on Risk Management Systems for medicinal products for human use, the
updated RMP should be submitted at the same time as the next Periodic Safety Update Report (PSUR).
In addition, an updated RMP should be submitted:
When new information is received that may impact on the current Safety Specification,
Pharmacovigilance Plan or risk minimisation activities
Within 60 days of an important (pharmacovigilance or risk minimisation) milestone being reached
at the request of the EMA
The PSUR cycle for the product will follow the standard requirements until otherwise agreed by the
CHMP.
Conditions or restrictions with regard to the safe and effective use of the medicinal product
The Marketing Authorisation Holder shall agree the format and content of the physician leaflet with the
National Competent Authority prior to launch in the Member State.
The Marketing Authorisation Holder shall ensure that all physicians who are expected to prescribe or
use Eurartesim are provided with a healthcare professional educational pack containing the following:
The Summary of Product Characteristics
The Patient Information Leaflet
Assessment Report EMA/739355/2011 Page 127/129

The Physician Leaflet including the Contraindicated Conditions of Use and Contraindicated
Concomitant Medication checklist
The Physician Leaflet should contain the following key messages:
That Eurartesim has a potential to prolong the QTc interval that may lead to potentially lethal
arrhythmias.
That piperaquine absorption is increased in the presence of food, therefore to reduce this risk of
QTc interval prolongation, the patients should be advised to take the tablets with water, without
food, no less than three hours after the last food intake. No food should be taken within 3 hours
after each dose.
That Eurartesim is contraindicated in patients with severe malaria according to WHO definition and
in patients with a history of clinical conditions that may lead to QTc interval prolongation, and in
patients taking drugs that are known to prolong the QTc interval.
The ECG monitoring recommendations.
The scope and use of the Contraindicated Conditions of Use and Contraindicated Concomitant
Medication checklist
That there is a potential risk of teratogenicity and so Eurartesim should not be used in situations
where other suitable and effective anti-malarials are available.
The need to counsel patients on important risks associated with Eurartesim therapy and
appropriate precautions when using the medicine.
That patients should be advised to contact their doctor about adverse events and that
physicians/pharmacists should report suspected adverse reactions to Eurartesim, and in particular,
those associated with a QT prolongation.
The existence and scope of the pregnancy register and details of how to enter patients in it.
In Member States where the EU safety registry will be available, the educational materials should
include details on the registry and how to enter patients in it.
Obligation to complete post-authorisation measures
The MAH shall complete, within the stated timeframe, the following measures:
Description Due date
To further substantiate the cardiac safety of Eurartesim use in patients with signs and symptoms ofuncomplicated malaria, including the effect of Eurartesim administration on QTc intervals, the MAH shall provide the results of an epidemiological study addressing this issue, according to a CHMP agreed protocol.
31 December
2014
Conditions or restrictions with regard to the safe and effective use of the medicinal product to be implemented by the Member States
The Member States shall agree the final educational material with the Marketing Authorization Holder
(MAH) prior to launch of the product in their territory.
Assessment Report EMA/739355/2011 Page 128/129

Assessment Report EMA/739355/2011 Page 129/129
The Member States shall ensure that the MAH provides all physicians who are expected to prescribe or
use Eurartesim a healthcare professional educational pack containing the following:
The Summary of Product Characteristics
The Patient Information Leaflet
The Physician Leaflet including the Contraindicated Conditions of Use and Contraindicated
Concomitant Medication checklist
The Physician Leaflet should contain the following key messages:
That Eurartesim has a potential to prolong the QTc interval that may lead to potentially lethal
arrhythmias.
That piperaquine absorption is increased in the presence of food, therefore to reduce this risk of
QTc interval prolongation, the patients should be advised to take the tablets with water, without
food, no less than three hours after the last food intake. No food should be taken within 3 hours
after each dose.
That Eurartesim is contraindicated in patients with severe malaria according to WHO definition and
in patients with a history of clinical conditions that may lead to QTc interval prolongation, and in
patients taking drugs that are known to prolong the QTc interval.
The ECG monitoring recommendations.
The scope and use of the Contraindicated Conditions of Use and Contraindicated Concomitant
Medication checklist
That there is a potential risk of teratogenicity and so Eurartesim should not be used in situations
where other suitable and effective anti-malarials are available.
The need to counsel patients on important risks associated with Eurartesim therapy and
appropriate precautions when using the medicine.
That patients should be advised to contact their doctor about adverse events and that
physicians/pharmacists should report suspected adverse reactions to Eurartesim, and in particular,
those associated with a QT prolongation.
The existence and scope of the pregnancy register and details of how to enter patients in it.
In Member States where the EU safety registry will be available, the educational materials should
include details on the registry and how to enter patients in it.
Active substance status
Based on the declaration of the applicant, this medicinal product shall be considered as a new fixed
dose combination of active substances.