Embed Size (px)
Citation preview

EARSeL eProceedings 8, 2/2009 140
ESTIMATION OF DAILY ACTUAL EVAPOTRANSPIRATION IN ALGERIAN SEMIARID ENVIRONMENT WITH SATELLITE ASTER
Abderrahmane Hamimed1, Abdelkader Khaldi1, Mekki Mehor1 and Abdelali Seddini2
1. University of Mascara, Biological Systems and Geomatics Laboratory, Mascara, Algeria; hamimed(at)dr.com, aekkhaldi(at)gmail.com, mekkimehor(at)gmail.com
2. University of Tlemcen, Department of Hydraulics, Tlemcen, Algeria; abdelseddini(at)yahoo.fr
ABSTRACT The main aim of this study is the use of the satellite ASTER data for assessing the daily actual evapotranspiration by solving the energy balance equation at the surface. The energy balance model used is SEBAL (surface energy balance algorithm for land). It is a one-source model that calculates the net radiation, soil heat flux and sensible heat flux at each remote sensing pixel and estimates the latent heat flux as the residual term in the energy balance. It involves as input the NDVI, surface temperature and albedo. The study area encompassed by ASTER image contains extremes in surface albedo, vegetation cover and surface temperature values. It is located in the Ksar Chellala plains in Algeria.
To estimate the sensible heat flux, which represents the crucial variable in solving the energy bal-ance equation, we opted for a method based on the use of profiles in the surface layer, with the coupling taking place in fluxes at the convective boundary layer base. A simplification of this method by ignoring the atmosphere thermal stability functions can give the same results approxi-mately. It is then possible to estimate the sensible heat flux and calculate the latent heat flux as the residual term of the energy balance. We can then assess the actual daily evapotranspiration and some moisture indices: evaporative fraction, the Priestley and Taylor parameters and the surface resistance to evaporation. These indices allow quantitative monitoring to be done on a pixel basis of the water status degree.
INTRODUCTION Monitoring the transfers of mass and energy at a surface is crucial for hydrological and vegetation re-sources management. It is also necessary for a better comprehension of hydrological and climatic systems as well as their predictions. Remote sensing is an excellent tool for this monitoring as it pro-vides information related to mass and energy transfers and particularly to evapotranspiration fluxes.
Evapotranspiration is one of the fundamental processes controlling the equilibrium of our planet. It constitutes the link between the hydrological and energetic equilibrium at the soil-vegetation-atmosphere interface and its knowledge is crucial for climatic and agro-meteorological studies. Depending on the geographical location on the earth’s surface, evapotranspiration represents be-tween 60 to 80 % of the precipitation return to the atmosphere (1). Consequently, it constitutes one of major phenomena in the hydrological budget, especially in arid and semi-arid regions.
Furthermore, the estimation of actual evapotranspiration using satellite data in the visible and infra-red has been at the centre of several methodological approaches during the last years (2). We can mention three such methods:
• Those using simple empirical relationships relating daily evapotranspiration to an instantane-ous surface temperature measurement (3,4,5). These methods are inconvenient as they can only give a daily value of actual evapotranspiration, and are essentially statistical in nature.
• Those using atmospheric boundary layer methods do not present the above limitation (6). They are, however, more cumbersome and use many important parameters difficult to

EARSeL eProceedings 8, 2/2009 141
measure, which make them unsuitable for spatial integration in models that are very sensi-tive to such parameters (7).
• Those avoiding the limitations of the previous two, while still preserving their advantages. They take into account physical laws where possible and empirical relationships otherwise. SEBAL (Surface Energy Balance Algorithm for Land) is considered as a third category. It has been developed to solve the energy budget equation using a spatial approach assum-ing the existence of sites in extreme hydrological conditions (very dry and very wet) (8). Properties from these sites are used to determine some variables at the soil-vegetation-atmosphere interface not possible to obtain through remote sensing.
In this study we propose a methodology based on SEBAL to solve the energy balance and map the actual daily evapotranspiration from the Advanced Space born Thermal Emission and Reflec-tion Radiometer (ASTER) aboard the NASA’s Terra Spacecraft.
THEORETICAL BACKGROUND Currently, the energy balance equation at the surface is expressed as (3):
Rn = G + H + λE (1)
which explains the partition of the net radiation Rn between soil heat flux G, sensible heat flux H and latent heat flux (corresponding to evaporation for a bare soil and transpiration for vegetation canopy). The net radiation is found from the various components of radiations exchanges:
Rn = (1- ro)·Rg + L↓ - L↑ (2)
where Rg is the incoming global radiation, partly reflected depending on the albedo ro, L↓ and L↑ are the downwelling and the upwelling long wave radiations, respectively.
The soil heat flux G is usually low in comparison with the other terms. Therefore, we tend to ne-glect it, or to give it a fixed proportion of the net radiation (0.1 for example). The sensible heat flux H is expressed as a function of the near-surface air temperature difference (To-Ta) (3):
( )po a
ah
CH T
rT
ρ ⋅= − (3)
This expression involves (besides the constants ρ and Cp, air density and specific heat, respec-tively) the aerodynamic resistance to heat transport rah which is a function of wind velocity, thermal stability effects of the atmosphere and surface roughness.
To estimate the aerodynamic resistance to heat transport, some theoretical approaches have been used particularly by Paulson (9). They are essentially based on the use of logarithmic profiles of mass and energy transfer in the surface boundary layer and the coupling between surface and boundary layer which occurs at the fluxes in the convective boundary layer. The integration of speed profiles leads to two similarity functions ψm and ψh parameterised by the turbulent regime of momentum and heat.
*ln( ) ( )om m
K uuza z za Lψ
⋅=
− (4)
ln( ) ( )
*oh h
ahza z za L
rK u
ψ−=
⋅ (5)
where u is the wind speed at the reference height (usually 2 m), ψm and ψh are the stability correc-tions for momentum transport and heat transport, respectively, K is the vonKarman constant (≈ 0,41), zom is the roughness length for momentum transport and zoh is the roughness length for heat transport, and L is the Monin-Obukhov’s length expressed as (8):

EARSeL eProceedings 8, 2/2009 142
3*p aC T u
LK g H
ρ ⋅ ⋅ ⋅= −
⋅ ⋅ (6)
where u* is the friction velocity, g is the acceleration due to gravity.
λE s the latent heat flux, expressed as:
( )p sat o a
ah s
C e T eE
r rρ
λγ⋅ −
= +
(7)
where γ is the psychrometric constant, rs is the surface resistance to evaporation, ea is the water vapour pressure at reference height za and esat(To) is the saturated vapour pressure at surface temperature.
STUDY FRAMEWORK Study area and climate The study area is located in the Ksar Chellala plain. It is located in the east of Tiaret (western Alge-ria) between latitudes 35°12' and 35°20'N, and longitudes 2°13' and 2°21'E. It covers an area of 126 km2 (Figure 1). The selected area is marked by a steppe plateau at the piedmont of Ben Hamad Mountain which constitutes a barrier to the scirocco winds that occur very frequently in summer. The average altitude is about 850 m. The terrain levellings are of miocene formation, consisted of sandy clay, poudings and conglomerates. We also note the presence of some alluvial deposits which cover bed watercourses.
The study area is reported to be located on semiarid climatic floor enjoying a continental climate. Two principal periods characterise this area: one rainy and dark during the months of autumn, win-ter and early spring and another dry and torrid in summer. The winter is rather cold. The minimum absolute temperature goes down to -6°C. The summer is usually dry and hot. The maximum abso-lute temperature is +47°C. Annual average precipitations are around 350 mm.
Because of the intense evapotranspiration and wind, only a small portion of the annual precipitation, which takes place all through the year, except for the summer season, is useful for cultivable soils.
Figure 1: Location of the study site.
EARSeL eProceedings 8, 2/2009 143
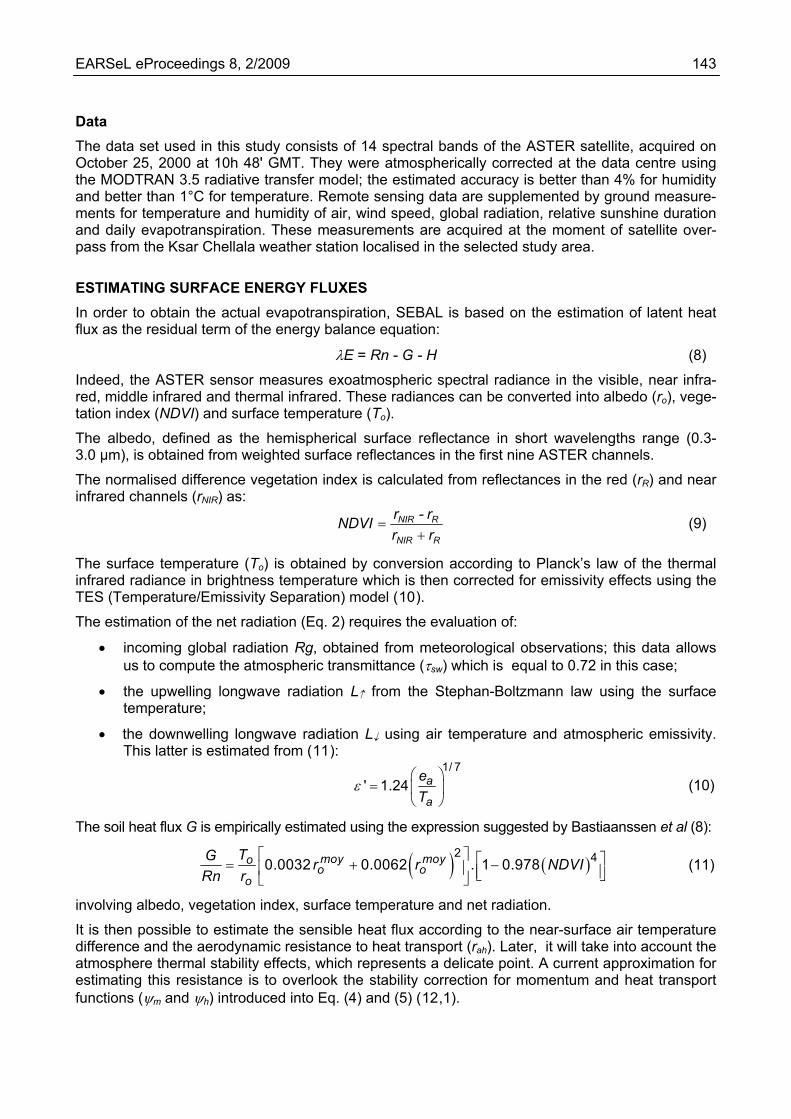
Data The data set used in this study consists of 14 spectral bands of the ASTER satellite, acquired on October 25, 2000 at 10h 48' GMT. They were atmospherically corrected at the data centre using the MODTRAN 3.5 radiative transfer model; the estimated accuracy is better than 4% for humidity and better than 1°C for temperature. Remote sensing data are supplemented by ground measure-ments for temperature and humidity of air, wind speed, global radiation, relative sunshine duration and daily evapotranspiration. These measurements are acquired at the moment of satellite over-pass from the Ksar Chellala weather station localised in the selected study area.
ESTIMATING SURFACE ENERGY FLUXES In order to obtain the actual evapotranspiration, SEBAL is based on the estimation of latent heat flux as the residual term of the energy balance equation:
λE = Rn - G - H (8)
Indeed, the ASTER sensor measures exoatmospheric spectral radiance in the visible, near infra-red, middle infrared and thermal infrared. These radiances can be converted into albedo (ro), vege-tation index (NDVI) and surface temperature (To).
The albedo, defined as the hemispherical surface reflectance in short wavelengths range (0.3-3.0 µm), is obtained from weighted surface reflectances in the first nine ASTER channels.
The normalised difference vegetation index is calculated from reflectances in the red (rR) and near infrared channels (rNIR) as:
RNIR
RNIR
rrr-rNDVI
+= (9)
The surface temperature (To) is obtained by conversion according to Planck’s law of the thermal infrared radiance in brightness temperature which is then corrected for emissivity effects using the TES (Temperature/Emissivity Separation) model (10).
The estimation of the net radiation (Eq. 2) requires the evaluation of:
• incoming global radiation Rg, obtained from meteorological observations; this data allows us to compute the atmospheric transmittance (τsw) which is equal to 0.72 in this case;
• the upwelling longwave radiation L↑ from the Stephan-Boltzmann law using the surface temperature;
• the downwelling longwave radiation L↓ using air temperature and atmospheric emissivity. This latter is estimated from (11):
1/ 7
' 1.24 a
a
eT
ε⎛ ⎞
= ⎜ ⎟⎝ ⎠
(10)
The soil heat flux G is empirically estimated using the expression suggested by Bastiaanssen et al (8):
( ) ( )2 40.0032 0.0062 . 1 0.978moy moyo
o oo
TG r r NDRn r
⎡ ⎤VI⎡ ⎤= + −⎢ ⎥ ⎢ ⎥⎣ ⎦⎣ ⎦
(11)
involving albedo, vegetation index, surface temperature and net radiation.
It is then possible to estimate the sensible heat flux according to the near-surface air temperature difference and the aerodynamic resistance to heat transport (rah). Later, it will take into account the atmosphere thermal stability effects, which represents a delicate point. A current approximation for estimating this resistance is to overlook the stability correction for momentum and heat transport functions (ψm and ψh) introduced into Eq. (4) and (5) (12,1).

EARSeL eProceedings 8, 2/2009 144
The original approach suggested in SEBAL (8) for estimating rah is based on the use of averaged profiles in the atmospheric boundary layer in which vertical fluxes (momentum flux, friction velocity, wind speed) can be considered constant even over heterogeneous terrains. It is therefore possible to assume that, for dry pixels, the latent heat flux is zero and the energy balance equation is then written as: Hdry = Rn - G (12)
The identification of dry pixels is done by analysing the relation between albedo and temperature surface (13). On these pixels, the aerodynamic resistance to heat transport (rah
dry) is determined according to:
pdryo ah
CHT r
ρ ⋅∂=
∂ (13)
∂H/∂To can be calculated as: *o
o o o
rH LRgT T T o
GT
∂∂ ∂= − + −
∂ ∂ ∂∂∂
(14)
corresponding to a combination of Eq. (1) and (2) followed by a differentiation with respect to sur-face temperature To. L* is the net longwave radiation (L* = L↓ - L↑ ).
The determination of ∂H/∂To for dry pixels requires the quantification of various terms on the right-hand side of Eq. (14) (Table 1).
Table 1: Partial derivatives of albedo and energy fluxes with respect to surface temperature.
Parameter Unit Value ∂ro/∂To K-1 -0.0495 ∂Go/∂To W.m-2.K-1 0.8800 ∂L*/∂To W.m-2.K-1 -6.0900 ∂H/∂To W.m-2.K-1 26.0600
∂LE/∂To W.m-2.K-1 0.0000
Eq. (13) enables us to assess the effective aerodynamic resistance to heat transport for dry pixels at blending height (generally set to 100 m) (14). Using rah
dry into an iterative process makes it pos-sible to extract the effective friction velocity u*100 at this height (Table 2). We can then obtain the wind speed (u) at the reference height using the logarithmic profiles. The integration of the aerody-namic momentum roughness zom into a second iterative process enables us to map the friction velocity u* at the reference height. Finally, the use of Monin-Oubukhov’s similarity hypothesis (8) allows us to map the aerodynamic resistance to heat transport following expression 5.
The near-surface air temperature difference (To-Ta) is computed using a linear relation between air and surface temperatures. The slope and offset are estimated inverting the sensible heat flux ex-pression over wet areas (To = Ta) and dry areas (H = Rn - G).
Table 2: Momentum flux parameters at the surface boundary layer height (100 m).
Parameter Unit Value U* m s-1 0.540 L m -56.796 ψh - 2.616 ψm - 0.069 rah s m-1 42.550
Tp (potential temperature) K 281.840
EARSeL eProceedings 8, 2/2009 145
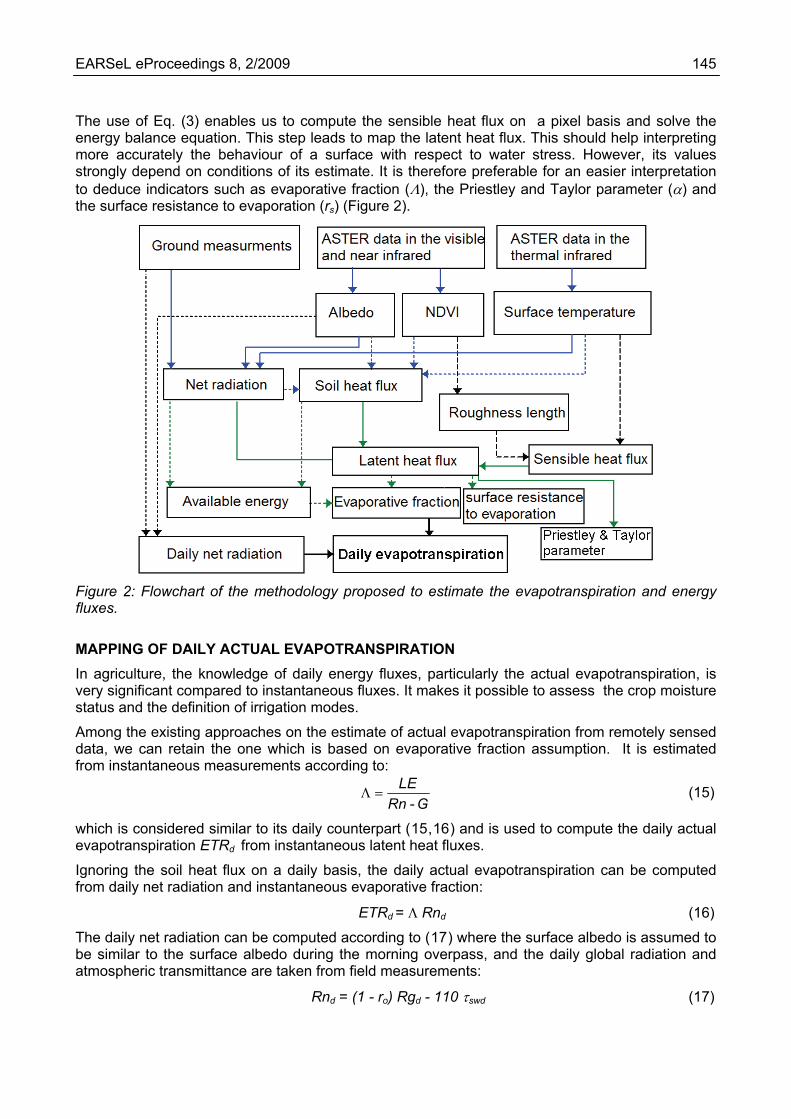
The use of Eq. (3) enables us to compute the sensible heat flux on a pixel basis and solve the energy balance equation. This step leads to map the latent heat flux. This should help interpreting more accurately the behaviour of a surface with respect to water stress. However, its values strongly depend on conditions of its estimate. It is therefore preferable for an easier interpretation to deduce indicators such as evaporative fraction (Λ), the Priestley and Taylor parameter (α) and the surface resistance to evaporation (rs) (Figure 2).
Figure 2: Flowchart of the methodology proposed to estimate the evapotranspiration and energy fluxes.
MAPPING OF DAILY ACTUAL EVAPOTRANSPIRATION In agriculture, the knowledge of daily energy fluxes, particularly the actual evapotranspiration, is very significant compared to instantaneous fluxes. It makes it possible to assess the crop moisture status and the definition of irrigation modes.
Among the existing approaches on the estimate of actual evapotranspiration from remotely sensed data, we can retain the one which is based on evaporative fraction assumption. It is estimated from instantaneous measurements according to:
-
LERn G
Λ = (15)
which is considered similar to its daily counterpart (15,16) and is used to compute the daily actual evapotranspiration ETRd from instantaneous latent heat fluxes.
Ignoring the soil heat flux on a daily basis, the daily actual evapotranspiration can be computed from daily net radiation and instantaneous evaporative fraction:
ETRd = Λ Rnd (16)
The daily net radiation can be computed according to (17) where the surface albedo is assumed to be similar to the surface albedo during the morning overpass, and the daily global radiation and atmospheric transmittance are taken from field measurements:
Rnd = (1 - ro) Rgd - 110 τswd (17)

EARSeL eProceedings 8, 2/2009 146
RESULTS AND DISCUSSION Through the SEBAL energy balance equation modelling, we showed that the surface parameters obtained from the satellite imagery namely the albedo, vegetation index and surface temperature make it possible to determine the latent heat flux as the residual term in the equations which con-nect these quantities.
The surface temperature is indirectly linked to the latent heat flux through the energy balance equation. On the image investigated in this study it varies between 295.4 and 308.8 K. The higher values correspond to areas where bare soil is dominant, while low values are associated with ar-eas where the vegetation cover is dense. Similarly, the average surface temperature on dry pixels is higher than that on wet pixels (Table 3).
The evaluation of rah without correction for atmosphere thermal stability can have values of latent heat flux roughly similar to those obtained by introducing the functions of stability correction for momentum and heat transport (Figure 3). It is therefore possible to simplify the approach proposed in SEBAL for calculating rah by ignoring the contribution of these two functions, but this hypothesis needs to be verified on other sites.
Note also on Table 3 that rah for dry pixels is low, causing the release of sensible heat to the at-mosphere. This is justified by high differences between surface and air temperatures. However, wet pixels present high values of rah because the net available energy (Rn - G) is mainly used in evapotranspiration.
As shown in Table 4, estimating the daily actual evapotranspiration fairly accurately represents the logic of evapotranspiration spatial variations without having to introduce a large number of input parameters not easily accessible to routine.
In Figure 4, the daily actual evapotranspiration varies from 0 to 5.13 mm with a clear dominance of surfaces with a more or less strong water deficit. Nevertheless, a good water status is represented only on a small area. The dominance of water deficit is clearly observed on frequency distributions of daily evapotranspiration and evaporative fractions (Figure 5).
Table 3: Instantaneous average values of parameters and surface fluxes above dry and wet pixels. Averages obtained by aggregating the dry and wet pixels. Dry pixels are identified in the image by analysing the relationship between albedo and surface temperature, while wet pixels are those with an albedo less than 0.1
Parameter Unit Dry pixels Wet pixels NDVI - 0.11 0.48
Albedo - 0.35 0.10 Emissivity - 0.95 0.98
Surface temperature K 305.6 296.4 Net radiation W m-2 281 477 Soil heat flux W m-2 49 42
Friction velocity m s-1 0.44 0.64 Monin-Oubukhov length M -62.37 -362.78
Surface resistance to evaporation s m-1 12.33 42.35 Sensible heat flux W m-2 232.31 3.4
Latent heat flux W m-2 0 431 Evaporative Fraction - 0 0.98
Near-surface air temperature difference °C 7.25 0.48

EARSeL eProceedings 8, 2/2009 147
Figure 3: Comparison between corrected and uncorrected latent heat flux for atmosphere thermal stability.
Table 4: Variation of daily actual evapotranspiration and moisture indicators with land use.
Land use units ETRd (mm)
Λ (-)
rs
(s m-1) α (-)
Bare soil, fallow and rangelands 0.54 0.11 323.7 0.17 Sparse vegetation cover 0.86 0.17 285.4 0.27 Moderate vegetation cover 1.62 0.31 217.4 0.49 Dense vegetation cover 2.17 0.45 148.1 0.71
The confrontation of actual daily evapotranspiration values obtained with SEBAL and those with the Priestley and Taylor method (18) shows a good agreement (Figure 6), which justifies the valid-ity of the used approach.
Indeed, actual evapotranspiration values estimated in this way are to be treated with caution and only have a relative value, because there is no validation method as wide at time and space scales.
One way may be seen by considering two climatic data: the instantaneous wind speed and daily pan evaporation. The wind speed measured at the moment of satellite overpass (8 m s-1) does not differ much from the average wind speed simulated on the selected site with logarithmic profiles (7.1 m s-1). The used approach gave a maximum value of daily evapotranspiration, equal to 5.13 mm (corresponding to the surface resistance to evaporation value of 23.2 s m-1), which is slightly less than the daily pan evaporation (6.04 mm) corresponding to a surface resistance to evaporation almost zero.
Another possibility to validate our results is to compare the ground latent heat flux values based on the Bowen ratio with those estimated on the image by SEBAL. The result of this comparison be-tween these two sets of values shows a sufficient correlation (Figure 7).
An analysis of the surface resistance to evaporation frequency distribution is considered to be an-other way to validate our results. They showed that for most crops covering entirely the soil, these resistance values vary between 10 and 400 s m-1 , generally peaking around 80 s m-1 (19). The result shown in Figure 8 is approximately consistent with this indication.

EARSeL eProceedings 8, 2/2009 148
Figure 4: Daily actual evapotranspiration map.
Figure 5: Frequency distribution of daily evapotranspiration (a) and evaporative fraction (b).

EARSeL eProceedings 8, 2/2009 149
Figure 6: Comparison between SEBAL and Priestley & Taylor evapotranspirations.
Figure 7: Comparison between the ground latent heat flux values based on the Bowen ratio and those estimated on the image by SEBAL.
Figure 8: Frequency distribution of the surface resistance to evaporation for pixels with NDVI more than 0.6.

EARSeL eProceedings 8, 2/2009 150
CONCLUSIONS Recent developments in remote sensing techniques have resulted in many new applications. One of these applications is to study the interactions between land surface and atmosphere at a re-gional scale.
The remote sensing radiances in the visible, near infrared and thermal infrared ranges can be used to determine albedo, vegetation index and surface temperature. These parameters by incorporat-ing in various models can be used to estimate evapotranspiration and surface energy fluxes.
The aim of this study was to map evapotranspiration from Landsat-7 ETM+ data using SEBAL model.
The results outlined above confirm the opportunities presented by ASTER satellite data to solve the equation of energy balance, assess the water stress degree and clearly differentiate the par-cels subject to different water systems. However, the evapotranspiration and surface energy fluxes estimates cannot be regarded as very accurate compared to data points. We noted in this part a significant discrepancy between remote sensing and ground estimates of latent heat flux, with a RMSE about 51 W m-2, that was ascribed to inaccuracies on the intermediate variables such as surface emissivity, soil heat flux, roughness length and air temperature.
Despite these inaccuracies, the used approach is quite suitable for a real exploitation of satellite data to estimate a number of parameters at the soil-plant-atmosphere interface. These parameters have the advantage of being spatialised and offer a spatiotemporal coverage more satisfactory than the data points measured operationally. However, they pose a problem to be indirect and need to use radiative transfer models within the atmosphere and at the surface for their interpreta-tion in terms of physical parameters.
ACKNOWLEDGEMENTS This study is supported by the research contract CNEPRU: D2901/51/05. The authors would like to express their thanks to Lahouari Bounoua for his valuable contribution to achieve this study.
REFERENCES 1 Balaji N & S Raghavan, 2000. Determination of regional scale evapotranspiration of Texas
from NOAA-AVHRR satellite. Report, Texas Water Resources Institute, Texas, 15 pp. http://water.usgs.gov/wrri/01grants/prog-compl-reports/2001TX3221B.pdf (last date accessed: 09.11.2009)
2 Courault D, B Seguin & A Olioso, 2005. Review on estimation of evapotranspiration from re-mote sensing data: From empirical to numerical modelling approaches. Irrigation and Drainage Systems, 19: 223-249
3 Seguin B & B Itier, 1983. Using midday surface temperature to estimate daily evaporation from satellite IR data. International Journal of Remote Sensing, 4: 371-383
4 Lagouarde J P, 1991. Use of NOAA-AVHRR data combined with an agrometeorological model for evaporation mapping. International Journal of Remote Sensing, 12: 1853-1864
5 Vidal A, Y Kerr, J P Lagouarde & B Seguin, 1987. Télédétection et bilan hydrique : utilisation combinée d’un modèle agrométéorologique et des données thermique du satellite NOAA-AVHRR. Agricultural and Forest Meteorology, 39: 155-175
6 Taconet O, R Bernard & D Vidal-Madjar, 1986. Evpotranspiration over agricultural region using surface flux/temperature model based on NOAA-AVHRR data. Journal of Climate and Applied Meteorology, 25: 284-307
EARSeL eProceedings 8, 2/2009 151
7 Jacob F, 1999. Utilisation de la télédétection courtes longueurs d’onde et infrarouge thermique
à haute résolution spatiale pour l’estimation des flux d’énergie à l’échelle de la parcelle agrico-le. Thèse de Doctorat, Université de Toulouse III, 1999, 268 pp. http://gershwin.ens.fr/great/these_Jacob_1999.pdf (last date accessed: 09.11.2009)
8 Bastiaanssen W G M, M Menenti, R A Feddes & A A M Holtslag, 1998. Remote sensing surface energy balance algorithm for land (SEBAL): 1. Formulation. Journal of Hydrology, 213: 198-212
9 Paulson C A, 1970. The mathematical representation of wind speed and temperature profiles in the unstable atmospherique surface layer. Journal of Applied Meteorology, 9: 857-861
10 Gillepsie A, S Rokugawa, T Matsunaga, J S Cothern, S Hook & A B Kahle, 1998. A tempera-ture and emissivity separation algorithm for advanced spaceborne thermal emission and re-flection radiometer (ASTER) images. IEEE Transactions on Geoscience and Remote Sensing, 36: 1113-1126
11 Brutsaert W, 1975. On a derivable formula for longwave radiation from clear skies. Water Re-sources Research, 11: 742-744
12 Allen R G, L S Periera, D Raes & M Smith, 1998. Crop evapotranspiration: guidelines for com-puting crop water requirements. FAO Irrigation and drainage 56, FAO - Food and Agriculture Organization of the United Nations, Rome, 1998, 290 pp. http://www.fao.org/docrep/X0490E/X0490E00.htm (last date accessed: 09.11.2009)
13 Hamimed A, K Mederbal & A Khaldi, 2001. Utilisation des données satellitaires TM de Landsat pour le suivi de l’état hydrique d’un couvet végétal dans les conditions semi-arides en Algérie. Télédétection, 2: 29-38
14 Bastiaanssen W G M, 2000. SEBAL-based sensible and latent heat fluxes in the irrigated Ge-diz basin, Turkey. Journal of Hydrology, 229: 87-100
15 Tasumi M & R G Allen, 2000. Application of the SEBAL methodology for estimating consumptive use of water and stream flow depletion in the Bear River Basin of Idaho through Remote Sensing. Final Report, The Raytheon Systems 10 Company EOSDIS Project, 107 pp.
16 Kustas W P, E M Perry, P C Doraiswamy & M S Moran, 1994. Using satellite remote sensing to extrapolate evapotranspiration estimates in time and space over a semiarid rangeland ba-sin. Remote Sensing of Environment, 49: 275-286
17 De Bruin H A R & A A M Holtslag, 1982. A simple parameterization of the surface fluxes of sensible and latent heat during daytime compared with the Penman–Monteith concept. Journal of Applied Meteorology, 21: 1610-1621
18 Jiang L & S Islam, 2001. Estimation of surface evaporation map over southern Great Plains using remote sensing data. Water Ressource Research, 37(2): 329-340
19 Bastiaanssen W G M, T Van Der Wall & T N M Visser, 1996. Diagnosis of regional evapora-tion by remote sensing to support irrigation performance assessment. Irrigation and Drainage Systems, 10: 1-23