Embed Size (px)
Citation preview
Estimation of Actual Evapotranspiration
at Regional–Annual scale using SWAT
Azizallah Izady
Ph.D student of Water Resources Engineering
Department of Water Engineering, Faculty of Agriculture,
Ferdowsi University of Mashhad, Mashhad, Iran

Overview
Introduction
Material and Methods
Study Area
Data
Model Structure
Results and Discussion
Conclusion
2
3
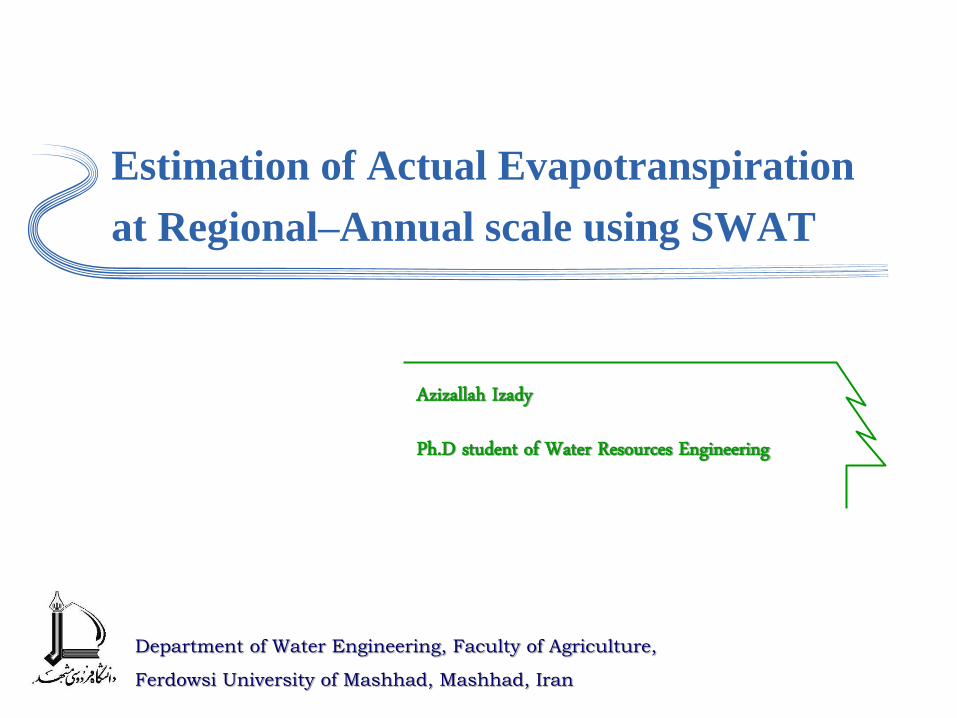
Much research and many studies require a
knowledge of ET.
The main methods (e.g. lysimeter, Bowen
ratio, …) have been conventionally used to
measure ET at field or landscape scales; but
regional ET cannot be measured directly.
Introduction
Introduction
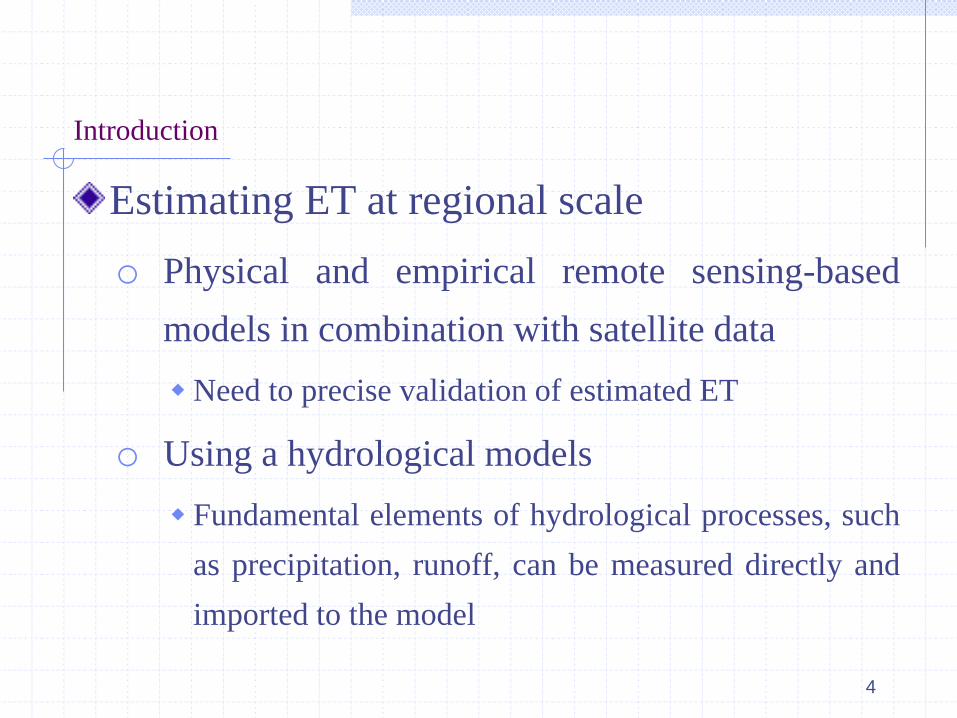
Estimating ET at regional scale
o Physical and empirical remote sensing-based
models in combination with satellite data
Need to precise validation of estimated ET
o Using a hydrological models
Fundamental elements of hydrological processes, such
as precipitation, runoff, can be measured directly and
imported to the model
4
Introduction
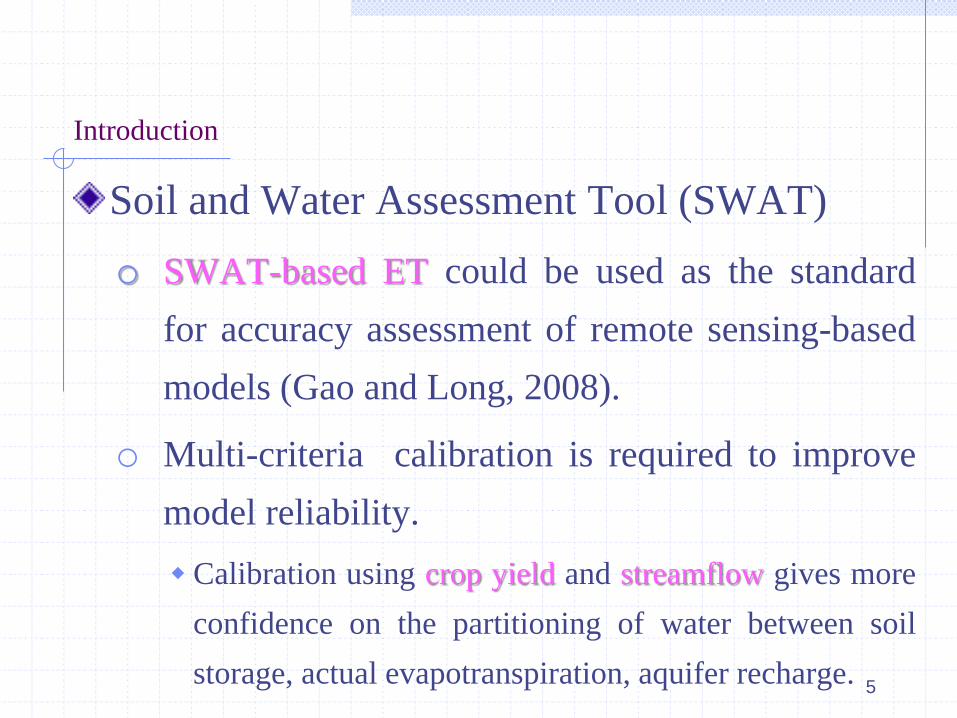
Soil and Water Assessment Tool (SWAT)
o SWAT-based ET could be used as the standard
for accuracy assessment of remote sensing-based
models (Gao and Long, 2008).
o Multi-criteria calibration is required to improve
model reliability.
Calibration using crop yield and streamflow gives more
confidence on the partitioning of water between soil
storage, actual evapotranspiration, aquifer recharge. 5
Introduction
The main objective of this study
o Estimate actual ET (AET) using multi-criteria
calibrated SWAT model in the Neishaboor
watershed, Iran.
6
7
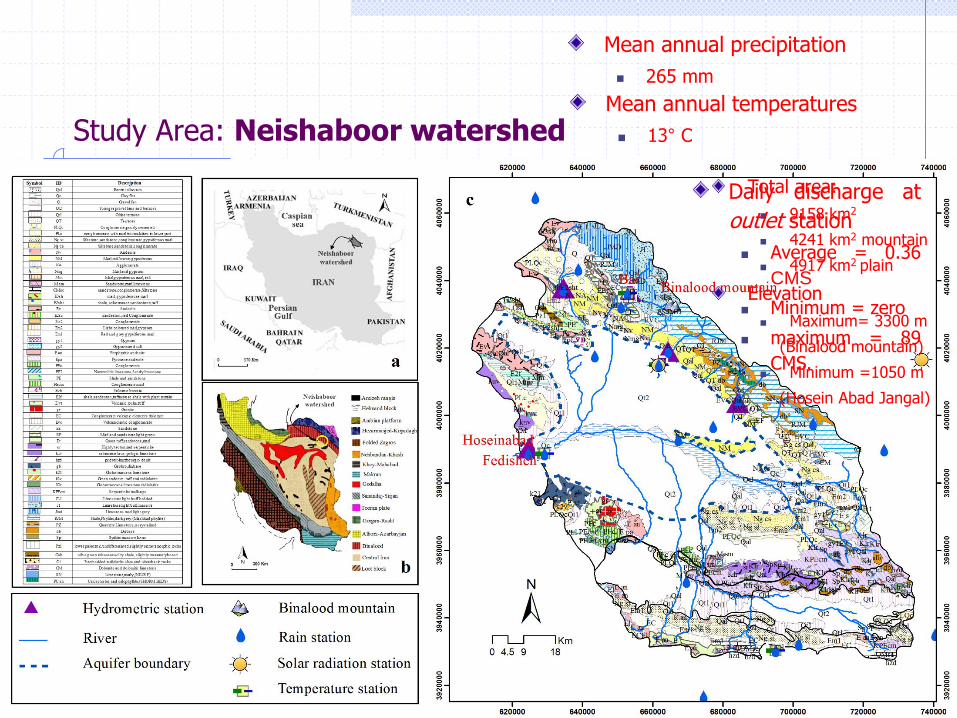
Study Area: Neishaboor watershed
Total area:
9158 km2
4241 km2 mountain
4917 km2 plain
Elevation
Maximum= 3300 m
(Binalood mountain)
Minimum =1050 m
(Hosein Abad Jangal)
Daily discharge at
outlet station
Average = 0.36
CMS
Minimum = zero
maximum = 89
CMS.
Mean annual precipitation
265 mm
Mean annual temperatures
13° C
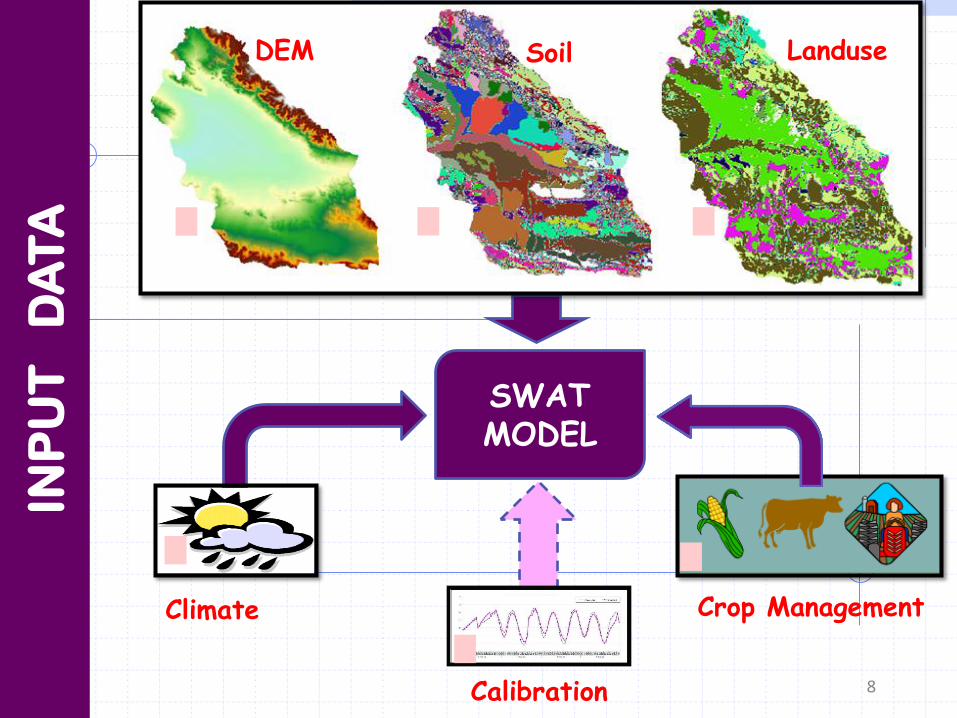
Climate Crop Management
SWAT MODEL
INP
UT
D
AT
A
DEM Soil Landuse
8 Calibration
9
10
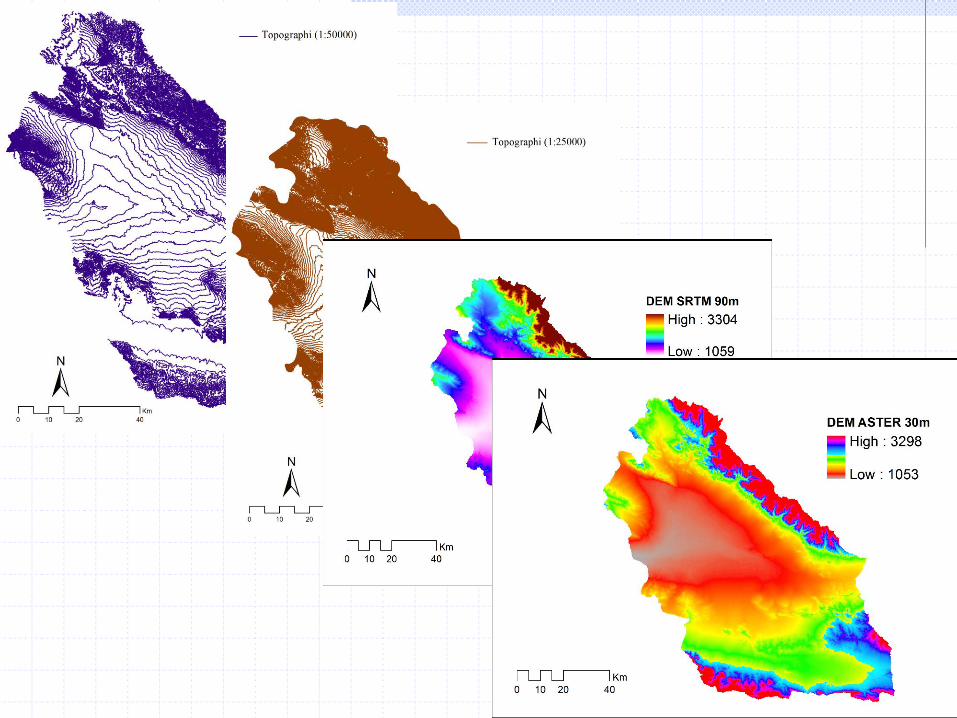
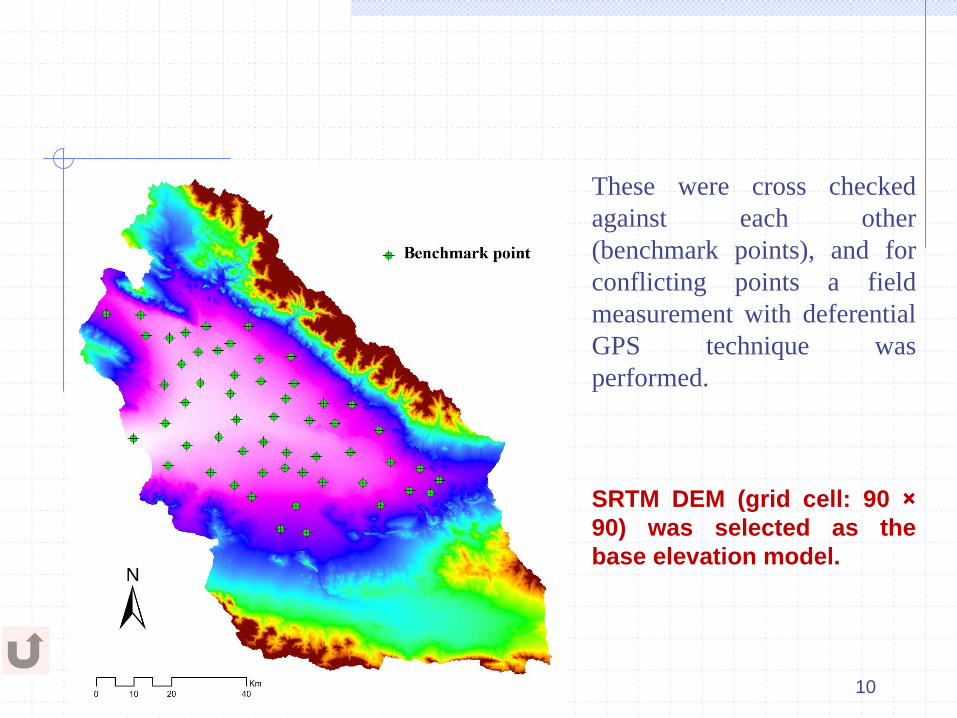
These were cross checked
against each other
(benchmark points), and for
conflicting points a field
measurement with deferential
GPS technique was
performed.
SRTM DEM (grid cell: 90 ×
90) was selected as the
base elevation model.
11
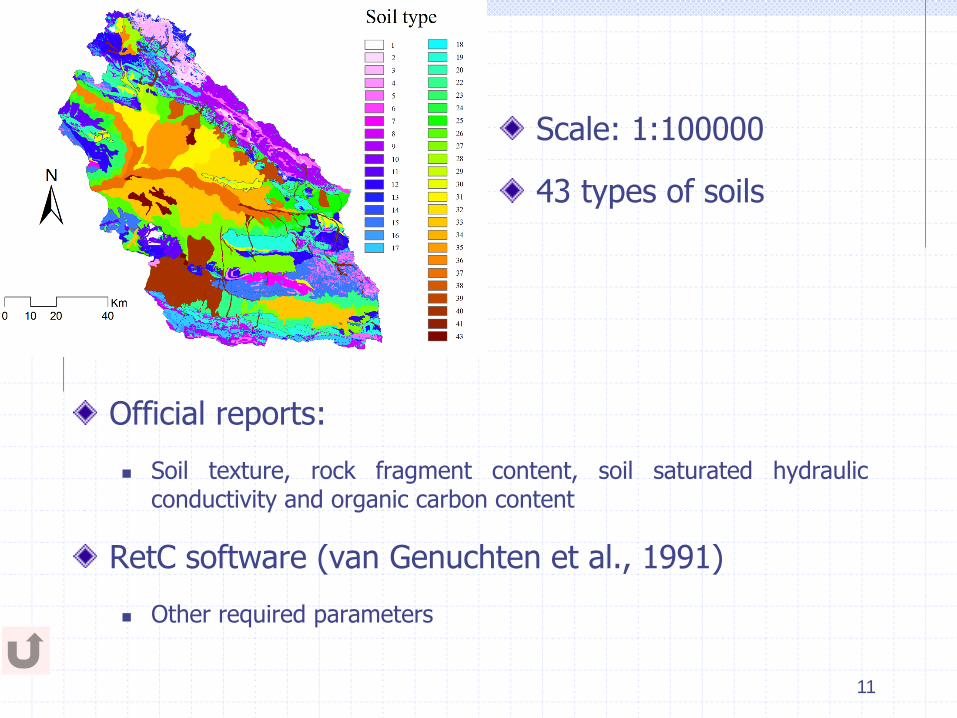
Official reports:
Soil texture, rock fragment content, soil saturated hydraulic conductivity and organic carbon content
RetC software (van Genuchten et al., 1991)
Other required parameters
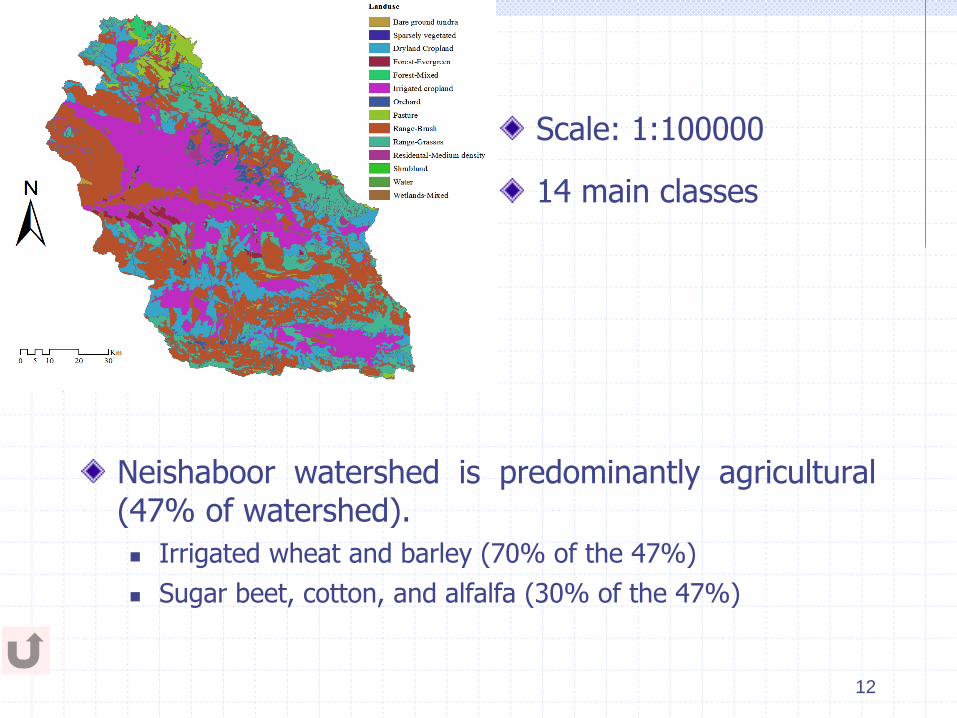
Scale: 1:100000
43 types of soils
12
Neishaboor watershed is predominantly agricultural (47% of watershed).
Irrigated wheat and barley (70% of the 47%)
Sugar beet, cotton, and alfalfa (30% of the 47%)
Scale: 1:100000
14 main classes
13
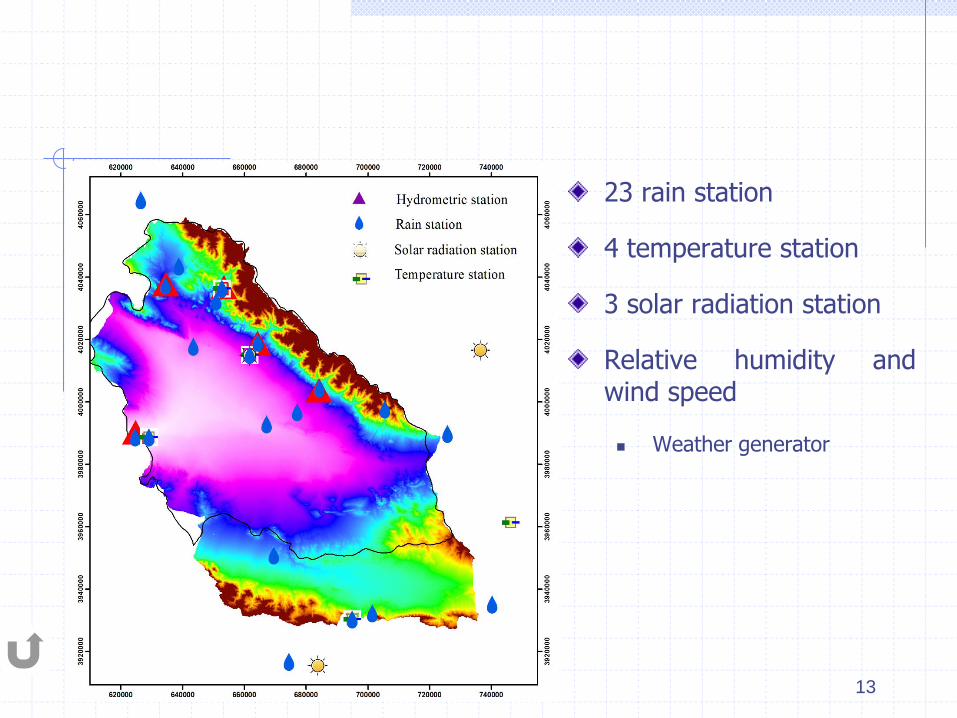
23 rain station
4 temperature station
3 solar radiation station
Relative humidity and wind speed
Weather generator
14
Neishaboor watershed is an agriculture-based watershed.
The processes affecting the water balance in an agricultural watershed are highly influenced by crop management.
Irrigated and rainfed wheat crops were
considered.
15
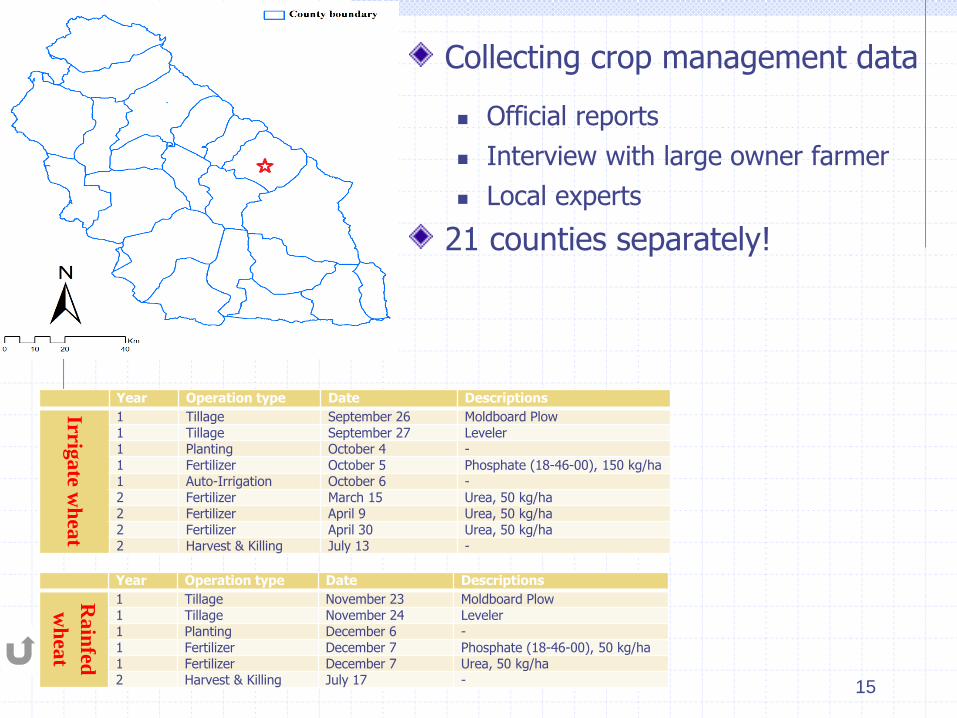
Collecting crop management data
Official reports
Interview with large owner farmer
Local experts
21 counties separately!
Year Operation type Date Descriptions
Irrig
ate w
hea
t
1 Tillage September 26 Moldboard Plow 1 Tillage September 27 Leveler 1 Planting October 4 - 1 Fertilizer October 5 Phosphate (18-46-00), 150 kg/ha 1 Auto-Irrigation October 6 - 2 Fertilizer March 15 Urea, 50 kg/ha 2 Fertilizer April 9 Urea, 50 kg/ha 2 Fertilizer April 30 Urea, 50 kg/ha 2 Harvest & Killing July 13 -
Year Operation type Date Descriptions
Rain
fed
wh
eat
1 Tillage November 23 Moldboard Plow 1 Tillage November 24 Leveler 1 Planting December 6 - 1 Fertilizer December 7 Phosphate (18-46-00), 50 kg/ha 1 Fertilizer December 7 Urea, 50 kg/ha 2 Harvest & Killing July 17 -
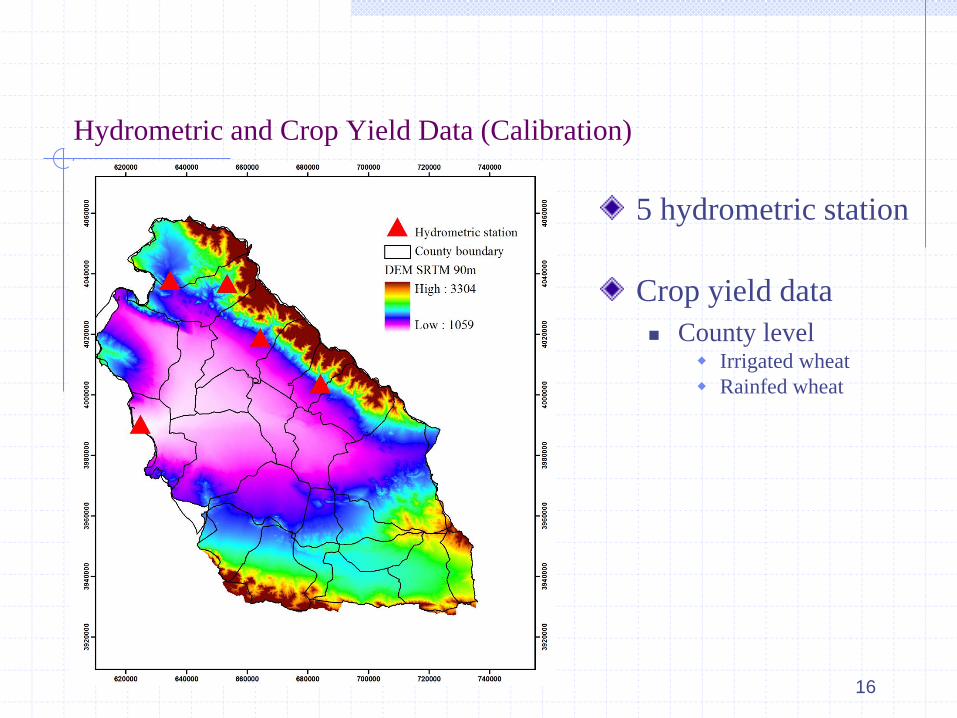
Hydrometric and Crop Yield Data (Calibration)
5 hydrometric station
Crop yield data
County level Irrigated wheat
Rainfed wheat
16
Model Structure:
The simulation period: 1997–2010;
o The first 3 years were used as warm-up period.
Precipitation lapse rate:160 mm/km
Temperature lapse rate: 6 ºC/km
Five elevation bands
Solar radiation
o Angstrom-Prescott equation
Calculating ETp
o The Hargreaves method.
Automatic irrigation
o Difficult to know when and how much the farmers apply irrigation
17
Model Structure:
Neishaboor watershed was subdivided into 248
subbasins.
Delineate with smallest possible threshold area (0.008%)
Remove all generated outlets
Assign new outlets regard to:
Mountain-plain boundary
Horticultural and agricultural farms border (landuse map)
County boundaries
Hydrometric station location
Subbasins area should be less than 1% of the watershed area
18
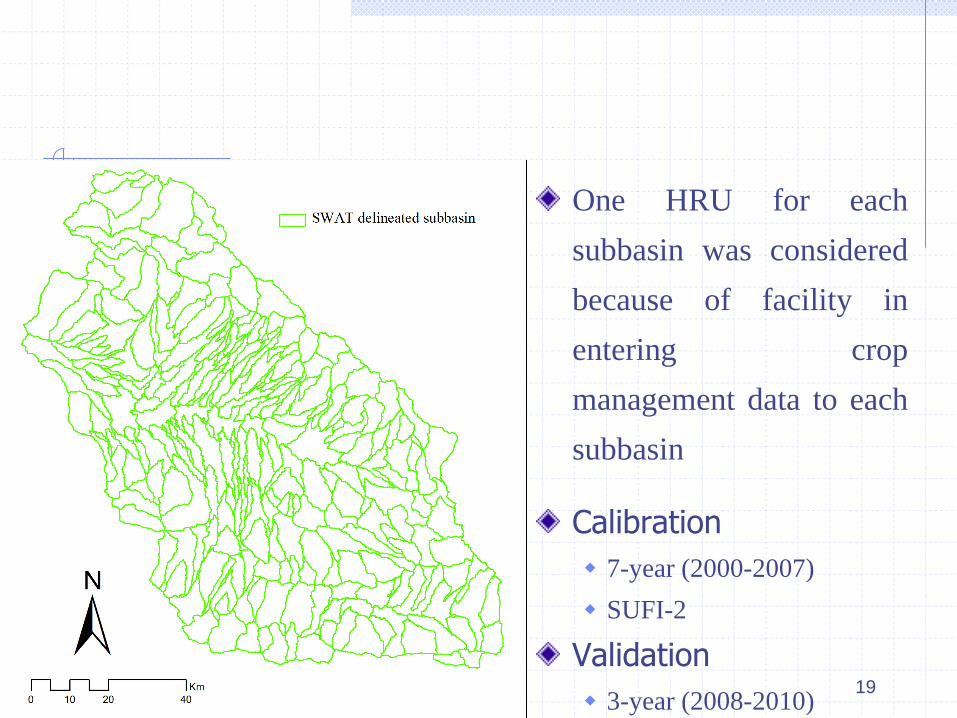
One HRU for each
subbasin was considered
because of facility in
entering crop
management data to each
subbasin
Calibration
7-year (2000-2007)
SUFI-2
Validation
3-year (2008-2010)
19

20
Result & Discussion
21
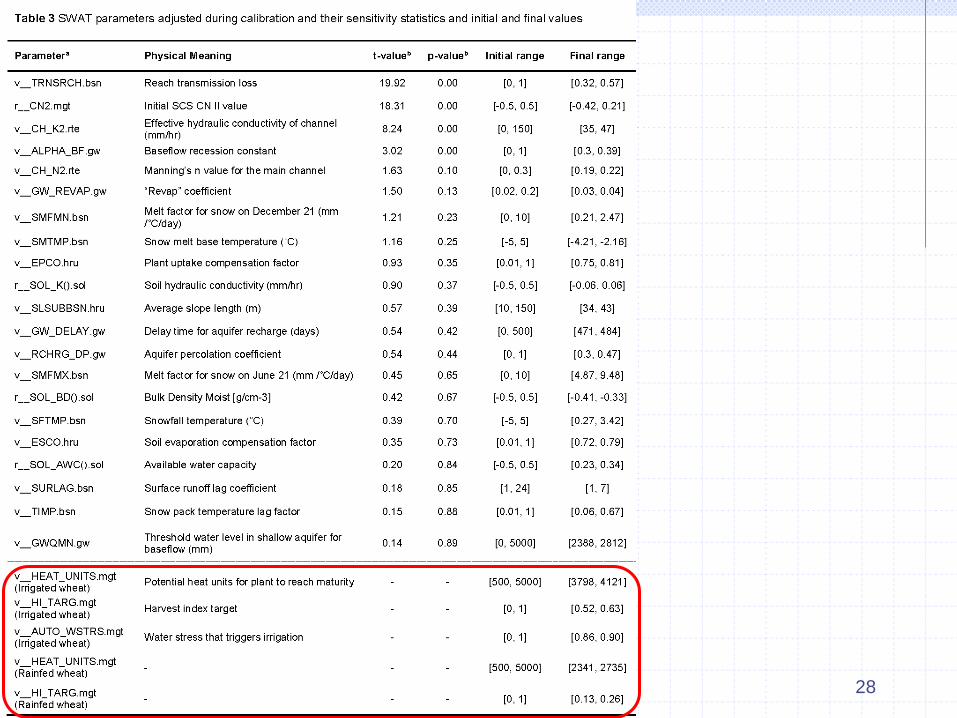
Sensitivity analysis
21 global parameters of hydrology were sensitive to river
discharge
All crop parameters also were sensitive to crop yield
22
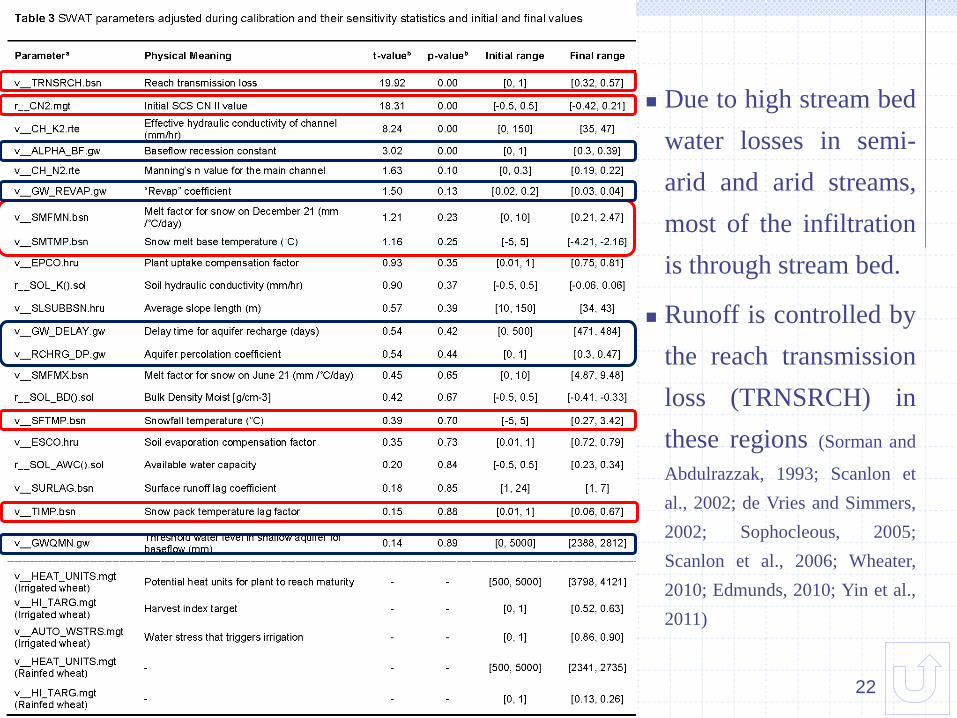
Due to high stream bed
water losses in semi-
arid and arid streams,
most of the infiltration
is through stream bed.
Runoff is controlled by
the reach transmission
loss (TRNSRCH) in
these regions (Sorman and
Abdulrazzak, 1993; Scanlon et
al., 2002; de Vries and Simmers,
2002; Sophocleous, 2005;
Scanlon et al., 2006; Wheater,
2010; Edmunds, 2010; Yin et al.,
2011)
23
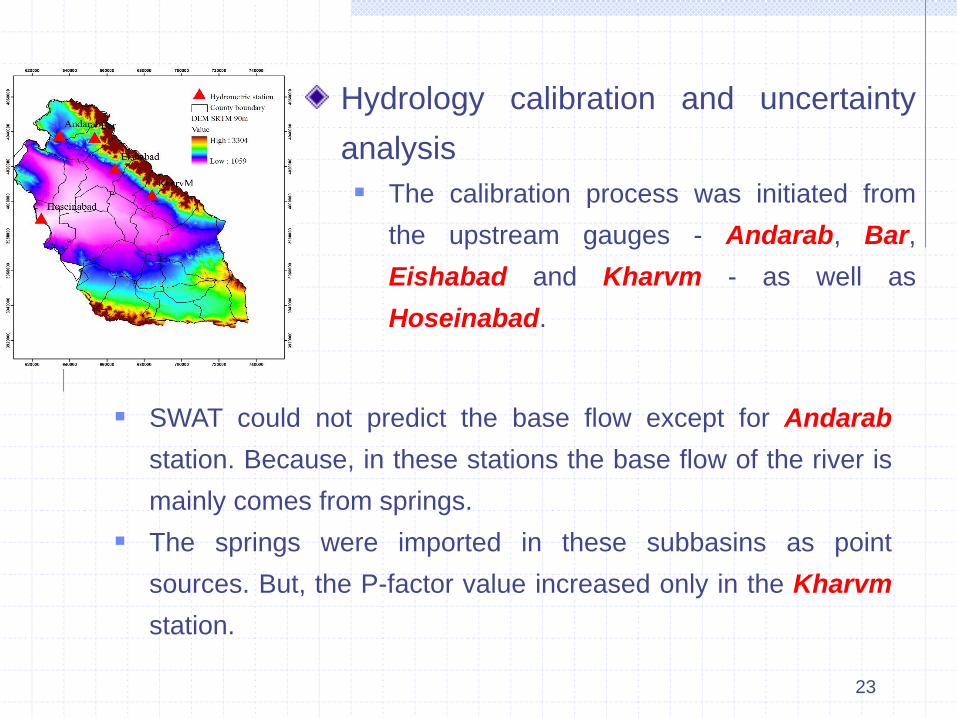
Hydrology calibration and uncertainty
analysis
The calibration process was initiated from
the upstream gauges - Andarab, Bar,
Eishabad and Kharvm - as well as
Hoseinabad.
SWAT could not predict the base flow except for Andarab
station. Because, in these stations the base flow of the river is
mainly comes from springs.
The springs were imported in these subbasins as point
sources. But, the P-factor value increased only in the Kharvm
station.
24
Inappropriate results in the Bar and Eishabad
hydrometric stations:
Severe elevation variability of these subbasins.
Unaccounted human activities affecting natural
hydrology during the period of study.
Snow parameters are not spatially defined.
Shortcomings of the SCS method
• It cannot simulate runoff from melting snow and on frozen
ground
• It does not consider the duration and intensity of precipitation
Eishabas and Bar station was removed from calibration period.
25
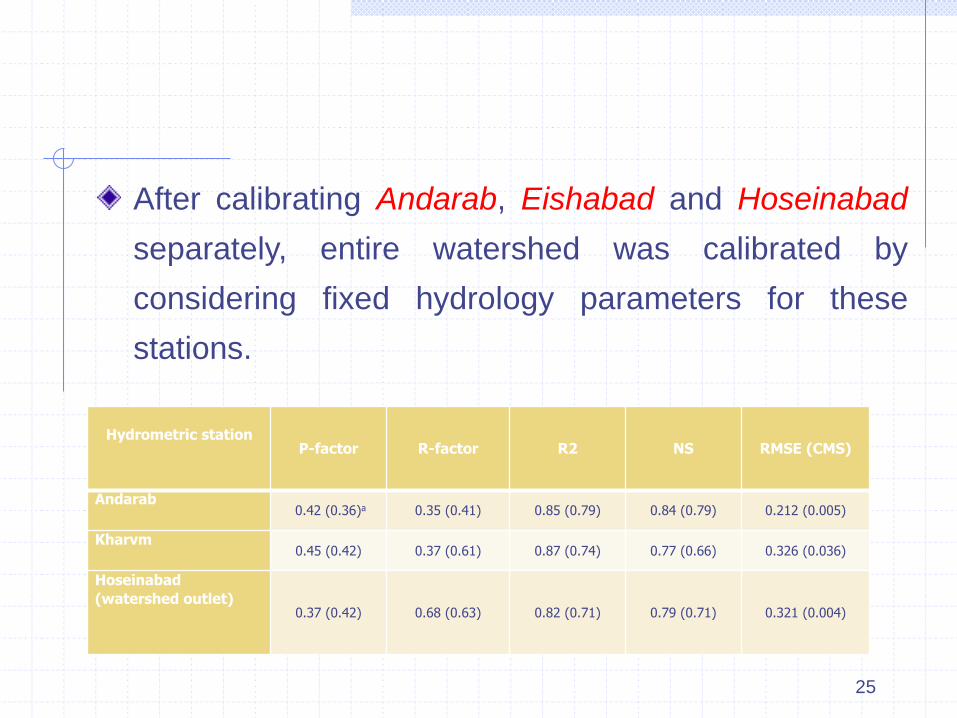
After calibrating Andarab, Eishabad and Hoseinabad
separately, entire watershed was calibrated by
considering fixed hydrology parameters for these
stations.
Hydrometric station P-factor R-factor R2 NS RMSE (CMS)
Andarab 0.42 (0.36)a 0.35 (0.41) 0.85 (0.79) 0.84 (0.79) 0.212 (0.005)
Kharvm 0.45 (0.42) 0.37 (0.61) 0.87 (0.74) 0.77 (0.66) 0.326 (0.036)
Hoseinabad
(watershed outlet) 0.37 (0.42) 0.68 (0.63) 0.82 (0.71) 0.79 (0.71) 0.321 (0.004)
26
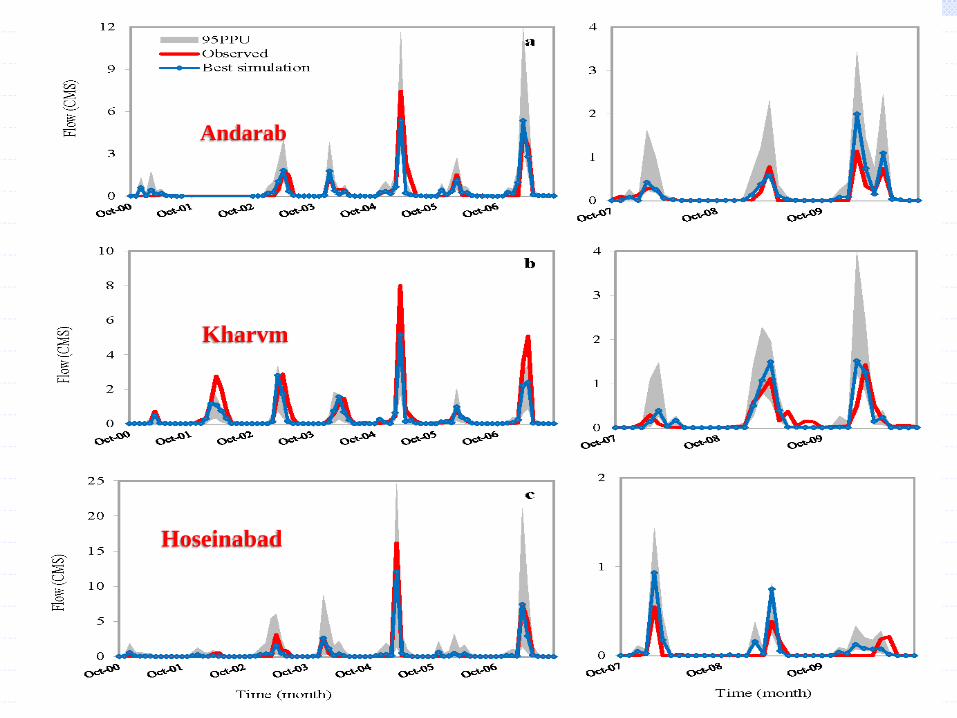
Andarab
Kharvm
Hoseinabad
27
Crop yield calibration and uncertainty analysis
Calibration of a large-scale distributed hydrologic
model – 9159 km2 - against streamflow alone may
not provide sufficient confidence for all components of
the surface water balance.
Crop yield is considered as an additional target
variable in the calibration process.
28
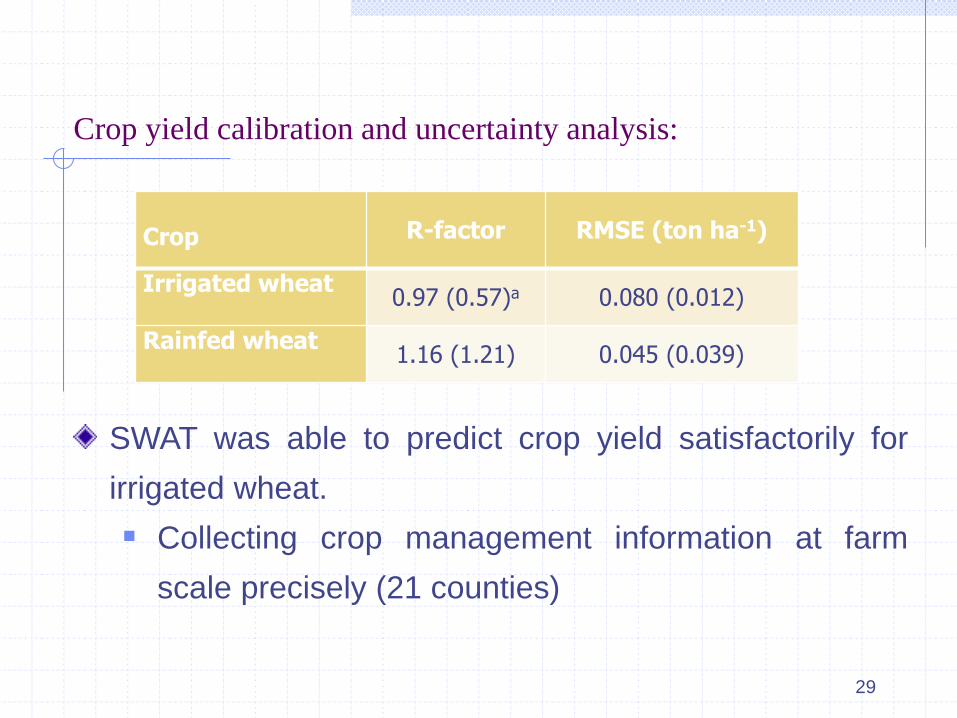
Crop yield calibration and uncertainty analysis:
29
Crop R-factor RMSE (ton ha-1)
Irrigated wheat 0.97 (0.57)a 0.080 (0.012)
Rainfed wheat 1.16 (1.21) 0.045 (0.039)
SWAT was able to predict crop yield satisfactorily for
irrigated wheat.
Collecting crop management information at farm
scale precisely (21 counties)
30
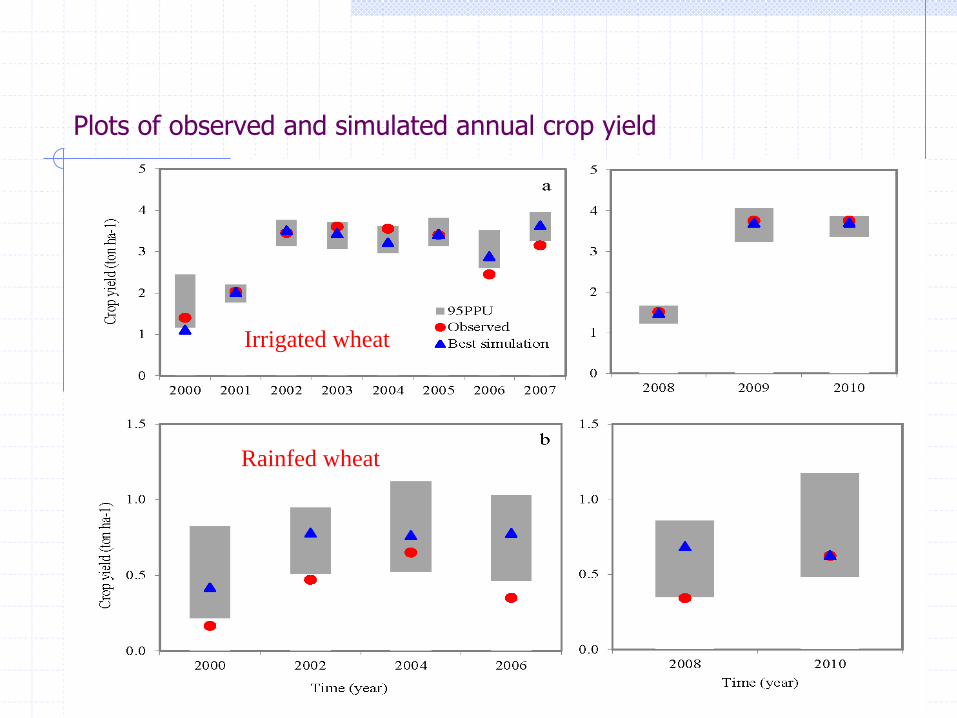
Irrigated wheat
Rainfed wheat
Plots of observed and simulated annual crop yield
Estimation and analysis of actual evapotranspiration
31
The results showed that SWAT provided satisfactory
predictions on hydrologic budget and crop yield.
Hence, the multi-criteria calibrated model was then
used to estimate and analyze the actual
evapotranspiration at regional-annual scale.
32
0
100
200
300
400
mm
Time (year)
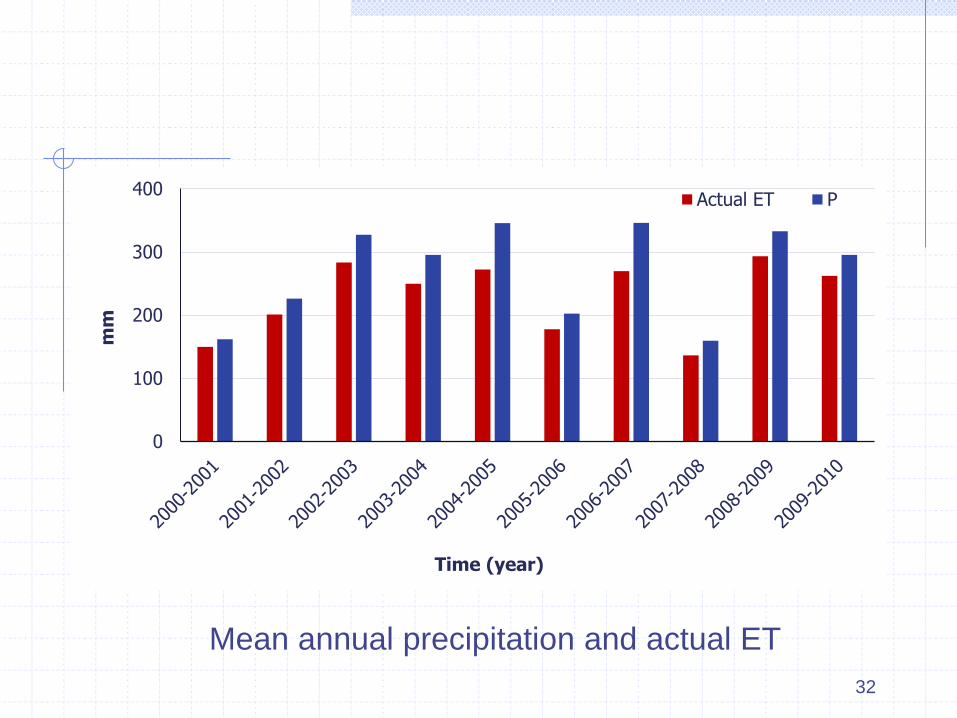
Actual ET P
Mean annual precipitation and actual ET
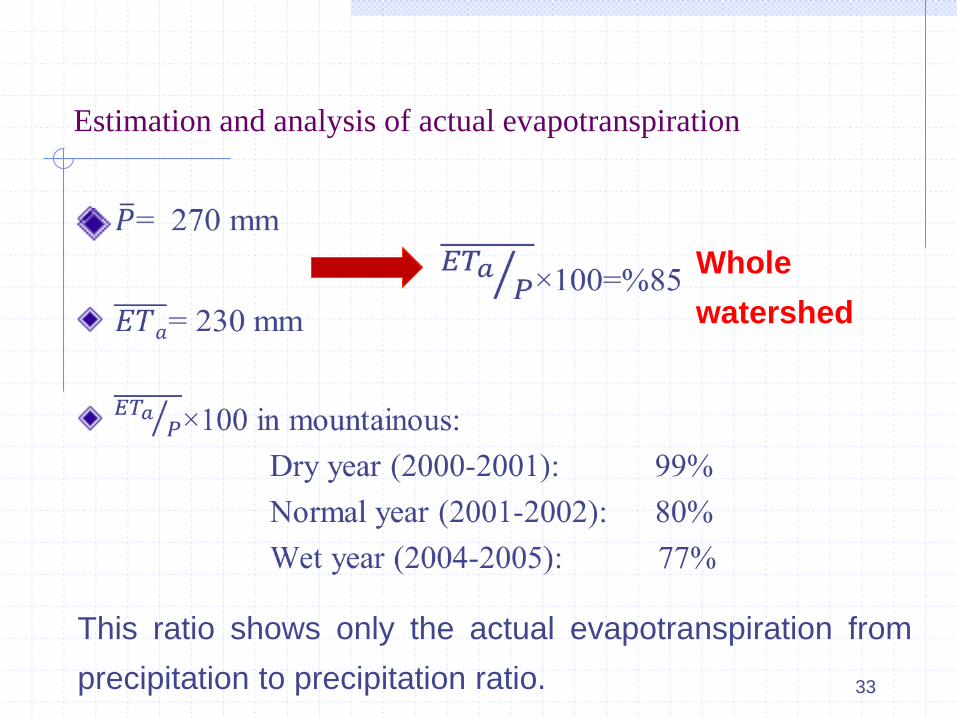
Estimation and analysis of actual evapotranspiration
33
This ratio shows only the actual evapotranspiration from
precipitation to precipitation ratio.
Whole
watershed
Estimation and analysis of actual evapotranspiration
34
Groundwater is another source of water supply for
irrigation purpose in the plain as well as precipitation.
This source effects the actual ET considerably.
Therefore, this ratio shows the total actual
evapotranspiration (precipitation and irrigation) to
precipitation ratio.
Estimation of this ratio is not as simple as mountainous
part of watershed due to uncertainties in the crop
pattern data and their water requirements.

35
Conclusion
SWAT provided satisfactory predictions on
hydrologic budget and crop yield.
This study could be used to evaluate the
estimated actual ET using RS.
To enhance the performance of the model,
crop management parameters of other major
crops such as sugar-beat, cotton and alfalfa is
necessary.
36

37
Thank you for your attention