Embed Size (px)
Citation preview

www.amis-outlook.orgAMIS
RESEARC
H P
APER NO. 3(c)
www.amis-outlook.org
FEED USE ESTIMATION:DATA, METHODOLOGIES AND GAPS - THE CASE OF THE PHILIPPINESSEPTEMBER 2014
Agricultural Market Information System
AMIS

This study was prepared for the Agricultural Market Information System of the
G20 (AMIS) by Jaime Abella Sison. Any views expressed in this paper are those
of the author and do not necessarily represent those of AMIS, its Secretariat
or participating countries. The designations employed and the presentation
of materials in this information product do not imply the expression of any
opinion whatsoever on the part of AMIS, its Secretariat or participating
countries concerning the legal or development status of any country, territory,
city or area of its authorities, or concerning the delamination of its frontiers
or boundaries.

2
Table of Contents
List of Acronyms .......................................................................................................................................... 3
Executive summary ....................................................................................................................................... 5
1. Introduction ............................................................................................................................................... 7
2. Agricultural statistical system ................................................................................................................... 8
2.1 The official statistical system .............................................................................................................. 8
2.2 Non-official statistical work.............................................................................................................. 13
2.3 Available statistics and sources......................................................................................................... 14
2.4 Methodological issues in estimating feed grains .............................................................................. 17
3 Growth and structural change in livestock and aquaculture production .................................................. 18
3.1 Growth of livestock production ........................................................................................................ 18
3.2 Structural changes in the livestock sector ......................................................................................... 21
3.3 Growth and structural changes of aquaculture production ............................................................... 26
3.4 Feeding efficiency ............................................................................................................................. 27
4 Growth and structural changes in feed sector .......................................................................................... 28
4.1 Available feed resources ................................................................................................................... 28
4.2 Growth and structural changes in domestic grain production ........................................................... 29
4.3 Development of feed industry ........................................................................................................... 32
5 Conclusion and recommendations ........................................................................................................... 37
References ................................................................................................................................................... 40
Annex A: List of Associations/Organizations Interviewed ........................................................................ 42

3
List of Acronyms
ADB Asian Development Bank
AFMA Agriculture and Fisheries Modernization Act
AFSD Animal Feeds Standard Division
AFSIS ASEAN Food Security Information System
AgSTAT Agricultural Statistical System
APAFMI Association of Philippine Aqua Feed Millers, Inc.
ASDP Agricultural Statistical Development Program
ASA American Soybean Association
ASEAN Association of South East Asian Nations
BAEcon Bureau of Agricultural Economics
BAI Bureau of Animal Industry
BAR Bureau of Agricultural Research
BFAR Bureau of Fisheries and Aquatic Resources
BIR Bureau of Internal Revenue
BLPS Backyard Livestock and Poultry Survey
BOC Bureau of Customs
CLPS Commercial Livestock and Poultry Survey
CPS Corn Production Survey
CrPS Crops Production Survey
DA Department of Agriculture
DTI Department of Trade and Industry
ECC Environmental Compliance Certificates
FAO Food and Agriculture Organization
IAS AFS Inter-Agency Committee on Agriculture and Fishery Statistics
IAS Integrated Agricultural Survey
LGUs Local Government Units
NAFC National Agricultural and Fishery Council
NDA National Dairy Authority
NFEPP National Federation of Egg Producers of the Philippines/Egg Board
NFHFI National Federation of Hog Farmers, Inc.
NFIS National Fishery and Information Service
NIN National Information Netwok
NMIS National Meat Inspection Service
NSO National Statistics Office
NSCB National Statistical Coordination Board
PABI Philippine Association of Broiler Integrators
PAFMI Philippine Association of Feed Millers, Inc.
PAHRI Philippine Association of Hog Raisers, Inc.

4
PASO Provincial Agricultural Statistics Officer
PCA Philippine Coconut Authority
PCC Philippine Carabao Center
PDC Philippine Dairy Corporation
PFDA Philippine Fishery Development Authority
PHILSAN Philippine Society of Animal Nutritionists
ProPork Pork Producers Federation of the Philippines, Inc.
PSAS Philippine Society of Animal Science
PSA Philippine Statistical Association
PSA-BAS Philippines Statistics Authority-Bureau of Agricultural Statistics
PSPA Philippine Swine Producers Association (PSPA)
PVMA Philippine Veterinary Medical Association
PVDA Philippine Veterinary Drug Association
RCPS Rice and Corn Production Survey
TWG Technical Working Group
UBRA United Broiler Raisers Association
UPLB University of the Philippines at Los Baños
USAID United States Agency for International Development
USDA United States Department of Agriculture
USFGC United States Feed Grains Council

5
Executive summary
It is a fact that the increasing demand for food to feed the world’s burgeoning human population
(7 billion people) is relentless and the improved affluence being enjoyed by an increasing
number of people results in higher demand for animal products: meat, eggs and milk.
By 2050, most of the world’s population 10 billion or so inhabitants will be living in towns and
cities. Feeding these people will require a 70-100 percent increase in the amount of food
produced today (Burney et al, 2010). It will also require an estimated additional 1,305 million
tonnes of grain, of which 40 percent would be used for feeding livestock. A major contributory
factor to this extra demand is expected to be substantial increases in poultry and pig meat
production (FAO, 2013).
Accurate assessments of current and future supplies and demands for livestock feed are needed
as input into national food security policies, as well as national livestock strategies which
balance national food requirements with investments into environmentally sustainable livestock
and feed systems. The general objective of this study is to: 1) assess current patterns of feed
consumption in the Philippines, especially grain-use in livestock feed; and, 2) review the
methodologies for their calculation.
Demand for feed crops like yellow corn, rice, wheat, and soybean will undoubtedly expand in the
coming decade in the Philippines. As elsewhere, growth in the demand for those feed crops
hinges on the rise in demand for meat, poultry, milk, eggs, etc, a trend which is catalyzed by
rapid urbanization, rising incomes and changes in consumer tastes and preferences.
The Philippines Statistics Authority and the Bureau of Agricultural Statistics (PSA-BAS)
maintains a very comprehensive database of agricultural statistics. Similar to many developing
countries in the Asia-Pacific region, the statistical system in the Philippines and data related to
the livestock, poultry and aquaculture sectors focus on production. Data on production
originating from backyard farms is available since 1994 and complete commodity balance sheets
are available since 1990, at least for maize and corn. So unlike other countries, the Philippines
produces official statistics on feed use. The Technical Working Group composed of
representatives from the PSA-BAS, DA, and feed associations, are able to use the balance sheet
approach to calculate feed use of maize and rice since they produce regular surveys (monthly and
annual) of stock and production of these cereals.
The official launch of CountrySTAT Philippines creates an opportunity for the policy-makers,
government officials, development partners and other participants to get acquainted with the
value-added of the system and to learn how it can be used to improved data quality and to
support the policy making process. Though highly valuable and easily accessible,

6
CountrySTAT Philippines is still far from being ideal in providing the much-needed data in
feed usage and estimation as shown by the author.
It is therefore imperative for the government and concerned stakeholders in the livestock and
aquaculture sectors to encourage more data transparency and accuracy for compiling commodity
specific data, especially consumption data which is often considered inconsistent and unreliable.
It is also indispensable to improve access to timely data and forecasts on crop, livestock and
aquaculture production.
7
1. Introduction
It is a fact that the increasing demand for food to feed the world’s burgeoning human population
(7.2 billion people) is relentless and the improved affluence being enjoyed by an increasing
number of people results in higher demand for animal products: meat, eggs and milk. By 2050,
most of the world’s population 10 billion or so inhabitants will be living in towns and cities.
Feeding these people will require a 70-100 percent increase in the amount of food produced
today (Burney et al, 2010). It will also require an estimated additional 1,305 million tonnes of
grain, of which 40 percent would be used for feeding livestock. A major contributory factor to
this extra demand is expected to be substantial increases in poultry and pig meat production
(FAO, 2013). “The limits of existing livestock production systems,” observes Dr. Berhe G.
Tekola, FAO Director for Animal Production and Health Division, are being approached, if not
exceeded, because of increased demands for livestock feeds vis-á-vis availability.”
The precarious and somewhat gloomy situation, as described by a high-ranking FAO expert,
holds true in many countries in the Asia-Pacific region, including the Philippines. In this
archipelagic country of 98.7 million people (as of March 14, 2014), demand for feed crops like
maize, rice, wheat and soybean will indubitably expand in the coming decade. As elsewhere,
growth in the demand for those feed crops hinges on the rise in demand for meat, poultry, milk,
eggs, etc, a trend which is catalyzed by rapid urbanization, rising incomes and changes in
consumer tastes and preferences.
Accurate assessments of current and future supplies and demands for livestock feed are needed
as input into national food security policies, as well as national livestock strategies which
balance national food requirements with investments into environmentally sustainable livestock
and feed systems. National feed resources, according to Dr.Tekola, must be assessed and
monitored to provide information that is useful for the development and implementation of
appropriate policies that will contribute to the sustainable growth of national livestock sectors.
The general objective of this study is to: 1) assess current patterns of feed consumption in the
Philippines, especially grain-use in livestock feed; and, 2) review the methodologies for their
calculation. As part of proces, the national consultant has endeavored to identify key drivers and
trends of feed utilization at national level. In general, this report aims to review existing data
sources which contribute to the calculation of national feed use; describe the process for
generating feed estimates; and identify weaknesses in national data systems and general
knowledge that impede a better understanding of national feed systems.
Data gathering in this report was conducted basically through archival research and selected
interviews with key informants from the livestock and feed industries (see Annex A). In

8
particular, representatives of the United Broiler Raisers Association, National Federation of Hog
Farmers, Inc., Philippine Association of Feed Millers, Inc., Philippine Society of Animal
Nutritionists, Philippine College of Swine Practitioners, Philippine College of Poultry
Practitioners, Philippine Statistics Authority, and the Bureau of Animal Industry were
interviewed. Relevant statistics and information were obtained from the PSA-BAS, BAI, Sikap
Foundation and various other institutions.
2. Agricultural statistical system
2.1 The official statistical system
The Philippine Statistics Authority-Bureau of Agricultural Statistics (PSA-BAS) is the principal
government agency created by law (Executive Order No. 116 of 30 January 1987 and recently
amended by Republic Act No. 106251) with the mandate for the efficient collection, processing,
analysis and dissemination of official statistics on agriculture and fisheries. The PSA-BAS is
recognized as a credible agricultural statistical agency with a competent workforce delivering
high quality products and services through the use of appropriate technologies to support the
information needs of stakeholders. As a major player in the Philippine Statistical System (PSS),
its data systems and procedures adhere to standards, rules and norms set by the PSS.
The PSA-BAS serves as the focal point for the dissemination of agricultural statistics as shown
in Table 1, generating basic data on production, prices and marketing, costs and returns of
production and other socio-economic data related to agriculture and fisheries. It also compiles
and generates production accounts, supply and utilization accounts (SUAs) and agricultural
development indicators. These statistics are recognized as valuable inputs into policy
formulation and decision-making to support a sustainable agricultural development in the
Philippines.
The PSA-BAS also maintains a very comprehensive database of agricultural statistics. Data on
production originating from backyard farms has been available since 1994 and complete balance
sheets are available since 1990, at least for maize and rice. So unlike other countries, the
Philippines produces official statistics on feed use. The Technical Working Group2 composed of
representatives from the PSA-BAS, the Department of Agriculture (DA), and feed associations,
use the balance sheet approach to calculate feed use of maize and rice, building on regular
government surveys (monthly and annual) of production and stocks of these cereals.
1 R.A. No. 10625, otherwise known as the “Philippine Statistical Act of 2013”, mandates that the Philippine Statistical Research
and Training Institute (PSRTI) and PSA-BSA shall be attached to the National Economic and Development Authority (NEDA)
for purposes of policy coordination.

9
Other major statistical associations include the National Statistics Office (NSO) which is
responsible for conducting the Census of Agriculture and Fisheries (CAF) and other censuses
and surveys as well as the compilation of trade statistics from which agriculture-based data are
accessed by PSA-BAS and the National Statistical Coordination Board (NSCB). The latter
institution serves as the coordinating and policy-making body of the PSS.
As part of its technical outreach program, the PSA-BSA, in collaboration with the Food and
Agriculture Organization of the United Nations (FAO), has formally launched CountrySTAT
Philippines, a web-based information system that allows gathering and monitoring of national
and sub-national food and agricultural data in compliance with international standards. Easily
accessible and maintained, it provides a solid framework for an improved accessibility of reliable
and timely data, which is essential for implementing better policies and investments in
agriculture. The implementation of this system will also help to strengthen the collaboration
between statistical institutions, agricultural agencies and other relevant institutions in the country.
CountrySTAT Philippines creates an opportunity for the policy-makers, government officials,
development partners and other participants to get acquainted with the value-added of the system
and to learn how it can be used to improved data quality and to support the policy making
process. Though highly valuable and easily accessible, CountrySTAT Philippines is still far
from being ideal in providing the much-needed estimates on feed use, with the most outstanding
challenges including the following:
Quantity, source and price of raw materials ingredients and feed additives, both domestic
and imported, used in feed compounding;
Volume of mixed feeds produced by type and species – national and regional;
Feed conversion ratios (FCRs) of commercial and backyard farm animals and aquatic
species (only available from livestock, poultry and aquaculture industries); and,
Farm efficiencies of commercial and backyard livestock and poultry farms (gathered
during surveys/censuses).
Farm or production efficiency refers to the total amount of the different feed ingredients
delivered to the farm or the total amount of mixed feed fed to the animals in the herd including
wastage in proportion to the weight of live animals sold for the same period of time. This is
usually computed at the end of every month.
By knowing the farm efficiency, the apparent profitability of the enterprise can be determined by
converting the kilograms of feeds and live animals into pesos.
_________

10
2The PSA-BAS has created a Technical Working Group (TWG) on Cereals Statistics to address statistics-related
issues and concerns of this commodity group. Presided over by the PSA-BAS Director, the Inter-agency Committee
(IAC) is composed of representatives from the PSA-BAS and the Department of Agriculture’s National
Agricultural and Fishery Council and the Bureau of Animal Industry. Concerned feed, livestock and aquaculture
association representatives are invited during their monthly/quarterly meetings.
Table 1: PSA-BAS regular statistical reports and publications
Title of Publication Domains / Contents Medium Format Periodicity /
Frequency
Release Calendar
Selected Statistics on Agriculture Production, Trade, Prices,
Farm Economics and Other
Agriculture-related data
English PDF,
Handbook,
CD
Annual May
Performance of Philippine Agriculture
January to December Gross Output, Volume and
Value, Growth Rates
English PDF,
Bulletin
Annual /
Quarterly
21 days after the
reference year
January to March
January to June
January to September
45 days after the
reference quarter
Rice and Corn Situation Report Production, Area, Yield English Memo,
Bulletin
Quarterly May/ Aug/Nov/Feb
Monthly Palay and Corn Situation
Report
Updated Production
Forecasts
English Memo,
Bulletin
Monthly 10 days after the
reference month
Rice and Corn Stock Inventory Stocks English Memo,
Bulletin
Monthly 10 days after the
reference month
Seasonally Adjusted Rice Production
and Prices
Production, Prices English PDF,
Bulletin
Quarterly May/Aug/Nov/Feb
Crops Statistics of the Philippines
(National and Regional)
Production, Area, Yield English PDF, Book Annual August
Major Crops Statistics of the
Philippines (Regional and Provincial)
Production, Area English Book Annual September
Industry Performance Reports for
Carabao, Cattle, Chicken, Duck,
Dairy, Goat and Swine
Inventory, Production,
Trade, Prices
English PDF,
Bulletin
Annual/
Semi-annual
May/ September
Fisheries Statistics of the Philippines Volume and Value of
Production
English PDF, Book Annual October
Fisheries Situation Report Fisheries Production,
Prices
English PDF,
Bulletin
Quarterly/
Annual
May/Aug/Nov/Jan
Prices and Trade
Producers Price Index for Agriculture Price Index English PDF,
Handbook
Semi-annual September

11
Updates on Palay, Rice and Corn Prices Prices English
PDF, Memo Weekly/
Monthly
Every Monday
Updates on Fertilizer Prices Prices English PDF, Memo Monthly 1 week after
Price Situationer of Selected
Agricultural Commodities
Prices English PDF, Memo Weekly Every Monday
Updates on Agricultural Foreign Trade
Performance
Trade English PDF, Memo Quarterly Jan/Apr/Jun/Oct
Agricultural Foreign Trade
Development
Trade English PDF,
Handbook
Annual September
BAS Media Service
Price Bulletin Prices English PDF,
Bulletin
3x a week Tues/Thurs/Sat
Market Situation Prices and Indicators of
market
English PDF,
Bulletin
Weekly Mid-Week
Agricultural Indicators System – National, by Module
Agricultural Structure and Resources Land Use, Livestock and
Poultry Inventory
English Monograph Annual July
Agricultural Credit Credit English Monograph Annual August
Output and Productivity Production, Area, Yield English Monograph Annual August
Agricultural Exports and Imports Trade English Monograph Annual October
Food Sufficiency and Security Production, Trade English Monograph Annual October
Food Consumption and Nutrition Food Consumption English Monograph Annual November
Population and Labor Force Population, Labor Force,
Employment Agriculture
English Monograph Annual November
Gender- Based Indicators of Labor and
Employment Agriculture
Population, Labor Force,
Employment in Agriculture
by Sex
English Monograph Annual November
Redistribution of Land Agrarian Reform English Monograph Annual December
Economic Growth Macroeconomic Indicators English Monograph Annual December
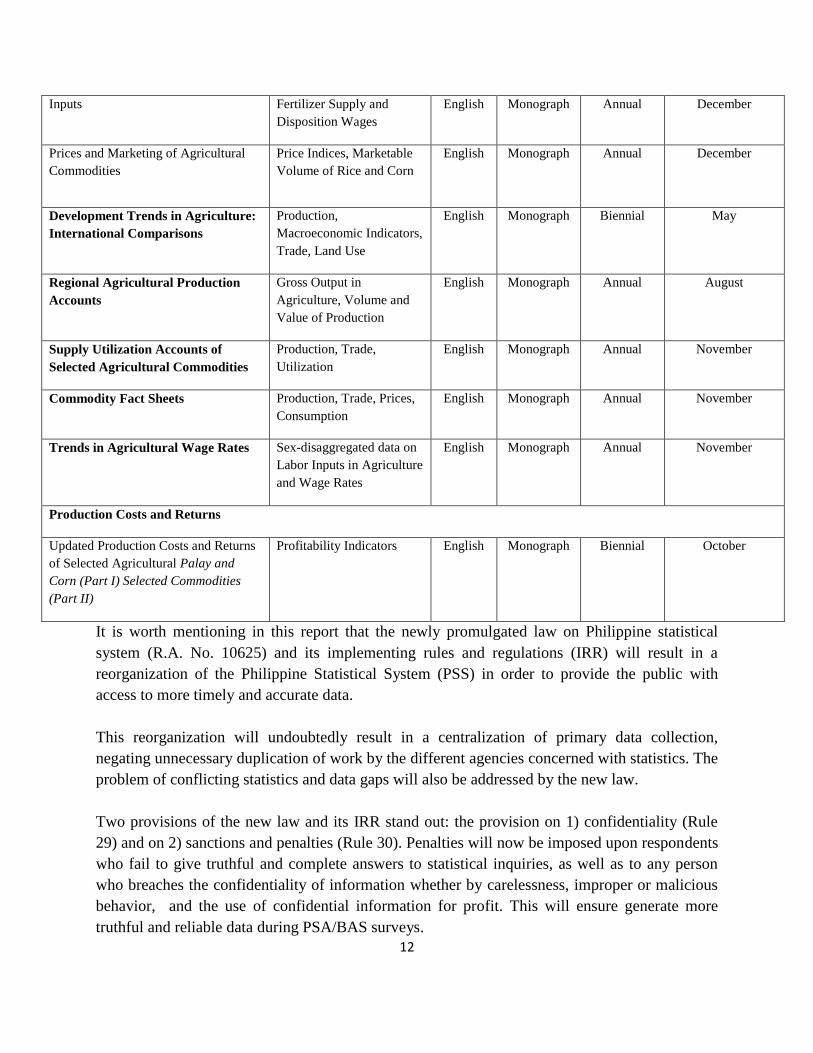
12
Inputs Fertilizer Supply and
Disposition Wages
English Monograph Annual December
Prices and Marketing of Agricultural
Commodities
Price Indices, Marketable
Volume of Rice and Corn
English Monograph Annual December
Development Trends in Agriculture:
International Comparisons
Production,
Macroeconomic Indicators,
Trade, Land Use
English Monograph Biennial May
Regional Agricultural Production
Accounts
Gross Output in
Agriculture, Volume and
Value of Production
English Monograph Annual August
Supply Utilization Accounts of
Selected Agricultural Commodities
Production, Trade,
Utilization
English Monograph Annual November
Commodity Fact Sheets Production, Trade, Prices,
Consumption
English Monograph Annual November
Trends in Agricultural Wage Rates Sex-disaggregated data on
Labor Inputs in Agriculture
and Wage Rates
English Monograph Annual November
Production Costs and Returns
Updated Production Costs and Returns
of Selected Agricultural Palay and
Corn (Part I) Selected Commodities
(Part II)
Profitability Indicators English Monograph Biennial October
It is worth mentioning in this report that the newly promulgated law on Philippine statistical
system (R.A. No. 10625) and its implementing rules and regulations (IRR) will result in a
reorganization of the Philippine Statistical System (PSS) in order to provide the public with
access to more timely and accurate data.
This reorganization will undoubtedly result in a centralization of primary data collection,
negating unnecessary duplication of work by the different agencies concerned with statistics. The
problem of conflicting statistics and data gaps will also be addressed by the new law.
Two provisions of the new law and its IRR stand out: the provision on 1) confidentiality (Rule
29) and on 2) sanctions and penalties (Rule 30). Penalties will now be imposed upon respondents
who fail to give truthful and complete answers to statistical inquiries, as well as to any person
who breaches the confidentiality of information whether by carelessness, improper or malicious
behavior, and the use of confidential information for profit. This will ensure generate more
truthful and reliable data during PSA/BAS surveys.

13
2.2 Non-official statistical work
Non-government organizations (NGOs) in the Philippines (such as industry
organizations/associations, educational institutions, consulting firms and professional
associations) also produce other statistics that feed into public policy debates. Similar to the
official statistics produced by the PSS, the statistics of these NGOs can be misinterpreted when
changes in data are miscontrued to be real changes (even if these changes are actually within
margins of error). NGO statistics are typically based on sample surveys, and/or qualitative
research.
Non-official statistics related to animal and feed production are gathered, analysed and released
by the above-mentioned quasi-public institutions and private consulting firms. Such data
providers have their specific mandates and use their own methodologies to collect and compile
information. It is apparent that none of them has adequate financial and human resources to
undertake nationwide statistical works similar and comparable to PSA-BAS or NSO. More
importantly, they have no administrative authority to require commercial entities (i.e. livestock,
poultry and aquaculture growers or commercial feed compounders) to regularly share data. To a
large extent, to ensure the representativeness of sample coverage, the collection of statistics has
to be undertaken through a manditory process or based on the willingness of concerned
microentities (ensuring confidentiality of the data). Private associations typically have a short
history and their statistical work is still in a process of evolution. It is understantable that the data
from such sources are inconsistent, due to both their inability to adhere to statistical concepts and
inadequacy in data collection methods.
The Animal Feed Standard Division (AFSD) of the BAI is the central repository of feed statistics
and provides technical assistance to the Director. There is, however, inadequate support for
systems development in terms of training and skills enhancement for such activities. Animal and
feed statistical systems developed and maintained in the BAI Central Office are also fragmented
and non-complimentary. Different offices/units within the DA-BAI generate their own digitized
data, which often results in overlapping and conflicting statistics.
Most, if not all, of the feed production data provided by feed compounders and feed ingredient
manufacturers to BAI-AFSD and Bureau of Internal Revenue (BIR) are underestimated as shown
by Table 2. The estimated mixed feed production (assumed at 20 percent soybean meal for all
diets) is much higher than the total commercial feed production figures published by the BAI-
AFSD.
Table 2: Estimated mixed-feed production vs. total commercial feed production
(‘000 MT)

14
Year
Soybean Meal
Imports
Estimated Mixed
Feed Production
Total
Commercial Feed
Production
Difference
2001 1555 7775 1945 5830
2002 1460 7300 2809 4491
2003 1171 5855 1675 4180
2004 1542 7710 3307 4403
2005 1646 8230 2259 5971
2006 1743 8715 1546 7169
2007 1627 8135 1766 6369
2008 1575 7875 1269 6606
2009 1719 8135 1140 6995
2010 1972 9827 1233 8594
2011 1833 9165 1422 7743
2012 1925 9624 1483 6995
Note: 1 – Soybean meal imports by year (USDA, 2013); 2 – Assumed at 20% SBM for all diets; 3 – Based on BAI
mixed-feed production records (BAI, 2013)
The BAI-AFSD and DA regional offices are inadequately trained and staffed to be able to verify
the actual production, feed ingredient usage, and capacity of registered feed compounders and
feed ingredient manufacturers.
Deficiencies in official statistics offer private business an opportunity to provide data consulting
services. With limited resources, consulting firms often use official production and trade
statistics to generate balance sheets. Market analysis and databases of institutions such as FAO,
U.S. Department of Agriculture (USDA), the US Feed Grains Council (USFGC) and the
American Soybean Association (ASA) are used as data sources. However, most private sector
analysis only focus on reviewing the current market situation with limited information on grain
feed usages.
2.3 Available statistics and sources
The Philippines produces statistics related to the livestock and feed sectors, supplied by various
governmental or quasi-governmental bodies. However, under the current institutional structure,
each government body assumes responsibility for collecting statistical information within its own
jurisdiction without considering the interaction between this data in the overall market system.
When these data are compiled in a balance sheet, logical inconsistencies become apparent. Table
2 below shows the sources, nature of the data and related quality problems for statistics on
livestock, the aquaculture sector and feed industry.
Table 3: Data sources related to livestock and aquaculture production and feed sectors

15
Indicator Source Nature of
data
Availability Major
problems
Methods
Number of
animals
by types
PSA-BSA Official Annual and semi-
annual
The number of
animals is
inventoried at a
specific time of
the year, not
estimated by
year.
Annual and semi-
annual data
collection via
administrative
statistical system
Outputs of
animal products
by type
PSA-BSA Official Annual and semi-
annual
Annual and semi-
annual data
collection via
administrative
statistical system
Structure and
scale of livestock
production by
animals
PSA-BSA
and DA
Official Every 11 years Agro-census
data are derived
based on
household
survey
Census survey
Exports and
imports of
livestock
products
BAI, NMIS
and BOC
Official Monthly and annually Monthly and
annually data
collection via
administrative
statistical system
Structure and
scale
of aquaculture
production by
types
PSA-BSA
and BFAR
Official Irregular Basic data and
estimation
methods are not
transparent
Census survey
Exports and
imports of
aquaculture
products
PSA-BSA
and BFAR
Official Annual data
collection via
administrative
statistical system.
Production,
cultivation area
and yield of
PSA-BSA
and NAFC
Official Quarterly
(May/Aug/Nov/Feb)
Quarterly data
collection via
administrative
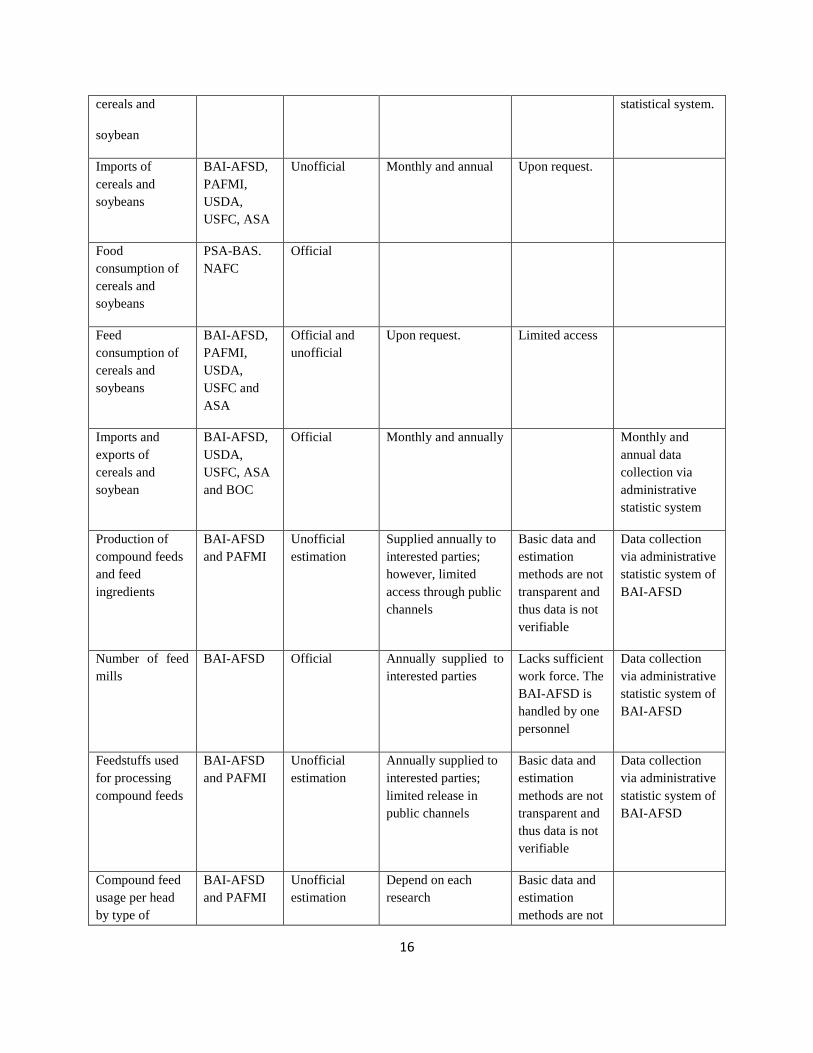
16
cereals and
soybean
statistical system.
Imports of
cereals and
soybeans
BAI-AFSD,
PAFMI,
USDA,
USFC, ASA
Unofficial Monthly and annual Upon request.
Food
consumption of
cereals and
soybeans
PSA-BAS.
NAFC
Official
Feed
consumption of
cereals and
soybeans
BAI-AFSD,
PAFMI,
USDA,
USFC and
ASA
Official and
unofficial
Upon request. Limited access
Imports and
exports of
cereals and
soybean
BAI-AFSD,
USDA,
USFC, ASA
and BOC
Official Monthly and annually Monthly and
annual data
collection via
administrative
statistic system
Production of
compound feeds
and feed
ingredients
BAI-AFSD
and PAFMI
Unofficial
estimation
Supplied annually to
interested parties;
however, limited
access through public
channels
Basic data and
estimation
methods are not
transparent and
thus data is not
verifiable
Data collection
via administrative
statistic system of
BAI-AFSD
Number of feed
mills
BAI-AFSD Official Annually supplied to
interested parties
Lacks sufficient
work force. The
BAI-AFSD is
handled by one
personnel
Data collection
via administrative
statistic system of
BAI-AFSD
Feedstuffs used
for processing
compound feeds
BAI-AFSD
and PAFMI
Unofficial
estimation
Annually supplied to
interested parties;
limited release in
public channels
Basic data and
estimation
methods are not
transparent and
thus data is not
verifiable
Data collection
via administrative
statistic system of
BAI-AFSD
Compound feed
usage per head
by type of
BAI-AFSD
and PAFMI
Unofficial
estimation
Depend on each
research
Basic data and
estimation
methods are not
17
animal and by
operating scale
transparent and
thus data is not
verifiable.
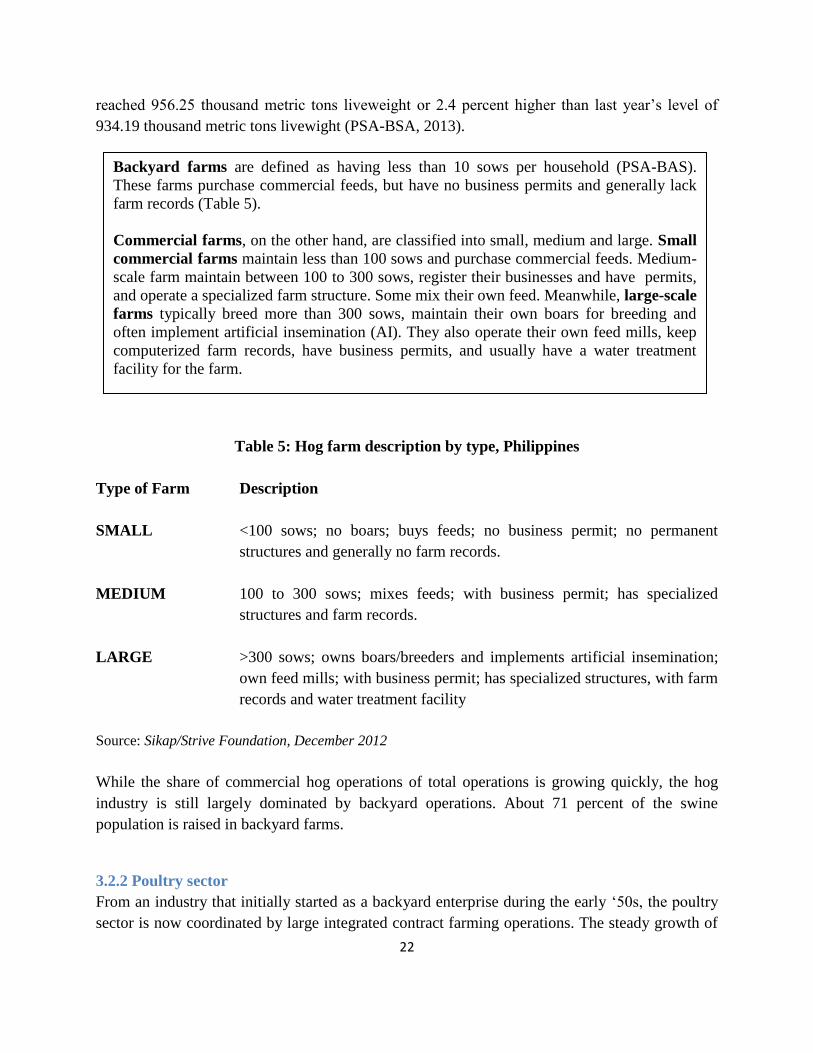
2.4 Methodological issues in estimating feed grains
In the United States and in Europe where statistics on the production of commercial feeds, meat,
and feed conversion ratios (FCRs) are relatively accurate, consistent, and readily available, the
estimation of cereal specific requirements for livestock is easier than in developing countries
where there is more substitutability between feed products. It requires translating FCRs (when
known) into commercial feed equivalents and then deriving the proportion of corn in the feed
rations. For example, if the FCR of hogs is 3.0 then the commercial feed requirements to produce
a kilogram of meat requires 3 kgs of feed. In the Philippines, however, accurate estimations of
FCRs are difficult to derive. Secondly, the slaughterhouse meat output figures are not reliable
because of the consistent underreporting of slaughtered animals. Finally, the mixed-feed
production reports submitted by commercial and non-commercial mixed-feed manufacturers to
the BAI are also inaccurate and unreliable since they are based on the inspection fees paid by
companies; this implies underreporting. Therefore this method of estimation cannot be relied to
derive corn requirements for livestock feed.
A more practical method for deriving feed requirements is based on live animals numbers. Since
livestock and poultry inventories are monitored by the PSA-BAS very closely through quarterly
surveys, this method appears more reliable and is, in fact, being used by Ad Hoc Technical
Working Group from PSA-BAS, the BAI and the private sectors. The procedure involves the
estimation of daily corn feed requirements of livestock populations, by type of animal and by
degree of commercialization. These estimates are then translated into annual per capita
requirements (Costales, 1996).
Costales (1996) estimated the 1990-1995 corn requirements for the livestock subsectors using
technical parameters established by the Ad Hoc Technical Working Group. These parameters
were used to generate livestock feed requirements per year by type of operation. They are
summarized as follows: commercial hogs, 345.05 kg., backyard hogs, 91.25 kg.; commercial
chicken 28.835, and for backyard chicken 15.33 kg. Costales then applied these feed
requirements to the midyear livestock inventory (July 1) and thus generated corn requirements
for livestock operations. Using the estimated 1994 distribution of corn utilization by the BAS,
Philippine Statistical Association (PSA) and the Agribusiness Systems Assistance Program

18
(ASAP), and assuming that the levels of non-feed utilization of corn remain constant, the author
estimated the corn deficit to be around 695,000 metric tons in 1995.
This feed estimation method of Costales can be used to extrapolate to 2000 (or beyond),
assuming that the livestock subsector continues to grow at trend growth rates registered over the
1990-1996 period. The trend growth rates are extrapolated at: commercial hogs, 40 percent;
backyard hogs, 1.79 percent; commercial chicken, 7.06 percent; and backyard chicken, 7.27
percent. By the year 2000, trend projections indicate total corn livestock requirements of 4,358
thousand metric tons or roughly the equivalent of the total corn production in 1995. If the other
non feed uses of the corn are assumed to be constant at their 1995 levels of 1,164 thousand
metric tons, conservatively the corn production levels of 1995 need to increase by 24 percent or
5 percent per year to meet livestock corn requirements by the year 2000. The estimated
projection is somehow understated considering that the production cycle of broilers is 1.35 times
higher than their inventory levels.
3 Growth and structural change in livestock and aquaculture production
3.1 Growth of livestock production
Induced by the increasing demand for quality and safe food products, the Philippines’ livestock
and fishery production expanded rapidly during the past decade (see Figures 1 and 2). While
outputs of carabeef, beef, chevon, poultry meats and fishery products rose steadily, growth rate
of pork production witnessed disease-induced fluctuations (PRRS, PCV2 and PED) in 2005.

19
Data source: PSA-BAS, 2013
Livestock production is a major component of the agricultural economy of the Philippines and its
economic contribution goes well beyond direct food production. Sales of livestock and their
products provide direct cash income to farmers. Livestock are donsidered a walking bank for
many farmers and have a critical role in the agricultural intensification process through provision
of draught power and manure for fertilizer and fuel. They are also closely linked to the social and

20
cultural lives of millions of resource-poor farmers for whom animal ownership ensures varying
degrees of sustainable farming and economic stability.
In 2013 agriculture output in the Philippines grew 1.2 percent to P1.5 trillion (USD29 billion)
and gains were registered in the livestock, poultry and fisheries subsectors. The Department of
Agriculture-Bureau of Agricultural Statistics (DA-BAS), which released the data on November
15, 2013, said the value of agricultural output was 3.5 percent higher than in 2012, supported
by .5 percent gains in farmgate prices. Livestock prices, however, were up by 8.6 percent,
poultry by 1 percent, and fisheries by 2 percent. Farm output accounts for a fifth of the country’s
Gross Domestic Product (GDP).
The livestock subsector, which accounted for 16 percent of total output, grew by approximately 2
percent due to an expansion of cattle and hog production. Poultry, accounting for 15 percent of
agriculture, also increased by 5 percent due to higher chicken output (up 5 percent), chicken
eggs (up 2 percent), and duck eggs (up 10 percent).
The fisheries subsector posted a 3.4 percent increase, fueled by increased milkfish production,
(up 5.5 percent to 288,320 metric tons, MT) and tilapia output rose by 2.4 percent to 240,820 MT
due to the continuing dispersal by Bureau of Fisheries and Aquatic Resources (BFAR) of good-
quality fingerlings, as well as an expansion of the Pangasinan mariculture areas. The value of the
fisheries sector grossed P239.1 billion (USD5.3 billion), up by 2.8 percent from 2012.
Based on the January–March 2014 Philippine dairy production report of the PSA-BSA, dairy
registered with a moderate increase both in volume and value of production, 6.24 percent and
8.15 percent, respectively. Carabao increased by only 0.10 percent but recorded a 1.96 percent in
gross value of output. Gross earnings from cattle went up by 3.92 percent and from goat, by 6.94
percent as a result of better output and prices.
Total dairy production reached 4.94 thousand MT level and grossed more than P151 million-
mark at current prices. More dairy animals on the milk line contributed to the increase in dairy
production and gross value of output. On the weighted average, farm gate price of dairy reached
to P30.59 per liter.
As of January 1, 2014, the total dairy animal population was 40,322 head. This was 3.21 percent
higher than 2013’s headcount. Dairy cattle stocks grew by 2.55 percent. Dairy carabao and dairy
goat population went up by 2.84 percent and 15.26 percent, respectively.

21
3.2 Structural changes in the livestock sector
3.2.1 Pig sector
Pork remains a popular livestock commodity recognized as Filipinos’ most referred animal meat
product. Over the past decade, pork has consistently represented more than 55 percent of the
total daily animal animal meat consumption of Filipinos. In 2002, per capita pork consumption
was estimated at 16.9 kg, representing 57 percent of total meat consumed by Filipinos. Table 4
presents the evolution of per capita consumption of different animal meat products in the
Philippines over the past ten years (1993 to 2002).
Pig farming is the second largest commercial agrifood industry in the Philippines, after the
banana industry. According to the 2006 Census of Philippine Business and Industry (January
2009 Preliminary Data Release), it generated about 16% of agriculture and forestry sales in 2006.
Based on the estimated sow numbers, the key players in the hog industry in the Philippines are
Monterey Farms (45,000 heads), Robina Agri-Partners (22,000 head), Foremost Farms (17,000
head), Cavite Pig City (8,000 heads), Holiday Hills (7,000 head), Hypig (6,500 heads), Pilmico
(6,500), PIC Philippines (5,000 head), Maligaya (3,500 head) and Springside (3,000 head).
Meanwhile, existing industry associations include the National Federation of Hog Farmers, Pork
Board, Philippine Association of Hog Raisers, and the Philippine Swine Association whose
members have average sow numbers of over 5,000.
Pig genetics companies provide hog breeds to commercial and backyard raisers. Integrators
normally have their own contract breeding farms that supply the fattening pigs. Feeds, on the
other hand, are supplied by commercial feed millers to backyard raisers and some commercial
pig producers. Meanwhile, integrators purchase feed ingredients (e.g. soybean, wheat, corn, and
fish meal) from local producers or from foreign sources. Among the locally sourced ingredients
are corn, copra meal, and rice bran. Imported ingredients are soybean meal, wheat and corn.
Significant structural changes have occurred in the Philippine livestock industry sector,
particularly in the pig industry, over the past 10 years. One important structural transformation is
the growing intensification of pig production in urban and peri-urban areas in response to
escalating demand for animal proteins in general and pork in particular. Over the past 10 years,
national pig production is estimated to have grown at an annual rate of almost 4 percent from 9
million heads in 1996 to over 13 million heads in 2006 (BAS, 2006). The country’s total swine
inventory as of July 1, 2013, is estimated at 11.88 million head, among 1 percent lower than last
year’s inventory of 11.96 million heads. Inventories held by backyard farms went down by 1.18
percent while those held commercial farms grew by 0.4 percent against the 2012 level. It is
estimated that approximately 64 percent of the national pig stocks were raised in backyard farms
while 36 percent were in commercial farms. During the first half of 2013, hog production
22
reached 956.25 thousand metric tons liveweight or 2.4 percent higher than last year’s level of
934.19 thousand metric tons livewight (PSA-BSA, 2013).
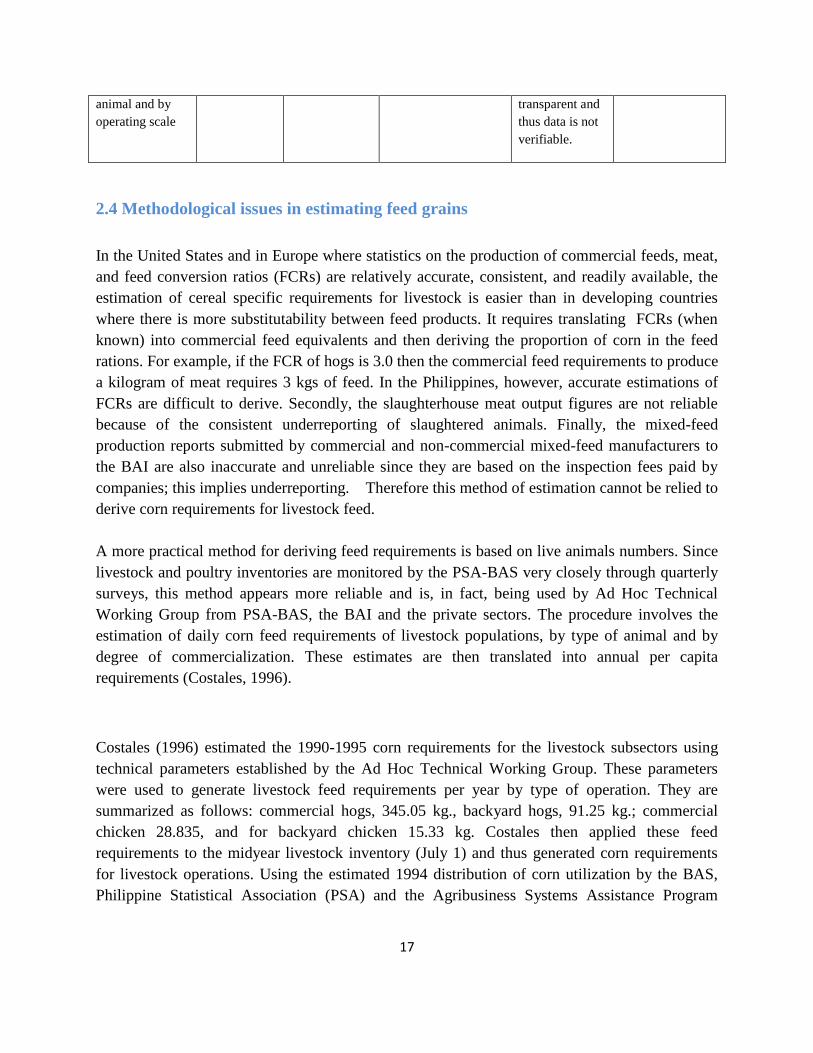
Table 5: Hog farm description by type, Philippines
Type of Farm Description
SMALL <100 sows; no boars; buys feeds; no business permit; no permanent
structures and generally no farm records.
MEDIUM 100 to 300 sows; mixes feeds; with business permit; has specialized
structures and farm records.
LARGE >300 sows; owns boars/breeders and implements artificial insemination;
own feed mills; with business permit; has specialized structures, with farm
records and water treatment facility
Source: Sikap/Strive Foundation, December 2012
While the share of commercial hog operations of total operations is growing quickly, the hog
industry is still largely dominated by backyard operations. About 71 percent of the swine
population is raised in backyard farms.
3.2.2 Poultry sector
From an industry that initially started as a backyard enterprise during the early ‘50s, the poultry
sector is now coordinated by large integrated contract farming operations. The steady growth of
Backyard farms are defined as having less than 10 sows per household (PSA-BAS).
These farms purchase commercial feeds, but have no business permits and generally lack
farm records (Table 5).
Commercial farms, on the other hand, are classified into small, medium and large. Small
commercial farms maintain less than 100 sows and purchase commercial feeds. Medium-
scale farm maintain between 100 to 300 sows, register their businesses and have permits,
and operate a specialized farm structure. Some mix their own feed. Meanwhile, large-scale
farms typically breed more than 300 sows, maintain their own boars for breeding and
often implement artificial insemination (AI). They also operate their own feed mills, keep
computerized farm records, have business permits, and usually have a water treatment
facility for the farm.
23
the poultry industry over the past years makes it one of the most vibrant animal industries in the
Philippines, contributing greatly to agriculture production.
3.2.2.1 Broiler (chicken meat)
With the high demand for chicken meat, stemming from growing household consumption, a
rapid expansion of institutional buyers like fast-food chain owners as well as its potential
prospect as a export product, it is no surprise that the poultry sector has showed strong growth
(in value and volume) over the last 14 years (2000-2013) as shown in Figures 1 and 2. Poultry
has eroded shares of other meats with this trend evident also in the global meat market.
Poultry is mostly defined by chicken production, generating both meat and eggs. Chicken meat is
the most utilized species of poultry, mainly for food production. In the Philippines, chicken ranks
first in terms of economic importance as source of meat and eggs.
The share of the ouput of the commercial broiler industry to national aggregates grew from 46
percent in 2004 to 59 percent in 2011, even as the commercial sector declined by 8 percent in
2010, only to pick up and expand by 5 percent in 2012. It must be noted that the annual
population was based on January 1 beginning inventory figures from the Philippine Statistics
Authority-Bureau of Agricultural Statistics (PSA-BAS) and computed for six cycles. An industry
source estimated total poultry numbers at close to 700 million birds in 2011.
The poultry industry in the Philippines consists of “backyard” and “commercial” farms. Backyard
farms are defined by the BAS as having less than 100 birds, with backyard chickens raised mainly by
rural families to provide for their daily animal protein requirements. These are called native/improved
chicken.
A poultry farm is classified as “commercial” if it has at least 1,000 broilers, or 100 broilers and 100
layers if raised in combination. Commercial broilers are chickens raised by integrators/growers for sale
to processors, wet markets, supermarkets, hotels, restaurants, and similar institutions (see Table 6).
Commercial growers are classified as either integrators or non-integrators. Integrators are those with
growers and company farms with at least 20,000 birds per harvests of five to six cycles per year. They
have integrated operations, usually with their own GP breeder farms and feed mills. They are involved
in the production and marketing of broilers, the importation of grandparent and parent stocks, and the
manufacturing and sales of commercial mixed feeds, and breeder stocks to independent raisers. They
mainly outsource breeding (PS) and dressing operations.
Non-integrators have the same number of birds with around five to six cycles. Their operations are not
integrated, as they usually buy DOCs and feeds, although some own feed mills.

24
Table 6: Broiler farm description by type, Philippines
Type of Farm Description
SMALL <100 birds per farm; baclyard owner operated; buys feeds; small house or
free range; no farm records, business permits, ECC and labor standards
compliance.
MEDIUM 20,000 birds/cycle; buys DOCs and feeds with some feed mixing; with
farm records and business papers; modern technology (non-integrators).
LARGE 20,000 birds/cycle; imports GP/PS; with breeder farm, feed mill; with
farm records and business papers; modern technology (non-integrator)
Source: Sikap/Strive Foundation, December 2012
The backyard poultry population in the Philippines decreased significantly from 54 percent of
total in 2004 to 41 percent in 2012 and it has a low average annual growth of less than 1 percent.
Backyard output exceeded commercial broiler only in 2004 and 2006.
3.2.2.2 Chicken layer
The laying industry in the Philippines is characterized by industry players as small, medium, and
large as defined in Table 6. Layer farms by size are characterized by the following features –
number of layers, type of management, source of feeds, type of hen houses, and certain farm
practices.
Small-scale farms are those with less than 10,000 layers and basically use commercial feeds.
Layer houses are open-sided and made of wood and bamboo. Generally, these farms do not have
business permits, farm records, and Environmental Compliance Certificates (ECCs). They also
are not required to comply with labor standards.
Medium-scale farms operate between 10,000 and 80,000 birds and use external and internal
feeds (own feed formulation). Layer houses are either conventional open-sided like small-scale
farms or semi-automated, that is, made of steel, elevated and open-sided. These farms have
business permits and farm records. Some secure ECCs and comply with labor standards.
On the other hand, large-scale farms are normally managed by corporations and maintain more
than 80, 000 layer birds. These companies have their own feed mills and house layers in tunnel

25
ventilated closed houses. These farms are administered with farm records, business permits, and
ECC and compliant with labor standards.
Overall, large-scale farms invest more in their layer houses than small and medium-scale farms.
These farms also focus more on bird bio-safety and health.
Table 7: Layer farm description by type, Philippines
Type of Farm Description
SMALL <10,000 layers; owner operated; buys feeds; conventional open-sided
layer house; generally no farm records, business permits, ECC and labor
standards compliance.
MEDIUM 10,000-20,000 layers; owner operated; buys feeds or into feed mixing;
conventional open-sided or semi-automated layer house; with farm records
and business papers and some without ECC and labor standards
compliance.
LARGE >80,000 layers; corporate; into feed mixing; tunnel ventilated closed layer
house; and with farm records, business papers, ECC and labor standards
compliance.
Source: Sikap/Strive Foundation, December 2012
Eggs are produced by commercial laying farms as well as by native chicken in backyard farms.
Backyard farms are predominant in number but commercial farms account for 75 percent of total
egg production. The commercial layer population increased by 8.7 percent per annum from about
17.8 million birds in 2004 to 31.4 million birds in 2011. This was fueled by the growth in parent
stock (PS) layer importation over the period.
PS imports grew significantly in 2007, reaching 501,200 birds or almost 40 percent more than
the normal import level of 360,000 birds. Thus, several layer farms had to close down as prices
spiraled downwards as a result of a glut in egg supplies. According to an industry source, it only
requires around 360,000 PS imports to maintain a population of 25 million layers; it is at this
level that excess supplies of eggs are avoided.

26
3.2.2.3 Ducks
Duck is second to chicken in economic importance as a source of egg and meat in the Philippines.
As of July 1, 2013, the country’s total duck population totalled 10.06 million (M) birds which
indicated a decrease of about one (1) percent from last year’s inventory (10.16 M). Of the total
duck population, about 73 percent (7.39 M) were raised in backyard farms while 23 percent (2.68
M) were grown in commercial farms.
The annual volume of duck production for 2013 was 34.46 metric tons. It increased by 1.80
percent over the 2012 level. From January-December 2013, duck egg production grew by 3.33
percent or from 39.7 metric tons in 2012 to 41.07 metric tons in 2013.
The predominant type of duck used for egg production is the Pateros type or the Philippine
Mallard duck locally known as ‘itik’. This is primarily raised for balut (16-18-day-old
embryonated egg) production. The Philippine Mallard duck is very well adapted to local
environmental conditions and management practices. These ducks are non-sitters and are good
producers of eggs that are relatively large in size. Ducks eggs contributed 27,480 tons (t) to total
egg production. Also, they accounted for 25 percent of the total egg consumption in Southeast
Asia.
3.3 Growth and structural changes of aquaculture production
Fish and seafood represent an important source of protein for the average Filipino, accounting
for around 41 percent of animal protein intake. But despite a high demand for fish products in the
Philippines, and extensive aquatic resources, fish is becoming increasingly unaffordable for the
country’s poor due to dwindling stocks and increased costs of production. The fishing industry in
the Philippines is also vulnerable to the effects of climate change – rising sea levels, increasing
water temperatures and changing water patterns are all likely to have ongoing and negative
impacts on the productivity of the industry.
With declining fish stocks (largely due to overfishing and habitat degradation) amidst increasing
demand for fish and fish-based products, the Philippine Government provided significant support
to develop the aquaculture industry that in recent years experienced significant increases in total
production. In 2009, 49 percent of fish production originated from fish farms, compared to only
18 percent in 2003 (WorldFish, 2009).
Aquaculture production in 2013 grew by around 2 percent compared with the previous year’s
output with aquaculture comprising 42.5 percent of total fisheries output. Production of milkfish,
tilapia and tiger prawn also increased during the year due to increased output from aquafarms.
27
These species accounted for 84.5 percent of the total aquaculture production. Other species like
carp, catfish and oyster also contributed to higher aquaculture output for the year.
3.4 Feeding efficiency
In animal husbandry, feed conversion ratio (FCR), feed conversion rate, or feed conversion
efficiency (FCE), is a measure of an animal’s efficiency in converting feed mass into increases
of the desired output. It is utilized to estimate the efficiency of feed use in livestock sector.
However, in the Philippines, FCRs are only available for some sectors such as poultry, hog, and
aquaculture (tilapia, milkfish and shrimp) because these sectors use industrial or commercial
mixed feeds in production.
3.4.1 Poultry sector
The Philippines significantly improved its broiler production efficiency, characterized by a lower
FCR, lower mortality, and shorter growing cycle for both integrators and non-integrators. Non-
integrators were almost as efficient as integrators given their adoption of improved technology
and farming practices. The average liveweight in the country, on the other hand, remained at
almost the same level from previous years in response to preferred bird sizes by consumers. In
Luzon, the live market size went from 1.65 kg to 1.70 kg while in the Visayas, it remained at
1.45 kg. Food service accounts prefers a bird size of 1.60 kg to 1.65 kg while wet markets and
supermarkets prefer dressed chicken from live birds weighing 1.45 kg.
The industry-defined technical parameters indicated that the laying rate across all layer farms in
the country was 80 percent or 292 eggs per bird per year. Assuming that layers consume daily
100 grams of feed in small farms, 105 grams in medium farms, and 99 grams in large farms, the
FCR of laying hens in large farms (1.48) was lowest followed by that in small farms (1.50) and
then that in medium farms (1.58). This implies that large farms are the most efficient users of
feeds. Recovery rates or the ratio of saleable eggs to total, across the farms, were generally the
same at 90 percent to 92 percent. Meanwhile, the depletion rate or mortality rate of pullets was
highest for small farms at 15 percent, while those in medium and large farms averaged only 10
percent.
3.4.2 Pig sector
The Philippines has significantly improved its hog production efficiency as revealed by a decline
in feed conversion ratios (FCR) from about 3.3 kg to 2.8 kg, and an average daily gain (ADG) of
around 550 grams across farm sizes over the 2004 to 2009 period. Large farms were the most
efficient users of feeds considering their capability of providing more cost-effective but
nutritious rations to their hogs.

28
3.4.3 Aquaculture sector
In the Philippine aquaculture sector, the majority of formula feed is used in intensive farming,
particularly in tilapia (Tilapia sp.), milkfish (Chanos chanos), carp, pangasius (catfish) and tiger
shrimp production. In general, feed cost is critical in determining aquaculture productivity and
farmer’s profitability.
Estimating FCRs is a valuable and powerful tool for the fish farmer. It allows for an estimate of
the feed that will be required in the growing cycle. Knowing how much feed will be needed
allows the farmer to determine profitability of an aquaculture enterprise, allowing the farmer to
make wiser choices in selecting and using feed to maximize profitability.
Based on the data shared by consultants, the FCRs of some aquatic species are as follows:
Tilapia: About 1.2 to 1.8 kg in fishponds depending on stocking density, 1.5 to 2.1 in
cages.
Milkfish: Pond: 1.5-1.8; cage 2.0-2.3
Prawn: 1.3 to 1.5
4 Growth and structural changes in feed sector
4.1 Available feed resources
The most common feed ingredients used by the Philippine feed milling industry are yellow corn,
soybean oil meal, rice bran, copra meal, fish meal, and wheat and wheat by-products. Cassava
and sweet potato meals, brewer’s yeast and ipil-ipil leaf meal are also used, to a lesser extent, as
feed ingredients. Among these feed ingredients, yellow maize is considered the most critical, as
it represents about 50 percent of formulated animal feed rations. In fact, over the past decade,
access to maize was considered as a major bottleneck for the development of the feed milling
sector and animal industries in general. However, with the implementation of an aggressive corn
development program by the government, local production and supply of maize has somehow
stabilized. Recently, the quality and prices of locally produced yellow maize have been
competitive with imports.
The outlook for maize production and the increasing trend in local production and consumption
of pork and poultry products paint a positive outlook for the local feed milling industry. However,
ensuring the quality, efficiency and stability of national feed supplies is a challenge for local
industries. To enhance the feed milling sector’s global competitiveness, government should
collaborate with the private sector to instituting policy reforms on importation, pricing and trade,

29
while supporting technological development, stronger information support systems; and, the
establishment of critical infrastructure and facilities.
4.2 Growth and structural changes in domestic grain production
Grown primarily for human consumption, cereal grains are increasingly important as critical
inputs for efficient animal production. Present-day high energy diets for monogastric farm
animals often contain up to 80 percent cereal grains and their by-products. While cereal grains
are considered mainly as a source of dietary energy, their by-products represent a fairly rich
source of protein and polyunsaturated fatty acids (PUFA).
Cereal grains sometimes constitute a significant percentage of fish feed processed into pellets.
Starch present in cereals act as good, natural binders when gelatinized under normal pelleting
conditions, providing products that have high water stability. Grains are indispensable in the
manufacture of floating-type pelleted feed in aquaculture production.
4.2.1. Rice
Rice (Oryza sativa) is seldom used for animal feeding because of its high cost, although
damaged grain and portions considered unfit for human consumption, viz., sweepings from
warehouses and mills, are available for that purpose. In the Philippines, where it is the principal
grain crop, rice of low commercial value such as broken rice is also used as livestock feed. On
the other hand, by-products from mills are more generally available and constitute the most
important feed resource in all rice-producing countries like the Philippines. The by-products
include: rice bran, rice polishings and rice mill feed.
Freshly produced rice bran has a high oil content (14-18 percent). The oil is sometimes recovered
by solvent extraction because of its high commercial value, especially in countries where
demand for cooking oil exceeds supply. The oil present in the bran is rich in polyunsaturated
fatty acids which undergo rapid oxidation under normal storage conditions. Rice bran that has
turned rancid has markedly reduced feed value. Rice bran has a higher protein content than the
grain. It is also fairly high in fiber, thus limiting its use in fish feeds. Adulteration with hulls
lowers its feeding value considerably.
4.2.2 Maize (corn)
Maize or corn (Zea mays) is the second most important crop in the Philippines after rice, with
approximately one-third of Filipino farmers (~1.8 million), depending on maize as their major
source of livelihood. White corn is the most important substitute staple in periods of rice
shortage, especially for people in rural areas. Most of the yellow corn produced in the
Philippines is sold to the livestock and feed milling industries, although some small farmers keep

30
some proportion of output to be consumed as food, especially in times of poor harvest (Gerpacio,
Labios, Labios, and Diangkinay, 2004).
In the Philippines the two categories of maize consumption are food and feed. Maize demand for
food is influenced by the prices of maize and rice, as well as per capita income. The elasticities
of maize demand with respect to the prices of maize and rice, as well as per capita income were -
0.31, -0.81 and -0.47, respectively. This implies that, as a food, maize is considered inferior,
implied by the negative elasticity of maize demand with respect to per capita income. In other
words, as per capita income rises, people in the Philippines purchase less maize and buy other
sources of carbohydrates, such as rice.
Maize demand as feed in the Philippines is influenced by the wholesale price of maize, poultry
production and pork production. The elasticities of maize demand are -0.08 (own price), 0.22
(poultry output) and 0.47 (pork output), respectively. This implies that a 1 per cent in poultry
production ceteris paribus, raises maize demand as feed by 0.22 per cent.
4.2.3 Cassava, tapioca or yucca
For the most part, roots and tubers are grown as food for human consumption in the Philippines.
However, because of their high starch content, some varieties are grown as industrial raw
material. Notable among these is cassava or tapioca. Roots and tubers are also suitable for
feeding fish, although their use for this purpose appears very limited due to their relatively high
cost. Also, because the feed value of roots and tubers is in their carbohydrate content, they
cannot be used at too high levels in feed for fish, which have a lower tolerance for carbohydrates
than farm animals.
Cassava, scientifically known as Manihot esculenta, is one of the most important root crops in
the Philippines. The versatility and multiple utility of this crop makes it economically promising,
be it as human food, animal feed, medicine, alcohol, and for industrial uses like textile, binders,
and as plain raw material in making biodegradable products.
Cassava production in the Philippines grew by 7.2 percent from 641.5 thousand metric tons (mt)
in the same period of 2012 to this year’s 687.8 thousand mt. This production growth was due to:
continuous increase in the contract growing scheme implemented by San Miguel
Corporation (SMC) in Bukidnon;
reported increases in harvest areas in South Cotabato, Davao provinces, Isabela and
Cagayan; and
improved yield of cassava farms in the ARMM provinces due to favorable weather
conditions.

31
4.2.4 Sweet potato
Sweet potato (Ipomoea batatas, L. Lam,) is mainly grown as food for human consumption in the
Philippines. The tubers consist primarily of carbohydrates with a high content of sucrose. Protein
content, although low, is almost twice that of cassava. The leaves of the sweet potato are highly
digestible, free from toxins, and fairly rich in protein. The starch in the tuber provides good
binding for dry and moist-type pellets if heat processing is employed.
The production of sweet potatoes increased to 123.04 thousand mt, or 6.5 percent higher than the
114.54 thousand mt output in the same period of 2012. Factors that bought about the increase
were the following:
wider harvest areas in Bukidnon, Lanao Norte, Davao Provinces, Cebu, Negros Oriental
and Mindanao Occidental; and,
better crop management that boosted yield of sweet potato farms in Zamboanga City.
4.2.5 Soybeans
Soybean oil meal is the most frequently used oil seed meal in livestock and poultry feeds. It is a
by-product from the extraction of oil from soybean (Glycine max). Crude protein content of the
soybean oil meal is dependent upon whether or not the soybean hull is added back to the oil-
extracted bean. The soybean should be cooked or toasted to improve the quality of the meal.
Because of its high quality protein, soybean oil meal can substitute for a great amount, or it can
replace fish meal in the ration. Methionine is the only amino acid that is low in properly
processed soybean meal.
To meet the domestic demand for soybean oil meal as feed, the Philippines is fully dependent on
meal imports, since there is no significant production of soybeans the country. Soybean meal is
primarily by-product of soybean oil production, which is not common in the Philippines.
Domestic production of soybean meal in the Philippines averages 8 percent of total domestic
demand. About 92 percent of domestic consumption is imported from the global market. Imports
increased from 1.55 million tons in 2001 to about 1.64 million tons in 2005 and then to 1.97
million tons in 2010 to 2.05 million tons in 2013 (Table 10). As the livestock industry develops
in the Philippines, there is growing demand for feed and protein meals in particular as they
increasingly are incorporated into compound feed rations.
4.2.6 Copra meal
Copra meal is what remains after the dried coconut meat has been subjected to a mechanical fat
extraction process and ground. Copra meal is also available in cake and pellet form. The
feedstuff is relatively high in protein (22 percent) although the quality is relatively low. It is also
high in fiber. Copra meal is particularly prone to rancidity and aflatoxin contamination.

32
Copra meal or copra cake is the dried meat or kernel of a coconut. It is the by-product of
extracting oil from coconuts. Copra meal is used as fodder for horses and cattle while its high oil
levels and protein make it a good protein source for fattening livestock. The protein in copra
meal has been heat treated and provides an excellent source of high quality protein for cattle,
sheep, pigs and other livestock.
4.3 Development of feed industry
The beginning of the local feed milling industry can be traced back to the early fifties when
foreign breeds of poultry and livestock were imported into the country. The entry of these breeds
necessitated the importation of mixed feeds. Feed importation continued for several years until
some Filipino entrepreneurs invested in the establishment of feed mills (Sison, 1996).
Small feed mills first were set up in the vicinity of Metro Manila. The practice at that time was to
import feed concentrates (feeds containing high density of nutrients, usually low in crude fiber
content and high in total digestible nutrients) and mix them with local feedgrains. As the raising
of hogs and chickens advanced from backyard to commercial scale, the local feed millers
increased their production capacities to meet the growing demand for mixed feed. Moreover,
feed millers found ways to improve their technology at the same time limiting their importation
only to some feed ingredients that were not locally available, such as protein meals.
From a fledgling enterprise in the 1950’s, feed milling has evolved into a dynamic industry
employing over 5,000 workers and contributing significantly to the development of the animal
industry in particular and to the growth of agriculture in general.
As of December 31, 2012, 561 feed mills were registered with the Bureau of Animal Industry
(BAI), the government agency mandated by law (Republic Act No. 1556, as amended by
Presidential Decree No. 7, otherwise known as the Livestock and Poultry Feeds Act) to regulate
the manufacture, sale and distribution of animal feeds. Of the 561 registered mills, 493 were
mixed-feed manufacturers and the rest were feed ingredient manufacturers (Table 7). Of the
mixed-feed manufacturers, 447 operated on a commercial scale, while the other 46 produced for
their own consumption (home-mixers).
Table 8: Registered feed establishments in the Philippines, 2012
Establishments Total No. Registered
Feed Manufacturers 447
Feed Ingredient Manufacturers 68
Commercial Feed Traders 19

33
Toll Manufacturers 45
Non-Commercial Feed
Manufacturers 46
Importers 681
Indentors 161
Exporters 47
Suppliers 763
Distributors 376
Repackers 18
Retailers 3158
Source: Animal Feeds Standard Division, BAI
In terms of geographical distribution, 318
of the 447, or 71.14 percent of the
registered commercial feed mills, are
located in Luzon while the rest are thinly
scattered in Visayas and Mindanao (Figure
3). The heavy concentration of feed
manufacturers in Luzon, specifically in
Metro Manila and its vicinity, i.e. Regions
III (Central Luzon) and IV (Southern
Tagalog), is due to the fact that majority of
commercial livestock operators as well as
feed ingredient suppliers are located in the area.
The total production of the registered feed millers in 2012 was estimated at 1,482,801 metric
tons (Table 9). However, industry sources estimate the present combined rated capacity of all
feed mills in the country at 26,674.58 metric tons per year.
The big discrepancy between total production and rated capacity of 26,674.58 metric tons can be
attributed to low production efficiencies of small and medium-sized feed mills. Power outages,
equipment breakdowns, and erratic supply of raw materials contribute to the low production
efficiencies in most feed mills.
As previously stated, 561 feed mills were registered with the BAI as of December 31, 2012. Of
this total, around 447 were commercial mixed-feed manufacturers, while the rest produced for
their own consumption. The total capacity of all registered feed mills on an eight-hour shift was
is estimated at around 17,000 tonnes, but only 36 mills account for 55 percent of the aggregate
capacity.

34
Some 132 small-scale feed mills produce fewer than 20 tons of feed per eight-hour shift,
representing 6.52 percent of total production capacity. Only 79 feed establishments produce
more than 50 tons of feed per eight-hour shift, and these represent 77.8 percent of total rated feed
capacity. The balance of 15.7 percent capacity is accounted for by feed mills with more than 20
tons but fewer than 50 tons of capacities.
Table 9: Size of commercial feedmills in the Philippines, 2012
RATED CAPACITY
PER 8HOUR SHIFT
(METRIC TON)
NO. OF
MILLS
%
DISTRIBUTION
(Based on the
No. of Feedills)
TOTAL
RATED
CAPACITY
%
DISTRIBUTION
(Based on Rated
Capacity)
LESS THAN 25 (Small
Scale) 273 61.07
3,113.08 11.67
25.1 - 50 ( Medium
Scale) 58 12.95
2,467.50 9.25
50.1 - 100 (Large Scale) 54 12.05
4,188.00 15.7
MORE THAN 100 62 13.94
16,906.00 63.38
TOTAL FEEDMILLS 447 100
26,674.58 100
Source: Animal Feeds Standard Division, BAI
The bulk of mixed-feed production is composed of poultry and swine feeds, with poultry feeds
representing 52 percent and swine feeds 28 percent of total output, for a combine share of 80
percent.
Feed millers in Luzon account for more than 84 percent of the total mixed-feed production with
over 94 percent being produced in the National Capital Region (NCR) and the nearby provinces
of Bulacan, Cavite, Laguna, Batangas and Quezon.
At the forefront of the industry in terms of production output and market share is the Philippine
Feed Millers Association, Inc. (PAFMI), which is presently composed of 32 large feed millers.
In 2012, the combined production of PAFMI members reached 5,774,400 metric tons,
representing 60 percent of the total mixed-feed production. The next biggest producer is the
group of independent feed millers which accounted for 3,849,600 metric tons or 40 percent of
the total mixed-feed output.

35
At present, the industry produces feeds not only for hogs and poultry but also for cattle, pigeons,
rabbits, dogs, fish and prawns (Table 9). The large feed millers are highly mechanized and are
utilizing computers in the feed formulation, thereby increasing production efficiencies. Moreover,
some of the large feed millers have succeeded in integrating mixed-feed production with the
contract growing of poultry and hogs, thereby assuring a market for their products.
Table 10: Commercial mixed feed production by type (in metric tons), Philippines, 2006-
2012
Type 2006 2007 2008 2009 2010 2011 2012
Poultry 790,134.33 678,911.02 657,887.53 496,507.00 522,360.42 578,085.30 515,357.10
Hog 676,211.44 876,208.12 551,250.60 587,039.00 615,539.00 747,008.90 778,383.00
Aquafeed 78,126.10 195,111.30 54,526.20 52,182.43 89,747.30 90,560.00 61,846.00
Specialty feed* 1,530.13 3,662.40 2,106.20 1,637.00 3,222.00 2,462.20 121,671.00
Others 501.00 11,972.14 3,457.50 2,563.60 1,886.20 3,885.50 5,544.10
Total 1,546,502.90 1,765,864.98 1,269,228.03 1,139,929.03 1,232,754.92 1,422,001.90 1,482,800.20
*Specialty feeds include those of cattle, horses, dogs and rabbits.
Source: Animal Feeds Standard Division, BAI (2012)
4.3.2 The role of imports as an input for feed manufacturing
The livestock and feed industries heavily depend on imported feed ingredients, i.e. soybean meal,
maize, feed wheat, and fish meal (Table 11). Imports of soybean meal increased to 2.0 million
tons in 2013 from about 1.9 million tons in previous year. Based on soybean meal import data,
total feed production in 2013 was around 10.2 million tons (Sison, 2013). Soybean accounted for
20-25 percent of the feed formula while yellow maize or its substitute, feed wheat, accounted for
50-60 percent (Vasquez, 2010).
Table 11: Feedstuff imports by year(‘000 MT), 2001-2013
Year Soybean Meal Corn Feed Wheat Fish Meal
2001 1,555 246 2,922 72
2002 1,460 243 3,230 45
2003 1,171 102 2,975 46
2004 1,542 52 2,593 44
2005 1,646 157 2.963 33
2006 1,743 321 2,758 24

36
2007 1.627 58 2,269 24
2008 1,575 432 3,206 24
2009 1,719 118 3,197 16
2010 1,972 61 3,224 9
2011 1,833 202 4,075 11
2012 1,925 92 3,645 12
2013 2,050 50 3,600 12
Source: USDA, 2013
Feed millers choose to import energy feed sources when local corn prices are relatively higher.
Total wheat imports reached 4.0 million tons in 2011 compared to 3.2 million tons in 2010 when
local corn prices were relatively high.
4.3.3 Gap between demand and supply of feedstuffs
The Philippine feed milling industry has grown rapidly in the past six decades, now producing
about 12.38 million tons of feed per year (2014 Alltech Global Feed Survey2). The figure
provided by Alltech, although unofficial, is considered credible by the industry users. Where
possible, information was gathered in partnership with local feed associations, and when that was
not possible, it was done utilizing information collected by Alltech’s global sales force who visit
447 than feed mills annually.
Like its flour milling counterpart, the feed industry is import-dependent in relation to most of its
feed ingredients as shown in Table 9.
The most chronic problem the industry faces is the frequent shortage of cheap raw materials,
which has perennially undermined production and caused a wide gap between the available
supply and demand for feeds. This problem is aggravated by other complications, such as
increasing high and volatile prices, inadequate storage and the ensuing quality deterioration.
Most Philippine feed mills are located in the main island of Luzon, while demand for mixed
feeds is highly dispersed all over the country. Consequently, access to feed inputs is severely
2 The feed statistics provided by Alltech, although unofficial, are considered credible by the industry users.
Whenever possible, information is gathered in collaboration with local feed associations, and when that is not possible, it was done utilizing information collected by Alltech’s global sales force who visit 447 than feed mills annually.
37
hampered on both ends for procurement of raw materials and distribution and marketing of
finished mixed feeds and feed products, driving up costs.
Because procurements of affordable raw material is very important for feed milling and because
raw material availability is seasonal, local feed millers find it economical to channel procurement
of raw materials to dealers. The tight supply of feed grains in recent years has, however, forced
big feed millers to stockpile to enable more efficient production programming. This trend is
expected to continue.
Corn accounts for about 70 percent of local feed requirements. No matter how big in terms of
size and regardless of their financial capability, feed millers use yellow corn in the production of
feed. The availability and affordability of this input has great impact on feed millers’ operations.
5 Conclusion and recommendations
Demands for foods of animal origin are increasing globally due to increasing population growth,
urbanization and income growth. The limits of existing livestock production systems are being
approached, if not exceeded, because of increased demands for livestock feeds vis-á-vis
availability. Consequently, more accurate assessments of current and future supplies and
demands for livestock feed are needed for national food security policy, as well as the
strategically planning for the development of a vibrant yet sustainable livestock sector.
The animal and feed sectors are dynamic and responsive to the needs of a growing human
population. With the advent of new technologies and feed alternatives, both animal and feed
sectors have been able to cope with the rising cost of raw materials and feed additives worldwide
while improving their production efficiencies.
A glaring weakness in the current animal and feed production statistics structure in the
Philippines is that there is no single information system covering all official statistics collected
by the DA and the BAI. The system is characterized by small, activity-focused applications and
data compilation is slowed by the need to share information between Government offices.
Furthermore, data generated by the different applications are often conflicting and difficult to
reconcile.
Animal and feed statistical systems developed and maintained in the Central Office are also
fragmented and non-complimentary. Different offices/units within the DA and BAI generate
their own digitized data, which often results in overlapping and conflicting statistics.

38
Most, if not all, of the feed production submitted by feed compounders and feed ingredient
manufacturers to BAI-AFSD and Bureau of Internal Revenue (BIR) are underestimated. The
BAI-AFSD and DA regional offices are totally understaffed and unable to verify the actual
production of registered feed compounders and feed ingredient manufacturers based on their feed
ingredient usage and rated capacity.
The following recommendations are made to improve the availability of timely and reliable data
on livestock, poultry, aquaculture and feed operations:
Strengthen public institutions (BAI, NMIS, BFAR) under the DA. Empower the DA to
tap expertise of universities and other academic institutions (UPLB Institute of Animal
Science, College of Veterinary Medicine, SEAFDEC).
Allocate adequate funds to improve basic services (production, research and regulatory
affairs).
Undertake institutional assessments of the DA agencies involved in livestock, poultry and
fisheries with the objective of streamline data collection processes.
Encourage stronger and more unified livestock, poultry, aquaculture and feed
associations with open information systems (e.g. mixed feed production data from
commercial and non-commercial manufacturers, parent stock importation, SPS
importation of meat and by-products, open cost system).
It is strongly recommended that PSA-BSA, in collaboration with BAI, livestock and feed
associations, undertake jointly a nationalwide annual feed production and utilization survey.
Home mixers should be included in this survey to assure documentation of the actual production,
utilization and consumption of mixed feeds and raw materials.
To further strengthen the statistical capacity across the entire Philippine Statistical System (PSS)
and assist the PSS to carry out its mandate to produce meaningful official statistics, there is an
urgent need for the PSA/BAS to:
prepare, in coordination with BAI-AFSD, PAFMI, APAFMI and other concerned sectors,
a work plan for undertaking a national mixed-feed production survey next year. The
respondents should include commercial and non-commercial feed manufacturers.
upgrade the feed usage and estimation data of CountrySTAT Philippines by incorporating
the following:
Quantity, source and price of ingredients used in feed compounding;
Volume of mixed feeds produced by type and species – national and regional;

39
Quantity, source and price of imported raw materials and feed additives used in feed
compounding;
Feed conversion ratios (FCRs) of commercial and backyard farm animals and aquatic
species (to be supplied by the stakeholders from the livestock, poultry and
aquaculture industries); and,
Farm efficiencies of commercial and backyard livestock and poultry farms (to be
gathered during surveys/censuses).
40
References
Albert, J.R.G., Reyes, R.S. 2013. Better Statistics for a Better Philippines. Philippine Statistics
Authority – National Statistical Coordination Board 2013, Makati City, Philippines.
BAS (Bureau of Agricultural Statistics), 2013. Selected Statistics on Agriculture 2013.
Department of Agriculture, Quezon City, Philippines.
Calud, A.T., Apo, L.T., Villar, E.C., Guico, A.B. 2013. The 2012 Swine Production Performance
in the Philippines. Philippine Swine Industry Research and Development Foundation, Inc.
(PSIRDFI) and Philippine Council for Agriculture, Aquatic and Natural Resources and
Development- Department of Science and Technology (PCAARRD-DOST), Los Baños, Laguna,
Philippines.
Calud, A.T., Apo, L.T., Villar, E.C., Guico, A.B. 2014. The 2013 Swine Production Performance
in the Philippines. Philippine Swine Industry Research and Development Foundation, Inc.
(PSIRDFI) and Philippine Council for Agriculture, Aquatic and Natural Resources and
Development- Department of Science and Technology (PCAARRD-DOST), Los Baños, Laguna,
Philippines.
Chang, C. Analysis of the Philippine Chicken Industry: Commercial versus Backyard Sectors.
2007. Asian Journal of Agriculture and Development, Vol. 4, No. 1.
FAO. 2012. Conducting National Feed Assessments by Michael B. Coughenour and Harinder
P.S. Makkar. FAO Animal Production and Health Manual No. 15. Rome, Italy.
Gerpacio, R., Labios, J., Labios, R., and Diangkinay, E. (2004). Maize in the Philippines:
Production systems, constraints and research priorities. International Maize and Wheat
Improvement Centre (CIMMYT), Texcoco, Mexico.
Gonzales, L.A., Dy, R.T. 2012. Benchmarking the Livestock and Poultry Industries: A Cross
Country Analysis of the Philippines and Four Other Southeast Asian Countries. SIKAP/STRIVE
Foundation, Los Baños, Laguna.
National Statistical Coordination Board. 2012. The Philippine Statistical Development Program
2011-2017 Strategic Plan. Makati City 1200, Philippines.
PHILSAN (Philippine Society of Animal Nutritionists), 2010. Feed Reference Standards (4th
Edition), 2010. College, Laguna, Philippines.

41
Sison, J.A., Baconawa, E.T. 1996. Feed Mill Project Feasibility Study. Farm Integrated Animal
Health and Production Project (FIAHPP) under RP-FRG BAI-GTZ. Quezon City, Philippines.

42
Annex A: List of Associations/Organizations Interviewed
Industry Associations:
National Federation of Hog Farmers, Inc. (NFHFI)
Rm. 401 R & G G. Tirol Building, No. 831 EDSA cor. E. Lopez St., South Triangle, Quezon
City
Philippines/Tel. No. (632) 924-2317
Daniel P. Javellana, Jr., President
Philippine Association of Feed Millers, Inc. (PAFMI)
Unit E 2703 D East Tower, Tektite Condominium, Philippine Stock Exchange Center, Exchange
Road, Ortigas Center, Pasig City 1605/Tel. Nos. 687-2472 and 687-5269
Pork Producers Federation of the Philippines, Inc. (ProPork)
Unit 305, 3/F Reliance House, No. 205 EDSA cor. Rochester Street
Greenhills, Mandaluyong City, Metro Manila, Philippines
Edwin Chen, President
Philippine Veterinary Drugs Association (PVDA)
Unit 1629, 16th Floor, City & Land Megaplaza Condominium
ADB Avenue, Ortigas Center, Pasig City
Dr. Javier Mateo, President
United Broiler Raisers Association (UBRA)
Room 218 Philippine Social Science Building, Commonwealth Avenue, Diliman, Quezon
City/Telefax: (632) 922-9622
Academe:
College of Economics and Management
University of the Philippines Los Baños, College, Laguna, Philippines, 4031
Liborio S. Cabanilla, Ph.D., Professor
Crop Science Cluster
College of Agriculture, UPLB, College, Laguna, Philippines 4031
Professional Associations:

43
Philippine Society of Animal Nutritionists
Institute of Animal Science, College, Laguna, Philippines
Philippine College of Poultry Practitioners
Mallinckrodt Veterinary, Inc.,
946 Km. 18 South Super Highway, Sucat,
Parañaque, Metro Manila
Philippine College of Swine Practitioners
42 Castello St., Casa Milan, North Fairview
Quezon City, Philippines
Dr. Zoilo Lapuz, President
Philippine College of Veterinary Feed Practitioners
c/o Animal Feeds Standard Division
Bureau of Animal Industry, Visayas Avenue
Diliman, Quezon City, Philippines
Philippine Veterinary Medical Association
Unit 233, Union Square Condominium
15th Avenue, Cubao, Quezon City, Philippines

©/Morguefile