Embed Size (px)
Citation preview
EQUITY RESEARCH
Page | 1 | PHILLIPCAPITAL HONGKONG RESEARCH
Topsports INTL. (6110 HK)
Leading Retailer, first choice for international renowned brands Hong Kong |Consumer (Sportswear) | Initial Coverage Research Report
14 August 2020
Investment Summary Topsports is the largest sports retailer in China. Started to operate sports shoes and apparel retail in 1999. In the past 20 years, it has expanded its sales network and expanded its brand portfolio to meet Chinese consumers' demand for sports shoes and apparel products. The company currently operates more than 8,000 stores directly in nearly 300 cities across the country in order to establish the broadest and deeply penetrating national sports shoes and apparel retail network. According to Frost & Sullivan's data, Topsports' market share in 2018 was 15.9%, ranking first in China's domestic sports shoes and apparel retail market. Channel integration, stores continue to upgrade The company continues to focus on the optimization of its direct retail store network to consolidate its retail network advantages. During the period, low-yield and loss-making stores were closed in due course, and new stores were opened with relative caution. During the year, the company closed 1,364 stores during the year and opened 1,416 new stores. The overall number of stores increased by 52 compared with last year and gross sales area increased by 10.6%. Stores covering an area of more than 300 square meters, such as themed flagship stores and brand flagship stores, have increased from 200 in 2017 to 612 in 2020, a three-fold increase in four years to increase customers' offline shopping Experience.
The sportswear industry is steadily improving In the past ten years, the global sports shoe market has steadily expanded, and the concept of national sports has driven the growth of global sports consumption. According to a report
by China Forward Industry Research Institute (中國前膽產業研究院), the global sports shoe industry market size has risen from US$66.7 billion in 2010 to US$146.5 billion in 2018, growing at a CAGR of 10.3%, and it is estimated that the market is close to the level of 170 billion US dollars in 2019. The institute also predicts that the global sports shoe market will maintain a medium-speed and steady growth, and is expected to reach a scale of US$379.1 billion in 2025, with a compound annual growth rate of about 18.7%. Close cooperation with global sports brands The revenue of global sports brands in China mainly comes from wholesale channels. In the past two decades, global sports brands have established strategic and interdependent relationships with Chinese retail partners. Global sports brands mainly rely on mature sports retail companies to provide specific brand products and experiences to local consumers. According to Frost & Sullivan’s data, in 2018, about 70% of global sports brands’ retail revenue in China came from wholesale channels Valuation and Investment Recommendation In the past, the company continued to maintain a good cooperative relationship with Nike and adidas. Facing the impact of e-commerce on the retail industry, the company improved its stores to provide customers with unique consumer experiences that e-commerce cannot provide, such as holding theme events, etc. The impact of the COVID-19 on the company’s revenue has been mainly reflected in the FY20 annual report. We expect the company's earnings per share in 2021/2022 to be RMB 41.80/47.92 cent. The target price of $11.61 HKD corresponds to P/E of 25.00x /21.81x in FY21/FY22.
Accumulate (initiation) CMP HKD 10.06
(Closing price as at 12 August)
TARGET HKD 11.61 (+15.4%) COMPANY DATA
O/S SHARES (MN) : 6,201.22
MARKET CAP (HKD MN) : 62,384
52 - WK HI/LO (HKD): 12.09/6.24
SHARE HOLDING PATTERN, %
Belle Sports Limited 82.91
PRICE VS. HSI
Source: Aastock, Phillip Securities (HK) Research
財務資料
CNY mn FY20 FY21E FY22E
Net Sales 33,690 37,366 45,103
Net Profit 2,303 2,592 2,972
EPS, CNY cent 40.88 41.80 47.92
P/E, x 22.15 21.66 18.89
BVPS, CNY 1.70 1.96 2.22
P/BV, x 5.33 4.61 4.07 DPS (HKD cent) 19 19 22 Div. Yield (%) 1.9 1.9 2.1
Source: Company reports, Phillip Securities Est.
Research Analyst Timothy Chong (+ 852 22776515) [email protected]
Page | 2 | PHILLIPCAPITAL HONGKONG RESEARCH
Topsports INTL INITIATION REPORT
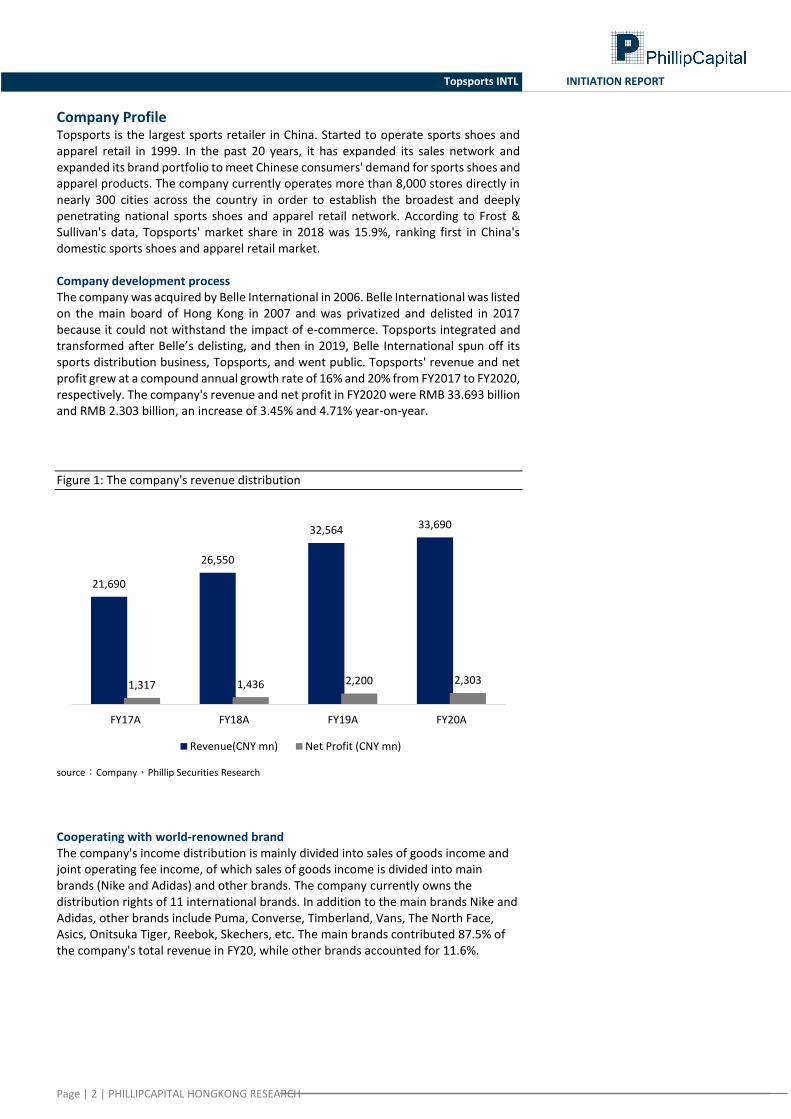
Company Profile Topsports is the largest sports retailer in China. Started to operate sports shoes and apparel retail in 1999. In the past 20 years, it has expanded its sales network and expanded its brand portfolio to meet Chinese consumers' demand for sports shoes and apparel products. The company currently operates more than 8,000 stores directly in nearly 300 cities across the country in order to establish the broadest and deeply penetrating national sports shoes and apparel retail network. According to Frost & Sullivan's data, Topsports' market share in 2018 was 15.9%, ranking first in China's domestic sports shoes and apparel retail market. Company development process The company was acquired by Belle International in 2006. Belle International was listed on the main board of Hong Kong in 2007 and was privatized and delisted in 2017 because it could not withstand the impact of e-commerce. Topsports integrated and transformed after Belle’s delisting, and then in 2019, Belle International spun off its sports distribution business, Topsports, and went public. Topsports' revenue and net profit grew at a compound annual growth rate of 16% and 20% from FY2017 to FY2020, respectively. The company's revenue and net profit in FY2020 were RMB 33.693 billion and RMB 2.303 billion, an increase of 3.45% and 4.71% year-on-year.
Figure 1: The company's revenue distribution
source:Company,Phillip Securities Research
Cooperating with world-renowned brand The company's income distribution is mainly divided into sales of goods income and joint operating fee income, of which sales of goods income is divided into main brands (Nike and Adidas) and other brands. The company currently owns the distribution rights of 11 international brands. In addition to the main brands Nike and Adidas, other brands include Puma, Converse, Timberland, Vans, The North Face, Asics, Onitsuka Tiger, Reebok, Skechers, etc. The main brands contributed 87.5% of the company's total revenue in FY20, while other brands accounted for 11.6%.
21,690
26,550
32,564 33,690
1,317 1,436 2,200 2,303
FY17A FY18A FY19A FY20A
Revenue(CNY mn) Net Profit (CNY mn)

Page | 3 | PHILLIPCAPITAL HONGKONG RESEARCH
Topsports INTL INITIATION REPORT
Figure 2::Brands partners
source:Company,Phillip Securities Research
Channel integration, stores continue to upgrade As of February 29, 2020, Topsports has 8,395 directly-operated stores, contributing 86.6% of the company's revenue. In addition, it has more than 1,000 downstream retailers, operating nearly 2,000 dealership stores, contributing 12.5% of the company's revenue. The company's direct-operated stores can be divided into three forms: 1) Single-brand stores. In 2019, more than 99% of the company's direct-operated stores are single-brand stores, which are the main store composition. 2) Multi-brand collection stores, including Topsports and Foss. 3) Sports City. The company continues to focus on the optimization of its direct retail store network to consolidate its retail network advantages. During the period, low-yield and loss-making stores were closed in due course, and new stores were opened with relative caution. During the year, the company closed 1,364 stores during the year and opened 1,416 new stores. The overall number of stores increased by 52 compared with last year and gross sales area increased by 10.6%. The number of stores of 150 square meters and below in the company has continued to decrease in the past four years, from 5,918 in 2017 to 5,732 in 2020, and the overall proportion has dropped from 77.8% to 68.3%. Stores covering an area of more than 300 square meters, such as themed flagship stores and brand flagship stores, have increased from 200 in 2017 to 612 in 2020, a three-fold increase in four years to increase customers' offline shopping Experience.
Figure 3:Changes in store network structure distribution (as of February 28 each year)
source:Company,Phillip Securities Research
2.6%3.1%
5.0%
7.3%
0.0 %
1.0 %
2.0 %
3.0 %
4.0 %
5.0 %
6.0 %
7.0 %
8.0 %
0
1000
2000
3000
4000
5000
6000
7000
8000
9000
2017 2018 2019 2020
150 sq.m or smaller Between 150 and 300 sq.m
Larger than 300 sq.m Larger than 300 sq.m (% of total)
Page | 4 | PHILLIPCAPITAL HONGKONG RESEARCH
Topsports INTL INITIATION REPORT
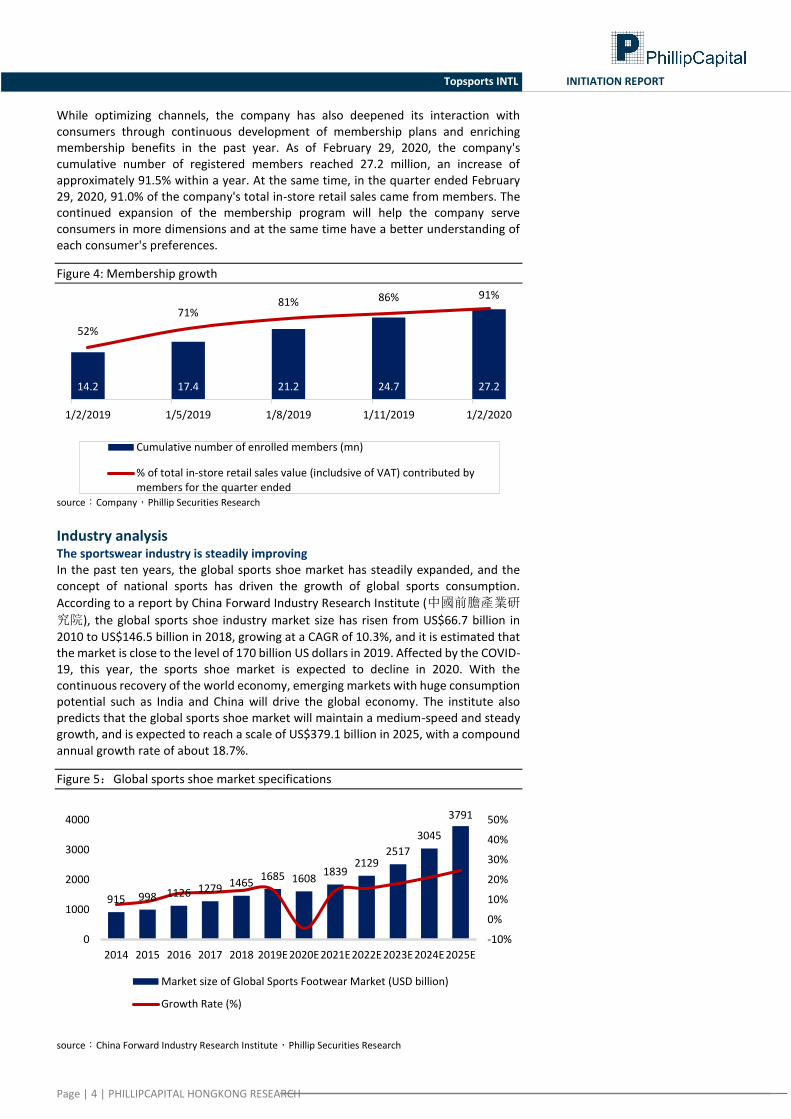
While optimizing channels, the company has also deepened its interaction with consumers through continuous development of membership plans and enriching membership benefits in the past year. As of February 29, 2020, the company's cumulative number of registered members reached 27.2 million, an increase of approximately 91.5% within a year. At the same time, in the quarter ended February 29, 2020, 91.0% of the company's total in-store retail sales came from members. The continued expansion of the membership program will help the company serve consumers in more dimensions and at the same time have a better understanding of each consumer's preferences.
Figure 4: Membership growth
source:Company,Phillip Securities Research
Industry analysis
The sportswear industry is steadily improving In the past ten years, the global sports shoe market has steadily expanded, and the concept of national sports has driven the growth of global sports consumption.
According to a report by China Forward Industry Research Institute (中國前膽產業研
究院), the global sports shoe industry market size has risen from US$66.7 billion in
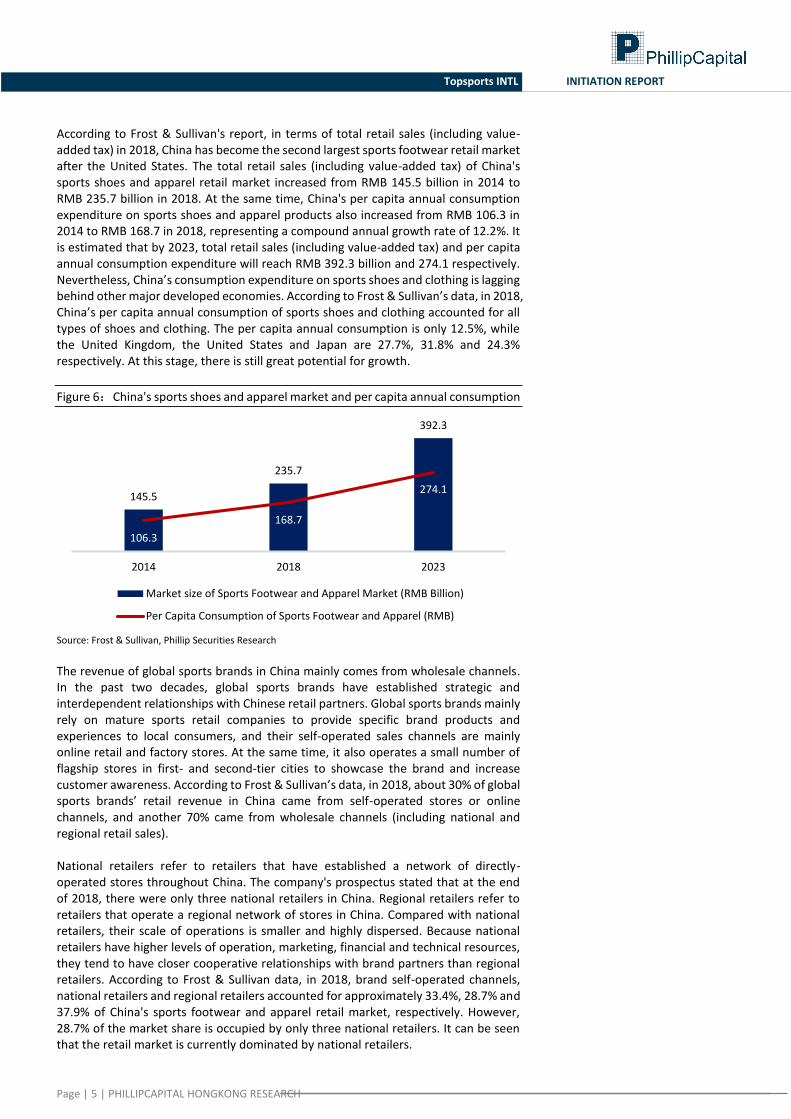
2010 to US$146.5 billion in 2018, growing at a CAGR of 10.3%, and it is estimated that the market is close to the level of 170 billion US dollars in 2019. Affected by the COVID-19, this year, the sports shoe market is expected to decline in 2020. With the continuous recovery of the world economy, emerging markets with huge consumption potential such as India and China will drive the global economy. The institute also predicts that the global sports shoe market will maintain a medium-speed and steady growth, and is expected to reach a scale of US$379.1 billion in 2025, with a compound annual growth rate of about 18.7%.
Figure 5:Global sports shoe market specifications
source:China Forward Industry Research Institute,Phillip Securities Research
14.2 17.4 21.2 24.7 27.2
52%
71%81% 86% 91%
0%
10%
20%
30%
40%
50%
60%
70%
80%
90%
100 %
0
5
10
15
20
25
30
1/2/2019 1/5/2019 1/8/2019 1/11/2019 1/2/2020
Cumulative number of enrolled members (mn)
% of total in-store retail sales value (includsive of VAT) contributed bymembers for the quarter ended
915 998 1126 1279 14651685 1608
18392129
2517
3045
3791
-10%
0%
10%
20%
30%
40%
50%
0
1000
2000
3000
4000
2014 2015 2016 2017 2018 2019E2020E2021E2022E2023E2024E2025E
Market size of Global Sports Footwear Market (USD billion)
Growth Rate (%)
Page | 5 | PHILLIPCAPITAL HONGKONG RESEARCH
Topsports INTL INITIATION REPORT
According to Frost & Sullivan's report, in terms of total retail sales (including value-added tax) in 2018, China has become the second largest sports footwear retail market after the United States. The total retail sales (including value-added tax) of China's sports shoes and apparel retail market increased from RMB 145.5 billion in 2014 to RMB 235.7 billion in 2018. At the same time, China's per capita annual consumption expenditure on sports shoes and apparel products also increased from RMB 106.3 in 2014 to RMB 168.7 in 2018, representing a compound annual growth rate of 12.2%. It is estimated that by 2023, total retail sales (including value-added tax) and per capita annual consumption expenditure will reach RMB 392.3 billion and 274.1 respectively. Nevertheless, China’s consumption expenditure on sports shoes and clothing is lagging behind other major developed economies. According to Frost & Sullivan’s data, in 2018, China’s per capita annual consumption of sports shoes and clothing accounted for all types of shoes and clothing. The per capita annual consumption is only 12.5%, while the United Kingdom, the United States and Japan are 27.7%, 31.8% and 24.3% respectively. At this stage, there is still great potential for growth.
Figure 6:China's sports shoes and apparel market and per capita annual consumption
Source: Frost & Sullivan, Phillip Securities Research
The revenue of global sports brands in China mainly comes from wholesale channels. In the past two decades, global sports brands have established strategic and interdependent relationships with Chinese retail partners. Global sports brands mainly rely on mature sports retail companies to provide specific brand products and experiences to local consumers, and their self-operated sales channels are mainly online retail and factory stores. At the same time, it also operates a small number of flagship stores in first- and second-tier cities to showcase the brand and increase customer awareness. According to Frost & Sullivan’s data, in 2018, about 30% of global sports brands’ retail revenue in China came from self-operated stores or online channels, and another 70% came from wholesale channels (including national and regional retail sales). National retailers refer to retailers that have established a network of directly-operated stores throughout China. The company's prospectus stated that at the end of 2018, there were only three national retailers in China. Regional retailers refer to retailers that operate a regional network of stores in China. Compared with national retailers, their scale of operations is smaller and highly dispersed. Because national retailers have higher levels of operation, marketing, financial and technical resources, they tend to have closer cooperative relationships with brand partners than regional retailers. According to Frost & Sullivan data, in 2018, brand self-operated channels, national retailers and regional retailers accounted for approximately 33.4%, 28.7% and 37.9% of China's sports footwear and apparel retail market, respectively. However, 28.7% of the market share is occupied by only three national retailers. It can be seen that the retail market is currently dominated by national retailers.
145.5
235.7
392.3
106.3
168.7
274.1
0
50
100
150
200
250
300
350
400
450
2014 2018 2023
Market size of Sports Footwear and Apparel Market (RMB Billion)
Per Capita Consumption of Sports Footwear and Apparel (RMB)

Page | 6 | PHILLIPCAPITAL HONGKONG RESEARCH
Topsports INTL INITIATION REPORT
Figure 7:Distribution of sales channels in China's sports shoes and apparel retail market in 2018
Source: Frost & Sullivan, Phillip Securities Research
The prevailing single-brand store model in China provides customers with a unique brand experience In terms of the retail model, different from other major developed economies where multi-brand stores are the main retail model, single-brand stores are the more common business model in China. Compared with multi-brand stores, the competitive advantage of single-brand stores lies in their ability to show brand image and provide customers with a unique brand experience. Global sports footwear and apparel retail has also begun to transform to a single-brand store model. Leading sports brands have devoted more resources and attention to excellent retail partners who can enhance consumer experience and enhance brand influence.
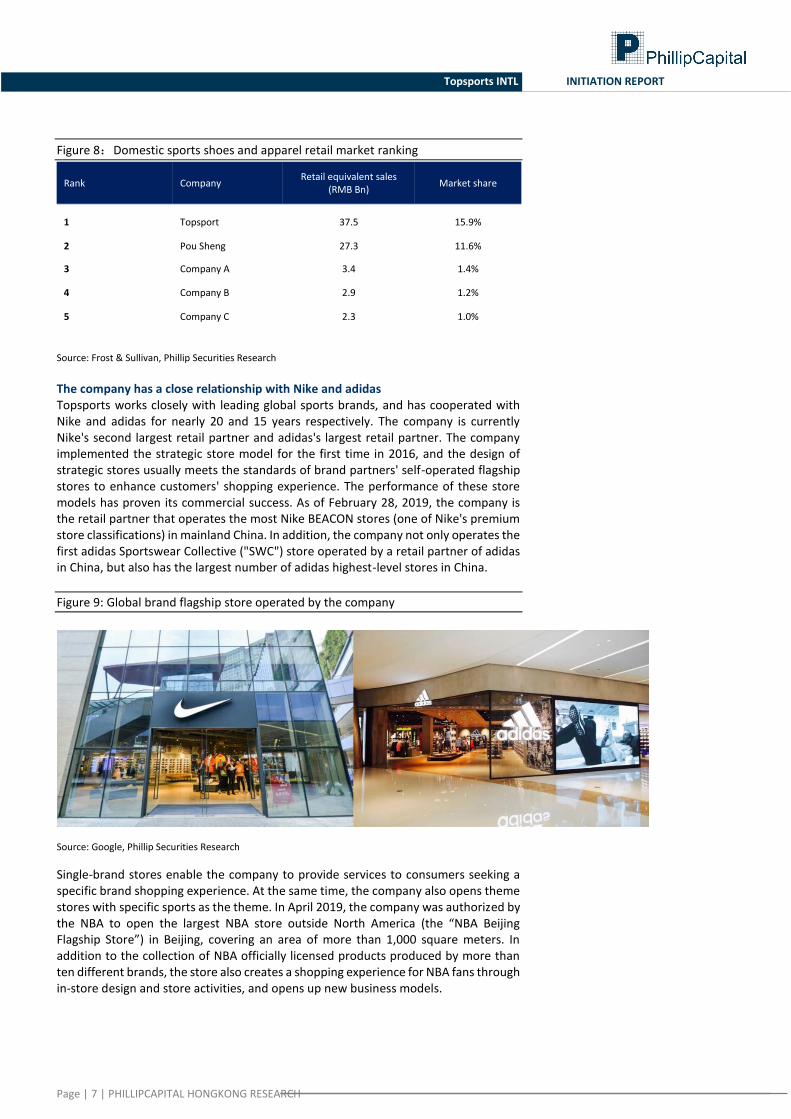
Company competitive advantage The company takes a firm lead in the domestic retail industry The market for China's sports shoe and apparel retail industry is relatively fragmented, with only two national retailers accounting for a significant share. Among all the market participants in China, Topsports is firmly in the leading position. According to Frost & Sullivan, in terms of retail equivalent sales, Topsports ranked first among retailers in the Chinese sports shoe retail market in 2018, reaching RMB 37.5 billion, which is higher than the second place. More than 30%. Topsports and Pou Sheng, the top two sports shoes and apparel retailers in the market, together account for 27.5% of the market. The remaining market share is derived from many regional retailers, generally only about 1%. At the same time, Topsports' directly-operated stores are also more efficient. In 2018, the average retail sales of a single store of the company's directly-operated stores reached RMB 3.7 million, which was about 12% higher than the second-place peer. Due to higher operating efficiency, synergy of cross-regional operations and strategies, company will continue to maintain its competitive advantage.
33%
29%
38% Brand-operated channels
Nationwide retaulers
Regional retailers
Page | 7 | PHILLIPCAPITAL HONGKONG RESEARCH
Topsports INTL INITIATION REPORT
Figure 8:Domestic sports shoes and apparel retail market ranking
Rank Company Retail equivalent sales
(RMB Bn) Market share
1 Topsport 37.5 15.9%
2 Pou Sheng 27.3 11.6%
3 Company A 3.4 1.4%
4 Company B 2.9 1.2%
5 Company C 2.3 1.0%
Source: Frost & Sullivan, Phillip Securities Research
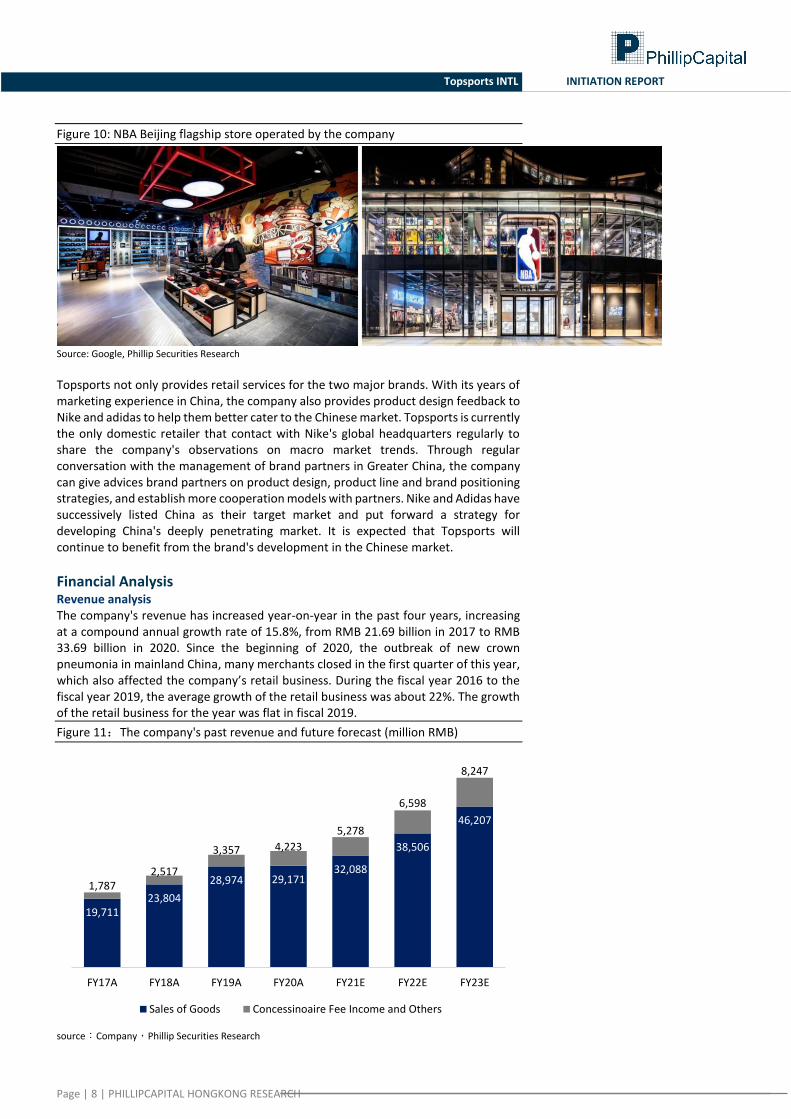
The company has a close relationship with Nike and adidas Topsports works closely with leading global sports brands, and has cooperated with Nike and adidas for nearly 20 and 15 years respectively. The company is currently Nike's second largest retail partner and adidas's largest retail partner. The company implemented the strategic store model for the first time in 2016, and the design of strategic stores usually meets the standards of brand partners' self-operated flagship stores to enhance customers' shopping experience. The performance of these store models has proven its commercial success. As of February 28, 2019, the company is the retail partner that operates the most Nike BEACON stores (one of Nike's premium store classifications) in mainland China. In addition, the company not only operates the first adidas Sportswear Collective ("SWC") store operated by a retail partner of adidas in China, but also has the largest number of adidas highest-level stores in China.
Figure 9: Global brand flagship store operated by the company
Source: Google, Phillip Securities Research
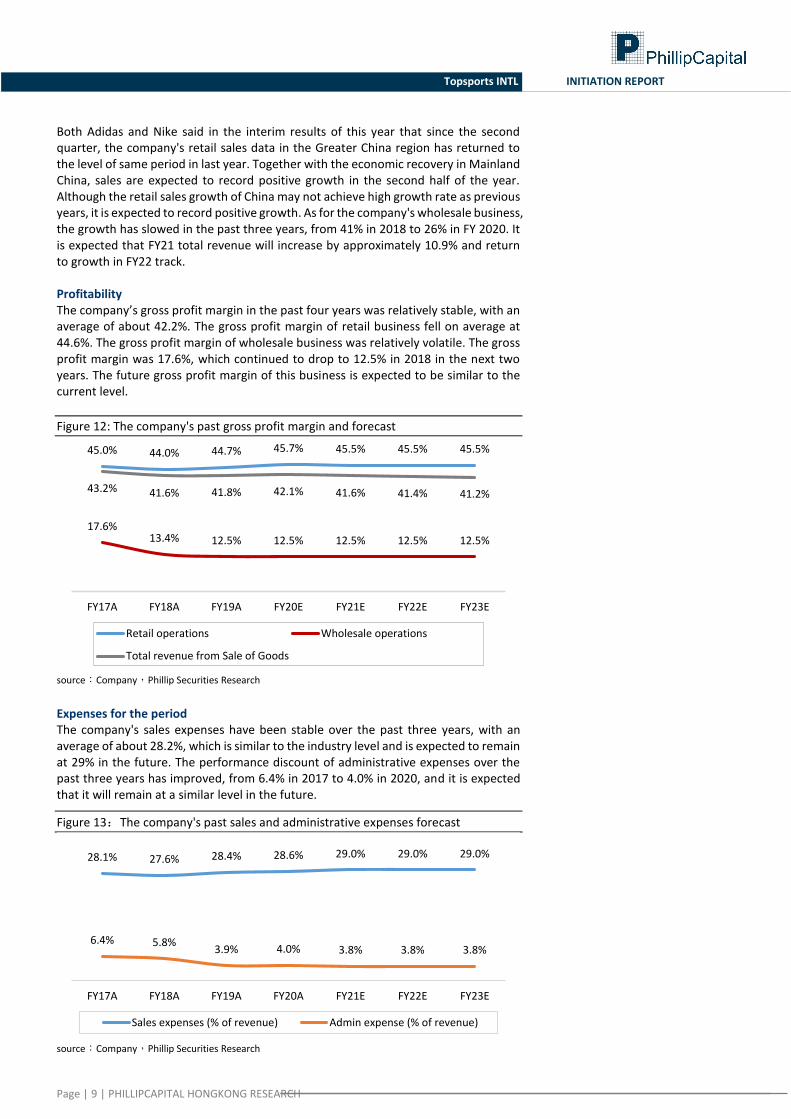
Single-brand stores enable the company to provide services to consumers seeking a specific brand shopping experience. At the same time, the company also opens theme stores with specific sports as the theme. In April 2019, the company was authorized by the NBA to open the largest NBA store outside North America (the “NBA Beijing Flagship Store”) in Beijing, covering an area of more than 1,000 square meters. In addition to the collection of NBA officially licensed products produced by more than ten different brands, the store also creates a shopping experience for NBA fans through in-store design and store activities, and opens up new business models.
Page | 8 | PHILLIPCAPITAL HONGKONG RESEARCH
Topsports INTL INITIATION REPORT
Figure 10: NBA Beijing flagship store operated by the company
Source: Google, Phillip Securities Research
Topsports not only provides retail services for the two major brands. With its years of marketing experience in China, the company also provides product design feedback to Nike and adidas to help them better cater to the Chinese market. Topsports is currently the only domestic retailer that contact with Nike's global headquarters regularly to share the company's observations on macro market trends. Through regular conversation with the management of brand partners in Greater China, the company can give advices brand partners on product design, product line and brand positioning strategies, and establish more cooperation models with partners. Nike and Adidas have successively listed China as their target market and put forward a strategy for developing China's deeply penetrating market. It is expected that Topsports will continue to benefit from the brand's development in the Chinese market.
Financial Analysis
Revenue analysis The company's revenue has increased year-on-year in the past four years, increasing at a compound annual growth rate of 15.8%, from RMB 21.69 billion in 2017 to RMB 33.69 billion in 2020. Since the beginning of 2020, the outbreak of new crown pneumonia in mainland China, many merchants closed in the first quarter of this year, which also affected the company’s retail business. During the fiscal year 2016 to the fiscal year 2019, the average growth of the retail business was about 22%. The growth of the retail business for the year was flat in fiscal 2019.
Figure 11:The company's past revenue and future forecast (million RMB)
source:Company,Phillip Securities Research
19,711 23,804
28,974 29,171 32,088
38,506
46,207
1,787 2,517
3,357 4,223
5,278
6,598
8,247
FY17A FY18A FY19A FY20A FY21E FY22E FY23E
Sales of Goods Concessinoaire Fee Income and Others
Page | 9 | PHILLIPCAPITAL HONGKONG RESEARCH
Topsports INTL INITIATION REPORT
Both Adidas and Nike said in the interim results of this year that since the second quarter, the company's retail sales data in the Greater China region has returned to the level of same period in last year. Together with the economic recovery in Mainland China, sales are expected to record positive growth in the second half of the year. Although the retail sales growth of China may not achieve high growth rate as previous years, it is expected to record positive growth. As for the company's wholesale business, the growth has slowed in the past three years, from 41% in 2018 to 26% in FY 2020. It is expected that FY21 total revenue will increase by approximately 10.9% and return to growth in FY22 track. Profitability The company’s gross profit margin in the past four years was relatively stable, with an average of about 42.2%. The gross profit margin of retail business fell on average at 44.6%. The gross profit margin of wholesale business was relatively volatile. The gross profit margin was 17.6%, which continued to drop to 12.5% in 2018 in the next two years. The future gross profit margin of this business is expected to be similar to the current level.
Figure 12: The company's past gross profit margin and forecast .
source:Company,Phillip Securities Research
Expenses for the period The company's sales expenses have been stable over the past three years, with an average of about 28.2%, which is similar to the industry level and is expected to remain at 29% in the future. The performance discount of administrative expenses over the past three years has improved, from 6.4% in 2017 to 4.0% in 2020, and it is expected that it will remain at a similar level in the future.
Figure 13:The company's past sales and administrative expenses forecast
source:Company,Phillip Securities Research
45.0% 44.0% 44.7% 45.7% 45.5% 45.5% 45.5%
17.6%13.4% 12.5% 12.5% 12.5% 12.5% 12.5%
43.2% 41.6% 41.8% 42.1% 41.6% 41.4% 41.2%
FY17A FY18A FY19A FY20E FY21E FY22E FY23E
Retail operations Wholesale operations
Total revenue from Sale of Goods
28.1% 27.6% 28.4% 28.6% 29.0% 29.0% 29.0%
6.4% 5.8%3.9% 4.0% 3.8% 3.8% 3.8%
FY17A FY18A FY19A FY20A FY21E FY22E FY23E
Sales expenses (% of revenue) Admin expense (% of revenue)

Page | 10 | PHILLIPCAPITAL HONGKONG RESEARCH
Topsports INTL INITIATION REPORT
Company valuation In the past, the company continued to maintain a good cooperative relationship with Nike and adidas. Facing the impact of e-commerce on the retail industry, the company improved its stores to provide customers with unique consumer experiences that e-commerce cannot provide, such as holding theme events, etc. The impact of the COVID-19 on the company’s revenue has been mainly reflected in the FY20 annual report. In addition, Nike and adidas both stated that their revenue in the Greater China region had been flat in the second quarter and began to grow in May. The company’s revenue is expected to be Respond quickly after the epidemic. Anta Sports, Li Ning, and Pou Sheng International, which also focus on functional apparel in Hong Kong stocks, have an average P/E of 31.03x. Because the company's main business is brand retailers, the future revenue growth potential may not be as good as the company with its own sports brands. We expect the company's earnings per share in 2021/2022 to be RMB 41.80/47.92 cent. The target price of $11.61 HKD corresponds to P/E of 25.00x /21.81x in FY21/FY22. (Closing Price as at 12 August) Risk 1) The impact of COVID-19 continues 2) Business relies on two major brands 3) The conflict between US and China Peer Comparison
source: Bloomberg, Phillip Securities Research
TTM 2020 2021 TTM 2020 2021
(BASE) (HKD 'mn)
ANTA SPORTS 2020 HK equity 77.60 209,754 35.0x 35.5x 24.5x 9.4x 7.8x 6.3x
SHENZHOU INTL 2313 HK equity 105.40 158,440 27.9x 29.2x 23.8x 5.6x 5.1x 4.6x
LI NING 2331 HK equity 28.85 71,385 41.8x 41.2x 30.5x 8.3x 7.6x 6.3x
POU SHENG INT'L 3813 HK equity 1.70 9,107 9.6x 17.3x 7.2x 1.1x 1.0x 0.9x
JD Sports JD/ LN equity 703.60 69,254 27.8x 20.6x 61.7x 5.6x 6.3x 4.8x
Foot Locker, Inc. FL US equity 29.63 24,479 11.4x 6.2x 18.7x 1.4x 1.3x 1.2x
Nike Inc NKE US equity 105.41 1,270,900 59.1x 46.0x 45.3x 20.3x 20.7x 20.7x
adidas AG ADS GY equity 263.30 472,700 90.5x 98.0x 29.6x 8.1x 7.1x 6.3x
Average 37.9x 36.8x 30.2x 7.5x 7.1x 6.4x
TOPSPORTS 6110 HK equity 10.06 62,384 22.1x 21.7x 22.8x 5.3x 5.6x 4.7x
P/BCompany Stock Code CP Mkt Cap
P/E
Page | 11 | PHILLIPCAPITAL HONGKONG RESEARCH
Topsports INTL INITIATION REPORT
source: Phillip Securities Research
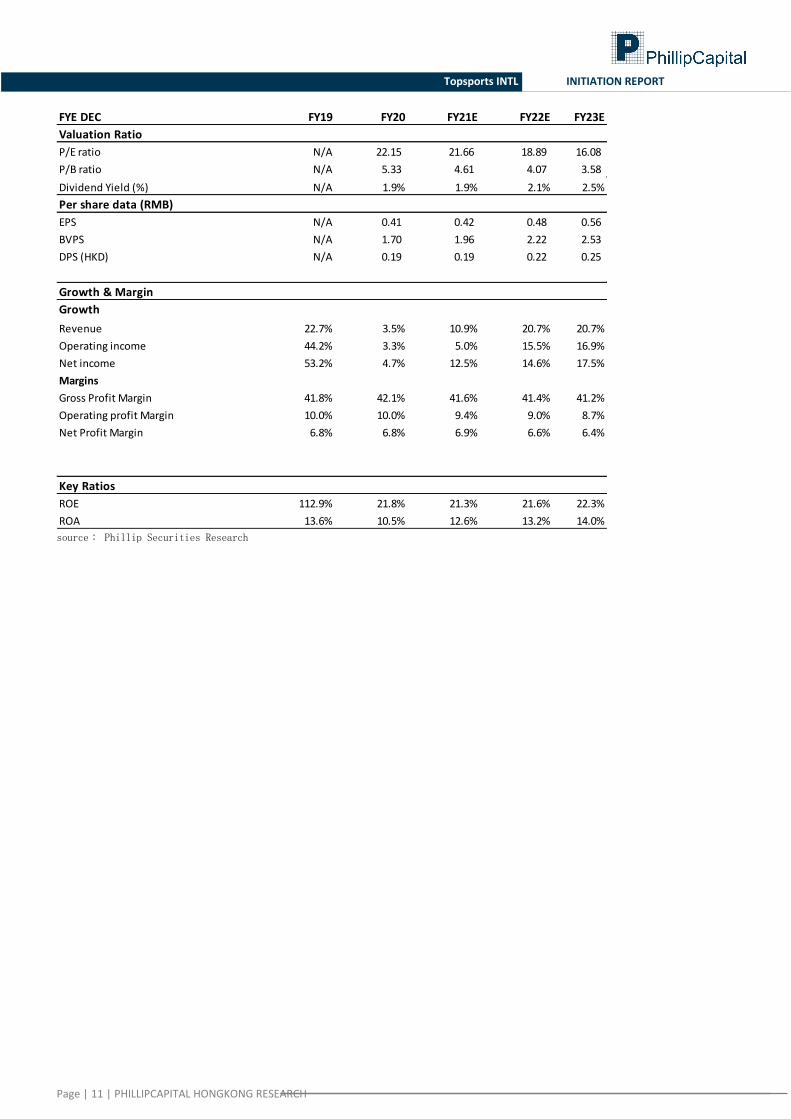
FYE DEC FY19 FY20 FY21E FY22E FY23E
Valuation Ratio
P/E ratio N/A 22.15 21.66 18.89 16.08
P/B ratio N/A 5.33 4.61 4.07 3.58
Dividend Yield (%) N/A 1.9% 1.9% 2.1% 2.5%
Per share data (RMB)
EPS N/A 0.41 0.42 0.48 0.56
BVPS N/A 1.70 1.96 2.22 2.53
DPS (HKD) N/A 0.19 0.19 0.22 0.25
Growth & Margin
Growth
Revenue 22.7% 3.5% 10.9% 20.7% 20.7%
Operating income 44.2% 3.3% 5.0% 15.5% 16.9%
Net income 53.2% 4.7% 12.5% 14.6% 17.5%
Margins
Gross Profit Margin 41.8% 42.1% 41.6% 41.4% 41.2%
Operating profit Margin 10.0% 10.0% 9.4% 9.0% 8.7%
Net Profit Margin 6.8% 6.8% 6.9% 6.6% 6.4%
Key Ratios
ROE 112.9% 21.8% 21.3% 21.6% 22.3%
ROA 13.6% 10.5% 12.6% 13.2% 14.0%
Page | 12 | PHILLIPCAPITAL HONGKONG RESEARCH
Topsports INTL INITIATION REPORT
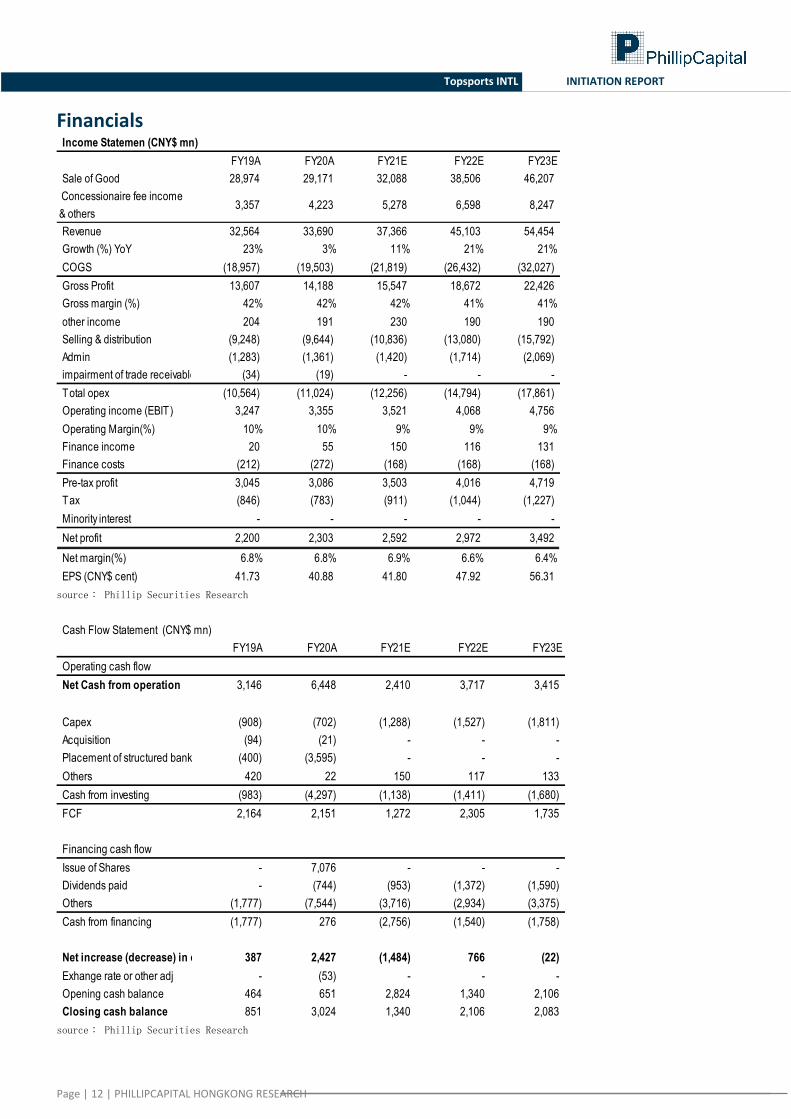
Financials
source: Phillip Securities Research
source: Phillip Securities Research
Income Statemen (CNY$ mn)
FY19A FY20A FY21E FY22E FY23E
Sale of Good 28,974 29,171 32,088 38,506 46,207
Concessionaire fee income
& others3,357 4,223 5,278 6,598 8,247
Revenue 32,564 33,690 37,366 45,103 54,454
Growth (%) YoY 23% 3% 11% 21% 21%
COGS (18,957) (19,503) (21,819) (26,432) (32,027)
Gross Profit 13,607 14,188 15,547 18,672 22,426
Gross margin (%) 42% 42% 42% 41% 41%
other income 204 191 230 190 190
Selling & distribution (9,248) (9,644) (10,836) (13,080) (15,792)
Admin (1,283) (1,361) (1,420) (1,714) (2,069)
impairment of trade receivable (34) (19) - - -
Total opex (10,564) (11,024) (12,256) (14,794) (17,861)
Operating income (EBIT) 3,247 3,355 3,521 4,068 4,756
Operating Margin(%) 10% 10% 9% 9% 9%
Finance income 20 55 150 116 131
Finance costs (212) (272) (168) (168) (168)
Pre-tax profit 3,045 3,086 3,503 4,016 4,719
Tax (846) (783) (911) (1,044) (1,227)
Minority interest - - - - -
Net profit 2,200 2,303 2,592 2,972 3,492
Net margin(%) 6.8% 6.8% 6.9% 6.6% 6.4%
EPS (CNY$ cent) 41.73 40.88 41.80 47.92 56.31
Cash Flow Statement (CNY$ mn)
FY19A FY20A FY21E FY22E FY23E
Operating cash flow
Net Cash from operation 3,146 6,448 2,410 3,717 3,415
Capex (908) (702) (1,288) (1,527) (1,811)
Acquisition (94) (21) - - -
Placement of structured bank deposit (400) (3,595) - - -
Others 420 22 150 117 133
Cash from investing (983) (4,297) (1,138) (1,411) (1,680)
FCF 2,164 2,151 1,272 2,305 1,735
Financing cash flow
Issue of Shares - 7,076 - - -
Dividends paid - (744) (953) (1,372) (1,590)
Others (1,777) (7,544) (3,716) (2,934) (3,375)
Cash from financing (1,777) 276 (2,756) (1,540) (1,758)
Net increase (decrease) in cash 387 2,427 (1,484) 766 (22)
Exhange rate or other adj - (53) - - -
Opening cash balance 464 651 2,824 1,340 2,106
Closing cash balance 851 3,024 1,340 2,106 2,083

Page | 13 | PHILLIPCAPITAL HONGKONG RESEARCH
Topsports INTL INITIATION REPORT
source: Phillip Securities Research (Closing Price as at 12 August)
Balance Sheet (CNY$ mn)
FY19A FY20A FY21E FY22E FY23E
Total non-current assets 6,056 6,659 6,874 7,128 7,430
Restricted Bank deposits 2,518 1,487 2,252 2,719 3,282
Accounts Receivable 52 - - - -
Inventory 6,139 6,649 6,576 7,024 8,511
Cash 651 2,824 1,340 2,106 2,083
Other Short Term Asset 802 4,417 3,595 3,595 3,595
Total current asset 10,161 15,376 13,763 15,443 17,472
Total Assets 16,216 22,035 20,636 22,571 24,901
Liabilities
Current Liabilities
Accounts Payable 642 1,106 956 1,159 1,404
Tax Payable 402 820 911 1,044 1,227
Bank and other borrowing 1,300 2,400 2,400 2,400 2,400
other Liabilities 9,495 4,573 1,593 1,593 1,593
11,839 8,899 5,860 6,196 6,624
Non-current Liabilities 2,428 2,593 2,593 2,593 2,593
Total Liabilities 14,268 11,492 8,453 8,789 9,217
Shareholder's Equity
Equity Capital - 0 0 0 0
Retained Earnings 491 1,950 3,589 5,189 7,091
Reserves 1,458 8,593 8,593 8,593 8,593
Shareholder's Equity 1,949 10,543 12,183 13,782 15,684
Total Liabilities & Shareholder's Equity16,216 22,035 20,636 22,571 24,901
Page | 14 | PHILLIPCAPITAL HONGKONG RESEARCH
CMGE Initial Coverage
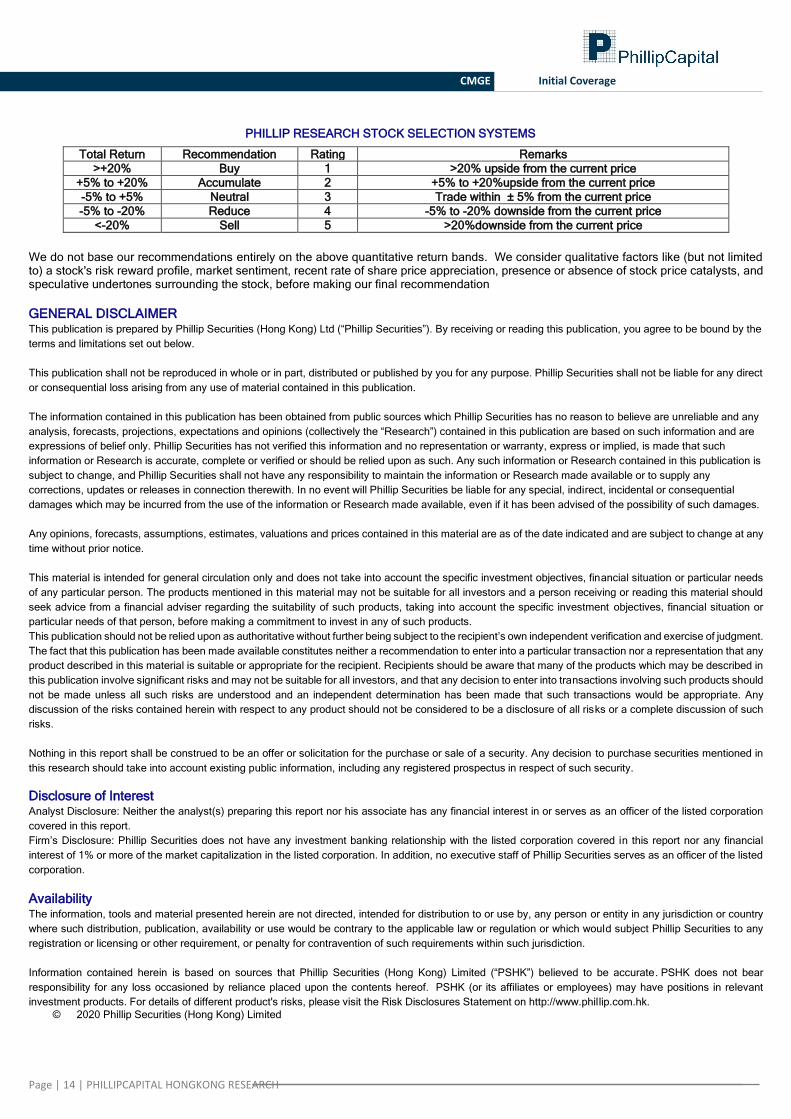
PHILLIP RESEARCH STOCK SELECTION SYSTEMS
We do not base our recommendations entirely on the above quantitative return bands. We consider qualitative factors like (but not limited to) a stock's risk reward profile, market sentiment, recent rate of share price appreciation, presence or absence of stock price catalysts, and speculative undertones surrounding the stock, before making our final recommendation
GENERAL DISCLAIMER
This publication is prepared by Phillip Securities (Hong Kong) Ltd (“Phillip Securities”). By receiving or reading this publication, you agree to be bound by the
terms and limitations set out below.
This publication shall not be reproduced in whole or in part, distributed or published by you for any purpose. Phillip Securities shall not be liable for any direct
or consequential loss arising from any use of material contained in this publication.
The information contained in this publication has been obtained from public sources which Phillip Securities has no reason to believe are unreliable and any
analysis, forecasts, projections, expectations and opinions (collectively the “Research”) contained in this publication are based on such information and are
expressions of belief only. Phillip Securities has not verified this information and no representation or warranty, express or implied, is made that such
information or Research is accurate, complete or verified or should be relied upon as such. Any such information or Research contained in this publication is
subject to change, and Phillip Securities shall not have any responsibility to maintain the information or Research made available or to supply any
corrections, updates or releases in connection therewith. In no event will Phillip Securities be liable for any special, indirect, incidental or consequential
damages which may be incurred from the use of the information or Research made available, even if it has been advised of the possibility of such damages.
Any opinions, forecasts, assumptions, estimates, valuations and prices contained in this material are as of the date indicated and are subject to change at any
time without prior notice.
This material is intended for general circulation only and does not take into account the specific investment objectives, financial situation or particular needs
of any particular person. The products mentioned in this material may not be suitable for all investors and a person receiving or reading this material should
seek advice from a financial adviser regarding the suitability of such products, taking into account the specific investment objectives, financial situation or
particular needs of that person, before making a commitment to invest in any of such products.
This publication should not be relied upon as authoritative without further being subject to the recipient’s own independent verification and exercise of judgment.
The fact that this publication has been made available constitutes neither a recommendation to enter into a particular transaction nor a representation that any
product described in this material is suitable or appropriate for the recipient. Recipients should be aware that many of the products which may be described in
this publication involve significant risks and may not be suitable for all investors, and that any decision to enter into transactions involving such products should
not be made unless all such risks are understood and an independent determination has been made that such transactions would be appropriate. Any
discussion of the risks contained herein with respect to any product should not be considered to be a disclosure of all risks or a complete discussion of such
risks.
Nothing in this report shall be construed to be an offer or solicitation for the purchase or sale of a security. Any decision to purchase securities mentioned in
this research should take into account existing public information, including any registered prospectus in respect of such security.
Disclosure of Interest Analyst Disclosure: Neither the analyst(s) preparing this report nor his associate has any financial interest in or serves as an officer of the listed corporation
covered in this report.
Firm’s Disclosure: Phillip Securities does not have any investment banking relationship with the listed corporation covered in this report nor any financial
interest of 1% or more of the market capitalization in the listed corporation. In addition, no executive staff of Phillip Securities serves as an officer of the listed
corporation.
Availability The information, tools and material presented herein are not directed, intended for distribution to or use by, any person or entity in any jurisdiction or country
where such distribution, publication, availability or use would be contrary to the applicable law or regulation or which would subject Phillip Securities to any
registration or licensing or other requirement, or penalty for contravention of such requirements within such jurisdiction.
Information contained herein is based on sources that Phillip Securities (Hong Kong) Limited (“PSHK”) believed to be accurate. PSHK does not bear
responsibility for any loss occasioned by reliance placed upon the contents hereof. PSHK (or its affiliates or employees) may have positions in relevant
investment products. For details of different product's risks, please visit the Risk Disclosures Statement on http://www.phillip.com.hk.
© 2020 Phillip Securities (Hong Kong) Limited
Total Return Recommendation Rating Remarks
>+20% Buy 1 >20% upside from the current price
+5% to +20% Accumulate 2 +5% to +20%upside from the current price
-5% to +5% Neutral 3 Trade within ± 5% from the current price
-5% to -20% Reduce 4 -5% to -20% downside from the current price
<-20% Sell 5 >20%downside from the current price
Page | 15 | PHILLIPCAPITAL HONGKONG RESEARCH
CMGE Initial Coverage
Contact Information (Regional Member Companies)
SINGAPORE
Phillip Securities Pte Ltd
250 North Bridge Road, #06-00 Raffles City Tower,
Singapore 179101
Tel : (65) 6533 6001 Fax: (65) 6535 3834
www.phillip.com.sg
MALAYSIA
Phillip Capital Management Sdn Bhd
B-3-6 Block B Level 3, Megan Avenue II,
No. 12, Jalan Yap Kwan Seng, 50450 Kuala Lumpur
Tel (60) 3 2162 8841 Fax (60) 3 2166 5099
www.poems.com.my
JAPAN
Phillip Securities Japan, Ltd
4-2 Nihonbashi Kabutocho, Chuo-ku
Tokyo 103-0026
Tel: (81) 3 3666 2101 Fax: (81) 3 3664 0141
www.phillip.co.jp
INDONESIA
PT Phillip Securities Indonesia
ANZ Tower Level 23B, Jl Jend Sudirman Kav 33A,
Jakarta 10220, Indonesia
Tel (62) 21 5790 0800 Fax: (62) 21 5790 0809
www.phillip.co.id
CHINA
Phillip Financial Advisory (Shanghai) Co. Ltd.
No 436 Heng Feng Road, Green Tech Tower Unit 604
Shanghai 200 070
Tel (86) 21 5169 9400 Fax: (86) 21 6091 1155
www.phillip.com.cn
INDIA
PhillipCapital (India) Private Limited
No. 1, 18th Floor, Urmi Estate, 95 Ganpatrao Kadam Marg,
Lower Parel West, Mumbai 400013
Tel: (9122) 2300 2999 Fax: (9122) 6667 9955
www.phillipcapital.in
THAILAND
Phillip Securities (Thailand) Public Co. Ltd.
15th Floor, Vorawat Building, 849 Silom Road,
Silom, Bangrak, Bangkok 10500 Thailand
Tel (66) 2 2268 0999 Fax: (66) 2 2268 0921
www.phillip.co.th
FRANCE
King & Shaxson Capital Ltd.
3rd Floor, 35 Rue de la Bienfaisance
75008 Paris France
Tel (33) 1 4563 3100 Fax : (33) 1 4563 6017
www.kingandshaxson.com
UNITED KINGDOM
King & Shaxson Ltd.
6th Floor, Candlewick House, 120 Cannon Street
London, EC4N 6AS
Tel (44) 20 7929 5300 Fax: (44) 20 7283 6835
www.kingandshaxson.com
UNITED STATES
Phillip Futures Inc.
141 W Jackson Blvd Ste 3050
The Chicago Board of Trade Building
Chicago, IL 60604 USA
Tel (1) 312 356 9000 Fax: (1) 312 356 9005
AUSTRALIA
PhillipCapital Australia
Level 10, 330 Collins Street
Melbourne VIC 3000 Australia
Tel: (61) 3 9618 8238 Fax: (61) 3 9200 2277
www.phillipcapital.com.au
SRI LANKA
Asha Phillip Securities Limited
Level 4, Millennium House, 46/58 Navam Mawatha,
Colombo 2, Sri Lanka
Tel: (94) 11 2429 100 Fax: (94) 11 2429 199
www.ashaphillip.net/home.htm
HONG KONG
Phillip Securities (HK) Ltd
11/F United Centre 95 Queensway Hong Kong
Tel (852) 2277 6600 Fax: (852) 2868 5307
www.phillip.com.hk