Embed Size (px)
Citation preview

September 2004 04/19/WQPC-SWP EPA/600/R-04/182
Environmental Technology Verification Report
Reduction of Nitrogen in Domestic Wastewater from Individual Residential Homes
BioConcepts, Inc. ReCip® RTS ~ 500 System
Prepared by
NSF International
Under a Cooperative Agreement with U.S. Environmental Protection Agency

THE ENVIRONMENTAL TECHNOLOGY VERIFICATION PROGRAM
U.S. Environmental NSF International Protection Agency
ETV Joint Verification Statement
TECHNOLOGY TYPE: BIOLOGICAL WASTEWATER TREATMENT – NITRIFICATION AND DENITRIFICATION FOR NITROGEN REDUCTION
APPLICATION: REDUCTION OF NITROGEN IN DOMESTIC WASTEWATER FROM INDIVIDUAL RESIDENTIAL HOMES
TECHNOLOGY NAME: RECIP® RTS ~ 500 SYSTEM
COMPANY: BIOCONCEPTS, INC.
ADDRESS:
EMAIL:
P.O. BOX 885 ORIENTAL, NC 28571-0885 [email protected]
PHONEFAX:
: (252) 249-1376 (707) 598 7615
NSF International (NSF) operates the Water Quality Protection Center (WQPC) under the U.S. Environmental Protection Agency’s Environmental Technology Verification (ETV) Program. The WQPC evaluated the performance of the BioConcepts Inc., ReCip® RTS ~ 500 System (ReCip®) for nitrogen removal in residential applications. This verification statement provides a summary of the test results for the ReCip®. The Barnstable County [Massachusetts] Department of Health and Environment (BCDHE) performed the verification testing.
The U.S. Environmental Protection Agency (EPA) created the ETV Program to facilitate deployment of innovative or improved environmental technologies through performance verification and dissemination of information. The goal of the ETV program is to further environmental protection by accelerating the acceptance and use of improved and cost-effective technologies. ETV seeks to achieve this goal by providing high quality, peer-reviewed data on technology performance to those involved in the design, distribution, permitting, purchase, and use of environmental technologies.
ETV works in partnership with recognized standards and testing organizations, stakeholder groups consisting of buyers, vendor organizations, and permitters, and the full participation of individual technology developers. The program evaluates the performance of innovative technologies by developing test plans that are responsive to the needs of stakeholders, conducting field or laboratory tests (as appropriate), collecting and analyzing data, and preparing peer-reviewed reports. All evaluations are conducted in accordance with rigorous quality assurance protocols to ensure that data of known and verifiable quality are generated, and that the results are defensible.
04/19/WQPC-SWP The accompanying notice is an integral part of this verification statement. September 2004 VS-i

ABSTRACT
Verification testing of the ReCip® was conducted over a 12-month period at the Massachusetts Alternative Septic System Test Center (MASSTC) located on Otis Air National Guard Base in Bourne, Massachusetts. A nine-week startup period preceded the verification test to provide time for the development of an acclimated biological growth. The verification test included monthly sampling of influent and effluent wastewater, and five test sequences designed to test the unit’s response to differing load conditions and power failure. The ReCip® proved capable of removing nitrogen from the wastewater. Over the verification period, the total nitrogen (TN) concentration in the influent averaged 36 mg/L and the TN in the effluent averaged 15 mg/L.
TECHNOLOGY DESCRIPTION
The following technology description is provided by the vendor and does not represent verified information.
The ReCip® uses a filter medium contained in two adjacent, equally dimensioned cells. The medium provides a surface for microbes to attach, live, and grow. Timers on each of two reciprocating pumps control the process. BioConcepts Inc. describes the basic treatment processes as follows: at the start of the cycle, the first cell of the ReCip® unit is filled nearly to the top with wastewater. The pump located in the cell then pumps the liquid into the second cell, until the first cell is nearly empty. As the liquid leaves the first cell, the void space formerly occupied by the liquid fills with air from the vent system, exposing the medium to atmospheric oxygen contained in the air. At this point, the second cell is nearly full and the first cell is nearly empty. The two cells remain in this state for a time before the second cell’s pump sends the liquid back to the first cell, drawing air into the second cell. Wastewater that clings to the medium contains nutrients and organics, which are oxidized by bacteria (biofilm) that are exposed to the air. The bacteria live and grow on the medium. In the presence of oxygen, organic matter is converted to carbon dioxide and water, and ammonia nitrogen (NH3-N) is converted to nitrate nitrogen (NO3
-). Anaerobic decomposition of the contaminants continues in the wastewater that is not exposed to air (at the very bottom of the cells), converting the NO3
- to nitrogen gas. The two cells continue to fill and drain, with rest periods between the cycles, until additional wastewater flows into the first cell. When the capacity of the first cell is met, its contents are pumped into the second cell. The excess volume exits the overflow of the second cell as treated effluent. As an example, if the rated capacity of the tanks is 500 gallons and one extra gallon enters the system, a gallon of treated effluent will exit cell number two.
A basic residential ReCip® wastewater treatment system includes: (1) a standard septic tank to provide solids separation and primary treatment; (2) a ReCip® unit to provide secondary and tertiary treatment for the septic tank effluent; and (3) a tile field or other system for final disposal of treated effluent.
VERIFICATION TESTING DESCRIPTION
Test Site The MASSTC site is located on the Otis Air National Guard Base in Bourne, Massachusetts. The site uses domestic wastewater from the base’s residential housing, and sanitary wastewater from other military buildings. Raw wastewater, after passing through a one-inch bar screen, is pumped to a dosing channel at the test site. This channel is equipped with four recirculation pumps spaced along the channel length to ensure mixing, such that the wastewater is of similar quality at all locations along the channel. Wastewater is dosed to the test unit using a pump submerged in the dosing channel. A programmable logic controller (PLC) is used to control the pumps and the dosing sequence or cycle.
04/19/WQPC-SWP The accompanying notice is an integral part of this verification statement. September 2004 VS-ii

Methods and Procedures The ReCip® was installed by a contractor, in conjunction with the BCDHE support team, in August 2002. An existing 1,500-gallon septic tank was used for the verification test. On October 29, 2002, the primary tank was filled with wastewater and the dosing sequence began. The ReCip® unit had a design capacity of 500 gallons per day. The verification test was designed to load the system at design capacity (±10 percent) for the startup period as well as the entire 12-month test, except during the low load and vacation stress tests. The system was dosed 15 times per day with approximately 33.3 gallons of wastewater per dose, receiving five doses in the morning, four doses mid-day, and six doses in the evening. The dosing volume was controlled by the dosing-pump run time for each cycle and was checked and calibrated twice weekly.
A startup period allowed the biological community to become established and the operating conditions to be monitored. The verification test consisted of a 12-month test period, incorporating five sequences with varying stress conditions simulating real household conditions. The five stress sequences, performed at two-month intervals, included washday, working parent, low load, power/equipment failure, and vacation test sequences. Monitoring for nitrogen reduction was determined by measurement of nitrogen species [total Kjeldahl nitrogen (TKN), NH3-N, nitrite (NO2
-), and NO3-]. Biochemical and carbonaceous
biochemical oxygen demand (BOD5/CBOD5) and other basic parameters [pH, alkalinity, total suspended solids (TSS), and temperature] were also monitored. Operational characteristics, such as electric use, labor to perform maintenance, maintenance tasks, durability of the hardware, and noise and odor production, were also evaluated.
Twenty-four-hour flow-weighted composite samples of the influent and effluent wastewater were collected once per month under normal operating conditions and more frequently following stress tests, as well as at the end of the verification test. Grab samples were collected each sampling day to monitor the system pH, dissolved oxygen, and temperature.
All analyses were performed in accordance with EPA-approved methods or according to the methods in Standard Methods for the Examination of Water and Wastewater, 19th Edition. An established QA/QC program was used to monitor field sampling and laboratory analytical procedures. QA/QC requirements included field duplicates, laboratory duplicates and spiked samples, and appropriate equipment/instrumentation calibration procedures. Details of all test procedures, analytical methods, and QA/QC procedures are provided in the verification report.
PERFORMANCE VERIFICATION
Overview Evaluation of the ReCip® began on October 29, 2002, when the ReCip® pumps and the initial dosing cycles were activated. Five samples of influent and effluent were collected during the startup period. Verification testing began on January 1, 2003 and continued for twelve months, until December 21, 2003. During the verification test, 53 sets of samples of influent and effluent were collected to measure system performance.
Startup The installation instructions were easy to follow, and installation proceeded without difficulty. The unit started with no mechanical difficulty. The initial timer setting was the default value of a two-hour rest period between pump cycles. Near the end of the startup, BioConcepts changed the timer setting to provide a one-hour rest period, thus increasing the number of pumping cycles per day. At the end of the nine-week start-up, effluent CBOD5 was 43 mg/L and TSS was 22 mg/L. The influent TN concentration was 37 mg/L, and the effluent TN concentration was 30 mg/L.
04/19/WQPC-SWP The accompanying notice is an integral part of this verification statement. September 2004 VS-iii

Verification Test Results The standard dosing sequence was performed daily from January 1, 2003 through December 21, 2003, except during certain stress periods. Following completion of the 12-month verification test, the unit continued in operation at the same dosing levels and settings for four additional months, January through April 2004. Volume per dose and total daily volume varied only slightly during the verification test. All monthly average doses and volumes met the requirement of being within ±10 percent of the target.
At the start of the verification test, the pump timer was reset to provide a two-hour rest period between pump cycles. On January 22, 2003, the rest period was changed to one hour. BioConcepts requested this change to improve system performance by introducing additional air (oxygen) to the unit by increasing the number of pump cycles between the cells. The pump timer setting of one-hour rest periods between cell wastewater transfers remained constant from January 22, 2003 to August 11, 2003. At that time, it was reset to provide a half-hour rest period, at BioConcept’s request.
The TSS and BOD5/CBOD5 results for the verification test, including all stress test periods, are shown in Table 1.
Table 1. BOD5/CBOD5 and TSS Data Summary
BOD5 CBOD5 TSS Influent Effluent Percent Influent Effluent Percent (mg/L) (mg/L) Removal (mg/L) (mg/L) Removal
Mean 200 28 86 130 13 90 Median 190 26 87 130 12 91 Maximum 360 67 >99 230 28 95 Minimum 98 <2 68 82 6 74 Std. Dev. 52 14 6.8 32 4.7 4.7
Note: The data in Table 1 are based on 53 samples.
The nitrogen results for the verification test, including all stress test periods, are shown in Table 2. The ReCip® showed a mean TN reduction of 58 percent, with a mean NH3-N removal of 57 percent.
Table 2. Nitrogen Data Summary
TKN NH3-N TN NO3- NO2
(mg/L) (mg/L) (mg/L) (mg/L) (mg/L) Influent Effluent Influent Effluent Influent Effluent Effluent Effluent
Mean 36 13 23 10 36 15 1.7 0.18 Median 36 14 23 10 36 15 1.8 0.19 Maximum 44 27 35 18 44 27 11 0.86 Minimum 24 5.4 15 3.4 24 3.0 <0.10 <0.05 Std. Dev. 4.1 4.7 3.1 4.0 4.1 4.2 2.5 0.19 Note: The TKN, effluent NH3-N and influent TN data in Table 2 are based on 52 samples. The influent NH3-N data are based on 51 samples. The effluent TN, NO3
- and NO2- data are based on 53 samples.
Verification Test Discussion At the beginning of the verification test, TN removal was 29 percent and NH3-N removal was 14 percent. Following the January 22, 2003 timer change, performance began to improve. TN removal reached 50 percent by February. NH3-N removal increased more slowly, reaching 50 percent removal in mid-April 04/19/WQPC-SWP The accompanying notice is an integral part of this verification statement. September 2004
VS-iv

when wastewater temperatures also increased. TN, TKN, and NH3-N removals all improved as the test continued. NH3-N removal reached 80 percent by November 2003, following the August 11, 2003 timer change.
The washday (February 18 to 22) and working parent (April 22 to 26) stress tests did not negatively impact nitrogen removal. In fact, NH3-N removal and TN removal improved in the post-stress-test monitoring periods. The low load stress test, during which the hydraulic loading (250 gpd) of the ReCip®
was half of design loading, began on July 2 and ended on July 22. NH3-N, TKN, and TN removal all decreased during the post-low-load stress test monitoring, but the ReCip® recovered within the following three weeks. Performance returned to pre-low-load stress test levels, and removal percentages for NH3-N and TN were consistently higher during September 2003 compared to previous periods of the test. The power/equipment failure stress test was conducted from September 16 to 18, and showed no impact on the unit.
The vacation stress test was started on November 18 and continued until November 27. During this period, there was no influent flow to the system for eight days. Lower NH3-N and TKN removals were observed during the last days of the post-stress-test monitoring period. However, performance improved within two weeks. On the first day of post-stress-test monitoring the NO3
- level in the effluent increased to 11 mg/L, the highest level found during the entire verification test, then steadily decreased over the next several days. It is apparent from the increase in NO3
- and corresponding decrease in alkalinity (denitrification produces alkalinity) that something upset the denitrification process. Flow to the unit had returned to normal for nine days following the stress test, so it is not clear if the vacation stress test had a direct impact on the denitrification process. It is more likely that something else caused the decrease in denitrification.
The system performance returned to the same general levels achieved in September and October during the final week of sampling in December 2003, with effluent NH3-N and TKN concentrations of less than 10 mg/L (in the 3.8 to 5.1 mg/L and 7.6 to 9.2 mg/L ranges, respectively). After a peak of 11 mg/L on November 30, 2003, the NO3
- levels improved to between 3.0 and 4.1 mg/L in late December.
Operation and Maintenance Results Noise levels associated with pumps were measured once during the verification period using a decibel meter. Measurements were made one meter from the unit and one and one-half meters above the ground, at 90° intervals in four directions. The noise levels ranged from 78 to 97 decibels with a background noise level of 85 decibels.
Qualitative odor observations based on odor strength (intensity) and type (attribute) were made 13 times during the verification test. Observations were made during periods of low wind velocity (<10 knots), at a distance of three feet from the treatment unit, and recorded at 90° intervals in four directions. There were no discernible odors during the observation periods.
A dedicated electric meter serving the ReCip® was used to monitor electrical use. The average electrical use was 2.7 kilowatts (kW) per day. Electrical use increased or decreased depending on the number of pump cycles per day, as would be expected. The ReCip® did not require or use any chemical addition during normal operation.
The only maintenance performed during the test was cleaning the floats on the pump in cell one. On two occasions, March 1 and August 2, 2003, the pump did not cycle properly. This was caused by the low water shutoff float becoming stuck, preventing the pump from operating. The pump was pulled using the
04/19/WQPC-SWP The accompanying notice is an integral part of this verification statement. September 2004 VS-v

procedures described in the O&M manual. The float was cleaned and the pump was reinstalled. This solved the problem in both cases.
The ReCip® appeared to be of durable design and proved to be durable during the test. The piping and construction materials used in the system meet the application needs. Although pump life is difficult to estimate, the equipment used operated continuously for 17 months.
Quality Assurance/Quality Control NSF International completed QA audits of MASSTC and the BCDHE laboratory during testing. NSF personnel completed a technical systems audit to assure the testing was in compliance with the test plan; a performance evaluation audit to assure that the measurement systems employed by MASSTC and the BCDHE laboratory were adequate to produce reliable data; and a data quality audit of at least 10 percent of the test data to assure that the reported data represented the data generated during testing. In addition to quality assurance audits performed by NSF International, EPA QA personnel conducted a quality systems audit of NSF International's QA Management Program.
Original signed by Sally Gutierrez for Original signed by Lawrence W. Reiter, Ph.D. 09/30/04 Gordon E. Bellen 10/20/04 Lawrence W. Reiter, Ph.D. Date Gordon E. Bellen Date Acting Director Vice President National Risk Management Research Laboratory Research Office of Research and Development NSF International United States Environmental Protection Agency
04/19/WQPC-SWP The accompanying notice is an integral part of this verification statement. September 2004 VS-vi

NOTICE: Verifications are based on an evaluation of technology performance under specific, predetermined criteria and the appropriate quality assurance procedures. EPA and NSF make no expressed or implied warranties as to the performance of the technology and do not certify that a technology will always operate as verified. The end user is solely responsible for complying with any and all applicable federal, state, and local requirements. Mention of corporate names, trade names, or commercial products does not constitute endorsement or recommendation for use of specific products. This report in no way constitutes an NSF Certification of the specific product mentioned herein.
Availability of Supporting Documents Copies of the ETV Protocol for Verification of Residential Wastewater Treatment Technologies for Nutrient Reduction, dated November 2000, the Verification Statement, and the Verification Report are available from the following sources:
1.ETV Water Quality Protection Center Manager (order hard copy) NSF International
P.O. Box 130140 Ann Arbor, Michigan 48113-0140
2.NSF web site: http://www.nsf.org/etv (electronic copy) 3.EPA web site: http://www.epa.gov/etv (electronic copy)
(NOTE: Appendices are not included in the Verification Report. Appendices are available from NSF upon request.)
EPA’s Office of Wastewater Management has published a number of documents to assist purchasers, community planners and regulators in the proper selection, operation and management of onsite wastewater treatment systems. Two relevant documents and their sources are:
1. Handbook for Management of Onsite and Clustered Decentralized Wastewater Treatment Systems http://www.epa.gov/owm/onsite
2. Onsite Wastewater Treatment Systems Manual http://www.epa/gov/owm/mtb/decent/toolbox.htm
04/19/WQPC-SWP The accompanying notice is an integral part of this verification statement. September 2004 VS-vii

Environmental Technology Verification Report
Reduction of Nitrogen in Domestic Wastewater from Individual Residential Homes
BioConcepts, Inc. ReCip® RTS ~ 500
Wastewater Treatment System
Prepared by
NSF International and
Scherger Associates
In cooperation with Barnstable County Department of Health and Environment
Under a cooperative agreement with the U.S. Environmental Protection Agency
Raymond Frederick, Project Officer ETV Water Quality Protection Center
National Risk Management Research Laboratory Water Supply and Water Resources Division
U.S. Environmental Protection Agency Edison, New Jersey 08837
September 2004

Notice
The U.S. Environmental Protection Agency (EPA), through its Office of Research and Development, has financially supported and collaborated with NSF International (NSF) under a Cooperative Agreement. The Water Quality Protection Center, Source Water Protection area, operating under the Environmental Technology Verification (ETV) Program, supported this verification effort. This document has been peer reviewed and reviewed by NSF and EPA and recommended for public release.
ii

Foreword
The U.S. Environmental Protection Agency (EPA) is charged by Congress with protecting the Nation’s land, air, and water resources. Under a mandate of national environmental laws, the Agency strives to formulate and implement actions leading to a compatible balance between human activities and the ability of natural systems to support and nurture life. To meet this mandate, EPA’s research program is providing data and technical support for solving environmental problems today and building a science knowledge base necessary to manage our ecological resources wisely, understand how pollutants affect our health, and prevent or reduce environmental risks in the future.
The National Risk Management Research Laboratory (NRMRL) is the Agency’s center for investigation of technological and management approaches for preventing and reducing risks from pollution that threaten human health and the environment. The focus of the Laboratory’s research program is on methods and their cost-effectiveness for prevention and control of pollution to air, land, water, and subsurface resources; protection of water quality in public water systems; remediation of contaminated sites, sediments and ground water; prevention and control of indoor air pollution; and restoration of ecosystems. NRMRL collaborates with both public and private sector partners to foster technologies that reduce the cost of compliance and to anticipate emerging problems. NRMRL’s research provides solutions to environmental problems by: developing and promoting technologies that protect and improve the environment; advancing scientific and engineering information to support regulatory and policy decisions; and providing the technical support and information transfer to ensure implementation of environmental regulations and strategies at the national, state, and community levels.
This publication has been produced as part of the Laboratory’s strategic long-term research plan. It is published and made available by EPA’s Office of Research and Development to assist the user community and to link researchers with their clients.
iii

Contents
Verification Statement .............................................................................................................. VS-1 Notice.............................................................................................................................................. ii Foreword ........................................................................................................................................ iii Contents ......................................................................................................................................... iv Tables............................................................................................................................................. vi Figures........................................................................................................................................... vii Acknowledgments.......................................................................................................................... ix Chapter 1 Introduction ....................................................................................................................1
1.1 ETV Purpose and Program Operation ............................................................................ 1 1.2 Testing Participants and Responsibilities ....................................................................... 1
1.2.1 NSF International - Verification Organization (VO).............................................. 2 1.2.2 U.S. Environmental Protection Agency.................................................................. 2 1.2.3 Testing Organization............................................................................................... 3 1.2.4 Technology Vendor ................................................................................................ 5 1.2.5 ETV Test Site.......................................................................................................... 5
1.3 Background – Nutrient Reduction .................................................................................. 6 1.3.1 Biological Nitrification ........................................................................................... 6 1.3.2 Biological Denitrification ....................................................................................... 7
Chapter 2 Technology Description and Operating Processes.........................................................9 2.1 Technology Description.................................................................................................. 9 2.2 ReCip® Equipment........................................................................................................ 10 2.3 Installation, Startup, Operation, and Maintenance........................................................ 11 2.4 Vendor Claims .............................................................................................................. 12
Chapter 3 Methods and Test Procedures ......................................................................................14 3.1 Verification Test Plan and Procedures.......................................................................... 14 3.2 MASSTC Test Site Description.................................................................................... 14 3.3 Installation and Startup Procedures .............................................................................. 16
3.3.1 Introduction........................................................................................................... 163.3.2 Objectives ............................................................................................................. 163.3.3 Installation and Startup Procedure ........................................................................ 16
3.4 Verification Testing - Procedures ................................................................................. 17 3.4.1 Introduction........................................................................................................... 173.4.2 Objectives ............................................................................................................. 173.4.3 System Operation - Flow Patterns and Loading Rates ......................................... 17
3.4.3.1 Influent Flow Pattern ........................................................................................ 17 3.4.3.2 Stress Testing Procedures ................................................................................. 18 3.4.3.3 Sampling Locations, Approach, and Frequency ............................................... 19 3.4.3.4 Residuals Monitoring and Sampling................................................................. 22
3.4.4 Analytical Testing and Record Keeping ............................................................... 22 3.4.5 Operation and Maintenance Performance............................................................. 23
3.4.5.1 Electric Use....................................................................................................... 24 3.4.5.2 Chemical Use .................................................................................................... 24 3.4.5.3 Noise ................................................................................................................. 24 3.4.5.4 Odors................................................................................................................. 24
iv

3.4.5.5 Mechanical Components................................................................................... 24 3.4.5.6 Electrical/Instrumentation Components............................................................ 24
Chapter 4 Results and Discussion.................................................................................................26 4.1 Introduction................................................................................................................... 26 4.2 Startup Test Period........................................................................................................ 26
4.2.1 Startup Flow Conditions ....................................................................................... 26 4.2.2 Startup Analytical Results..................................................................................... 27 4.2.3 Startup Operating Conditions ............................................................................... 28
4.3 Verification Test ........................................................................................................... 28 4.3.1 Verification Test - Flow Conditions ..................................................................... 29 4.3.2 BOD5/CBOD5 and Suspended Solids Results ...................................................... 30 4.3.3 Nitrogen Reduction Performance ......................................................................... 37
4.3.3.1 Results............................................................................................................... 37 4.3.3.2 Discussion......................................................................................................... 38
4.3.4 Residuals Results .................................................................................................. 49 4.4 Operation and Maintenance .......................................................................................... 49
4.4.1 Electric Use........................................................................................................... 494.4.2 Chemical Use ........................................................................................................ 50 4.4.3 Noise ..................................................................................................................... 50 4.4.4 Odor Observations ................................................................................................ 50 4.4.5 Operation and Maintenance Observations ............................................................ 51
4.5 Post-Verification Test Data........................................................................................... 53 4.6 Quality Assurance/Quality Control............................................................................... 55
4.6.1 Audits.................................................................................................................... 55 4.6.2 Daily Flows........................................................................................................... 55 4.6.3 Precision................................................................................................................ 55 4.6.4 Accuracy ............................................................................................................... 584.6.5 Representativeness................................................................................................ 60 4.6.6 Completeness ........................................................................................................ 60
Appendices.....................................................................................................................................61 A BioConcepts ReCip® Verification Test Plan .................................................................... 61 B MASSTC Field SOPs ....................................................................................................... 61 C Lab Data and QA/QC Data ............................................................................................... 61 D Field Lab Log Book .......................................................................................................... 61 E Spreadsheets with Calculation and Data Summary .......................................................... 61 F Field Operations Logs....................................................................................................... 61
Glossary .........................................................................................................................................62 References......................................................................................................................................64
v

Tables
Table 3-1. Historical MASSTC Wastewater Data....................................................................... 15 Table 3-2. Sampling Matrix......................................................................................................... 20 Table 3-3. Sampling Schedule for ReCip® .................................................................................. 22 Table 3-4. Summary of Analytical Methods and Precision and Accuracy Requirements........... 23 Table 4-1. Flow Volume Data – Startup Period .......................................................................... 27 Table 4-2. Influent Wastewater Quality – Startup Period ............................................................ 27 Table 4-3. ReCip® Effluent Quality - Startup Period .................................................................. 28 Table 4-4. ReCip® Influent Volume Summary............................................................................ 30 Table 4-5. ReCip® BOD5/CBOD5 and TSS Results .................................................................... 35 Table 4-6. ReCip® Influent and Effluent Nitrogen Data.............................................................. 45 Table 4-7. ReCip® Alkalinity, pH, and Dissolved Oxygen Results............................................. 47 Table 4-8. Summary of ReCip® Electrical Usage (kW/day) ....................................................... 50 Table 4-9. ReCip® Noise Measurements ..................................................................................... 50 Table 4-10. Odor Observations.................................................................................................... 51
............................................................................................................................................... 54 Table 4-11. Post-Verification Test Period Data – CBOD5, TSS, TKN, NH3-N, TN, NO3
-, NO2-
Table 4-12. Post-Verification Test Period Data – Alkalinity, DO, pH........................................ 54 Table 4-13. Acceptance Criteria for Duplicates .......................................................................... 56 Table 4-14. Duplicate Field Sample Summary – Nitrogen Compounds ..................................... 57 Table 4-15. Duplicate Field Sample Summary – CBOD, BOD, Alkalinity, TSS ....................... 57 Table 4-16. Accuracy Results – Nitrogen Analyses .................................................................... 59 Table 4-17. Accuracy Results – Alkalinity, BOD5, CBOD5........................................................ 59
vi

- -
Figures
Figure 2-1. ReCip® general layout............................................................................................... 13 Figure 4-1. ReCip® BOD5/CBOD5 results................................................................................... 33 Figure 4-2. ReCip® total suspended solids results. ...................................................................... 34 Figure 4-3. ReCip® Total Kjeldahl Nitrogen results.................................................................... 40 Figure 4-4. ReCip® ammonia nitrogen results............................................................................. 41 Figure 4-5. ReCip® total nitrogen results..................................................................................... 42 Figure 4-6. ReCip® NO2 and NO3 effluent concentrations. ....................................................... 43 Figure 4-7. ReCip® influent temperature. .................................................................................... 44
vii

Acronyms and Abbreviations
ANSI American National Standards Institute BDCHE Barnstable County Department of Health and the Environment BOD5 Biochemical oxygen demand (five-day) ºC Degrees Celsius (temperature) CBOD5 Carbonaceous biochemical oxygen demand (five-day) COC Chain of custody DO Dissolved oxygen DQI Data quality indicators DQO Data quality objectives EPA (U.S.) Environmental Protection Agency ETV Environmental Technology Verification GAI Groundwater Analytical, Inc. gal Gallons gpd Gallons per day gpm Gallons per minute MASSTC Massachusetts Alternative Septic System Test Center mg/L Milligrams per liter mL Milliliters NIST National Institute of Standards and Technology NH3-N Ammonia nitrogen NO2
- Nitrite nitrogen NO3
- Nitrate nitrogen NSF NSF International NRMRL National Risk Management Research Laboratory O&M Operation and maintenance ORD Office of Research and Development, EPA OSHA Occupational Safety and Health Administration PLC Programmable logic controller QA Quality assurance QAPP Quality assurance project plan QC Quality control QMP Quality management plan ReCip® ReCip® ~ 500 Wastewater Treatment System RPD Relative percent difference SAG Stakeholder Advisory Group SOP Standard operating procedure SWP Source Water Protection Area, Water Quality Protection Center TKN Total Kjeldahl Nitrogen TN Total nitrogen TO Testing organization VO Verification organization VR Verification report VTP Verification test plan WQPC Water Quality Protection Center
viii

Acknowledgments
The Testing Organization (TO), the Barnstable County Department of Health and the Environment, was responsible for all elements in the testing sequence, including collection of samples, calibration and verification of instruments, data collection and analysis, and data management. Mr. George Heufelder was the project manager for the verification test.
Barnstable County Department of Health and the Environment Superior Court House (P.O. Box 427) Barnstable, Massachusetts 02630 (508) 375-6616 Contact: Mr. George Heufelder, Project Manager Email: [email protected]
Scherger Associates assisted with preparation of the verification report.
Scherger Associates 3017 Rumsey Drive Ann Arbor, Michigan 48105 (734) 213-8150 Contact: Mr. Dale A. Scherger Email: [email protected]
The laboratories that conducted the analytical work for this study were:
Barnstable County Health Laboratory Superior Court House (P.O. Box 427) Barnstable, Massachusetts 02630 (508) 375-6605 Contact: Gongmin Lei Email: [email protected]
Groundwater Analytical, Inc. (GAI) 228 Main Street Buzzards Bay, Massachusetts 02532 (508) 759-4441 Contact: Jonathan Sanford www.groundwateranalytical.com
ix

The manufacturer of the equipment is:
BioConcepts, Inc. P.O. Box 885 Oriental, North Carolina 28571 (252) 249-1376 Contact: Al Privette, President Email: [email protected]
The TO wishes to thank NSF International, especially Mr. Thomas Stevens, Project Manager, and Ms. Maren Roush, Project Coordinator, for providing guidance and program management.
x

Chapter 1Introduction
1.1 ETV Purpose and Program Operation
The U.S. Environmental Protection Agency (EPA) has created the Environmental Technology Verification (ETV) Program to facilitate the deployment of innovative or improved environmental technologies through performance verification and dissemination of information. The ETV Program’s goal is to further environmental protection by substantially accelerating the acceptance and use of innovative, improved, and more cost-effective technologies. ETV seeks to achieve this goal by providing high quality, peer-reviewed data on technology performance to those involved in the design, distribution, permitting, purchase, and use of environmental technologies.
ETV works in partnership with recognized standards and testing organizations (TO); stakeholder groups that consist of buyers, vendor organizations, consulting engineers, and regulators; and the full participation of individual technology developers. The program evaluates the performance of innovative technologies by developing test plans that are responsive to the needs of stakeholders, conducting field or laboratory tests (as appropriate), collecting and analyzing data, and preparing peer-reviewed reports. All evaluations are conducted in accordance with rigorous quality assurance protocols to ensure that data of known and adequate quality are generated and that the results are defensible.
In cooperation with EPA, NSF International (NSF) operates the Water Quality Protection Center (WQPC), one of six centers under ETV. Source Water Protection (SWP) is one area within the WQPC. The WQPC-SWP evaluated the performance of the BioConcepts, Inc. ReCip® RTS ~ 500 Wastewater Treatment System (ReCip®) for the reduction of total Kjeldahl nitrogen (TKN), ammonia nitrogen (NH3-N), nitrite nitrogen (NO2
-), and nitrate (NO3-) present in residential
wastewater. BioConcepts, Inc. (BioConcepts) sells the ReCip® to treat wastewater from singlefamily homes. Other BioConcepts models similar to the ReCip® are available for agricultural, residential development, industrial, and similar applications, but this evaluation does not address those models. The ReCip® is designed to work in conjunction with a conventional septic tank system to provide nitrogen reduction in addition to the removal of organics and solids present in these wastewaters. This report provides the verification test results for the ReCip®, in accordance with the ETV Protocol for the Verification of Residential Wastewater Treatment Technologies for Nutrient Reduction, November 2000 (2).
1.2 Testing Participants and Responsibilities
The ETV testing of the ReCip® was a cooperative effort between the following participants:
• NSF International • Massachusetts Alternative Septic System Test Center • Barnstable County Department of Health and Environment Laboratory • Groundwater Analytical, Inc.
1

• Scherger Associates • BioConcepts, Inc. • EPA
1.2.1 NSF International - Verification Organization (VO)
The WQPC of the ETV is administered through a cooperative agreement between EPA and NSF. NSF is the verification partner organization for the WQPC. NSF administers the center, and contracts with the TO to develop and implement the Verification Test Plan (VTP).
NSF’s responsibilities as the VO included:
• reviewing and commenting on the site-specific VTP; • coordinating with peer reviewers to review and comment on the VTP; • coordinating with the EPA Project Manager and the technology vendor to approve
the VTP prior to initiation of verification testing; • reviewing the quality systems of all parties involved with the TO and, subsequently,
qualifying the companies making up the TO; • overseeing the technology evaluation and associated laboratory testing; • conducting an on-site audit of test procedures; • overseeing the development of a verification report and verification statement; • coordinating with EPA to approve the verification report and verification statement;
and, • providing QA/QC review and support for the TO.
Key contacts at NSF for the Verification Organization are:
Mr. Thomas Stevens, Program Manager (734) 769-5347 email: [email protected]
Ms. Maren Roush, Project Coordinator (734) 827-6821 email: [email protected]
NSF International 789 North Dixboro Road Ann Arbor, Michigan 48105 (734) 769-8010
1.2.2 U.S. Environmental Protection Agency
The EPA Office of Research and Development, through the Urban Watershed Management Branch, Water Supply and Water Resources Division, NRMRL, provides administrative, technical, and QA guidance and oversight on all ETV WQPC activities. EPA reviews and approves each phase of the verification project. EPA’s responsibilities with respect to verification testing include:
2

• verification test plan review and approval; • verification report review and approval; and, • verification statement review and approval.
The key EPA contact for this program is:
Mr. Ray Frederick, Project Officer, ETV Water Quality Protection Center (732) 321-6627 email: [email protected]
U.S. EPA, NRMRL Urban Watershed Management Branch 2890 Woodbridge Ave. (MS-104) Edison, New Jersey 08837-3679
1.2.3 Testing Organization
The TO for verification testing was the Barnstable County Department of Health and Environment (BCDHE). The project manager, Mr. George Heufelder, was responsible for the overall development of the VTP, oversight and coordination of all testing activities, and compilation and submission of all test information for development of this final report.
Mr. Dale Scherger of Scherger Associates was contracted by NSF to assist with the review of the test data and preparation of the verification report and verification statement.
The BCDHE Laboratory and its subcontractor, Groundwater Analytical, Inc. (GAI), provided laboratory services for the testing program and consultation on analytical issues addressed during the verification test period.
The responsibilities of the TO included:
• preparing the site-specific VTP; • conducting verification testing, according to the VTP; • installing, operating, and maintaining the ReCip® in accordance with the Vendor’s
operation and maintenance (O&M) manual(s); • controlling access to the area where verification testing was carried out; • maintaining safe conditions at the test site for the health and safety of all personnel
involved with verification testing; • scheduling and coordinating all activities of the verification testing participants,
including establishing a communication network and providing logistical and technical support as needed;
• resolving any quality concerns encountered and reporting all findings to the VO; • managing, evaluating, interpreting, and reporting data generated by verification testing; • evaluating and reporting on the performance of the technology; and, • if necessary, documenting changes in plans for testing and analysis, and notifying the
VO of any and all such changes before changes are executed.
3

The key personnel and contacts for the TO are:
Mr. George Heufelder, Project Manager and Facility Operations Manager Barnstable County Department of Health and the Environment Superior Court House (P.O. Box 427) Barnstable, Massachusetts 02630 (508) 375-6616 Email: [email protected]
Gongmin Lei, Laboratory Manager Barnstable County Department of Health and the Environment Laboratory Superior Court House (P.O. Box 427) Barnstable, MA 02630 (508) 375-6605 Email: [email protected]
Mr. Jonathan Sanford, President Groundwater Analytical, Inc. (GAI) 228 Main Street. Buzzards Bay, Massachusetts 02532 (508) 759-4441
The key contact at Scherger Associates is:
Mr. Dale A. Scherger Scherger Associates 3017 Rumsey Drive Ann Arbor, Michigan 48105 (734) 213-8150 Email: [email protected]
4

1.2.4 Technology Vendor
The nitrogen reduction technology evaluated was the ReCip® RTS ~ 500 Wastewater Treatment System manufactured by BioConcepts, Inc. BioConcepts was responsible for supplying equipment needed for the test program and for supporting the TO to ensure that the equipment was properly installed and operated during the verification test.
ReCip® is the registered name for the Tennessee Valley Authority’s patented Reciprocating Water Technology. The ReCip® RTS ~ 500 Wastewater Treatment System is a modular reciprocating system sized for treating 500 gpd.
Specific responsibilities of the vendor during the verification process included:
• initiating the application for ETV testing; • providing input regarding the verification testing objectives to be incorporated into the
VTP; • selecting the test site; • providing complete, field-ready equipment and the O&M manual(s) typically provided
with the technology (including instructions on installation, startup, operation, and maintenance) for verification testing;
• providing any existing relevant performance data for the technology; • providing assistance to the TO on the operation and monitoring of the technology during
the verification testing, and logistical and technical support as required; • reviewing and approving the site-specific VTP; • reviewing and commenting on the verification report; and, • providing funding for verification testing.
The key contact for BioConcepts is:
Al Privette BioConcepts, Inc.
P.O. Box 885 Oriental, North Carolina 28571 (252) 249-1376
Email: [email protected]
1.2.5 ETV Test Site
The Massachusetts Alternative Septic System Test Center (MASSTC) was the host site for the nitrogen reduction verification test. MASSTC is located at Otis Air National Guard Base in Bourne, Massachusetts. The site was designed as a location to test septic treatment systems and related technologies. MASSTC provided the location to install the technology and provided the infrastructure support requirements to collect domestic wastewater and pump the wastewater to
5

the system, as well as operational and maintenance support for the test. Key items provided by the test site were:
• logistical support and reasonable access to the equipment and facilities for sample collection and equipment maintenance;
• wastewater that is “typical” domestic, relative to key parameters such as five-day biochemical oxygen demand (BOD5), total suspended solids (TSS), total nitrogen (TN), and phosphorus;
• a location for sampling raw or screened wastewater and a sampling arrangement to collect representative samples;
• automatic pump systems capable of controlled dosing to the technology being evaluated to simulate a diurnal flow variation and to allow for stress testing;
• sufficient flow of wastewater to accomplish the required controlled dosing pattern; • setup of sampling equipment and collection of samples per the established schedule; • an accessible but secure site to prevent tampering by outside parties; and, • wastewater disposal of both the effluent from the testing operation and any untreated
wastewater generated when testing is not occurring.
1.3 Background – Nutrient Reduction
Domestic wastewater contains various physical, chemical, and bacteriological constituents, which require treatment prior to release to the environment. Various wastewater treatment processes exist that reduce oxygen-demanding materials, suspended solids, and pathogenic organisms. Reduction of nutrients, principally phosphorus and nitrogen, has been practiced since the 1960s at centralized wastewater treatment plants. The reduction of nutrients in domestic wastewater discharged from single-family homes, small businesses, and similar locations within watersheds is desirable for the same reasons as for large treatment facilities. Nutrient reduction is needed primarily to protect the quality of ground- or surface water for drinking (drinking water standards for NO2
- and NO3- have been established), and to reduce the potential for
eutrophication in nutrient-sensitive surface waters and the consequent loss in ecological, commercial, recreational, and aesthetic uses.
1.3.1 Biological Nitrification
Nitrification is a process carried out by bacterial populations (Nitrosomonas and Nitrobacter) that oxidize ammonium to NO3
- with intermediate formation of nitrite ion. These organisms are considered autotrophic because they obtain energy from the oxidation of inorganic nitrogen compounds. The two steps in the nitrification process and their equations are as follows:
(1) Ammonium is oxidized to NO2- by Nitrosomonas bacteria.
- 2 NH4+ + 3 O2 = 2 NO2 + 4 H+ + 2 H2O
(2) NO2- is then converted to NO3
- by Nitrobacter bacteria.
2 NO2- + O2 = 2 NO3
6

Since complete nitrification is a sequential reaction, systems must be designed to provide an environment suitable for the growth of both groups of nitrifying bacteria. These two reactions essentially supply the energy needed by nitrifying bacteria for growth. Several major factors influence the kinetics of nitrification, including organic loading, hydraulic loading, temperature, pH, and dissolved oxygen (DO) concentration.
Organic loading: Organic loadings affect the efficiency of the nitrification process. Although the heterotrophic biomass is not essential for nitrifier attachment, the heterotrophs (organisms that use organic carbon for the formation of cell tissue) form biogrowth to which the nitrifiers adhere. The heterotrophic bacteria grow much faster than nitrifiers at high BOD5 concentrations. As a result, the nitrifiers can be overgrown by heterotrophic bacteria, which can cause the nitrification process to cease. In order for nitrification to take place, the organic loadings must be low enough to provide balance between the heterotrophic and nitrifying bacteria.
Temperature: The nitrification process is very dependent on temperature and occurs over a range of approximately 4 to 45°C (39 to 113°F). Typically, nitrification rates slow dramatically at temperatures below 10°C, and may stop altogether at around 5°C.
pH and Alkalinity: The nitrification process produces acid, which lowers the pH and can reduce the growth rate of the nitrifying bacteria. The optimum pH for Nitrosomonas and Nitrobacter is between 7.5 and 8.5. At a pH of 6.0 or less, nitrification normally will stop. Approximately 7.1 pounds of alkalinity (as calcium carbonate [CaCO3]) are destroyed per pound of NH3-N oxidized to NO3
-.
Dissolved Oxygen (DO): The concentration of DO affects the rate of nitrifier growth and nitrification in biological waste treatment systems. The DO concentration at which nitrification is limited can be 0.5 to 2.5 mg/L in either suspended or attached-growth systems under steadystate conditions, depending on the degree of mass-transport or diffusional resistance and the solids retention time. The maximum nitrifying growth rate is reached at a DO concentration of 2 to 2.5 mg/L. However, the maximum growth rate is not needed for effective nitrification if there is adequate contact time in the system. As a result, there is a broad range of DO values at which DO becomes rate limiting. The intrinsic growth rate of Nitrosomonas is not limited at DO concentrations above 1.0 mg/L, but DO concentrations greater than 2.0 mg/L may be required in practice. Nitrification consumes large amounts of oxygen with 4.6 pounds of O2 being used for every pound of NH3-N oxidized.
1.3.2 Biological Denitrification
Denitrification is an anoxic process where NO3- serves as an oxygen equivalent (electron
acceptor) for bacteria, and the NO3- is reduced to nitrogen gas. Denitrifying bacteria are
facultative organisms that can use either DO or NO3- as an oxygen source for metabolism and
oxidation of organic matter. If both DO and NO3- are present, the bacteria will tend to use the
DO first. Therefore, it is important to keep DO levels as low as possible.
7

Another important aspect of the denitrification process is the presence of organic matter to drive the denitrification reaction. Organic matter can be in the form of raw wastewater, methanol, ethanol, or other organic sources. When these sources are not present, the bacteria may depend on internal (endogenous) carbon reserves as organic matter. The endogenous respiration phase can sustain a system for a time, but it may not be a consistent enough source of carbon to drive the reaction to completion or to operate at the rates needed to remove the elevated NO3
- levels present in nitrified effluent.
The denitrifying reaction using methanol as a carbon source can be represented as follows:
6NO3- + 5CH3OH = 5CO2 + 3N2 + 7H2O + 6OH-
Several conditions affect the efficiency of the denitrification process, including the anoxic conditions, the temperature, presence of organic matter, and pH.
DO: The level of DO has a direct impact on the denitrifying organisms. As DO increases, the denitrification rate decreases. DO concentrations below 0.3 to 0.5 mg/L in the anoxic zone are typically needed to achieve efficient denitrification.
Temperature: Temperature affects the growth rate of denitrifying organisms with higher growth rates occurring at higher temperatures. Denitrification normally occurs between 5 and 35°C (41 to 95°F). As in the case of nitrification, denitrifying rates drop as the temperature falls below 10°C.
Organic matter: The denitrification process requires a source of organic matter. The denitrification rate varies greatly depending upon the source of available carbon. The highest rates are achieved with the addition of an easily assimilated carbon source such as methanol. Somewhat lower denitrification rates are obtained with raw wastewater or primary effluent as the carbon source. The lowest denitrification rates are observed with endogenous decay as the source of carbon.
pH and alkalinity: The optimum pH range for most denitrifying systems is 7.0 to 8.5. The process will normally occur in a wider range, pH 6 to 9, but denitrifying rates may be impacted near the extremes of the range. Acclimation of the population can lower the impact of pH on growth rates. An advantage of the denitrification process is the production of alkalinity that helps buffer the decrease in alkalinity during the nitrification process. Approximately 3.6 pounds of alkalinity are produced for each pound of nitrate nitrogen removed.
Additional information on various nitrogen control strategies can be found in the Manual for Nitrogen Control, EPA, 1993, 625/R-93/010 [2].
8

Chapter 2Technology Description and Operating Processes
The information contained in this chapter is taken from the literature and information provided by BioConcepts, and does not represent verified information. It is intended to provide the reader with a description of the ReCip® system and to explain how the technology operates. The verified performance characteristics of the ReCip® system are described in Chapter 4.
2.1 Technology Description
The ReCip® uses a filter medium contained in two adjacent, equally dimensioned cells to provide enhanced biological treatment of organics and nitrogen compounds. By “reciprocating” septic tank effluent between the two cells (alternately draining and filling the cells), the septic tank effluent encounters aerobic and anoxic conditions necessary for nitrification and denitrification. The process is controlled by timers on each reciprocating pump.
The ReCip® uses filter media for fixed-film wastewater treatment. The two cells are filled with the medium1, which provides a surface for microbes to attach, live, and grow. Wastewater is applied to the medium and allowed to trickle through. Microorganisms on the medium use the nutrients and organic materials provided by the constant supply of fresh wastewater to form new cell mass. The open spaces within the medium allow air to freely pass through, providing oxygen to support the microorganisms. The alternating fill and drain cycles in the medium encourages air movement.
BioConcepts states that the ReCip® system is able to provide wastewater treatment because the system operates in all three typical wastewater treatment regimes, aerobic, anoxic, and anaerobic, on every fill and drain cycle. BioConcepts describes the basic treatment processes as follows: At the start of the cycle, the first cell of the ReCip® unit is filled nearly to the top with wastewater. The pump located in the cell then pumps the liquid into the second cell, until the first cell is nearly empty. As the liquid leaves the first cell, the void formerly occupied by the liquid fills with air from the vent system, exposing the medium to atmospheric oxygen contained in the air. At this point, the second cell is nearly full and the first cell is nearly empty. The two cells remain in this state for a time before the second cell’s pump sends the liquid back to the first cell, drawing air into the second cell. Wastewater that clings to the medium contains nutrients and organics, which are oxidized by bacteria (biofilm) exposed to the air. The bacteria live and grow on the medium. In the presence of oxygen, organic matter is converted to carbon dioxide and water, and NH3-N is converted to NO3
-. Anaerobic decomposition of the contaminants continues in the wastewater that is not exposed to air (at the very bottom of the cells), converting the NO3
- to nitrogen gas. The two cells continue to fill and drain, with rest periods between the cycles, until additional wastewater flows into the first cell. When the capacity of the first cell is met, its contents are pumped into the second cell. The excess volume exits the overflow of the second cell as treated effluent. As an example, if the rated capacity of
1 For the ETV verification test, the medium used was Stalite, an expanded slate aggregate. However, according to its literature, BioConcepts also may use patented plastic “bioballs” with the ReCip®.
9

the tanks is 500 gallons and one extra gallon enters the system, a gallon of treated effluent will exit cell number two.
A basic residential ReCip® wastewater treatment system includes (1) a standard septic tank to provide solids separation and primary treatment; (2) a ReCip® unit to provide secondary and tertiary treatment for the septic tank effluent; and (3) a tile field or other system for final disposal of treated effluent.
2.2 ReCip® Equipment
BioConcepts recommends the use of a 1,500-gallon septic tank with a residential ReCip® system sized for a flow of 500 gallons per day (gpd). The septic tank should be a baffled or twocompartment tank to help promote solids settling and separation. It is recommended that the septic tank be equipped with an effluent filtering device (required in some states) to minimize solids carryover to the ReCip® system. Septic tank effluent can flow to the ReCip® inlet by gravity or can be pumped in applications where there is insufficient slope to use gravity flow.
The ReCip® RTS ~ 500 for single-family home use is sized to treat 500 gpd, which is the expected flow from a 4- to 5-bedroom house. Other models and sizes are available to handle larger or smaller daily flows. The ReCip® RTS ~ 500 treatment unit consists of two equally sized (approx 453 gal) compartments in a cylindrical tank. The tank is constructed of a heavy (14) gauge corrugated, anti-corrosive aluminum pipe four and one half (4½) feet in diameter. The unit contains two chambers separated by a baffle. The first cell (cell one) is closest to the septic tank, and it receives effluent directly from the septic tank. Cell two empties to a dosing tank or directly to the disposal location (tile field, etc.). The cell covers, or caps, are made of aluminum and are attached to an aluminum collar. Both caps are fitted with gooseneck pipes, which vent the cell and allow fresh air to enter the chamber. The pipes are fitted with a screen to keep insects, grass clippings, and other foreign objects from entering the cells. When properly installed, the collars function as anti-vandal security and can deter unauthorized access to the pump chambers. As an option, locks can be added to the collar connections to further deter unauthorized access.
Black plastic “risers” are located above each cell. The risers are made to fit the depth of the installation and provide service personnel access to the pump chambers. Each pump chamber houses a single ⅓ horsepower pump and associated piping. The piping consists of two 2-inch PVC pipes, going into and coming out of each pump chamber. Each pump is equipped with a quick disconnect fitting, which allows simple disconnection of the pump’s discharge pipe. A length of chain is attached under each lid and connected to the pump handle. This system allows a service technician to quickly disconnect a pump and pull it to the surface.
Only two pumps are needed (one in each cell), if gravity flow can be used from the septic tank outlet to the ReCip® inlet and from the ReCip® outlet to the final disposal location. If the site hydraulics do not allow for gravity flow, pumps can be added to move wastewater from the septic tank outlet to the ReCip® unit, and from the unit to the tile field or other disposal location. The system used for the verification test used only two pumps, one per cell; all other flow was by gravity.
10

Both cells are partially filled with medium. The center baffle has an overflow system that allows effluent to continue to pass through the system in the event of a long-term power outage or complete pump failure. Under this condition, water will not backup or spill out of the unit.
The system includes a fiberglass control panel that houses the electrical connections, circuit breakers, pump timers, and alarms. The panel has the capability of controlling and timing the pump operations of the two cells. If an additional pump is needed to move septic tank effluent to the ReCip® inlet, the panel can also control this pump and has alarms for high water level in the feed tank. The panel is normally mounted on a post between the two risers.
Figure 2-1 shows a basic schematic representation of the ReCip®.
2.3 Installation, Startup, Operation, and Maintenance
BioConcepts provides an O&M guide for homeowners, which contains important information about the ReCip®. BioConcepts has identified this document as Confidential Business Information and consequently, it is not included as an Appendix to this report. The O&M guide was available for review by NSF personnel, MASSTC personnel, and the technical peer reviewers for this project. The O&M guide was also reviewed as part of the verification and is discussed further in Section 4.4.5.
The O&M Guide states that the ReCip® unit is of modular self-contained design, so installation not difficult. However, it clearly states that installation should never be done by the homeowner and should only be done by installers who are licensed and trained by BioConcepts. Installation by anyone else voids the warranty for the unit. BioConcepts provides an “end-user license” for the technology that certifies parameters of use and the effluent reductions that the system will meet. The license protects the proprietary nature of the technology from patent infringement and ensures the end-user is aware of the performance criteria.
The O&M Guide provides a basic overview of the process and a description of the ReCip®
components, and includes a description and discussion of the control panel operation. It also explains how to perform visual observations of the cell water depth and how to determine if there may be a pump problem; it also lists possible solutions to system operating problems.
BioConcepts strongly recommends that the homeowner engage the services of an authorized local service provider to perform any needed sampling (state rule-dependent) and to provide periodic servicing of the unit. BioConcepts also recommends, at minimum, an annual inspection of the septic tank, with solids removal as needed. For the ReCip® unit, monthly observation of the pump cycle and water depth is recommended to ensure that the pumps are operating properly.
The O&M Guide also emphasizes two other activities:
1. It is very important that the screens on the cap vents be kept clear/clean to allow air to flow in and out of the cells.
11

2. If a power failure is expected to last more than 48 hours, a generator should be connected to the outlet on the timer control box to allow the system to cycle several times per day. This will be adequate to maintain treatment until power is restored. If the homeowner suspects a problem, sees an alarm, or is under extended power loss, the “Responsible Operator in Charge” (contracted licensed service provider) should be notified.
2.4 Vendor Claims
BioConcepts claims that the ReCip® can provide residential wastewater treatment and nutrient reduction.
12

Figure 2-1. ReCip® general layout
13

Chapter 3Methods and Test Procedures
3.1 Verification Test Plan and Procedures
A VTP, Test Plan for The Massachusetts Alternative Septic System Test Center for the Verification Testing of the BioConcepts, Inc. ReCip® System Nutrient Reduction Technology (3), December 12, 2002, was prepared and approved for the verification of the BioConcepts ReCip®
unit, and is included in Appendix A. The VTP was prepared in accordance with the ETV Protocol for the Verification of Residential Wastewater Treatment Technologies for Nutrient Reduction (2), November 2000. The VTP details the procedures and analytical methods to be used to perform the verification test. The VTP included tasks designed to verify the nitrogen reduction capability of the ReCip® and to obtain information on the operation and maintenance requirements of the ReCip®. The VTP covered two distinct phases of fieldwork: startup of the unit and a one-year verification test that included normal dosing and stress conditions. The verification test was conducted between January and December 2003.
This section describes each testing element performed during the technology verification, including sample collection methods, analytical protocols, equipment installation, and equipment operation. QA/QC procedures and the data management approach are discussed in detail in the VTP.
3.2 MASSTC Test Site Description
The MASSTC site is located at Otis Air National Guard Base in Bourne, Massachusetts. The site is designed to provide domestic wastewater for use in testing various types of residential wastewater treatment systems. The domestic wastewater source is the sanitary sewerage from the base’s residential housing and other military buildings. The sewer system for the base flows to an on-base wastewater treatment facility. An interceptor chamber, located in the main sewer line to the base’s wastewater treatment facility, was constructed when the MASSTC was built and provides a location to obtain untreated wastewater. The raw wastewater passes through a bar screen (grate) located ahead of the transfer pump. This bar screen has one-inch spacing between the bars to remove large or stringy materials that could clog the pump or lines. The screened raw wastewater is pumped through an underground two-inch line to the dosing channel at the test site. The design of the interceptor chamber provides mixing of the wastewater just ahead of the transfer pump to ensure that well-mixed raw wastewater is obtained for the influent feed at the test site.
The screened wastewater is pumped to the dosing channel at a rate of approximately 29 gpm on a continuous basis for 18 hours per day, yielding a total flow of approximately 31,000 gallons per day (gpd). Wastewater enters the dosing channel, an open concrete channel 65 feet long by 2 feet wide by 3 feet deep, via two pipes midway in the channel. Approximately 4,000 to 6,000 gallons per day is withdrawn for test purposes. The excess wastewater flows by gravity to the base’s sanitary sewer and is treated at the base’s wastewater treatment plant. The dosing channel
14

is equipped with four recirculation pumps. These pumps, spaced along the channel length, keep the wastewater in the channel constantly moving to ensure the suspension of solids and to ensure that the wastewater is of similar quality at all locations along the channel.
Dosing wastewater to test units is accomplished by individual pumps submerged in-line along the dosing channel. The pumps are connected to the treatment technology being tested by underground PVC pipe. A custom-designed, programmable logic controller (PLC) is used to control the pumps and the dosing sequence or cycle. Each technology feed pump can be controlled individually for multiple start and stop times and for pump runtime. For the ReCip®, the volumetric dosages were set to meet the dosing sequence described in the VTP. The test for the ReCip® was based on dosing 15 times per day with approximately 33.3 gallons of wastewater per dose. This dosing volume of 500 gallons per day was based on the ReCip®-rated capacity of 500 gpd. The individual dose volume was controlled by adjusting the pump runtime for each cycle.
MASSTC maintains a small laboratory at the site to monitor basic wastewater treatment parameters. Temperature, dissolved oxygen, pH, specific conductance, and volumetric measurements are routinely performed to support the test programs at the site. These field parameters were performed at the site during the ReCip® test.
MASSTC has been in operation since 1999. Screened wastewater quality has been monitored as part of several previous test programs, and is within the requirements established in the ETV Protocol for the Verification of Residential Wastewater Treatment Technologies for Nutrient Reduction (2) for raw wastewater quality. The data are presented in Table 3-1. Influent wastewater monitoring was part of the startup and verification testing, and is described later in this section. Results of all influent monitoring during the verification test are presented in Chapter 4.
Table 3-1. Historical MASSTC Wastewater Data
Average Standard Parameter (mg/L) Deviation BOD5 180 61 TSS 160 59 Total nitrogen 34 4.6 Alkalinity 170 28 pH 7.4 —
15

3.3 Installation and Startup Procedures
3.3.1 Introduction
BioConcepts provided installation instructions for the ReCip® and had personnel present at the site during the installation. The system delivered by BioConcepts consisted of a ReCip® unit, including an aluminum tank (approximately 900 gallons total volume), two pumps, and the control panel. A two-compartment, 1,500-gallon concrete septic tank was provided by MASSTC and installed ahead of the ReCip® unit. The complete system was installed by a contractor in August 2002 and used for the startup period and verification test for the ETV program.
3.3.2 Objectives
The objectives of the installation and startup phase of the VTP were to:
• install the ReCip® in accordance with the instructions; • startup and test the ReCip® to ensure that all processes were operating properly, the
pumps were set for proper timing sequence, and any leaks that occurred during the installation were eliminated;
• make any modifications needed to achieve operation; and, • record and document all installation and startup conditions prior to beginning the
verification test.
3.3.3 Installation and Startup Procedure
The VTP and ETV Protocol for the Verification of Residential Wastewater Treatment Technologies for Nutrient Reduction (2) allow for a startup period, during which the biological community was established and operating conditions were adjusted, as needed, for site conditions. The primary tank and filter system were filled with water and each component of the system was checked for proper operation. The water was also used to check the dosing pump flow rates.
Startup of the ReCip® began on October 29, 2002. The septic tank was filled with raw wastewater from the dosing channel, and the dosing sequence was started with a setting of 15 doses of wastewater per day and a target of 33.33 gallons of wastewater per dose. This dose setting provided a target total daily flow of 500 gallons per day.
The system was monitored during the startup period (October 29 through December 31, 2002) by visual observation of the system, routine calibration of the dosing system, and the collection of influent and effluent samples. Analytical samples were collected five times over the startup period. Influent samples were analyzed for pH, alkalinity, temperature, BOD5, TKN, NH3-N, and TSS. The effluent was analyzed for pH, alkalinity, temperature, carbonaceous biochemical oxygen demand (CBOD5), TKN, NH3-N, TSS, dissolved oxygen, NO2
-, and NO3-. The same
procedures for sample collection, analytical methods, and monitoring were used during startup and the one-year verification period.
16

3.4 Verification Testing - Procedures
3.4.1 Introduction
The verification test procedures were designed to verify nitrogen reduction by the ReCip®. The verification test consisted of a 12-month test period, incorporating five stress periods with varying stress conditions simulating real household conditions. Dosing volume was set based on the design capacity of the ReCip®. Monitoring for nitrogen reduction was accomplished by measurement of nitrogen species (TKN, NH3-N, NO2
-, and NO3-). BOD5, CBOD5, and other
basic parameters (pH, alkalinity, TSS, and temperature) were monitored to provide information on overall treatment performance. Operational characteristics such as electric use, residuals generation, noise, and odor were also monitored.
Verification results and observations are presented in Chapter 4 of this verification report.
3.4.2 Objectives
The objectives of the verification test were to:
• determine nitrogen reduction performance of the ReCip®; • monitor removal of other oxygen-using contaminants (BOD5 CBOD5, and TSS); • determine operation and maintenance characteristics of the technology; and • assess chemical usage, energy usage, generation of byproducts/residuals, noise and odor.
3.4.3 System Operation - Flow Patterns and Loading Rates
The flow and loading patterns used during the 12-month verification test were designed in accordance with the protocol, as described in the VTP (Appendix A). The flow pattern was designed to simulate the flow from a “normal” household. Several special stress test periods were also incorporated into the test program.
3.4.3.1 Influent Flow Pattern
The influent flow dosed to the ReCip® was controlled by the use of timed pump operation. The dosing pump was set to provide 15 doses of equal volume (target = 33.3 gallons per dose) in accordance with the following schedule:
• 6 a.m. – 9 a.m. - approximately 33% of total daily flow in 5 doses • 11 a.m. – 2 p.m. - approximately 27% of total daily flow in 4 doses • 5 p.m. – 8 p.m. - approximately 40% of total daily flow in 6 doses
The influent dosing pump was controlled by a programmable logic controller (PLC), which permitted timing of the 15 individual doses to within one second. The pump flow rate and time setting were calibrated by sequencing the dosing pump for one cycle and collecting the entire volume of flow in a “calibrated” barrel. The barrel was initially calibrated by placing a
17

measured volume of water into it. The dosing flow volume was checked by this calibration method at least twice per week. Calibration results were recorded in the field logbook.
The initial total daily flow to the ReCip® was targeted to be 500 gallons per day (33.3 gallons per dose). After each calibration test, the measured volume was compared to this target rate. If the volume was more than 10 percent above or below the target, the pump runtime was increased or decreased to adjust the volume per dose back to the target volume. If the runtime was changed, then a second calibration was performed to determine the total volume for the new timer setting. The QC requirement for the dosing volume was 100 ± 10 percent of the target flow (500 gallons per day) based on a 30-day average, with the exception of periods of stress testing. All calibration tests were recorded in the field logbook.
In addition to the twice-weekly direct calibrations, the PLC system results were checked on a daily basis. The PLC system recorded the number of doses delivered each day for each pump operated by the dosing system, and it was confirmed that 15 doses were delivered each day. The PLC was also checked to ensure that the start and stop times were set properly. Any changes made to the settings or problems with dose cycles were recorded in the field log.
Flow information was entered into a spreadsheet that showed each day of operation, the pump runtime, the gallons pumped per dose, and the number of doses delivered to the unit.
3.4.3.2 Stress Testing Procedures
During the verification test, one stress test was performed following every two months of operation at the normal design loading. Five stress scenarios were run during the 12-month evaluation period to test the ReCip® response to differing load conditions and a power/equipment failure.
Stress testing included the following simulations:
• Washday stress • Working parent stress • Low load stress • Power/equipment failure stress • Vacation stress
Washday stress simulation consisted of three washdays in a five-day period, with each washday separated by a 24-hour period of dosing at the normal design-loading rate. During a washday, the system received the normal flow pattern; however, during the course of the first two dosing periods per day, the hydraulic loading included three wash loads (three wash cycles and six rinse cycles). The volume of wash load flow was 28 gallons per wash load. The hydraulic loading rate was adjusted so that the loading on washdays did not exceed the design-loading rate. Common detergent (Arm and Hammer Fabri-care) and non-chlorine bleach was added to each wash load at the manufacturer-recommended amount.
18

The working parent stress simulation consisted of five consecutive days when the ReCip® was subjected to a flow pattern where approximately 40 percent of the total daily flow was dosed between 6 a.m. and 9 a.m., and approximately 60 percent of the total daily flow was dosed between 5 p.m. and 8 p.m. This simulation also included one wash cycle and two rinse cycles during the evening dose cycle. The hydraulic loading did not exceed the design loading rate during the stress test period.
The low load stress simulation tested the unit at 50 percent of the target flow (250 gallons per day) loading for a period of 21 days. Approximately 35 percent of the total daily flow was dosed between 6 a.m. and 11 a.m.; approximately 25 percent of the flow was dosed between 11 a.m. and 4 p.m.; and approximately 40 percent of the flow was dosed between 5 p.m. and 10 p.m.
The power/equipment failure stress simulation consisted of a standard daily flow pattern until 8 p.m. on the day the test was initiated. Power to the system was turned off at 9 p.m., and the flow pattern was discontinued for 48 hours. After the 48-hour period, power was restored and the system was dosed with approximately 60 percent of the total daily flow over a three-hour period, which included one wash cycle and two rinse cycles.
The vacation stress simulation consisted of a flow pattern where, on the day that the stress was initiated, approximately 35 percent of the total daily flow was dosed between 6 a.m. and 9 a.m. and approximately 25 percent of the total daily flow was received between 11 a.m. and 2 p.m. The flow pattern was discontinued for eight consecutive days, with power continuing to be supplied to the technology. Between 5 p.m. and 8 p.m. of the ninth day, the technology was dosed with 60 percent of the total daily flow, which included three wash loads of three wash cycles and six rinse cycles.
3.4.3.3 Sampling Locations, Approach, and Frequency
3.4.3.3.1 Influent Sampling Location
Influent wastewater was sampled from the dosing channel at a point near the ReCip® dosing pump intake, approximately 4 to 6 inches from the channel floor to ensure a representative sample of the wastewater was obtained. The influent sampling site was selected based on the layout of the dosing channel at the MASSTC facility. Screened wastewater enters the 65-footlong dosing channel via two pipes located midway between the channel end and the channel outlet. Dosing pumps for individual systems are located in-line along the dosing channel.
3.4.3.3.2 ReCip® Effluent Sampling Location
For the ReCip® effluent, the sampling site was located in the normal 4-inch effluent pipe from the treatment unit at the point nearest the effluent discharge. A concrete containment structure was installed so that the effluent from the ReCip® discharged into a clean collection cup, from which the autosampler collection tube drew a sample. The cup was drained between sampling events. The collection cup was located so that it could be cleaned of any attached and settled solids. Cleaning the sampling location, by brushing to remove any accumulated solids, was
19

performed prior to each sampling period to remove the biomass that tended to grow in the effluent pipe during the weeks between sampling events. Cleaning would not be required in a normal system, as the sampling location in the discharge pipe was installed for the verification test only and would not be present in a normal installation.
3.4.3.3.3 Sampling Procedures
Both grab and 24-hour flow-weighted composite samples were collected at the influent and effluent sampling locations. Grab samples were collected from both locations to measure pH, DO, and temperature. DO was measured at the treated effluent location when flow across the sampling point was occurring. The grab samples were collected by dipping a sample collection bottle into the flow at the same location as the automatic sampler used for composite sample collection. The sample bottles were labeled with the sampling location, time, and date. All pH, DO, and temperature measurements were performed at the on-site laboratory immediately after sample collection.
Composite samples were collected using automated samplers at each sample collection point. The automated samplers were programmed to draw equal volumes of sample from the waste treatment stream at the same frequency and timing as influent wastewater doses. Samples taken in this manner were therefore flow-proportional. The effluent sampler timing was set to correspond to the passage of a flow through the ReCip® discharge line. The automatic samplers were calibrated before each use and the volume of sample collected was checked to ensure that the proper number of individual samples was collected in the composite container. Detailed sampling procedures are described in the MASSTC SOPs (Appendix B).
Table 3-2 shows a summary of the sampling matrix for the verification test.
Table 3-2. Sampling Matrix
Sample Sample Location Testing Parameter Type Influent Effluent Location
BOD5 Composite X Laboratory CBOD5 Composite X Laboratory Suspended solids Composite X X Laboratory pH Grab X X Test Site Temperature (°C) Grab X X Test Site Alkalinity (as CaCO3) Composite X X Laboratory DO Grab X X Test Site TKN (as N) Composite X X Laboratory NH3-N Composite X X Laboratory Total NO3
- (as N) Composite X Laboratory Total NO2
- (as N) Composite X Laboratory
20

3.4.3.3.4 Sampling Frequency
Table 3-3 shows a summary of the sampling schedule followed during the test. Sample frequency followed the VTP, and included sampling on a monthly basis under design flow conditions and more frequent sampling during special stress-test periods.
Normal Monthly Frequency
Samples of the influent and effluent were collected at least once per month during the verification test period (January 2003 through December 2003).
Stress Test Frequency
Samples were collected on the day each stress simulation was initiated and when approximately 50 percent of each stress sequence was completed. For the vacation and power/equipment failure stresses, there was no midpoint sampling. Beginning 24 hours after the completion of washday, working parent, low load, and vacation stress scenarios, samples were collected for six consecutive days. Beginning 48 hours after the completion of the power/equipment failure stress, samples were collected for five consecutive days.
Final Week
Samples were also collected for five consecutive days at the end of the yearlong evaluation period.
3.4.3.3.5 Sample Handling and Transport
In the automatic samplers, ice was placed around the sample bottle to keep the sample cool. The composite sample container was retrieved at the end of the sampling period, shaken vigorously, and poured into new bottles that were labeled for the various scheduled analyses. Sample bottles used for TKN and NH3-N analyses were supplied by the laboratory with preservative. Sample container type, sample volumes, holding times, and sample handling and labeling procedures were detailed in the VTP (Appendix A) and in the MASSTC SOP, Attachment I (Appendix B).
BCDHE personnel transported the samples to the BCDHE laboratory via automobile. The samples were packed in ice in coolers to maintain a temperature of 4oC. Subsamples analyzed at GAI were transported from the BCDHE laboratory to GAI by GAI personnel. Travel time from the test facility to BCDHE was approximately 40 minutes. Travel time from BCDHE to GAI was approximately 45 minutes.
21

Table 3-3. Sampling Schedule for ReCip®
Month/Day Sampling Event(s) November 13 and 26, 2002; December 4, 11, Startup – 5 sampling events and 12, 2002 January 8, 2003 Normal monthly sample January 29, 2003 Normal monthly sample February 18 through March 1, 2003 Washday stress – 8 samples March 20, 2003 Normal monthly sample April 16, 2003 Normal monthly sample April 22 through May 3, 2003 Working parent stress – 8 samples May 21, 2003 Normal monthly sample – extra June 25, 2003 Normal monthly sample July 2 through July 28, 2003 Low load stress – 8 samples August 21, 2003 Normal monthly sample September 10, 2003 Normal monthly sample – extra September 16 through 26, 2003 Power/equipment failure stress – 6 samples October 15, 2003 Normal monthly sample October 22, 2003 Normal monthly sample – extra November 12, 2003 Normal monthly sample November 14, 2003 Normal monthly sample November 18 through December 4, 2003 Vacation stress – 6 samples December 16 through December 21, 2003 Final week sampling – 5 samples
3.4.3.4 Residuals Monitoring and Sampling
The ReCip® was inspected at the end of the test for solids buildup in the area below the medium and near the pump in both cells. Based on visual observation, there was no solids buildup in the cells, and, therefore, residuals samples could not be collected. The ETV protocol does not include sampling residuals in the septic tanks when the septic tank is separate from the device and not included as part of the system sold by the manufacturer. Therefore, residuals in the septic tank were not collected and analyzed.
3.4.4 Analytical Testing and Record Keeping
As shown in Table 3-3, 53 samples of the influent and effluent for the ReCip® unit were collected during the verification period. Samples included grab and composite samples for each sampling day. Industry standard procedures (EPA Methods (5,6) or Standard Methods (1)) were used for all sample analysis. The methods used for each constituent are shown in Table 3-4. Temperature, DO, and pH were measured on-site. Off-site laboratories performed all other analyses. The BCDHE laboratory performed the analyses for alkalinity, TSS, BOD5, CBOD5, NO2
-, and NO3-. GAI was responsible for the TKN and NH3-N analyses.
22

Table 3-4. Summary of Analytical Methods and Precision and Accuracy Requirements
Acceptance Acceptance Criteria Criteria
Duplicates Spikes Analytical Parameter Facility (%) (%) Method pH On-site N/A N/A SM #423 DO On-site N/A N/A SM #4500 Temperature (oC) On-site N/A N/A SM #2550 Alkalinity BCDHE laboratory ±20 N/A SM #2320 BOD5/CBOD5 BCDHE laboratory ±30 N/A SM #5210 B TSS BCDHE laboratory ±20 N/A SM #2540 D Total NO2
- (as N) BCDHE laboratory ±20 60–140 EPA 353.3 Total NO3
- (as N) BCDHE laboratory ±20 60–140 EPA 353.3 NH3-N (as N) GAI laboratory ±20 80–120 SM #4500–NH3 TKN (as N) GAI laboratory ±20 80–120 EPA 351.2
Industry standard procedures were used for all sample analyses, as described in EPA Methods (4,5), or Standard Methods (1).
A Quality Assurance Project Plan (QAPP) was developed as part of the VTP, and provided QA/QC requirements and systems to ensure the integrity of all sampling and analysis. Precision and accuracy limits for the analytical methods are shown in Table 3-4. The QAPP included procedures for sample chain of custody, calibration of equipment, laboratory standard operating procedures, method blanks, and the corrective action plan. Additional details are provided in the VTP (Appendix A). One laboratory audit was also performed during the verification test to confirm that the analytical work was being performed in accordance with the methods and the established QC objectives. This audit took place on June 19, 2003.
The results of all analyses from the off-site laboratories were reported to the TO by hardcopy laboratory reports. The off-site laboratories also provided QA/QC data for the data sets. These data and the laboratory reports are included in Appendix C. The on-site laboratory maintained a laboratory logbook to record the results of all analyses performed at the site. Copies of the onsite laboratory logbook are provided in Appendix D.
The data received from the laboratories were summarized in a spreadsheet by BCDHE personnel. The data were checked against the original laboratory reports by the site staff and checked by NSF to ensure the data were accurately entered. The spreadsheets are included in Appendix E.
3.4.5 Operation and Maintenance Performance
The verification test evaluated both quantitative and qualitative performance of the ReCip®. A field log noted all observations made during the startup of the unit and throughout the verification test. Observations regarding the condition of the system, operation, or any problems that required resolution were recorded in the log by field personnel. Copies of the field log are provided in Appendix F.
23

Observation and measurement of operating parameters included electric use, chemical use, noise, odor, mechanical components, electrical/instrumentation components, and residuals volumes and characteristics.
3.4.5.1 Electric Use
Electric use was monitored by a dedicated electric meter serving the ReCip®. The meter reading was recorded at least twice weekly in the field log by BCDHE personnel. The meter manufacturer, model number, and any claimed accuracy for the meter were recorded in the field log. At the end of the testing period, the electric meter was returned to the manufacturer for calibration and the calibration data entered in the field log.
3.4.5.2 Chemical Use
The ReCip® did not use any process chemicals to achieve treatment.
3.4.5.3 Noise
Noise levels associated with mechanical equipment were measured with a decibel meter once during the verification period. The meter was calibrated prior to use. Meter readings were recorded in the field log. Measurements were taken 1 meter from the unit and 1½ meters above the ground, at 90° intervals in four directions. Meter readings were recorded in the field log. Duplicate measurements at each quadrant were made to account for variations in ambient sound levels.
3.4.5.4 Odors
Odor observations were made 13 times during the verification test, beginning in January 2003 and ending in October 2003. The observation was qualitative, based on odor strength (intensity) and type (attribute). Intensity was stated as not discernable; barely detectable; moderate; or strong. Observations were made during periods of low wind velocity (<10 knots) while standing upright at a distance of approximately 1 meter (3 feet) from the treatment unit, at 90° intervals in four directions. All observations were made by the same BCDHE employee.
3.4.5.5 Mechanical Components
Performance and reliability of the mechanical components, such as wastewater pumps, were observed and documented in the field log during the test period. These observations recorded equipment failure rates, replacement rates, and the existence and use of duplicate or standby equipment.
3.4.5.6 Electrical/Instrumentation Components
Electrical components, particularly those that might be adversely affected by the corrosive atmosphere of a wastewater treatment process, and instrumentation and alarm systems were
24

monitored for performance and durability during the course of verification testing. Observations of any physical deterioration were noted in the field log, as were any electrical equipment failures, replacements, and the existence and use of duplicate or standby equipment.
25

Chapter 4Results and Discussion
4.1 Introduction
Evaluation of the ReCip® at MASSTC began on October 29, 2002. The septic tank was filled with wastewater, the dosing pumps were activated, and the initial dosing cycles were started. The startup period continued until December 31, 2002. Five samples of influent and effluent were collected during the startup period. Verification testing began on January 1, 2003, and continued until December 21, 2003. During the verification test, 53 sets of samples of influent and effluent were collected to determine system performance. At the end of the verification test period, BioConcepts requested that monthly monitoring be continued for four months, from January 2004 through April 2004.
This chapter presents the results of the sampling and analysis of the influent and effluent to/from the unit, a discussion of the results, and observations on the operation and maintenance of the unit during startup and normal operation. Summary of the results are presented in these sections, while complete copies of all spreadsheets, with individual daily, weekly, or monthly results, are presented in Appendix E.
4.2 Startup Test Period
The startup period provided time for the ReCip® to develop a biological growth and acclimate to the site-specific wastewater, and to be adjusted, if needed, to optimize performance at the site. These first nine weeks of operation also provided site personnel with an opportunity to become familiar with system operation and maintenance requirements. Samples were collected during weeks 3, 5, 6, and 7 of the startup period.
4.2.1 Startup Flow Conditions
The flow conditions for the ReCip® were established at the target capacity of 500 gpd in accordance with the VTP. The dosing pump was set to deliver 15 doses per day at approximately 33.3 gallons per dose. Five doses were delivered between 6 a.m. and 9 a.m., four doses between 11 a.m. and 2 p.m., and six doses between 5 p.m. and 8 p.m. The average flow for the startup period was 497 gpd, which was within the ±10 percent (450–550 gpd) of the design flow on a monthly basis specified for the test. The volume of wastewater dosed to the unit during the startup remained mostly constant and only minor adjustments to the dosing pump runtime were required. Table 4-1 shows a summary of the flow volumes during the startup period. The daily flow records are in Appendix E.
26

Table 4-1. Flow Volume Data – Startup Period
Average Actual Daily Volume Date Doses/day Gallons/dose (gallons) October 29 to 31, 2002 15 33.4 501 November 1 to 30, 2002 15 33.1 496 December 1 to 31, 2002 15 33.2 499
4.2.2 Startup Analytical Results
The results of the influent and effluent monitoring during the startup period are shown Tables 42 and 4-3. The first sets of samples were taken sixteen days after the unit was started. The initial data showed that the unit reduced the CBOD5 and TSS to 41 mg/L and 19 mg/L, respectively, and the ReCip® was removing some of the total nitrogen (37 mg/L in the influent, 30 mg/L in the effluent). Observations and additional sampling to determine the condition of the unit continued over the next six weeks. The treatment performance remained steady through the end of the startup period.
After nine weeks of startup, the verification test period began. The biological growth appeared to be established in the unit, although the nitrification/denitrification processes were not yet achieving anticipated results. As will be shown in the discussion of the verification results, the nitrification and denitrification populations took an additional few weeks to become more fully established. Wastewater and ambient air temperatures were falling throughout the startup period and may have slowed the development of the nitrifying and denitrifying organisms. On the last sample collected during the startup period (12/12/02), the CBOD5 of the effluent was 43 mg/L (86% reduction) and TSS was 22 mg/L (approximately 88 percent reduction). The unit was removing a small amount of organic and NH3-N. NO2
- and NO3- concentrations were low,
indicating that any NH3-N being converted to NO2- or NO3
- was being removed by denitrification in the unit.
Table 4-2. Influent Wastewater Quality – Startup Period
BOD5 TSS Alkalinity pH NH3-N TKN TN DO Influent Date (mg/L) (mg/L) (mg/L) (S.U.) (mg/L) (mg/L) (mg/L) (mg/L) Temp. (oC)
11/13/02 270 120 160 7.3 21 37 37 0.2 16 11/26/02 300 N/A 180 7.3 26 36 36 0.1 15 12/4/02 230 140 160 7.3 25 39 39 0.3 13
12/11/02 300 140 160 7.3 24 38 38 0.2 12 12/12/02 300 180 160 7.6 27 37 37 0.4 11
N/A – not analyzed .
27

Table 4-3. ReCip® Effluent Quality - Startup Period
Date CBOD5 TSS Alkalinity pH NH3-N TKN NO3- NO2
- TN DO Discharge (mg/L) (mg/L) (mg/L) (S.U.) (mg/L) (mg/L) (mg/L) (mg/L) (mg/L) (mg/L) Temp. (oC)
11/13/02 41 19 190 7.2 20 30 <0.10 <0.05 30 1.4 11 11/26/02 97 11 180 7.6 24 27 <0.10 0.09 27 1.3 12 12/4/02 58 20 180 7.1 22 28 <0.10 <0.05 28 2.1 8
12/11/02 50 19 180 7.5 22 30 <0.10 0.09 30 2.3 8 12/12/02 43 22 180 7.6 25 30 <0.10 <0.05 30 1.3 9
4.2.3 Startup Operating Conditions
The ReCip® was started using BioConcepts’ recommended settings. The standard operating sequence calls for a two-hour rest period between 15-minute pumping periods. When the pump timer is activated, the pump in cell one turns on and pumps for 15 minutes or until the float switch on the pump indicates that the wastewater has been transferred from cell one to cell two, whichever comes first. After the two-hour rest period, the cell two pump is activated and transfers the wastewater back to cell one, pumping for 15 minutes or until the float switch shuts the pump off. Regular observations throughout the startup period indicated that the pumps were operating properly.
On December 21, 2002, BioConcepts requested that the timing be changed to a one-hour rest period. This change was made to improve treatment performance. The new setting was maintained until the start of the verification test on January 1, 2003, when the setting was returned to the original setting of a two-hour rest period for approximately three weeks. On January 22, the timer was reset to a one-hour rest period at the request of BioConcepts.
4.3 Verification Test
The verification test was started officially on January 1, 2003. The last startup sample was collected on December 12, 2002. All results for the remainder of the test were considered part of the verification test period. The summary data presented for the verification results do not include data from the startup period.
Two changes were made to system operating conditions during the verification test. On January 22, 2003, the rest period timer was changed to a one-hour rest period. BioConcepts requested this change to improve system performance by introducing additional air (oxygen) to the unit by increasing the number of pump cycles between the cells. The timer settings, one-hour rest periods (time between cell wastewater transfers) and 15-minute pumping times remained constant until August 11, 2003. On August 11, the rest period timer was changed to a one halfhour rest period. Activation of the pumps to recycle wastewater every one half hour continued until the end the verification test and through the extra four months of testing that followed the verification period.
28

4.3.1 Verification Test - Flow Conditions
The standard dosing sequence (15 doses per day, 33.3 gallons per dose) was performed every day from January 1, 2003, through December 21, 2003, except during the stress periods. Following completion of the 12-month verification test, the unit continued in operation at the same dosing levels and settings for four additional months, January through April 2004. Volume per dose and total daily volume varied only slightly during the verification test. Table 4-4 shows the average monthly volumes for the verification period. As these data show, the actual wastewater volume dosed to the ReCip® was very close to the targeted volume of 500 gpd for the entire verification test. All monthly averages meet the requirement of being within ±10 percent of the target. Daily flow volumes are presented in Appendix E.
29

Table 4-4. ReCip® Influent Volume Summary
Target Average Monthly Month - Year Gallon/dose Doses/day Gallon/dose Gallon/day January 2003 33.3 15 32.8 492 February 2003 33.3 15 32.6 488 March 2003 33.3 15 32.5 487 April 2003 33.3 15 32.9 493 May 2003 33.3 15 34.4 515 June 2003 33.3 15 34.4 515 July 2003 33.3 15 34.6 518 1
August 2003 September 2003
33.3 15 33.3 15
34.9 524 32.9 495 2
October 2003 33.3 15 34.3 514 November 2003 33.3 15 33.3 500 3
December 2003 33.3 15 32.5 488 January 2004 33.3 15 34.4 516 February 2004 33.3 15 34.1 512 March 2004 33.3 15 33.9 508 April 2004 33.3 15 33.7 506
Mean 33.5 502 Maximum 34.9 524 Minimum 32.5 487 Std. Dev. 0.92 14
(1) July 2 – July 22: Low load test run in July; average flow data does not include the low flow days. Only normal flow days are included. During the low load test, flow was set at 50 percent of normal flow. Actual average flow during the low load test was 255 gpd.
(2) September 16 (p.m.) through September 18 (p.m.): During the power failure stress test, there was one day with no flow and one day with reduced flow. These data points were not included in the monthly average.
(3) November 13 – November 22: Vacation stress test, a 9–day test with 8 days of no flow. No/low flow days excluded from the calculations.
4.3.2 BOD5/CBOD5 and Suspended Solids Results
Figures 4-1 and 4-2 show the influent and effluent BOD5/CBOD5 and TSS concentrations during the verification test. Table 4-5 presents the same results with a summary of the data (mean, median, maximum, minimum, standard deviation). CBOD5 was measured in the effluent as required in the protocol. The use of the CBOD5 analysis was specified because the effluent from nutrient reduction systems is expected to be low in oxygen-demanding organics and have a large number of nitrifying organisms, which can cause nitrification to occur during the five days of analysis. The CBOD5 analysis inhibits nitrification and provides a better measurement of the oxygen-demanding organics in the effluent. The BOD5 test was used for the influent, which had much higher levels of oxygen-demanding organics, and was expected to have a very low
30

population of nitrifying organisms. In the standard BOD5 test, it is assumed that little nitrification occurs within the five days of the test. Therefore, the oxygen-demanding organics are the primary compounds measured in the wastewater influent. Comparing the BOD5 of the influent and the CBOD5 of the effluent demonstrates how effectively the system removes oxygen-demanding organics.
The influent wastewater had a mean BOD5 of 200 mg/L and a median BOD5 of 190 mg/L. The mean and median influent TSS was 130 mg/L. The ReCip® effluent had a mean CBOD5 of 28 mg/L and a median CBOD5 of 26 mg/L. The mean effluent TSS concentration was 13 mg/L, with a median concentration of 12 mg/L. The ReCip® achieved a mean of 86 percent reduction for BOD5/CBOD,5 with a median removal of 87 percent. The mean TSS removal was 90 percent over the 12-month period, with a median removal of 91 percent.
The change from two-hour to one-hour rest periods between cell pumping cycles made on January 22, 2003, appears to have improved BOD5 removal. By the start of the first stress test, the washday stress (February 18 to 22, 2003), the unit was producing effluent concentrations of 26 mg/L CBOD5 and 12 mg/L for TSS. Overall, washday stress did not appear to have an impact on CBOD5 and TSS performance. Post-stress-period monitoring showed consistent performance into April 2003. Effluent CBOD5 was in the range of 22 to 38 mg/L and TSS ranged from 9 to 14 mg/L.
The working parent stress test started on April 22 and was completed on April 26, 2003. The initial results during the stress test and for the first two days after the stress test showed little or no impact on the CBOD5 and TSS concentrations in the effluent. The last four sampling days (April 30 to May 3, 2003) in the post-stress-test period did show an increase in CBOD5 and TSS in the effluent. During May, the removal of CBOD5 continued to be slightly lower than during the previous four months. Improved removal of CBOD5 was achieved in June and at the beginning of the low load stress test.
Data collected during and following the low load stress test (July 2 to July 22, 2003) showed no major change in overall removal of CBOD5 and TSS. The effluent concentrations did show a wider range of results, but there was no clear trend or impact due to the stress test.
The monthly sample collected on August 21, 2003, showed a decrease in CBOD5 and TSS in the effluent. This improvement occurred after the pump cycle was changed to one-half hour rest periods between pumping cycles from the one-hour rest periods that had been set on January 22, 2003. The improved performance continued through the power/equipment failure stress test performed from September 16 to 18, 2003. The improved performance continued after the stress test with effluent CBOD5 concentrations in the 12 to 17 mg/L range and TSS concentrations in the 7 to 12 mg/L range.
The vacation stress test started on November 18. Effluent CBOD5 concentration showed an increasing trend (16 to 46 mg/L) after the end of the stress period, indicating that the stress test may have impacted effluent quality. During the vacation stress test, there was an eight-day period with no flow to the system, although power was maintained. The ReCip® pumps
31

continued to cycle during this stress test, but there was no flow or new food source to the unit. It is possible that the bacterial population adjusted to the lower organic levels during the stress test and then needed time to recover when flow and organic loading retuned to normal. Whatever the cause of the increase in effluent CBOD5, the performance improved rapidly in the next two weeks, and levels of CBOD5 were in the <2 to 12 mg/L range during the December sampling period.
32

1/8/20
03
1/22/2
003
2/5/20
032/1
9/200
33/5
/2003
3/19/2
003
4/2/20
034/1
6/200
34/3
0/200
35/1
4/200
35/2
8/200
36/1
1/200
36/2
5/200
37/9
/2003
7/2
3/200
38/6
/2003
8/20/2
003
9/3/20
039/1
7/200
310
/1/20
0310
/15/20
0310
/29/20
0311
/12/20
0311
/26/20
0312
/10/20
03
100
90
80
70
60
50
40
30
20
10
0
Efflu
ent C
BO
D (m
g/L)
350
300
250
200
150
100
50
0
Influ
ent B
OD
5 (m
g/L)
Date
I n f l uent E f f l uent
Figure 4-1. ReCip® BOD5/CBOD5 results.
33

1/8/20
03
1/22/2
003
2/5/20
03
2/19/2
003
3/5/20
03
3/19/2
003
4/2/20
03
4/16/2
003
4/30/2
003
5/14/2
003
5/28/2
003
6/11/2
003
6/25/2
003
7/9/20
03
7/23/2
003
8/6/20
03
8/20/2
003
9/3/20
03
9/17/2
003
10/1/
2003
10
/15/20
03
10/29
/2003
11
/12/20
03
11/26
/2003
12
/10/20
03
12/24
/2003
1/7
/2004
1/2
1/200
4 2/4
/2004
2/1
8/200
4
0
50
100
150
200
250 In
fluen
t TSS
(mg/
L)
0
5
10
15
20
25
30
35
40
45
50
Efflu
ent T
SS (m
g/L)
Date
Inf l ue nt E f f l ue nt
Figure 4-2. ReCip® total suspended solids results.
34

Table 4-5. ReCip® BOD5/CBOD5 and TSS Results
BOD5 CBOD5 TSS
Influent Effluent Removal Influent Effluent Removal Date (mg/L) (mg/L) (%) (mg/L) (mg/L) (%) 1/8/03 200 45 78 84 18 79 1/29/03 180 38 79 120 12 90 2/19/03 180 26 86 130 12 91 2/21/03 250 32 87 130 10 92 2/24/03 120 31 74 100 12 88 2/25/03 170 31 82 120 10 92 2/26/03 190 35 82 130 11 92 2/27/03 240 22 91 150 14 91 2/28/03 240 38 84 120 14 88 3/1/03 200 22 89 140 9 94 3/20/03 270 37 86 130 19 85 4/16/03 260 28 89 94 12 87 4/23/03 150 33 78 140 13 91 4/25/03 190 25 87 190 12 94 4/28/03 270 31 89 95 12 87 4/29/03 280 38 86 180 13 93 4/30/03 360 52 86 230 17 93 5/1/03 240 47 80 170 17 90 5/2/03 180 57 68 100 16 84 5/3/03 150 45 70 88 19 78 5/21/03 190 53 72 95 8 92 6/25/03 210 38 82 140 14 90 7/2/03 190 21 89 150 13 91 7/12/03 140 14 90 130 14 89 7/23/03 290 34 88 200 22 89 7/24/03 260 40 85 100 26 74 7/25/03 340 12 96 160 17 89 7/26/03 220 67 70 130 28 78 7/27/03 210 35 83 100 20 80 7/28/03 240 38 84 120 21 83
(continued)
35

Table 4-5. ReCip® BOD5/CBOD5 and TSS Results (continued)
BOD5 CBOD5 TSS
Influent Effluent Removal Influent Effluent Removal Date (mg/L) (mg/L) (%) (mg/L) (mg/L) (%) 8/21/03 190 14 93 92 8 91 9/10/03 190 19 90 110 8 93 9/16/03 130 15 88 130 10 92 9/22/03 170 14 92 120 12 90 9/23/03 200 13 94 130 10 92 9/24/03 200 14 93 120 10 92 9/25/03 150 14 91 100 10 90 9/26/03 98 12 88 110 7 94 10/15/03 190 17 91 140 10 93 10/22/03 150 15 90 190 9 95 11/12/03 160 28 83 130 8 94 11/14/03 200 21 90 130 9 93 11/19/03 140 20 86 150 8 95 11/30/03 170 16 91 110 6 95 12/1/03 160 19 88 150 9 94 12/2/03 190 22 88 140 10 93 12/3/03 240 32 87 160 13 92 12/4/03 200 46 77 120 16 87 12/16/03 170 24 86 200 10 95 12/17/03 150 <2 >99 110 10 91 12/18/03 150 8 95 140 8 94 12/19/03 200 12 94 82 10 88 12/21/03 180 12 93 130 11 92
Samples 53 53 53 53 53 53 Mean 200 28 86 130 13 90 Median 190 26 87 130 12 91 Max 360 67 >99 230 28 95 Min 98 <2 68 82 6 74 Std. Dev. 52 14 6.9 32 4.7 4.7 Note: Values below the detection limit were set to zero for concentration averages.
36

4.3.3 Nitrogen Reduction Performance
4.3.3.1 Results
Figures 4-3 through 4-5 present the results for TKN, NH3-N, and TN in the influent and effluent during the verification test. Figure 4-6 shows the results for NO2
- and NO3- in the effluent from
the ReCip®. Table 4-6 presents all of the nitrogen results with a summary of the data (mean, median, maximum, minimum, and standard deviation).
The influent wastewater had a mean TKN concentration of 36 mg/L and an average NH3-N concentration of 23 mg/L, with median concentrations of 36 mg/L and 23 mg/L, respectively. The average TN concentration in the influent was 36 mg/L (median of 36 mg/L), based on the generally accepted assumption that NO2
- and NO3- concentrations in the influent were negligible.
The ReCip® effluent had an average TKN concentration of 13 mg/L, with a median of 14 mg/L. The average NH3-N concentration in the effluent was 10 mg/L, with a median concentration of 10 mg/L. The NO2
- concentration in the effluent averaged 0.18 mg/L, with a median concentration of 0.12 mg/L. Effluent NO3
- concentrations averaged 1.6 mg/L over the 12-month test, with a median concentration of 0.8 mg/L. TN was determined by adding the concentrations of the TKN (organic plus NH3-N), NO2
-, and NO3-, resulting in an average TN in the ReCip®
effluent of 15 mg/L for the 12-month verification period, with a median concentration of 15 mg/L. The ReCip® averaged 58 percent reduction of TN for the verification test period, with a median removal of 60 percent.
Alkalinity, pH, dissolved oxygen (DO), and temperature were measured during the verification test. These parameters can provide insight into the condition of the system and can impact total nitrogen removal. Table 4-7 shows the results for alkalinity, DO, and pH. Temperature measurements are shown in Figure 4-7.
The pH of the influent was very consistent throughout the test, ranging from pH 7.0 to 7.6. The effluent from the ReCip® showed a slight decrease in pH, but in a similar range, consistently remaining in the pH 7.2 to 7.6 range. The alkalinity of the influent averaged 180 mg/L as CaCO3 with a maximum concentration of 220 mg/L and minimum of 96 mg/L. The effluent alkalinity was generally lower than the influent (as expected when nitrification/denitrification is occurring), with an average concentration of 140 mg/L and a median concentration of 130 mg/L. The effluent alkalinity did vary based on the performance of the nitrification and denitrification process.
The DO in the influent wastewater to the septic tank was low, as would be expected, averaging 0.3 mg/L. The ReCip® is designed to operate as both an aerobic and anaerobic system, with air being drawn in through the vents during pump cycles. The DO in the effluent from the system ranged from 0.3 to 5.2 mg/L and averaged 1.6 mg/L.
37
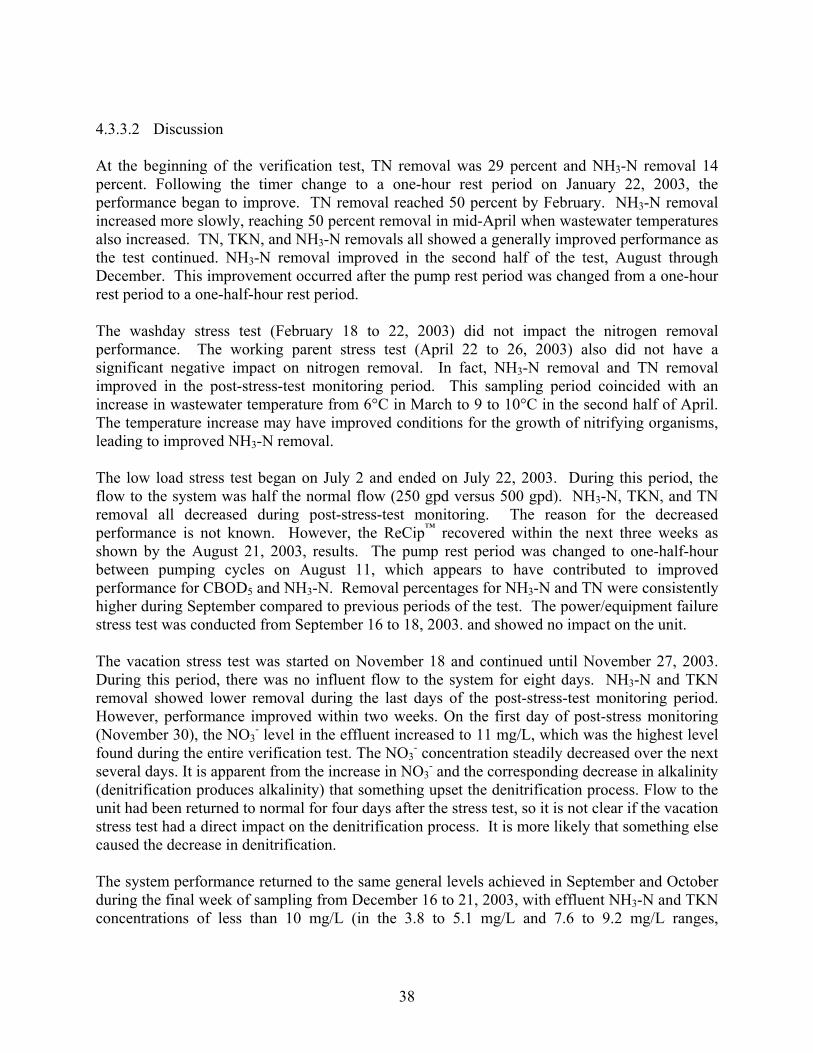
4.3.3.2 Discussion
At the beginning of the verification test, TN removal was 29 percent and NH3-N removal 14 percent. Following the timer change to a one-hour rest period on January 22, 2003, the performance began to improve. TN removal reached 50 percent by February. NH3-N removal increased more slowly, reaching 50 percent removal in mid-April when wastewater temperatures also increased. TN, TKN, and NH3-N removals all showed a generally improved performance as the test continued. NH3-N removal improved in the second half of the test, August through December. This improvement occurred after the pump rest period was changed from a one-hour rest period to a one-half-hour rest period.
The washday stress test (February 18 to 22, 2003) did not impact the nitrogen removal performance. The working parent stress test (April 22 to 26, 2003) also did not have a significant negative impact on nitrogen removal. In fact, NH3-N removal and TN removal improved in the post-stress-test monitoring period. This sampling period coincided with an increase in wastewater temperature from 6°C in March to 9 to 10°C in the second half of April. The temperature increase may have improved conditions for the growth of nitrifying organisms, leading to improved NH3-N removal.
The low load stress test began on July 2 and ended on July 22, 2003. During this period, the flow to the system was half the normal flow (250 gpd versus 500 gpd). NH3-N, TKN, and TN removal all decreased during post-stress-test monitoring. The reason for the decreased performance is not known. However, the ReCip™ recovered within the next three weeks as shown by the August 21, 2003, results. The pump rest period was changed to one-half-hour between pumping cycles on August 11, which appears to have contributed to improved performance for CBOD5 and NH3-N. Removal percentages for NH3-N and TN were consistently higher during September compared to previous periods of the test. The power/equipment failure stress test was conducted from September 16 to 18, 2003. and showed no impact on the unit.
The vacation stress test was started on November 18 and continued until November 27, 2003. During this period, there was no influent flow to the system for eight days. NH3-N and TKN removal showed lower removal during the last days of the post-stress-test monitoring period. However, performance improved within two weeks. On the first day of post-stress monitoring (November 30), the NO3
- level in the effluent increased to 11 mg/L, which was the highest level found during the entire verification test. The NO3
- concentration steadily decreased over the next several days. It is apparent from the increase in NO3
- and the corresponding decrease in alkalinity (denitrification produces alkalinity) that something upset the denitrification process. Flow to the unit had been returned to normal for four days after the stress test, so it is not clear if the vacation stress test had a direct impact on the denitrification process. It is more likely that something else caused the decrease in denitrification.
The system performance returned to the same general levels achieved in September and October during the final week of sampling from December 16 to 21, 2003, with effluent NH3-N and TKN concentrations of less than 10 mg/L (in the 3.8 to 5.1 mg/L and 7.6 to 9.2 mg/L ranges,
38

respectively). After a peak of 11 mg/L on November 30, 2003, the NO3- levels improved to
between 3.0 and 4.1 mg/L in late December.
39

1/8/20
03
1/22/2
003
2/5/20
03
2/19/2
003
3/5/20
03
3/19/2
003
4/2/20
03
4/16/2
003
4/30/2
003
5/14/2
003
5/28/2
003
6/11/2
003
6/25/2
003
7/9/20
03
7/23/2
003
8/6/20
03
8/20/2
003
9/3/20
03
9/17/2
003
10/1/
2003
10
/15/20
03
10/29
/2003
11
/12/20
03
11/26
/2003
12
/10/20
03
12/24
/2003
1/7
/2004
1/2
1/200
4 2/4
/2004
2/1
8/200
4
40
0
5
10
15
20
25
30
35
40
45
50
Date
TKN
(mg/
L)
Influent E ffluent
Figure 4-3. ReCip® Total Kjeldahl Nitrogen results.

1/8/20
03
1/22/2
003
2/5/20
03
2/19/2
003
3/5/20
03
3/19/2
003
4/2/20
03
4/16/2
003
4/30/2
003
5/14/2
003
5/28/2
003
6/11/2
003
6/25/2
003
7/9/20
03
7/23/2
003
8/6/20
03
8/20/2
003
9/3/20
03
9/17/2
003
10/1/
2003
10
/15/20
03
10/29
/2003
11
/12/20
03
11/26
/2003
12
/10/20
03
12/24
/2003
1/7
/2004
1/2
1/200
4 2/4
/2004
2/1
8/200
4
41
0
5
10
15
20
25
30
35
40
Date
Am
mon
ia N
itrog
en (m
g/L)
Inf l uent E f f l uent
Figure 4-4. ReCip® ammonia nitrogen results.

1/8/20
03
1/22/2
003
2/5/20
032/1
9/200
33/5
/2003
3/19/2
003
4/2/20
03
4/16/2
003
4/30/2
003
5/14/2
003
5/28/2
003
6/11/2
003
6/25/2
003
7/9/20
037/2
3/200
38/6
/2003
8/2
0/200
39/3
/2003
9/17/2
003
10/1/
2003
10/15
/2003
10/29
/2003
11/12
/2003
11/26
/2003
12/10
/2003
12/24
/2003
1/7/20
041/2
1/200
42/4
/2004
2/1
8/200
4
0
5
10
15
20
25
30
35
40
45
50 To
tal N
itrog
en (m
g/L)
Date
I n f l uent E f f l uent
Figure 4-5. ReCip® total nitrogen results.
42

1/8/20
03
1/22/2
003
2/5/20
03
2/19/2
003
3/5/20
03
3/19/2
003
4/2/20
03
4/16/2
003
4/30/2
003
5/14/2
003
5/28/2
003
6/11/2
003
6/25/2
003
7/9/20
03
7/23/2
003
8/6/20
03
8/20/2
003
9/3/20
03
9/17/2
003
10/1/
2003
10
/15/20
03
10/29
/2003
11
/12/20
03
11/26
/2003
12
/10/20
03
12/24
/2003
1/7
/2004
1/2
1/200
4 2/4
/2004
2/1
8/200
4
43
0.00
2.00
4.00
6.00
8.00
10.00
12.00
Date
Nitr
ite p
lus
Nitr
ate
(mg/
L)
E ffluent
Figure 4-6. ReCip® NO2 -and NO 3
- effluent concentrations.

1/8/20
03
1/22/2
003
2/5/20
03
2/19/2
003
3/5/20
03
3/19/2
003
4/2/20
03
4/16/2
003
4/30/2
003
5/14/2
003
5/28/2
003
6/11/2
003
6/25/2
003
7/9/20
03
7/23/2
003
8/6/20
03
8/20/2
003
9/3/20
03
9/17/2
003
10/1/
2003
10
/15/20
03
10/29
/2003
11
/12/20
03
11/26
/2003
12
/10/20
03
12/24
/2003
1/7
/2004
1/2
1/200
4 2/4
/2004
2/1
8/200
4
44
0
5
10
15
20
25
30
Date
Tem
pera
ture
(cel
sius
)
Influent E ffluent
Figure 4-7. ReCip® influent temperature.

Table 4-6. ReCip® Influent and Effluent Nitrogen Data
TKN NH3-N TN NO3 - NO2
-
(mg/L) (mg/L) (mg/L) (mg/L) (mg/L) Date Influent Effluent Influent Effluent Influent Effluent Effluent Effluent 1/8/03 38 27 21 18 38 27 <0.10 0.12 1/29/03 38 18 27 18 38 19 <0.10 0.86 2/19/03 33 16 22 15 33 16 <0.10 0.48 2/21/03 35 14 24 13 35 16 1.5 0.48 2/24/03 24 16 15 13 24 16 <0.10 0.34 2/25/03 30 14 19 10 30 15 <0.10 0.58 2/26/03 37 15 24 11 37 16 <0.10 0.59 2/27/03 33 16 20 12 33 16 <0.10 0.37 2/28/03 34 15 22 13 34 16 <0.10 0.56 3/1/03 37 17 23 12 37 18 <0.10 0.60 3/20/03 38 19 25 16 38 19 <0.10 0.41 4/16/03 32 15 22 11 32 15 <0.10 0.25 4/23/03 36 14 24 10 36 16 <0.10 <0.05 4/25/03 39 13 25 9.6 39 13 <0.10 0.15 4/28/03 40 14 26 11 40 14 <0.10 0.19 4/29/03 44 16 28 12 44 16 <0.10 0.22 4/30/03 44 15 28 12 44 15 <0.10 <0.05 5/1/03 38 16 26 12 38 16 <0.10 <0.05 5/2/03 36 17 25 13 36 17 <0.10 <0.05 5/3/03 34 17 24 12 34 17 <0.10 <0.05 5/21/03 27 13 20 9.6 27 16 2.7 <0.05 6/25/03 38 14 26 11 38 14 0.36 <0.05 7/2/03 44 11 35 8.0 44 14 3.4 <0.05 7/12/03 36 12 26 8.3 36 12 0.10 <0.05 7/23/03 39 17 21 14 39 17 0.14 <0.05 7/24/03 32 16 23 14 32 16 <0.10 <0.05 7/25/03 33 17 23 13 33 19 2.1 <0.05 7/26/03 36 22 23 14 36 24 1.6 <0.05 7/27/03 31 18 23 14 31 20 1.8 <0.05 7/28/03 39 22 23 15 39 24 1.8 <0.05
(Continued)
45

Table 4-6. ReCip® Influent and Effluent Nitrogen Data (continued)
TKN NH3-N TN NO3 - NO2
-
(mg/L) (mg/L) (mg/L) (mg/L) (mg/L) Date Influent Effluent Influent Effluent Influent Effluent Effluent Effluent 8/21/03 36 10 20 7.2 36 11 0.61 <0.05 9/10/03 33 8.2 23 6.4 33 10 1.9 0.09 9/16/03 25 7.5 20 6.2 25 8.2 0.62 0.09 9/22/03 38 8.5 23 5.3 38 9.4 0.80 0.06 9/23/03 36 8.8 23 5.4 36 10 0.97 0.06 9/24/03 35 8.7 24 6.2 35 10 1.2 0.06 9/25/03 41 9.7 24 6.4 41 11 0.97 <0.05 9/26/03 38 8.6 29 6.6 38 10 1.6 0.08 10/15/03 36 10 24 7.7 36 13 2.5 0.19 10/22/03 37 9.3 6.6 37 13 3.5 0.15 11/12/03 37 7.8 23 5.7 37 11 3.4 0.10 11/14/03 3.0 2.8 0.22 11/19/03 36 8.3 21 6.7 36 12 3.0 0.30 11/30/03 37 5.4 21 3.4 37 17 11 0.15 12/1/03 40 7.7 25 4.9 40 18 9.8 0.19 12/2/03 40 7.9 22 4.9 40 15 7.1 0.23 12/3/03 40 15 24 10 40 17 1.5 0.09 12/4/03 36 21 21 17 36 21 0.05 0.06 12/16/03 34 8.3 21 5.1 34 12 3.9 0.22 12/17/03 39 8.2 18 4.0 39 13 4.1 0.22 12/18/03 36 8.3 22 4.0 36 12 3.7 0.21 12/19/03 35 9.2 24 5.1 35 12 3.0 0.19 12/21/03 39 7.6 22 3.8 39 11 3.4 0.16
Samples 52 52 51 52 52 53 53 53 Mean 36 13 23 10 36 15 1.7 0.18 Median 36 14 23 10 36 15 0.8 0.12 Maximum 44 27 35 18 44 27 11 0.86 Minimum 24 5.4 15 3.4 24 3.0 <0.10 <0.05 Std. Dev. 4.1 4.7 3.1 4.0 4.1 4.2 2.3 0.20 Values below the detection limit were set equal to zero for statistical calculations. N/R—not reported.
46

Table 4-7. ReCip® Alkalinity, pH, and Dissolved Oxygen Results
Alkalinity Dissolved Oxygen pH (mg/L as CaCO3) (mg/L) (S.U.)
Date Influent Effluent Influent Effluent Influent Effluent 1/8/03 160 160 0.1 0.8 7.3 7.3 1/29/03 170 140 0.1 1.6 7.4 7.2 2/19/03 160 120 1.4 2.2 7.5 7.2 2/21/03 180 150 0.4 3.2 7.2 7.6 2/24/03 96 150 3.4 2.1 7.2 7.4 2/25/03 150 130 2.0 1.9 7.6 7.4 2/26/03 160 120 0.9 1.1 7.6 7.5 2/27/03 160 130 1.5 1.3 7.6 7.5 2/28/03 170 130 1.0 1.1 7.6 7.4 3/1/03 150 130 1.1 1.5 7.4 7.6 3/20/03 170 140 0.2 1.7 7.5 7.4 4/16/03 170 130 0.5 5.2 7.5 7.2 4/23/03 160 140 0.2 0.9 7.1 7.5 4/25/03 180 130 0.2 1.3 7.3 7.3 4/28/03 190 140 0.1 1.2 7 7.4 4/29/03 200 140 0.1 0.9 7.6 7.5 4/30/03 180 140 0.2 0.8 7.6 7.4 5/1/03 190 140 0.3 0.8 7.4 7.3 5/2/03 180 140 0.1 1.3 7.5 7.4 5/3/03 180 140 0.1 2.5 7.2 7.2 5/21/03 150 120 0.1 0.9 7.5 7.4 6/25/03 190 150 0.2 2.1 7.3 7.2 7/2/03 210 140 0.1 1.7 7.3 7.2 7/12/03 180 150 0.1 0.5 7.2 7.2 7/23/03 170 170 <0.1 1.4 7.3 7.3 7/24/03 180 170 0.1 1.0 7.3 7.6 7/25/03 180 160 <0.1 0.8 7.4 7.2 7/26/03 180 160 0.1 1.8 7.4 7.2 7/27/03 180 160 0.1 0.9 7.4 7.2 7/28/03 180 160 <0.1 0.3 7.4 7.2
(Continued)
47

Table 4-7. ReCip® Alkalinity, pH, and Dissolved Oxygen Results (continued)
Alkalinity Dissolved Oxygen pH (mg/L as CaCO3) (mg/L) (S.U.)
Date Influent Effluent Influent Effluent Influent Effluent 8/21/03 180 130 0.1 1.6 7.3 7.3 9/10/03 180 140 <0.1 1.0 7.3 7.5 9/16/03 170 130 0.1 4.8 7.3 7.5 9/22/03 190 130 0.2 2.6 7.4 7.4 9/23/03 200 140 <0.1 0.6 7.3 7.3 9/24/03 190 130 <0.1 0.8 7.4 7.4 9/25/03 200 140 <0.1 1.0 7.4 7.2 9/26/03 200 130 0.1 0.9 7.6 7.2 10/15/03 190 130 0.2 2.1 7.3 7.3 10/22/03 200 130 0.2 1.6 7.4 7.3 11/12/03 210 130 <0.1 1.6 7.5 7.3 11/14/03 210 130 <0.1 1.7 7.3 7.4 11/19/03 190 130 0.1 2.5 7.4 7.6 11/30/03 210 100 0.1 3.0 7.4 7.3 12/1/03 200 110 0.1 1.2 7.4 7.3 12/2/03 200 120 <0.1 1.3 7.5 7.4 12/3/03 220 170 0.2 0.8 7.4 7.5 12/4/03 210 200 0.1 0.9 7.5 7.6 12/16/03 170 110 0.1 1.9 7.6 7.3 12/17/03 190 110 0.3 2.0 7.5 7.2 12/18/03 200 110 0.3 1.5 7.6 7.2 12/19/03 200 120 0.3 2.5 7.6 7.4 12/20/03 200 110 0.5 3.4 7.5 7.3
Samples 53 53 53 53 53 53 Mean 180 140 0.3 1.6 N/A N/A Median 180 130 0.1 1.4 7.4 7.3 Maximum 220 200 3.4 5.2 7.6 7.6 Minimum 96 100 <0.1 0.3 7.0 7.2 Std. Dev 21 19 0.6 1.0 0.1 0.1 N/A – not applicable. N/R – not reported.
48

4.3.4 Residuals Results
The ReCip® was inspected at the end of the test for solids buildup in the area below the medium and near the pump in both cells. Based on visual observation, there was no solids buildup in the bottom of the cells or near the pumps, and, therefore, residuals samples were not collected. Observation of the pump cycles and the pump placement suggests that solids will not typically settle or accumulate in the cells, as they are constantly being pumped back and forth between the cells. This water movement by the pumps appears to keep the solids from settling in the cells.
4.4 Operation and Maintenance
Operation and maintenance performance of the ReCip® was monitored throughout the verification test. A field log was maintained that included all observations made over the 12month test period. Data were collected on electrical and chemical usage, noise, and odor. Observations were recorded on the condition of the system, any changes in setup or operation (pump adjustments, cleaning, etc.) or any problems that required resolution. A complete set of field logs is included in Appendix F. There were no major mechanical component failures during the verification test. The float on the pump in cell one did stick on two occasions. The pump was removed from the cell, cleaned, and placed back in service, and sampling was not affected.
4.4.1 Electric Use
A dedicated electric meter was used to monitor electrical usage by the ReCip®. BCDHE personnel recorded the meter reading at least biweekly in the field log. Table 4-8 shows a summary of the electrical use during the verification test (January 2003 through December 2003). The complete set of electrical readings is presented in a spreadsheet in Appendix E. The system tested used two pumps; one pump in cell one and one pump in cell two. There were no other electrical devices, such as a fans or heaters used in the unit. Power use was directly related to the timer setting controlling the frequency of pumping between cells.
49

Table 4-8. Summary of ReCip® Electrical Usage (kW/day)
Two-hour rest One-hour rest One-half-hour between pump between pump rest between
cycles cycles pump cycles Readings 13 126 68 Mean 1.4 2.2 3.9 Median 1.0 2.0 4.0 Maximum 2.0 3.0 5.0 Minimum 1.0 1.0 2.0 Std. Dev. 0.49 0.47 0.57
Note: All usage in kW/day.
4.4.2 Chemical Use
The ReCip® did not require or use any chemical addition as part of normal unit operation.
4.4.3 Noise
Noise levels associated with mechanical equipment were measured once during the verification period. A decibel meter was used to measure the noise level. Measurements were taken 1 meter from the unit and 1½ meters above the ground, at 90° intervals in four directions. The meter was calibrated prior to use. Two measurements were taken near the laboratory trailer and averaged to provide background data. Table 4-9 shows the results from this test.
Table 4-9. ReCip® Noise Measurements
Location
Background
Reading (decibels)
85.0
East South West North All Locations
93.4 97.2 77.9 84.7 88.0
Decibels are a log scale so averages are calculated on a log basis
4.4.4 Odor Observations
Monthly odor observations were made during the verification test. Each odor observation was qualitative based on odor strength (intensity) and type (attribute). Intensity was stated as not discernable, barely detectable, moderate, or strong. Observations were made during periods of low wind velocity (<10 knots). The observer stood upright at a distance of three feet from the
50

treatment unit, and recorded any odors at 90° intervals in four directions (minimum number of points). The same BCDHE employee made all observations. Table 4-10 summarizes the results of the odor observations. There were no discernible odors found during any of the observation periods.
Table 4-10. Odor Observations
Number of Date Points Observed Observation 11/26/02 8 No discernable odor 12/22/02 8 No discernable odor 1/19/03 8 No discernable odor 1/26/03 8 No discernable odor 2/20/03 8 No discernable odor 3/9/03 8 No discernable odor 4/13/03 8 No discernable odor 5/10/03 8 No discernable odor 5/31/03 8 No discernable odor 6/14/03 8 No discernable odor 8/24/03 8 No discernable odor 9/7/03 8 No discernable odor 10/18/03 8 No discernable odor
4.4.5 Operation and Maintenance Observations
During the test, very few problems were encountered with the mechanical operation of the system. BioConcepts checked the system in October 2002 just before the official startup period. The unit had been running for three months prior to the official startup to check out the entire test system. During the October cleanup and check, BioConcepts changed the medium in the unit, plastic “bioballs”, to a new medium that was an expanded slate aggregate. Once the unit was started in October, the only maintenance performed was to clean the floats on the pump in cell one. On two occasions, March 1 and August 2, 2003, it was noted that the pumps were not cycling properly. This was caused by the low water shutoff float becoming stuck and not allowing the pump to operate. The pump was pulled using the procedures described in the O&M manual. The float was cleaned and the pump reinstalled. This solved the problem in both cases.
One recommendation in the O&M Manual is that the homeowner or a hired service contractor should check the pump cycle and the water levels in the two cells once per month. The procedure is easy and well described in the O&M Manual: visual observation of the water depth in each cell and cycling the pumps manually if required. While the procedure is easy, it is important that it be followed on a regular (at least monthly) basis. A pump failure for any reason will affect the treatment performance, as the cells will not receive the oxygen from the air that is normally drawn into the cell during active pumping periods.
51

The O&M Manual (considered proprietary) supplied by BioConcepts to MASSTC and NSF personnel provided a basic overview of the process and sufficient information for the test center staff to operate the unit. After the system configuration overview and two good system diagrams, BioConcepts presents a simple description of the system function with reference to nitrification and denitrification processes. There is a good description of the control panel timer and alarm controls. The troubleshooting section focuses entirely on troubleshooting the two pumps in the system. There is a detailed description of how to tell if either pump is not working properly and describes how to remove the pumps and check the float switches. There is no assistance given for troubleshooting the biological process should treatment performance deteriorate. Also, there is no guidance on when the timer settings should be adjusted from the default values of 15 minutes of pumping followed by a two-hour rest period. BioConcepts recommends that a qualified service provider be hired to check the system and service as needed.
The installation section is one paragraph long indicating that the system is easy to install. It is clearly stated that homeowners should never try to install the unit themselves, but that a licensed installer should be hired to perform the installation. Based on this information, it must be assumed that the licensed installer will be provided with additional information on the proper installation methods for the unit. The contractor hired for the installation at MASSTC did not have any problem installing the unit.
In the opinion of the test site operators, the system was easy to operate and maintain. In fact, the only operational change that can be made is to change the timer settings to adjust the runtime on the pumps and the rest period between pump cycles. It is important that the water depth in the cells be checked on a regular basis (at least once per month) to ensure that the pumps are operating properly. A homeowner can perform this simple check, in addition to checking for and being aware of unusual noises (or lack of sound from the system), alarms, or any unusual odors. Removing the pump and cleaning the float, as was done twice during the test, is also straightforward and easy enough for a homeowner to do. However, there are electrical and biological hazards that need to be taken into consideration when performing this type of activity.
It is important that the screens on the vents be kept clean and clear so that air can flow in and out of the cells. These screens remained clear during the verification test, but do need to be checked on a regular basis. The MASSTC operators believe quarterly or semi-annual maintenance checks of the system by a qualified service contractor would be adequate and appropriate to address any anticipated problems and ensure good system performance. Based on 12 months of observation, it is estimated that normal maintenance checks would require less than one hour to ensure that the system is in good operating condition. The skill level needed is the equivalent of a Class II Massachusetts treatment plant operator.
Maintenance activities, provided by a qualified service provider, should include cleaning the screens on the vents and checking the water level in the cells. The pumps should be cycled, and alarms and floats should be checked for proper operation. Samples of the treated water should be collected as needed to verify treatment performance.
52

A qualified service provider should also check the septic tank for solids depth, and if solids have built up in the tank, pumping the septic tank should be scheduled. The ReCip® O&M Manual recommends an annual check of the septic tank, which should be adequate. There is no guidance on the solids depth in the septic tank that would indicate that the tank should be pumped.
The verification test ran for a period of 12 months, which provided sufficient time to evaluate the overall performance of the unit. The equipment seemed to be properly constructed and used appropriate materials of construction for wastewater treatment applications. The use of aluminum and PVC components, pumps designed for wastewater service, and the overall design of the system would indicate that it should have reasonable life expectancy. The verification did not run long enough to truly evaluate length of equipment life or provide life cycle information. The basic components of the system appear durable.
No particular design considerations are necessary relative to placement, as most of the unit is below grade (vents are above grade) and the noise level from the pumps is moderate to low.
4.5 Post-Verification Test Data
Following the verification test period, the ReCip® was operated for an additional four months at the vendor’s request, to obtain additional performance data for the system. These data are presented in Tables 4-11 and 4-12.
53

Table 4-11. Post-Verification Test Period Data – CBOD5, TSS, TKN, NH3-N, TN, NO3-, NO2
-
CBOD5 TSS TKN NH3-N TN NO3-
NO
2-
Influent Effluent Influent Effluent Influent Effluent Influent Effluent Influent Effluent Effluent Effluent Date (mg/L) (mg/L) (mg/L) (mg/L) (mg/L) (mg/L) (mg/L) (mg/L) (mg/L) (mg/L) (mg/L) (mg/L) 1/21/04 150 <2 110 7 32 6.5 14 3.4 32 9.1 2.5 0.10 2/18/04 260 61 160 14 29 24 15 18 29 24 <0.02 0.04 3/24/04 130 24 130 10 32 14 19 11 32 15 0.95 0.40 3/31/04 120 11 110 9 32 16 26 11 32 17 0.90 0.13 4/07/04 89 19 47 7 30 16 21 11 30 17 1.0 <0.05 4/21/04 120 10 130 4 38 6.4 24 4.7 38 8.7 2.3 <0.05 4/28/04 120 16 180 10 42 13 23 8.0 42 14 1.0 <0.05
Table 4-12. Post-Verification Test Period Data – Alkalinity, DO, pH
Alkalinity DO pH (mg/L as CaCO3) (mg/L) (S.U.)
Date Influent Effluent Influent Effluent Influent Effluent 1/21/04 160 110 0.8 1.7 7.3 7.2 2/18/04 160 170 1.6 1.7 7.4 7.5 3/24/04 170 120 0.4 4.5 7.3 7.5 3/31/04 170 130 0.2 5.2 7.3 7.4 4/07/04 170 130 0.2 1.4 7.5 7.3 4/21/04 180 110 0.4 0.8 7.4 7.2 4/28/04 180 130 0.1 1.1 7.4 7.2
54

4.6 Quality Assurance/Quality Control
The VTP included a QAPP that identified critical measurements and established data quality objectives (DQO). The verification test procedures and data collection followed the QAPP, and summary results are reported in this section. The full laboratory QA/QC results and supporting documentation are presented in Appendix C.
4.6.1 Audits
In June 2003, NSF conducted an audit of the MASSTC and the BDCHE Laboratory. This audit found that the field and laboratory procedures were being followed as presented in the VTP.
The audit found that the procedures being used in the field and the laboratory were in accordance with the established QAPP. The laboratory had a firmly established QA/QC program, and observation of the analyses and a records review found that appropriate QC was being performed with the analyses. All members of the testing team were reminded that an ETV evaluation requires that copies of all logs and raw data records be delivered to NSF at the end of the project.
Internal audits of the field and laboratory operations were also conducted at least quarterly by BCDHE. These audits specifically reviewed procedures and records for the ETV project. Any shortcomings found during these internal audits were corrected as the test continued.
4.6.2 Daily Flows
One critical data quality objective was to dose the unit on a daily basis to within 10 percent of the design flow, or 500 gpd ±10 percent, based on a monthly average of the daily flows. The dose volume was calibrated twice per week and if the volume changed by more than 10 percent, the dosing pump runtime was adjusted in the PLC. The objective was met for all 12 months of the verification test period. The monthly averages were presented in Table 4-4. The daily flows for all months and the twice per week calibration data are presented in spreadsheet format in Appendix E.
4.6.3 Precision
Measurements to monitor the overall precision of the sample collection processes and laboratory analyses were performed throughout the verification test by the collection and analysis of duplicate samples. The test plan did not differentiate between laboratory precision and field precision. Field duplicate samples were analyzed for all parameters except pH, temperature, and DO at a frequency of at least one duplicate for every ten samples analyzed or one per batch if less than ten samples in a batch. The results for the duplicate samples are presented in the data reports received from the laboratory and are available in spreadsheet format in Appendix E. Summaries of the duplicate data used to determine whether the precision objectives for the verification test were met are presented in Tables 4-14 and 4-15.
55

Relative percent difference (RPD) between a sample and its duplicate was calculated using the standard formula as follows:
RPD = [(C1- C2) ÷ ((C1 + C2)/2)] x 100%
Where:
C1 = Concentration of the compound or element in the sample C2 = Concentration of the compound or element in the duplicate
Table 4-13. Acceptance Criteria for Duplicates
Acceptance Limits Parameter (RPD) TSS 20 Alkalinity 20 BOD5/CBOD5 30 TKN 20 NH3-N 20 NO2
20 NO3
20
56

Table 4-14. Duplicate Field Sample Summary – Nitrogen Compounds
TKN NH3-N Rep 1 Rep 2 RPD Rep 1 Rep 2 RPD
Statistics (mg/L) (mg/L) (%) (mg/L) (mg/L) (%) Number 22 22 22 22 22 22 Mean 20 21 4.9 15 14 3.8 Median 16 18 4.6 14 14 3.2 Maximum 40 38 19.9 25 25 13 Minimum 7.6 7.4 0.0 3.8 3.9 0.0 Std. Deviation 11 10 5.5 7.2 7.1 4.0
NO2- NO3
-
Rep 1 Rep 2 RPD Rep 1 Rep 2 RPD Statistics (mg/L) (mg/L) (%) (mg/L) (mg/L) (%) Number 15 15 15 15 15 15 Mean 0.22 0.22 1.3 1.2 1.2 0.76 Median 0.2 0.2 0.0 3.1 3.1 0.0 Maximum 0.86 0.85 7.7 7.1 7.1 8.7 Minimum <0.05 <0.05 0.0 <0.10 <0.10 0.0 Std. Deviation 0.2 0.2 2.6 2.1 2.1 2.3
Values below the detection limit were set equal to zero for statistical calculations.
Table 4-15. Duplicate Field Sample Summary – CBOD, BOD, Alkalinity, TSS
BOD5/CBOD5 TSS Rep 1 Rep 2 RPD Rep 1 Rep 2 RPD
Statistics (mg/L) (mg/L) (%) (mg/L) (mg/L) (%) Number 22 22 22 22 22 22 Mean 91 90 12 47 48 4.2 Median 39 38 8.1 14 14 2 Maximum 290 270 33 140 140 17 Minimum 7.8 5.6 0.0 8.0 8.0 0.0 Std. Deviation 96 94 10 52 54 5.5
Alkalinity Rep 1 Rep 2 RPD
Statistics (mg/L as CaCO3) (mg/L as CaCO3) (%) Number 22 22 22 Mean 150 150 2.4 Median 140 140 1.5 Maximum 200 200 11 Minimum 110 110 0.0 Std. Deviation 28 28 2.6
Values below the detection limit were set equal to zero for statistical calculations.
57

The RPD results for the field duplicate samples and the analytical samples were within the acceptance criteria for all samples, with the exception of one BOD sample, which was equal to the upper acceptance limit (5/21/03 influent sample = 30 RPD).
4.6.4 Accuracy
Method accuracy was determined and monitored using a combination of matrix spikes and lab control samples (with a known concentration of an analyte in blank water), depending on the method. When matrix spike samples were analyzed as part of a batch of samples, the spiked sample was not necessarily an ETV sample. Recovery of the spiked analytes was calculated and monitored during the verification test. Recoveries for all matrix spikes and lab control samples were within the established windows, with the exception of one set of NH3-N matrix spikes and one set of NO2
- matrix spikes, for which recoveries were low. Each data set was examined and each data set was judged valid and useable. Tables 4-16 and 4-17 show a summary of the recovery data. The results for the matrix spike and lab control samples are available in spreadsheet format in Appendix E.
The equations used to calculate the recoveries for spiked samples and laboratory control samples are as follows.
Matrix Spike Samples:
Percent Recovery = (Cr-Co)/Cf x 100%
Where: Cr = Total amount detected in spiked sample Co = Amount detected in un-spiked sample Cf = Spike amount added to sample.
Lab Control Sample:
Percent Recovery = (Cm /Cknown) x 100%
Where:
Cm = measured concentration in the spike control sample Cknown = known concentration
58

Table 4-16. Accuracy Results – Nitrogen Analyses
TKN NH3-N (% Recovery) (% Recovery)
Lab Control Lab Control Statistics Matrix Spike Sample Matrix Spike Sample Number 3 45 3 42 Mean 99 103 84 100
Median 95 103 85 101 Maximum 115 113 98 119 Minimum 87 88 70 83 Std. Dev. 14 7.5 14 6.9
NO2- NO3
(% Recovery) (% Recovery) Lab Control Lab Control
Statistics Matrix Spike Sample Matrix Spike Sample Number 27 4 28 6 Mean 98 107 105 101
Median 102 108 105 102 Maximum 120 110 134 108 Minimum 10 101 65 90 Std. Dev. 22 4.0 15 7.5
Table 4-17. Accuracy Results – Alkalinity, BOD5, CBOD5
Alkalinity BOD5/COD5 (% Recovery) (% Recovery) Lab Control Lab Control
Statistics Sample Sample Number 46 54 Average 102 102 Median 100 100
Maximum 112 135 Minimum 92 77 Std. Dev. 4.1 10
The balance used for TSS analysis was calibrated routinely with weights that were NIST- traceable. Calibration records were maintained by the laboratory and inspected during the onsite audit. The temperature of the drying oven was also monitored using a thermometer that was calibrated with a NIST-traceable thermometer. The pH meter was calibrated using a three-point calibration curve with purchased buffer solutions of known pH. Field temperature measurements were performed using a thermometer that was calibrated using a NIST-traceable thermometer provided to the field lab by the BCDHE laboratory. The dissolved oxygen meter was calibrated daily using ambient air and temperature readings in accordance with the SOP. The noise meter
59

was calibrated prior to use and all readings were recorded in the field logbook. All of these traceable calibrations were performed to ensure the accuracy of measurements.
4.6.5 Representativeness
The field procedures, as documented in the MASSTC SOPs (Appendix B), were designed to ensure that representative samples were collected of both influent and effluent wastewater. The composite sampling equipment was calibrated on a routine basis to ensure that proper sample volumes were collected to provide flow weighted sample composites. Field duplicate samples and supervisor oversight provided assurance that procedures were being followed. The field duplicates showed that there was some variability in the duplicate samples. However, based on 22 sets of field duplicates, the overall average TSS of the replicates was very close (47 and 48 mg/L). These data indicated that while individual sample variability may occur, the long-term trend in the data was representative of the concentrations in the wastewater.
The laboratories used standard analytical methods and written SOPs for each method to provide a consistent approach to all analyses. Sample handling, storage, and analytical methodology were reviewed during the on-site and internal audits to verify that standard procedures were being followed. The use of standard methodology, supported by proper quality control information and audits, ensured that the analytical data was representative of the actual wastewater conditions.
4.6.6 Completeness
The VTP set a series of goals for completeness. During the startup and verification test, flow data was collected for each test day and the dosing pump flow rate was calibrated twice a week as specified. The flow records were 100 percent complete.
Electric meter readings were performed twice a week and are summarized in a spreadsheet in Appendix E. Of 104 required biweekly readings, five readings were not taken (during the weeks of 8/3 to 8/9/03, 8/24 to 8/30/03, and 10/12 to 10/16/03), giving a completeness of 95 percent, which exceeds the minimum completeness requirement for the test of 83 percent.
The goal set in the VTP for sample collection completeness for both the monthly samples and stress test samples was 83 percent. All monthly samples were collected and all stress test samples were collected in accordance with the VTP schedule. Therefore, sample collection was 100 percent complete.
A goal of 83 percent was set for the completeness of analytical results from the BCDHE laboratory and GAI. All scheduled analyses for delivered samples were completed and found to be acceptable, useable data. Completeness is 100 percent for the laboratory.
60

C
Appendices
A BioConcepts ReCip® Verification Test Plan B MASSTC Field SOPs
Lab Data and QA/QC Data D Field Lab Log Book E Spreadsheets with Calculation and Data Summary F Field Operations Logs
Appendices are not included in the Verification Report. Appendices are available from NSF upon request.
61

Glossary
Accuracy - a measure of the closeness of an individual measurement or the average of a number of measurements to the true value and includes random error and systematic error.
Bias - the systematic or persistent distortion of a measurement process that causes errors in one direction.
Commissioning – the installation of the nutrient reduction technology and start-up of the technology using test site wastewater.
Comparability – a qualitative term that expresses confidence that two data sets can contribute to a common analysis and interpolation.
Completeness – a qualitative and quantitative term that expresses confidence that all necessary data have been included.
Precision - a measure of the agreement between replicate measurements of the same property made under similar conditions.
Protocol – a written document that clearly states the objectives, goals, scope and procedures for the study. A protocol shall be used for reference during Vendor participation in the verification testing program.
Quality Assurance Project Plan – a written document that describes the implementation of quality assurance and quality control activities during the life cycle of the project.
Residuals – the waste streams, excluding final effluent, which are retained by or discharged from the technology.
Representativeness - a measure of the degree to which data accurately and precisely represent a characteristic of a population parameter at a sampling point, a process condition, or environmental condition.
Standard Operating Procedure – a written document containing specific procedures and protocols to ensure that quality assurance requirements are maintained.
Technology Panel - a group of individuals established by the Verification Organization with expertise and knowledge in nutrient removal technologies.
Testing Organization – an independent organization qualified by the Verification Organization to conduct studies and testing of nutrient removal technologies in accordance with protocols and test plans.
Vendor – a business that assembles or sells nutrient reduction equipment.
62

Verification – to establish evidence on the performance of nutrient reduction technologies under specific conditions, following a predetermined study protocol(s) and test plan(s).
Verification Organization – an organization qualified by EPA to verify environmental technologies and to issue Verification Statements and Verification Reports.
Verification Report – a written document containing all raw and analyzed data, all QA/QC data sheets, descriptions of all collected data, a detailed description of all procedures and methods used in the verification testing, and all QA/QC results. The Verification Test Plan(s) shall be included as part of this document.
Verification Statement – a document that summarizes the Verification Report and is reviewed and approved by EPA.
Verification Test Plan – A written document prepared to describe the procedures for conducting a test or study according to the verification protocol requirements for the application of nutrient reduction technology at a particular test site. At a minimum, the Verification Test Plan includes detailed instructions for sample and data collection, sample handling and preservation, and quality assurance and quality control requirements relevant to the particular test site.
63

References
Cited References
1.) APHA, AWWA, and WEF. Standard Methods for the Examination of Water and Wastewater, 19th Edition. 1998. Washington, DC.
2.) NSF International. Protocol for the Verification of Residential Wastewater Treatment Technologies for Nutrient Reduction. November 2000. Ann Arbor, Michigan.
3.) NSF International. Test Plan for The Massachusetts Alternative Septic System Test Center for Verification Testing of ReCip® Nutrient Reduction Technology. December, 2002.
4.) United States Environmental Protection Agency. Methods for Chemical Analysis of Water and Wastes. EPA 600/4-79-020. Revised March 1983.
5.) United States Environmental Protection Agency. Methods and Guidance for Analysis of Water. 1999. EPA 821-C-99-008. Office of Water, Washington, DC.
6.) United States Environmental Protection Agency. Manual for Nitrogen Control. 625/R93/010. 1993.
7.) United States Environmental Protection Agency. Wastewater Technology Fact Sheet Trickling Filter Nitrification. EPA 832-F-00-015. September 2000. Office of Water, Washington DC.
Additional Background References
8.) ANSI/ASQC.: Specifications and Guidelines for Quality Systems for Environmental Data Collection and Environmental Technology Programs (E4. 1994.
9.) NSF International. Environmental Technology Verification—Source Water Protection Technologies Pilot Quality Management Plan. 2000. Ann Arbor, Michigan.
10.) United States Environmental Protection Agency. Environmental Technology Verification Program—Quality and Management Plan for the Pilot Period (1995–2000). EPA/600/R98/064. 1998. Office of Research and Development, Cincinnati, Ohio.
11.) United States Environmental Protection Agency. EPA Guidance for Quality Assurance Project Plans, EPA QA/G-5. EPA/600/R-98-018. 1998. Office of Research and Development, Washington, DC.
12.) United States Environmental Protection Agency. Guidance for the Data Quality Objectives Process, EPA QA/G-4 EPA/600/R-96-055. 1996. Office of Research and Development, Washington, DC.
64