Embed Size (px)
Citation preview
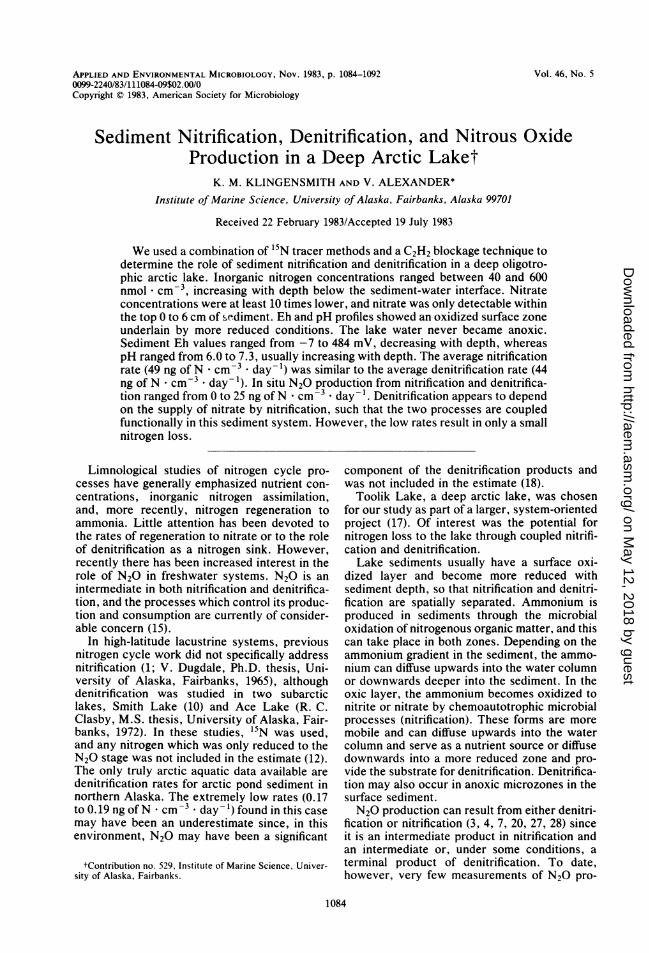
APPLIED AND ENVIRONMENTAL MICROBIOLOGY, Nov. 1983, p. 1084-1092 Vol. 46, No. 50099-2240/83/111084-09$02.00/0Copyright C 1983, American Society for Microbiology
Sediment Nitrification, Denitrification, and Nitrous OxideProduction in a Deep Arctic Laket
K. M. KLINGENSMITH AND V. ALEXANDER*Institute of Marine Science, University of Alaska, Fairbanks, Alaska 99701
Received 22 February 1983/Accepted 19 July 1983
We used a combination of 15N tracer methods and a C2H2 blockage technique todetermine the role of sediment nitrification and denitrification in a deep oligotro-phic arctic lake. Inorganic nitrogen concentrations ranged between 40 and 600nmol cm3, increasing with depth below the sediment-water interface. Nitrateconcentrations were at least 10 times lower, and nitrate was only detectable withinthe top 0 to 6 cm of sediment. Eh and pH profiles showed an oxidized surface zoneunderlain by more reduced conditions. The lake water never became anoxic.Sediment Eh values ranged from -7 to 484 mV, decreasing with depth, whereaspH ranged from 6.0 to 7.3, usually increasing with depth. The average nitrificationrate (49 ng of N *cm-3 * day-1) was similar to the average denitrification rate (44ng of N * cm-3 * day-1). In situ N20 production from nitrification and denitrifica-tion ranged from 0 to 25 ng of N* cm-3 * day-'. Denitrification appears to dependon the supply of nitrate by nitrification, such that the two processes are coupledfunctionally in this sediment system. However, the low rates result in only a smallnitrogen loss.
Limnological studies of nitrogen cycle pro-cesses have generally emphasized nutrient con-centrations, inorganic nitrogen assimilation,and, more recently, nitrogen regeneration toammonia. Little attention has been devoted tothe rates of regeneration to nitrate or to the roleof denitrification as a nitrogen sink. However,recently there has been increased interest in therole of N20 in freshwater systems. N20 is anintermediate in both nitrification and denitrifica-tion, and the processes which control its produc-tion and consumption are currently of consider-able concern (15).
In high-latitude lacustrine systems, previousnitrogen cycle work did not specifically addressnitrification (1; V. Dugdale, Ph.D. thesis, Uni-versity of Alaska, Fairbanks, 1965), althoughdenitrification was studied in two subarcticlakes, Smith Lake (10) and Ace Lake (R. C.Clasby, M.S. thesis, University of Alaska, Fair-banks, 1972). In these studies, 15N was used,and any nitrogen which was only reduced to theN20 stage was not included in the estimate (12).The only truly arctic aquatic data available aredenitrification rates for arctic pond sediment innorthern Alaska. The extremely low rates (0.17to 0.19 ng ofN * cm-3 * day- 1) found in this casemay have been an underestimate since, in thisenvironment, N20 may have been a significant
tContribution no. 529, Institute of Marine Science, Univer-sity of Alaska, Fairbanks.
component of the denitrification products andwas not included in the estimate (18).
Toolik Lake, a deep arctic lake, was chosenfor our study as part of a larger, system-orientedproject (17). Of interest was the potential fornitrogen loss to the lake through coupled nitrifi-cation and denitrification.Lake sediments usually have a surface oxi-
dized layer and become more reduced withsediment depth, so that nitrification and denitri-fication are spatially separated. Ammonium isproduced in sediments through the microbialoxidation of nitrogenous organic matter, and thiscan take place in both zones. Depending on theammonium gradient in the sediment, the ammo-nium can diffuse upwards into the water columnor downwards deeper into the sediment. In theoxic layer, the ammonium becomes oxidized tonitrite or nitrate by chemoautotrophic microbialprocesses (nitrification). These forms are moremobile and can diffuse upwards into the watercolumn and serve as a nutrient source or diffusedownwards into a more reduced zone and pro-vide the substrate for denitrification. Denitrifica-tion may also occur in anoxic microzones in thesurface sediment.N20 production can result from either denitri-
fication or nitrification (3, 4, 7, 20, 27, 28) sinceit is an intermediate product in nitrification andan intermediate or, under some conditions, aterminal product of denitrification. To date,however, very few measurements of N20 pro-
1084
on May 12, 2018 by guest
http://aem.asm
.org/D
ownloaded from
NITROGEN TRANSFORMATION IN A DEEP ARCTIC LAKE 1085
Shoals from ,n Daerial photo
Peak 5 Depth (m)
500 m
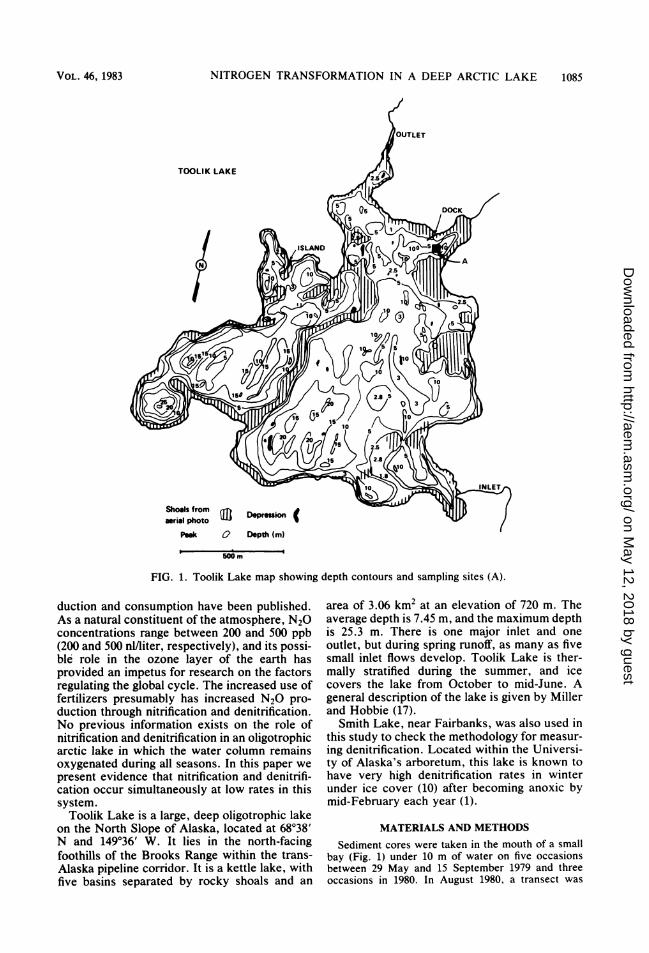
FIG. 1. Toolik Lake map showing depth contours and sampling sites (A).
duction and consumption have been published.As a natural constituent of the atmosphere, N20concentrations range between 200 and 500 ppb(200 and 500 nI/liter, respectively), and its possi-ble role in the ozone layer of the earth hasprovided an impetus for research on the factorsregulating the global cycle. The increased use offertilizers presumably has increased N20 pro-duction through nitrification and denitrification.No previous information exists on the role ofnitrification and denitrification in an oligotrophicarctic lake in which the water column remainsoxygenated during all seasons. In this paper wepresent evidence that nitrification and denitrifi-cation occur simultaneously at low rates in thissystem.
Toolik Lake is a large, deep oligotrophic lakeon the North Slope of Alaska, located at 68038'N and 149036' W. It lies in the north-facingfoothills of the Brooks Range within the trans-Alaska pipeline corridor. It is a kettle lake, withfive basins separated by rocky shoals and an
area of 3.06 km2 at an elevation of 720 m. Theaverage depth is 7.45 m, and the maximum depthis 25.3 m. There is one major inlet and oneoutlet, but during spring runoff, as many as fivesmall inlet flows develop. Toolik Lake is ther-mally stratified during the summer, and icecovers the lake from October to mid-June. Ageneral description of the lake is given by Millerand Hobbie (17).
Smith Lake, near Fairbanks, was also used inthis study to check the methodology for measur-ing denitrification. Located within the Universi-ty of Alaska's arboretum, this lake is known tohave very high denitrification rates in winterunder ice cover (10) after becoming anoxic bymid-February each year (1).
MATERIALS AND METHODS
Sediment cores were taken in the mouth of a smallbay (Fig. 1) under 10 m of water on five occasionsbetween 29 May and 15 September 1979 and threeoccasions in 1980. In August 1980, a transect was
VOL. 46, 1983
on May 12, 2018 by guest
http://aem.asm
.org/D
ownloaded from
1086 KLINGENSMITH AND ALEXANDER
nmol N- cm 3
O 200 400 6000-3 . . r
3-6. May 29, 1979
£ 6-9 \
C° 9-12
II 15-16,-1
18-21 ik21-24
3-6
6.9
9-12
12-15
15-18
18621
21-24
nmol N - cm, 3
nmol N - cm- 3
400 600 800
ItI s A.u>st 2,1979t4X,IX
nmol N cm- 3
o 200 400 600
July 31, 1979
'4
nmol N -cm, 3
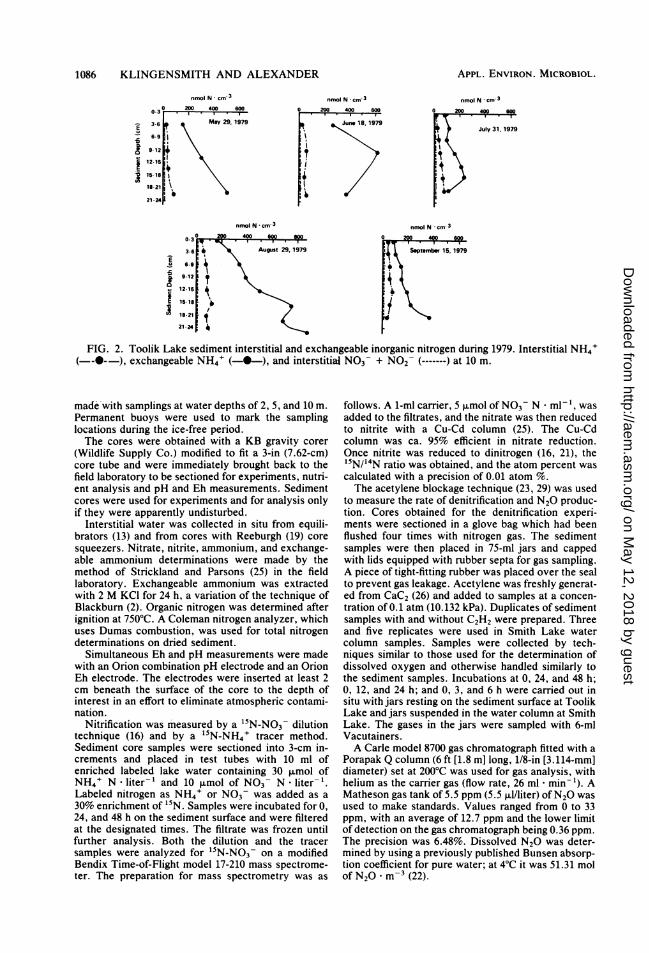
FIG. 2. Toolik Lake sediment interstitial and exchangeable inorganic nitrogen during 1979. Interstitial NH4'(--0-- ), exchangeable NH4' (-*-), and interstitial N03 + N02- (-------) at 10 m.
made with samplings at water depths of 2, 5, and 10 m.Permanent buoys were used to mark the samplinglocations during the ice-free period.The cores were obtained with a KB gravity corer
(Wildlife Supply Co.) modified to fit a 3-in (7.62-cm)core tube and were immediately brought back to thefield laboratory to be sectioned for experiments, nutri-ent analysis and pH and Eh measurements. Sedimentcores were used for experiments and for analysis onlyif they were apparently undisturbed.
Interstitial water was collected in situ from equili-brators (13) and from cores with Reeburgh (19) coresqueezers. Nitrate, nitrite, ammonium, and exchange-able ammonium determinations were made by themethod of Strickland and Parsons (25) in the fieldlaboratory. Exchangeable ammonium was extractedwith 2 M KCI for 24 h, a variation of the technique ofBlackburn (2). Organic nitrogen was determined afterignition at 750°C. A Coleman nitrogen analyzer, whichuses Dumas combustion, was used for total nitrogendeterminations on dried sediment.
Simultaneous Eh and pH measurements were madewith an Orion combination pH electrode and an OrionEh electrode. The electrodes were inserted at least 2cm beneath the surface of the core to the depth ofinterest in an effort to eliminate atmospheric contami-nation.
Nitrification was measured by a 15N-NO3- dilutiontechnique (16) and by a 15N-NH4' tracer method.Sediment core samples were sectioned into 3-cm in-crements and placed in test tubes with 10 ml ofenriched labeled lake water containing 30 ,umol ofNH4' N * liter-' and 10 ,umol of N03- N - liter-'.Labeled nitrogen as NH4' or N03- was added as a30% enrichment of 15N. Samples were incubated for 0,24, and 48 h on the sediment surface and were filteredat the designated times. The filtrate was frozen untilfurther analysis. Both the dilution and the tracersamples were analyzed for 15N-N03- on a modifiedBendix Time-of-Flight model 17-210 mass spectrome-ter. The preparation for mass spectrometry was as
follows. A 1-ml carrier, 5 ,umol of NO3- N * ml-', wasadded to the filtrates, and the nitrate was then reducedto nitrite with a Cu-Cd column (25). The Cu-Cdcolumn was ca. 95% efficient in nitrate reduction.Once nitrite was reduced to dinitrogen (16, 21), the15N/14N ratio was obtained, and the atom percent wascalculated with a precision of 0.01 atom %.
The acetylene blockage technique (23, 29) was usedto measure the rate of denitrification and N20 produc-tion. Cores obtained for the denitrification experi-ments were sectioned in a glove bag which had beenflushed four times with nitrogen gas. The sedimentsamples were then placed in 75-ml jars and cappedwith lids equipped with rubber septa for gas sampling.A piece of tight-fitting rubber was placed over the sealto prevent gas leakage. Acetylene was freshly generat-ed from CaC2 (26) and added to samples at a concen-tration of 0.1 atm (10.132 kPa). Duplicates of sedimentsamples with and without C2H2 were prepared. Threeand five replicates were used in Smith Lake watercolumn samples. Samples were collected by tech-niques similar to those used for the determination ofdissolved oxygen and otherwise handled similarly tothe sediment samples. Incubations at 0, 24, and 48 h;0, 12, and 24 h; and 0, 3, and 6 h were carried out insitu with jars resting on the sediment surface at ToolikLake and jars suspended in the water column at SmithLake. The gases in the jars were sampled with 6-miVacutainers.A Carle model 8700 gas chromatograph fitted with a
Porapak Q column (6 ft [1.8 m] long, 1/8-in [3.114-mm]diameter) set at 200°C was used for gas analysis, withhelium as the carrier gas (flow rate, 26 ml * min-'). AMatheson gas tank of 5.5 ppm (5.5 ,u/liter) of N20 wasused to make standards. Values ranged from 0 to 33ppm, with an average of 12.7 ppm and the lower limitof detection on the gas chromatograph being 0.36 ppm.The precision was 6.48%. Dissolved N20 was deter-mined by using a previously published Bunsen absorp-tion coefficient for pure water; at 4°C it was 51.31 molof N2O* m-3 (22).
I£2E
APPL. ENVIRON. MICROBIOL.
on May 12, 2018 by guest
http://aem.asm
.org/D
ownloaded from
NITROGEN TRANSFORMATION IN A DEEP ARCTIC LAKE 1087
nmol N -cm-3
.01 200
I
.8O.,
1.22-33-4
4-6
8-10
10-12.5
12.5-17.5
nmol N cm- 3
400
May 30, 1980
.*
nmol N cm- 3
August 23, 1980
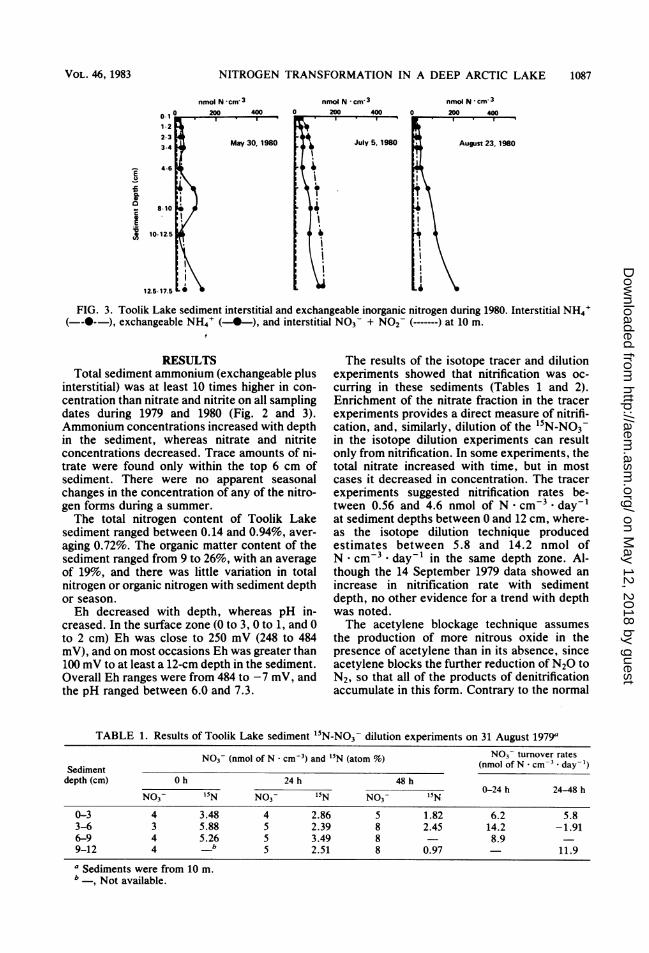
FIG. 3. Toolik Lake sediment interstitial and exchangeable inorganic nitrogen during 1980. Interstitial NH4'( ----), exchangeable NH4' (-0-), and interstitial N03- + N02 (-------) at 10 m.
RESULTSTotal sediment ammonium (exchangeable plus
interstitial) was at least 10 times higher in con-centration than nitrate and nitrite on all samplingdates during 1979 and 1980 (Fig. 2 and 3).Ammonium concentrations increased with depthin the sediment, whereas nitrate and nitriteconcentrations decreased. Trace amounts of ni-trate were found only within the top 6 cm ofsediment. There were no apparent seasonalchanges in the concentration of any of the nitro-gen forms during a summer.The total nitrogen content of Toolik Lake
sediment ranged between 0.14 and 0.94%, aver-aging 0.72%. The organic matter content of thesediment ranged from 9 to 26%, with an averageof 19%, and there was little variation in totalnitrogen or organic nitrogen with sediment depthor season.Eh decreased with depth, whereas pH in-
creased. In the surface zone (0 to 3, 0 to 1, and 0to 2 cm) Eh was close to 250 mV (248 to 484mV), and on most occasions Eh was greater than100 mV to at least a 12-cm depth in the sediment.Overall Eh ranges were from 484 to -7 mV, andthe pH ranged between 6.0 and 7.3.
The results of the isotope tracer and dilutionexperiments showed that nitrification was oc-curring in these sediments (Tables 1 and 2).Enrichment of the nitrate fraction in the tracerexperiments provides a direct measure of nitrifi-cation, and, similarly, dilution of the 15N-NO3-in the isotope dilution experiments can resultonly from nitrification. In some experiments, thetotal nitrate increased with time, but in mostcases it decreased in concentration. The tracerexperiments suggested nitrification rates be-tween 0.56 and 4.6 nmol of N cm-3 * day-'at sediment depths between 0 and 12 cm, where-as the isotope dilution technique producedestimates between 5.8 and 14.2 nmol ofN cm-3 * day-' in the same depth zone. Al-though the 14 September 1979 data showed anincrease in nitrification rate with sedimentdepth, no other evidence for a trend with depthwas noted.The acetylene blockage technique assumes
the production of more nitrous oxide in thepresence of acetylene than in its absence, sinceacetylene blocks the further reduction of N20 toN2, so that all of the products of denitrificationaccumulate in this form. Contrary to the normal
TABLE 1. Results of Toolik Lake sediment 15N-NO3- dilution experiments on 31 August 1979a
N03- (nmol of N * cm-3) and '5N (atom t) Nm3o turnover ratesSediment (nmol of N cm* dayt)depth (cm) 0 h 24 h 48 h
0-24 h 24-48 hNO3- 15N N03- 15N NO3- 15N
0-3 4 3.48 4 2.86 5 1.82 6.2 5.83-6 3 5.88 5 2.39 8 2.45 14.2 -1.916-9 4 5.26 5 3.49 8 8.99-12 4 b 5 2.51 8 0.97 11.9
a Sediments were from 10 m.b , Not available.
I
VOL. 46, 1983
on May 12, 2018 by guest
http://aem.asm
.org/D
ownloaded from
1088 KLINGENSMITH AND ALEXANDER
TABLE 2. Results of Toolik Lake sediment "5N-NH4' tracer experiments on 31 August and on 14September 1979"
NH4+ and N03- (nmol of N cm-3) and "5N (atom %) Ammonification (nmol ofSediment 4____________________________________depth (cm) 0 h 24 h 48 h
0-24 h 24-48 hNH4+ 15N N03- 15N NO3- 05N
31 August 19790-3 30 23.3 3.6 3.95 b 0.613-6 27 25.8 4.1 3.53 - 0.566-9 30 23.3 6.4 4.40 1.209-12 30 23.3 5.0 2.99 - 0.64
14 September 19790-3 30 23.3 3.9 3.65 5.0 12.97 0.61 2.173-6 32 21.9 3.8 9.75 3.6 14.38 1.69 0.676-9 37 19.0 4.0 12.86 3.3 11.30 2.70 0.749-12 42 16.9 4.8 16.20 8.6 14.90 4.60 2.90a Sediments were from 10 m.b , Not available.
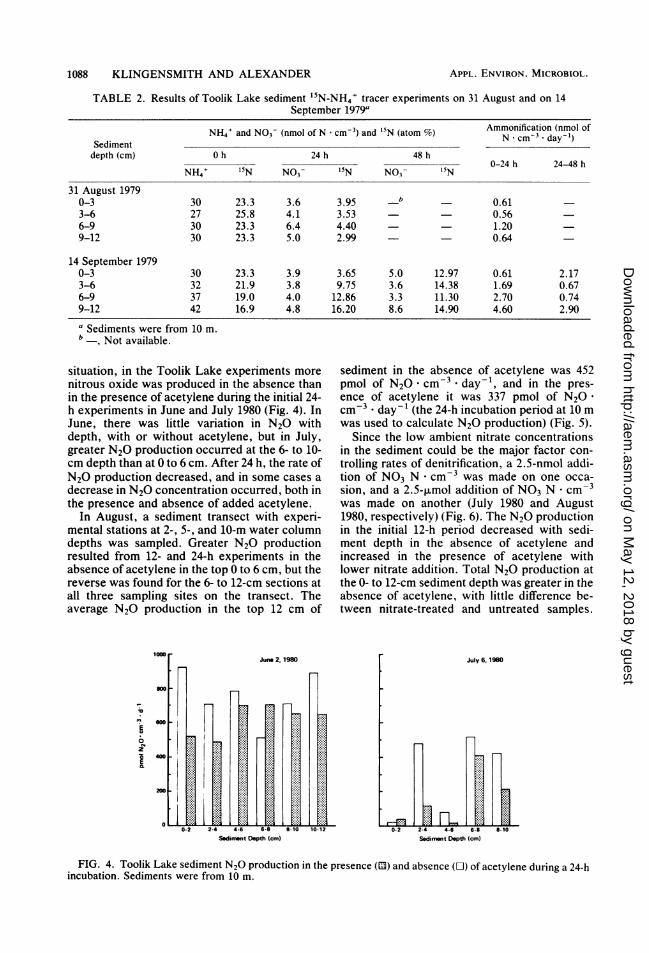
situation, in the Toolik Lake experiments morenitrous oxide was produced in the absence thanin the presence of acetylene during the initial 24-h experiments in June and July 1980 (Fig. 4). InJune, there was little variation in N20 withdepth, with or without acetylene, but in July,greater N20 production occurred at the 6- to 10-cm depth than at 0 to 6 cm. After 24 h, the rate ofN20 production decreased, and in some cases adecrease in N20 concentration occurred, both inthe presence and absence of added acetylene.
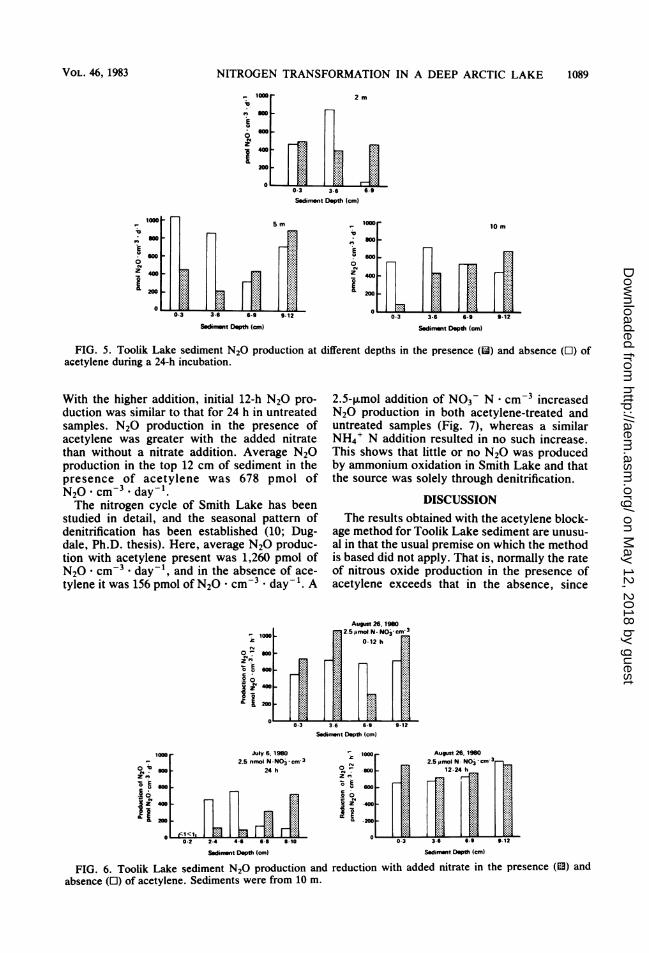
In August, a sediment transect with experi-mental stations at 2-, 5-, and 10-m water columndepths was sampled. Greater N20 productionresulted from 12- and 24-h experiments in theabsence of acetylene in the top 0 to 6 cm, but thereverse was found for the 6- to 12-cm sections atall three sampling sites on the transect. Theaverage N20 production in the top 12 cm of
1000June 2, 1980
goo
400
sediment in the absence of acetylene was 452pmol of N20 . cm-3 * day-', and in the pres-ence of acetylene it was 337 pmol of N20cm-3 * day-1 (the 24-h incubation period at 10 mwas used to calculate N20 production) (Fig. 5).
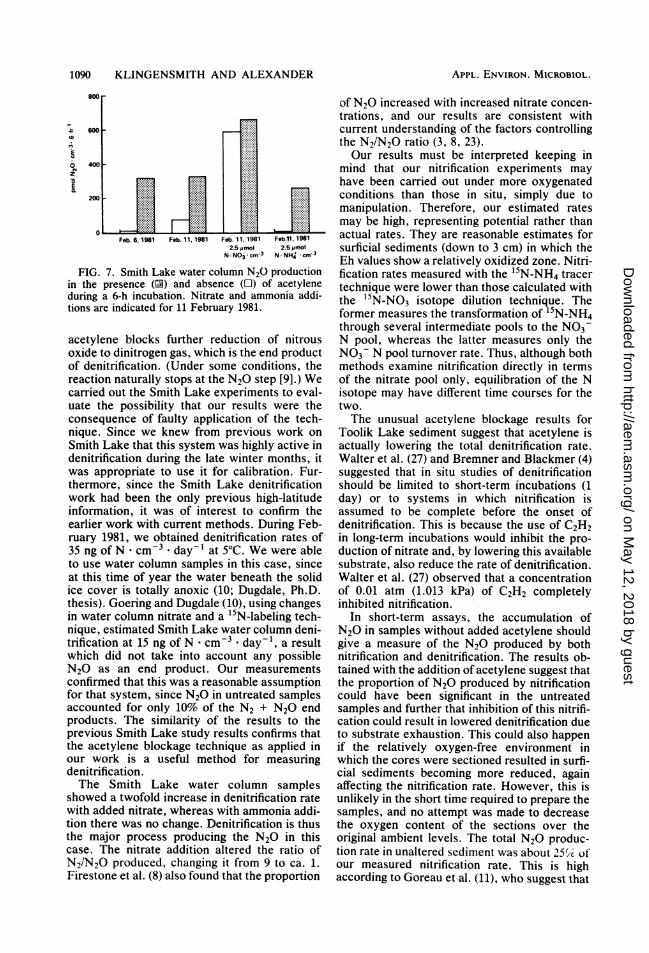
Since the low ambient nitrate concentrationsin the sediment could be the major factor con-trolling rates of denitrification, a 2.5-nmol addi-tion of NO3 N . cm-3 was made on one occa-sion, and a 2.5-,umol addition of NO3 N . cm-3was made on another (July 1980 and August1980, respectively) (Fig. 6). The N20 productionin the initial 12-h period decreased with sedi-ment depth in the absence of acetylene andincreased in the presence of acetylene withlower nitrate addition. Total N20 production atthe 0- to 12-cm sediment depth was greater in theabsence of acetylene, with little difference be-tween nitrate-treated and untreated samples.
FIG. 4. Toolik Lake sediment N20 production in the presence (13) and absence (O) of acetylene during a 24-hincubation. Sediments were from 10 m.
APPL. ENVIRON. MICROBIOL.
on May 12, 2018 by guest
http://aem.asm
.org/D
ownloaded from
NITROGEN TRANSFORMATION IN A DEEP ARCTIC LAKE 1089
10E
z
Sediment Depth (cm)
1000
6100E
0CZ 40-96
L2001 F5 m
-. l]Sedntest Depth (cm) Sediment Depth (cm)
FIG. 5. Toolik Lake sediment N20 production at different depths in the presence (li) and absence (E) ofacetylene during a 24-h incubation.
With the higher addition, initial 12-h N20 pro-duction was similar to that for 24 h in untreatedsamples. N20 production in the presence ofacetylene was greater with the added nitratethan without a nitrate addition. Average N20production in the top 12 cm of sediment in thepresence of acetylene was 678 pmol ofN20 . cm3 * day-l.The nitrogen cycle of Smith Lake has been
studied in detail, and the seasonal pattern ofdenitrification has been established (10; Dug-dale, Ph.D. thesis). Here, average N20 produc-tion with acetylene present was 1,260 pmol ofN20 cm3 * day-', and in the absence of ace-tylene it was 156 pmol of N20 * cm-3 * day-'. A
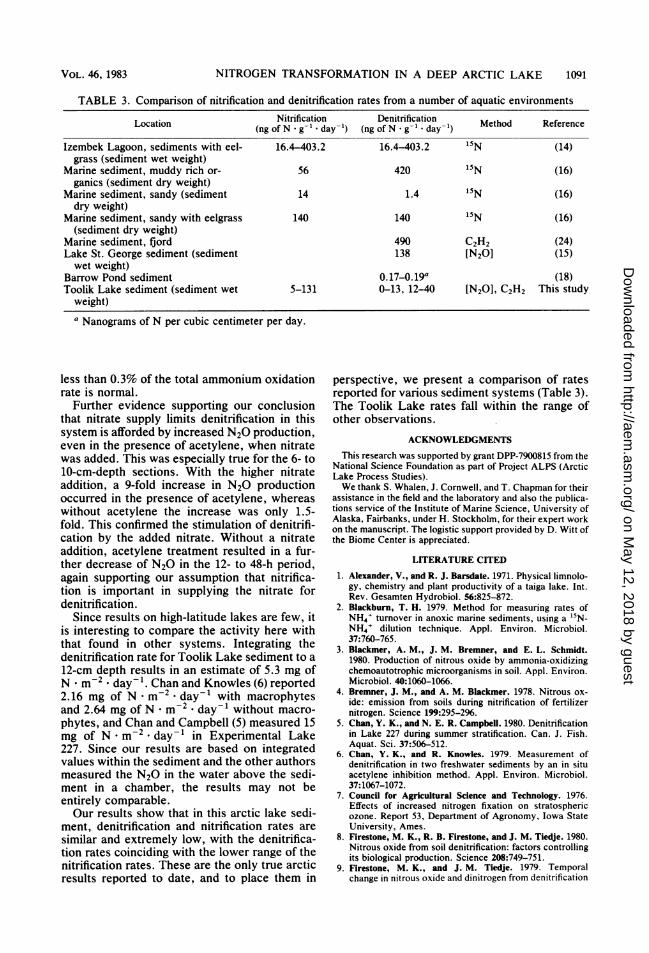
2.5-,umol addition of N03- N . cm-3 increasedN20 production in both acetylene-treated anduntreated samples (Fig. 7), whereas a similarNH4' N addition resulted in no such increase.This shows that little or no N20 was producedby ammonium oxidation in Smith Lake and thatthe source was solely through denitrification.
DISCUSSIONThe results obtained with the acetylene block-
age method for Toolik Lake sediment are unusu-al in that the usual premise on which the methodis based did not apply. That is, normally the rateof nitrous oxide production in the presence ofacetylene exceeds that in the absence, since
August 26, 1960
ta 2.5 molN. NO" cm3
29 0-3 3-6 h
Sediment Depth (cm)
1080
6-0
goo1,6496
11ffi 200
July 6, 19802.5 nmol N-N - cm-3
24 h
<1<1, 1--
1000 August 26, 1980N 2.5mmol N- NO3 crn-3
o3n X
0002Z .4000LILLIII
L .200
0-3 3-6
Sediment Depth (cm)
FIG. 6. Toolik Lake sediment N20 production and reduction with added nitrate in the presence (O) andabsence (E) of acetylene. Sediments were from 10 m.
0-2 2-4 4-6 6-l 8610Sedinnt Depth (cmn)
VOL . 46, 1983
on May 12, 2018 by guest
http://aem.asm
.org/D
ownloaded from
1090 KLINGENSMITH AND ALEXANDER
~c 600
E
0 400
200
0IFeb. 6, 1981 Feb. 11,1981 Feb. 11, 1981 Feb.11, 1981
2.5 Hmol 2.5 mmolN-N03'cm 3 N-NH *cm-3
FIG. 7. Smith Lake water column N20 productionin the presence (N) and absence (O) of acetyleneduring a 6-h incubation. Nitrate and ammonia addi-tions are indicated for 11 February 1981.
acetylene blocks further reduction of nitrousoxide to dinitrogen gas, which is the end productof denitrification. (Under some conditions, thereaction naturally stops at the N2O step [9].) Wecarried out the Smith Lake experiments to eval-uate the possibility that our results were theconsequence of faulty application of the tech-nique. Since we knew from previous work onSmith Lake that this system was highly active indenitrification during the late winter months, itwas appropriate to use it for calibration. Fur-thermore, since the Smith Lake denitrificationwork had been the only previous high-latitudeinformation, it was of interest to confirm theearlier work with current methods. During Feb-ruary 1981, we obtained denitrification rates of35 ng of N cm3 * day-1 at 5°C. We were ableto use water column samples in this case, sinceat this time of year the water beneath the solidice cover is totally anoxic (10; Dugdale, Ph.D.thesis). Goering and Dugdale (10), using changesin water column nitrate and a 15N-labeling tech-nique, estimated Smith Lake water column deni-trification at 15 ng of N * cm-3 day-1, a resultwhich did not take into account any possibleN20 as an end product. Our measurementsconfirmed that this was a reasonable assumptionfor that system, since N20 in untreated samplesaccounted for only 10% of the N2 + N20 endproducts. The similarity of the results to theprevious Smith Lake study results confirms thatthe acetylene blockage technique as applied inour work is a useful method for measuringdenitrification.The Smith Lake water column samples
showed a twofold increase in denitrification ratewith added nitrate, whereas with ammonia addi-tion there was no change. Denitrification is thusthe major process producing the N20 in thiscase. The nitrate addition altered the ratio ofN2/N2O produced, changing it from 9 to ca. 1.Firestone et al. (8) also found that the proportion
of N2O increased with increased nitrate concen-trations, and our results are consistent withcurrent understanding of the factors controllingthe N2/N20 ratio (3, 8, 23).Our results must be interpreted keeping in
mind that our nitrification experiments mayhave been carried out under more oxygenatedconditions than those in situ, simply due tomanipulation. Therefore, our estimated ratesmay be high, representing potential rather thanactual rates. They are reasonable estimates forsurficial sediments (down to 3 cm) in which theEh values show a relatively oxidized zone. Nitri-fication rates measured with the 15N-NH4 tracertechnique were lower than those calculated withthe 15N-NO3 isotope dilution technique. Theformer measures the transformation of 15N-NH4through several intermediate pools to the NO3N pool, whereas the latter measures only theNO3 N pool turnover rate. Thus, although bothmethods examine nitrification directly in termsof the nitrate pool only, equilibration of the Nisotope may have different time courses for thetwo.The unusual acetylene blockage results for
Toolik Lake sediment suggest that acetylene isactually lowering the total denitrification rate.Walter et al. (27) and Bremner and Blackmer (4)suggested that in situ studies of denitrificationshould be limited to short-term incubations (1day) or to systems in which nitrification isassumed to be complete before the onset ofdenitrification. This is because the use of C2H2in long-term incubations would inhibit the pro-duction of nitrate and, by lowering this availablesubstrate, also reduce the rate of denitrification.Walter et al. (27) observed that a concentrationof 0.01 atm (1.013 kPa) of C2H2 completelyinhibited nitrification.
In short-term assays, the accumulation ofN2O in samples without added acetylene shouldgive a measure of the N2O produced by bothnitrification and denitrification. The results ob-tained with the addition of acetylene suggest thatthe proportion of N2O produced by nitrificationcould have been significant in the untreatedsamples and further that inhibition of this nitrifi-cation could result in lowered denitrification dueto substrate exhaustion. This could also happenif the relatively oxygen-free environment inwhich the cores were sectioned resulted in surfi-cial sediments becoming more reduced, againaffecting the nitrification rate. However, this isunlikely in the short time required to prepare thesamples, and no attempt was made to decreasethe oxygen content of the sections over theoriginal ambient levels. The total N20 produc-tion rate in unaltered sediment was about 25%1i ofour measured nitrification rate. This is highaccording to Goreau et al. (11), who suggest that
APPL. ENVIRON. MICROBIOL.
on May 12, 2018 by guest
http://aem.asm
.org/D
ownloaded from
NITROGEN TRANSFORMATION IN A DEEP ARCTIC LAKE 1091
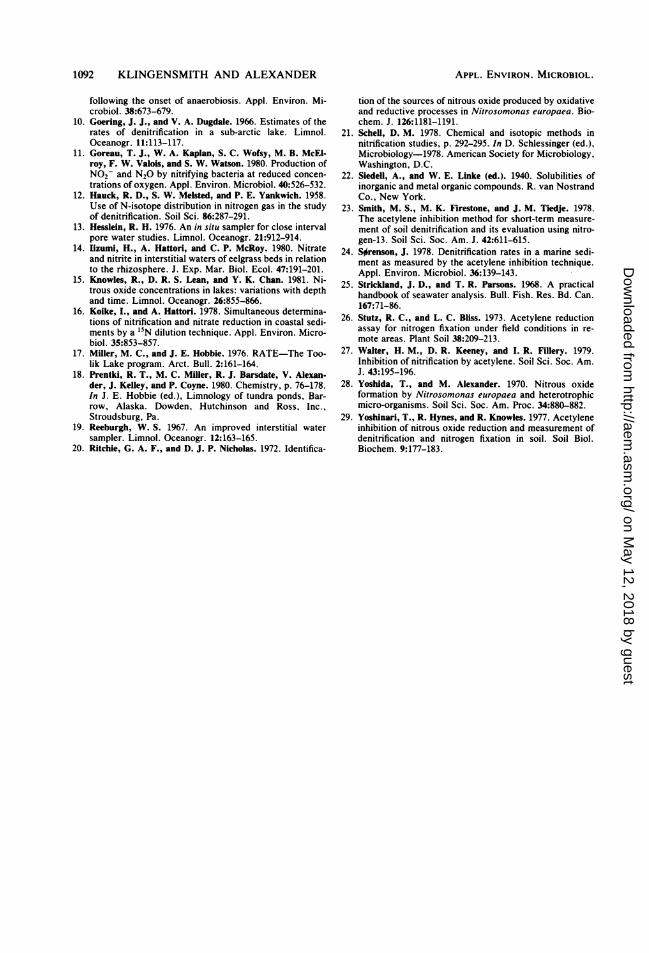
TABLE 3. Comparison of nitrification and denitrification rates from a number of aquatic environmentsNitrification Denitrification
Location (ng of N * g-' * day-') (ng of N * g-1 * day') Method Reference
Izembek Lagoon, sediments with eel- 16.4-403.2 16.4-403.2 15N (14)grass (sediment wet weight)
Marine sediment, muddy rich or- 56 420 15N (16)ganics (sediment dry weight)
Marine sediment, sandy (sediment 14 1.4 15N (16)dry weight)
Marine sediment, sandy with eelgrass 140 140 15N (16)(sediment dry weight)
Marine sediment, fjord 490 C2H2 (24)Lake St. George sediment (sediment 138 [N20] (15)wet weight)
Barrow Pond sediment 0.17-0.19a (18)Toolik Lake sediment (sediment wet 5-131 0-13, 12-40 [N20], C2H2 This study
weight)a Nanograms of N per cubic centimeter per day.
less than 0.3% of the total ammonium oxidationrate is normal.
Further evidence supporting our conclusionthat nitrate supply limits denitrification in thissystem is afforded by increased N20 production,even in the presence of acetylene, when nitratewas added. This was especially true for the 6- to10-cm-depth sections. With the higher nitrateaddition, a 9-fold increase in N20 productionoccurred in the presence of acetylene, whereaswithout acetylene the increase was only 1.5-fold. This confirmed the stimulation of denitrifi-cation by the added nitrate. Without a nitrateaddition, acetylene treatment resulted in a fur-ther decrease of N20 in the 12- to 48-h period,again supporting our assumption that nitrifica-tion is important in supplying the nitrate fordenitrification.
Since results on high-latitude lakes are few, itis interesting to compare the activity here withthat found in other systems. Integrating thedenitrification rate for Toolik Lake sediment to a12-cm depth results in an estimate of 5.3 mg ofN . m-2 * day-l. Chan and Knowles (6) reported2.16 mg of N * m-2 * day-' with macrophytesand 2.64 mg of N * m-2 * day-' without macro-phytes, and Chan and Campbell (5) measured 15mg of N m2 * day-' in Experimental Lake227. Since our results are based on integratedvalues within the sediment and the other authorsmeasured the N20 in the water above the sedi-ment in a chamber, the results may not beentirely comparable.Our results show that in this arctic lake sedi-
ment, denitrification and nitrification rates aresimilar and extremely low, with the denitrifica-tion rates coinciding with the lower range of thenitrification rates. These are the only true arcticresults reported to date, and to place them in
perspective, we present a comparison of ratesreported for various sediment systems (Table 3).The Toolik Lake rates fall within the range ofother observations.
ACKNOWLEDGMENTSThis research was supported by grant DPP-7900815 from the
National Science Foundation as part of Project ALPS (ArcticLake Process Studies).We thank S. Whalen, J. Cornwell, and T. Chapman for their
assistance in the field and the laboratory and also the publica-tions service of the Institute of Marine Science, University ofAlaska, Fairbanks, under H. Stockholm, for their expert workon the manuscript. The logistic support provided by D. Witt ofthe Biome Center is appreciated.
LITERATURE CITED1. Alexander, V., and R. J. Barsdate. 1971. Physical limnolo-
gy, chemistry and plant productivity of a taiga lake. Int.Rev. Gesamten Hydrobiol. 56:825-872.
2. Blackburn, T. H. 1979. Method for measuring rates ofNH4' turnover in anoxic marine sediments, using a '5N-NH44 dilution technique. Appl. Environ. Microbiol.37:760-765.
3. Blackmer, A. M., J. M. Bremner, and E. L. Schmidt.1980. Production of nitrous oxide by ammonia-oxidizingchemoautotrophic microorganisms in soil. Appl. Environ.Microbiol. 40:1060-1066.
4. Bremner, J. M., and A. M. Blackmer. 1978. Nitrous ox-ide: emission from soils during nitrification of fertilizernitrogen. Science 199:295-296.
5. Chan, Y. K., and N. E. R. Campbell. 1980. Denitrificationin Lake 227 during summer stratification. Can. J. Fish.Aquat. Sci. 37:506-512.
6. Chan, Y. K., and R. Knowles. 1979. Measurement ofdenitrification in two freshwater sediments by an in situacetylene inhibition method. Appl. Environ. Microbiol.37:1067-1072.
7. Council for Agricultural Science and Technology. 1976.Effects of increased nitrogen fixation on stratosphericozone. Report 53, Department of Agronomy, Iowa StateUniversity, Ames.
8. Firestone, M. K., R. B. Firestone, and J. M. Tiedje. 1980.Nitrous oxide from soil denitrification: factors controllingits biological production. Science 208:749-751.
9. Firestone, M. K., and J. M. Tiedje. 1979. Temporalchange in nitrous oxide and dinitrogen from denitrification
VOL. 46, 1983
on May 12, 2018 by guest
http://aem.asm
.org/D
ownloaded from
1092 KLINGENSMITH AND ALEXANDER
following the onset of anaerobiosis. Appl. Environ. Mi-crobiol. 38:673-679.
10. Goering, J. J., and V. A. Dugdale. 1966. Estimates of therates of denitrification in a sub-arctic lake. Limnol.Oceanogr. 11:113-117.
11. Goreau, T. J., W. A. Kaplan, S. C. Wofsy, M. B. McEl-roy, F. W. Valois, and S. W. Watson. 1980. Production ofN02 and N20 by nitrifying bacteria at reduced concen-trations of oxygen. Appl. Environ. Microbiol. 40:526-532.
12. Hauck, R. D., S. W. Melsted, and P. E. Yankwich. 1958.Use of N-isotope distribution in nitrogen gas in the studyof denitrification. Soil Sci. 86:287-291.
13. Hesslein, R. H. 1976. An in situ sampler for close intervalpore water studies. Limnol. Oceanogr. 21:912-914.
14. Iizumi, H., A. Hattori, and C. P. McRoy. 1980. Nitrateand nitrite in interstitial waters of eelgrass beds in relationto the rhizosphere. J. Exp. Mar. Biol. Ecol. 47:191-201.
15. Knowles, R., D. R. S. Lean, and Y. K. Chan. 1981. Ni-trous oxide concentrations in lakes: variations with depthand time. Limnol. Oceanogr. 26:855-866.
16. Koike, I., and A. Hattori. 1978. Simultaneous determina-tions of nitrification and nitrate reduction in coastal sedi-ments by a "5N dilution technique. Appl. Environ. Micro-biol. 35:853-857.
17. Miller, M. C., and J. E. Hobbie. 1976. RATE-The Too-lik Lake program. Arct. Bull. 2:161-164.
18. Prentki, R. T., M. C. Miller, R. J. Barsdate, V. Alexan.der, J. Kelley, and P. Coyne. 1980. Chemistry, p. 76-178.In J. E. Hobbie (ed.), Limnology of tundra ponds, Bar-row, Alaska. Dowden, Hutchinson and Ross, Inc.,Stroudsburg, Pa.
19. Reeburgh, W. S. 1967. An improved interstitial watersampler. Limnol. Oceanogr. 12:163-165.
20. Ritchie, G. A. F., and D. J. P. Nicholas. 1972. Identifica-
APPL. ENVIRON. MICROBIOL.
tion of the sources of nitrous oxide produced by oxidativeand reductive processes in Nitrosomonas europaea. Bio-chem. J. 126:1181-1191.
21. Schell, D. M. 1978. Chemical and isotopic methods innitrification studies, p. 292-295. In D. Schlessinger (ed.),Microbiology-1978. American Society for Microbiology,Washington, D.C.
22. Siedell, A., and W. E. Linke (ed.). 1940. Solubilities ofinorganic and metal organic compounds. R. van NostrandCo., New York.
23. Smith, M. S., M. K. Firestone, and J. M. Tiedje. 1978.The acetylene inhibition method for short-term measure-ment of soil denitrification and its evaluation using nitro-gen-13. Soil Sci. Soc. Am. J. 42:611-615.
24. Sorenson, J. 1978. Denitrification rates in a marine sedi-ment as measured by the acetylene inhibition technique.Appl. Environ. Microbiol. 36:139-143.
25. Strickland, J. D., and T. R. Parsons. 1968. A practicalhandbook of seawater analysis. Bull. Fish. Res. Bd. Can.167:71-86.
26. Stutz, R. C., and L. C. Bliss. 1973. Acetylene reductionassay for nitrogen fixation under field conditions in re-mote areas. Plant Soil 38:209-213.
27. Walter, H. M., D. R. Keeney, and I. R. Fillery. 1979.Inhibition of nitrification by acetylene. Soil Sci. Soc. Am.J. 43:195-196.
28. Yoshida, T., and M. Alexander. 1970. Nitrous oxideformation by Nitrosomonas europaea and heterotrophicmicro-organisms. Soil Sci. Soc. Am. Proc. 34:880-882.
29. Yoshinari, T., R. Hynes, and R. Knowles. 1977. Acetyleneinhibition of nitrous oxide reduction and measurement ofdenitrification and nitrogen fixation in soil. Soil Biol.Biochem. 9:177-183.
on May 12, 2018 by guest
http://aem.asm
.org/D
ownloaded from