Embed Size (px)
Citation preview
ELLCOT SPINNING MILLS LTD.
NAGINA
NAGINA GROUP
NAGINA
1
CONTENTS
Company Information 02
Notice of Annual General Meeting 03
Vision and Mission Statement 05
Directors’ Report to the Members 08
Statement of Compliance with the Code of Corporate Governance 13
Shareholders’ Information 16
Notice u/s 218 of the Companies Ordinance, 1984
Pattern of Shareholding 19
Key Financial Information 21
Auditors’ Review Report to the Members on Statement of Compliance with
the Code of Corporate Governance 22
Auditors’ Report to the Members 23
Balance Sheet 24
Profit and Loss Account 26
Cash Flow Statement 28
Statement of Changes in Equity 29
Notes to the Accounts 30
Form of Proxy 71
18
Statement of Comprehensive Income 27
NAGINA
NAGINA GROUP
NAGINA
2
ANNUAL REPORT 2012
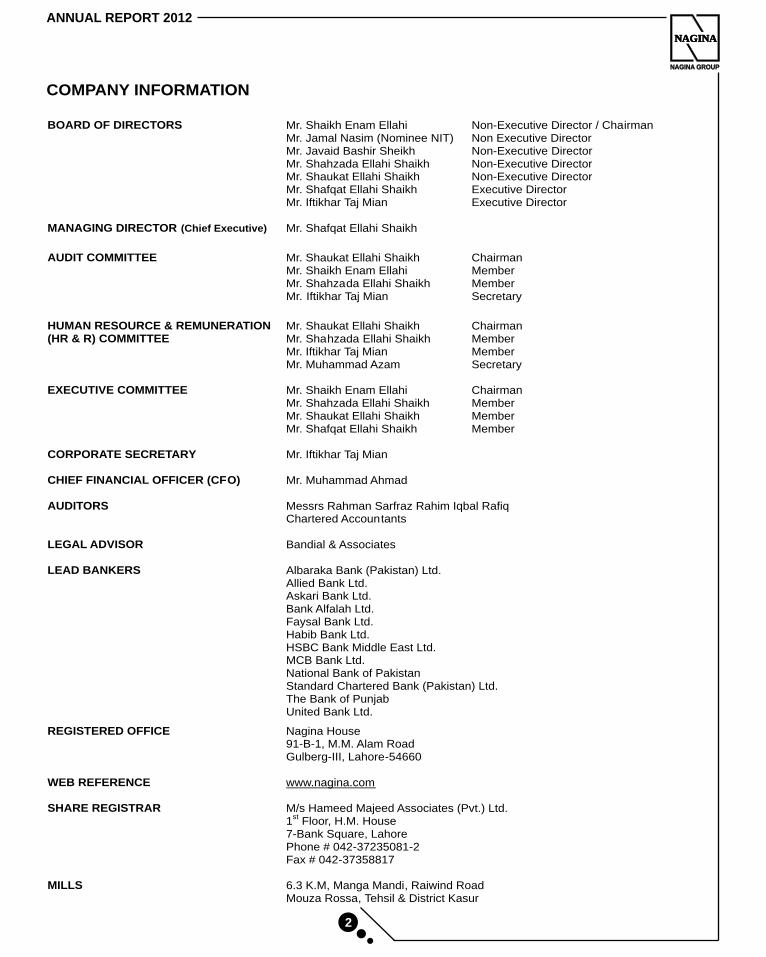
COMPANY INFORMATION
BOARD OF DIRECTORS Mr. Shaikh Enam EllahiMr. Jamal Nasim (Nominee NIT) Mr. Javaid Bashir Sheikh
Mr. Shahzada Ellahi Shaikh
Mr. Shaukat Ellahi Shaikh
Mr. Shafqat Ellahi Shaikh
Mr. Iftikhar Taj Mian
Non-Executive Director / Chairman Non Executive Director Non-Executive
Director
Non-Executive Director
Non-Executive Director
Executive Director
Executive Director
MANAGING DIRECTOR (Chief Executive) Mr. Shafqat Ellahi Shaikh
AUDIT COMMITTEE
Mr. Iftikhar Taj Mian
Mr. Shaikh Enam Ellahi MemberMr. Shahzada Ellahi Shaikh Member
Mr. Shaukat Ellahi Shaikh Chairman
Secretary
HUMAN RESOURCE & REMUNERATION (HR & R) COMMITTEE
Mr. Shaukat Ellahi Shaikh
Mr. Shahzada
Ellahi Shaikh
Mr. Iftikhar Taj Mian
Mr. Muhammad Azam
ChairmanMemberMemberSecretary
EXECUTIVE COMMITTEE
Mr. Shaikh Enam Ellahi
Mr. Shahzada Ellahi Shaikh
Mr. Shaukat Ellahi Shaikh Mr. Shafqat Ellahi Shaikh
Chairman MemberMemberMember
CORPORATE SECRETARY Mr. Iftikhar Taj Mian
CHIEF FINANCIAL OFFICER (CFO)
Mr. Muhammad Ahmad
AUDITORS
Messrs Rahman Sarfraz Rahim Iqbal RafiqChartered Accountants
LEGAL ADVISOR
Bandial & Associates
LEAD BANKERS Albaraka Bank (Pakistan) Ltd.
Allied Bank Ltd.
Askari Bank Ltd.
Bank Alfalah Ltd.
Faysal Bank Ltd.
Habib Bank Ltd.
HSBC Bank Middle East Ltd.
MCB Bank Ltd.
National Bank of Pakistan
Standard Chartered Bank (Pakistan) Ltd.
The Bank of Punjab
United Bank Ltd.
REGISTERED OFFICE
Nagina House
91-B-1, M.M. Alam Road
Gulberg-III, Lahore-54660
WEB REFERENCE
www.nagina.com
SHARE REGISTRAR
M/s Hameed Majeed Associates (Pvt.) Ltd. 1
st
Floor, H.M. House
7-Bank Square, Lahore Phone # 042-37235081-2 Fax # 042-37358817
MILLS 6.3 K.M, Manga Mandi, Raiwind RoadMouza Rossa, Tehsil & District Kasur
ELLCOT SPINNING MILLS LTD.
NAGINA
NAGINA GROUP
NAGINA
3
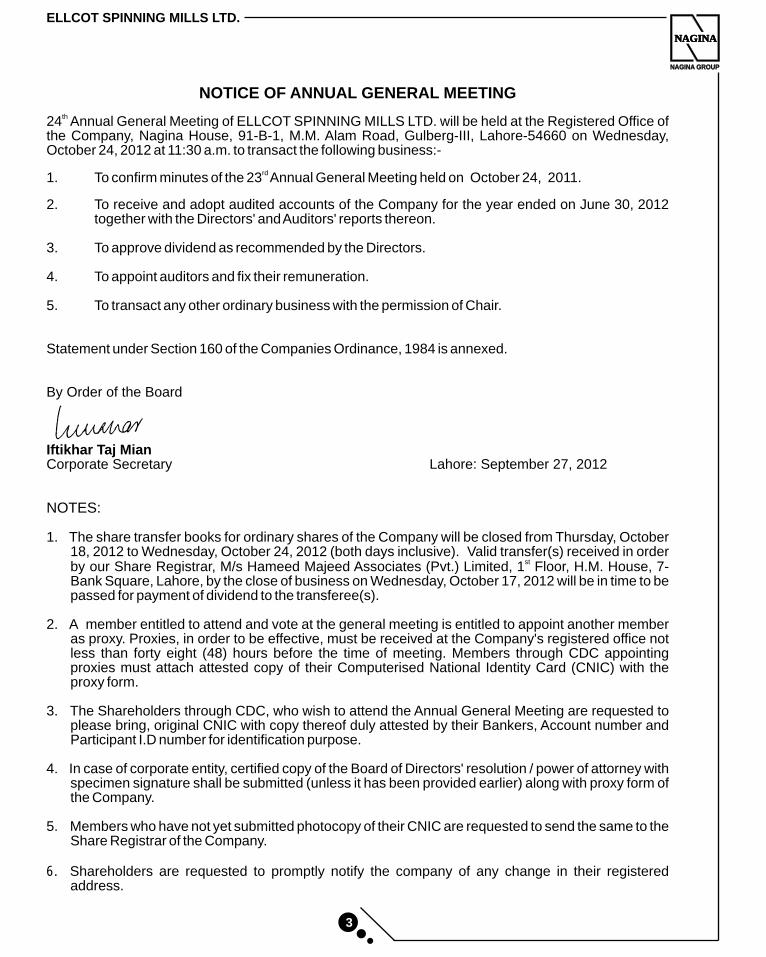
NOTICE OF ANNUAL GENERAL MEETING
th24 Annual General Meeting of ELLCOT SPINNING MILLS LTD. will be held at the Registered Office of the Company, Nagina House, 91-B-1, M.M. Alam Road, Gulberg-III, Lahore-54660 on Wednesday, October 24, 2012 at 11:30 a.m. to transact the following business:-
rd1. To confirm minutes of the 23 Annual General Meeting held on October 24, 2011.
2. To receive and adopt audited accounts of the Company for the year ended on June 30, 2012 together with the Directors' and Auditors' reports thereon.
3. To approve dividend as recommended by the Directors. 4. To appoint auditors and fix their remuneration.
5. To transact any other ordinary business with the permission of Chair.
Statement under Section 160 of the Companies Ordinance, 1984 is annexed.
By Order of the Board
Iftikhar Taj MianCorporate Secretary Lahore: September 27, 2012
NOTES:
1. The share transfer books for ordinary shares of the Company will be closed from Thursday, October 18, 2012 to Wednesday, October 24, 2012 (both days inclusive). Valid transfer(s) received in order
stby our Share Registrar, M/s Hameed Majeed Associates (Pvt.) Limited, 1 Floor, H.M. House, 7-Bank Square, Lahore, by the close of business on Wednesday, October 17, 2012 will be in time to be passed for payment of dividend to the transferee(s).
2. A member entitled to attend and vote at the general meeting is entitled to appoint another member as proxy. Proxies, in order to be effective, must be received at the Company's registered office not less than forty eight (48) hours before the time of meeting. Members through CDC appointing proxies must attach attested copy of their Computerised National Identity Card (CNIC) with the proxy form.
3. The Shareholders through CDC, who wish to attend the Annual General Meeting are requested to please bring, original CNIC with copy thereof duly attested by their Bankers, Account number and Participant I.D number for identification purpose.
4. In case of corporate entity, certified copy of the Board of Directors' resolution / power of attorney with specimen signature shall be submitted (unless it has been provided earlier) along with proxy form of the Company.
5. Members who have not yet submitted photocopy of their CNIC are requested to send the same to the Share Registrar of the Company.
6. Shareholders are requested to promptly notify the company of any change in their registered address.
NAGINA
NAGINA GROUP
NAGINA
4
ANNUAL REPORT 2012
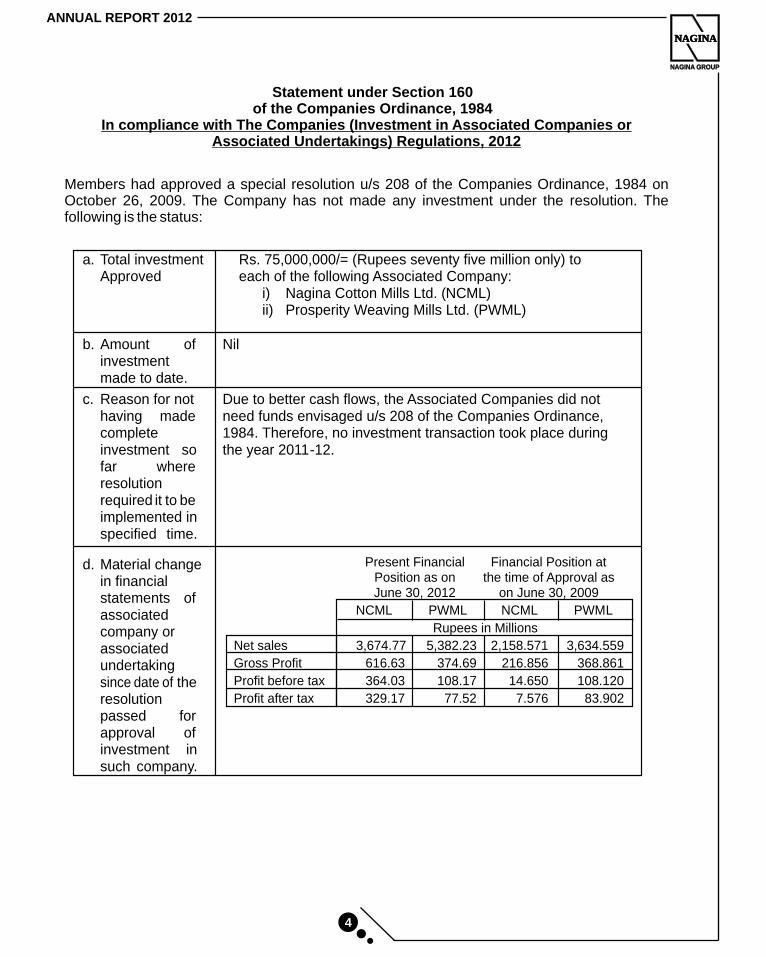
Statement under Section 160of the Companies Ordinance, 1984
In compliance with The Companies (Investment in Associated Companies or Associated Undertakings) Regulations, 2012
Members had approved a special resolution u/s 208 of the Companies Ordinance, 1984 on October 26, 2009. The Company has not made any investment under the resolution. The following is the status:
a. Total investment Approved
Rs. 75,000,000/= (Rupees seventy five million only) to each of the following Associated Company:
i) Nagina Cotton Mills Ltd. (NCML) ii) Prosperity Weaving Mills Ltd. (PWML)
b. Amount of investment made to date.
Nil
c. Reason for not having made complete investment so far where resolution required it to be implemented in specified time.
Due to better cash flows, the Associated Companies did not need funds envisaged u/s 208 of the Companies Ordinance, 1984. Therefore, no investment transaction took place during the year 2011-12.
d. Material change in financial statements of associated company or associated undertaking since date of the resolution passed for approval of investment in such company.
Present Financial Position as on June 30, 2012
Financial Position at the time of Approval as
on June 30, 2009
NCML PWML NCML PWML
Rupees in Millions
Net sales 3,674.77 5,382.23 2,158.571 3,634.559
Gross Profit 616.63 374.69 216.856 368.861
Profit before tax 364.03 108.17 14.650 108.120
Profit after tax 329.17 77.52 7.576 83.902
ELLCOT SPINNING MILLS LTD.
NAGINA
NAGINA GROUP
NAGINA
5
Vision:
To be a dynamic, profitable and growth oriented company.
Mission:
To be the leading producer of cotton and blended yarn for knitting and weaving for local and international customers manufacturing well-known textile brands.
To strive for excellence and sustain position as a preferred supplier for yarn with a customer focused strategy.
Continuous enhancement the quality objectives for customer satisfaction and operational efficiencies.
To achieve the comparative advantage by employing latest technologies for enhancing the efficiency and productivity.
To build enduring relationship with our suppliers by giving them fair return on their products and services.
To provide a professional, open and participative environment to our dedicated employees for developing their potential and team performance.
To give consistent financial returns to the shareholders on their investments.
To be responsible to the society, employees and communities in which we operate by initiating health care, education and social welfare activities.

NAGINA
NAGINA GROUP
NAGINA
6
ANNUAL REPORT 2012
ELLCOT SPINNING MILLS LTD.
NAGINA
NAGINA GROUP
NAGINA
7
NAGINA
NAGINA GROUP
NAGINA
8
ANNUAL REPORT 2012
DIRECTORS' REPORT TO THE MEMBERS
IN THE NAME OF ALLAH THE MOST GRACIOUSTHE MOST BENEVOLENT THE MOST MERCIFUL
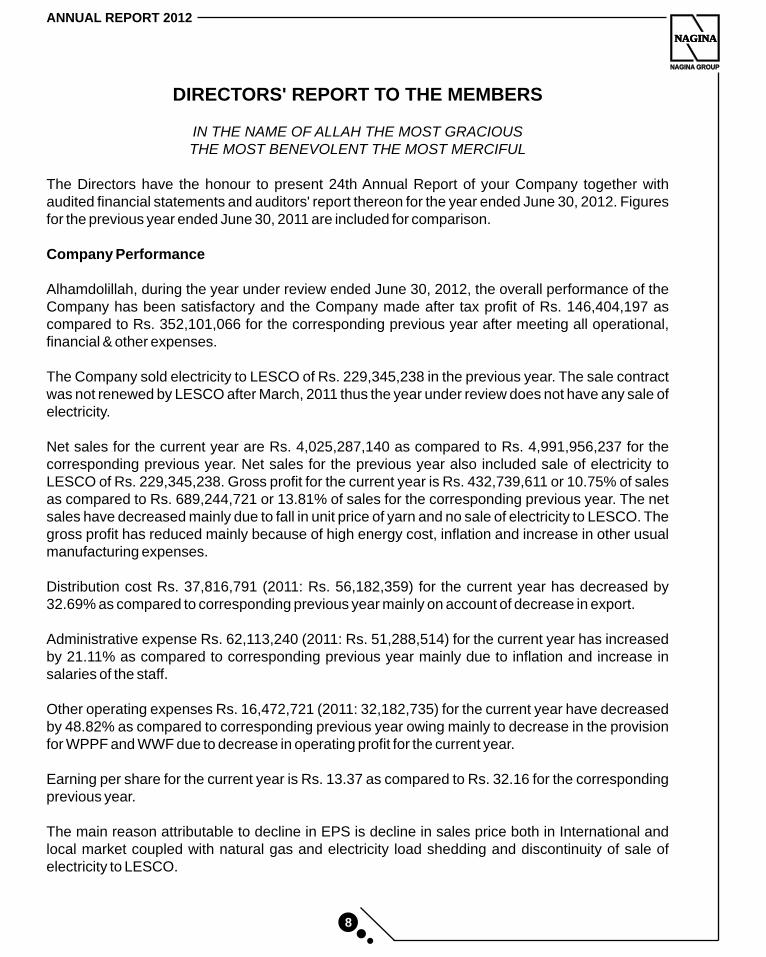
The Directors have the honour to present 24th Annual Report of your Company together with audited financial statements and auditors' report thereon for the year ended June 30, 2012. Figures for the previous year ended June 30, 2011 are included for comparison.
Company Performance
Alhamdolillah, during the year under review ended June 30, 2012, the overall performance of the Company has been satisfactory and the Company made after tax profit of Rs. 146,404,197 as compared to Rs. 352,101,066 for the corresponding previous year after meeting all operational, financial & other expenses. The Company sold electricity to LESCO of Rs. 229,345,238 in the previous year. The sale contract was not renewed by LESCO after March, 2011 thus the year under review does not have any sale of electricity.
Net sales for the current year are Rs. 4,025,287,140 as compared to Rs. 4,991,956,237 for the corresponding previous year. Net sales for the previous year also included sale of electricity to LESCO of Rs. 229,345,238. Gross profit for the current year is Rs. 432,739,611 or 10.75% of sales as compared to Rs. 689,244,721 or 13.81% of sales for the corresponding previous year. The net sales have decreased mainly due to fall in unit price of yarn and no sale of electricity to LESCO. The gross profit has reduced mainly because of high energy cost, inflation and increase in other usual manufacturing expenses.
Distribution cost Rs. 37,816,791 (2011: Rs. 56,182,359) for the current year has decreased by 32.69% as compared to corresponding previous year mainly on account of decrease in export.
Administrative expense Rs. 62,113,240 (2011: Rs. 51,288,514) for the current year has increased by 21.11% as compared to corresponding previous year mainly due to inflation and increase in salaries of the staff.
Other operating expenses Rs. 16,472,721 (2011: 32,182,735) for the current year have decreased by 48.82% as compared to corresponding previous year owing mainly to decrease in the provision for WPPF and WWF due to decrease in operating profit for the current year.
Earning per share for the current year is Rs. 13.37 as compared to Rs. 32.16 for the corresponding previous year.
The main reason attributable to decline in EPS is decline in sales price both in International and local market coupled with natural gas and electricity load shedding and discontinuity of sale of electricity to LESCO.
ELLCOT SPINNING MILLS LTD.
NAGINA
NAGINA GROUP
NAGINA
9
Future Prospects and Outlook
The management is concerned about the profitability of the Company for the coming year mainly
due to ever increasing production cost, uncertainty in prices of cotton and yarn, high energy cost
coupled with load shedding in Gas & Power sector, and damage to cotton crop.
The board is vigilant about the changes in domestic and international business environment. The
future outlook of the Company is optimistic subject to factors mentioned above.
Dividend
The Directors have pleasure to recommend payment of Cash Dividend @ 50% i.e. Rs. 5/= per
ordinary share. The Dividend will absorb Rs. 54,750,000/=.
Capital Assets Investment
As Balancing, Modernisation & Replacement (BMR) of plant & machinery and other assets is
continuous business requirement, we continuously undertake BMR activity. During the year
Rs.106,087,777 were invested in plant & machinery and other assets.
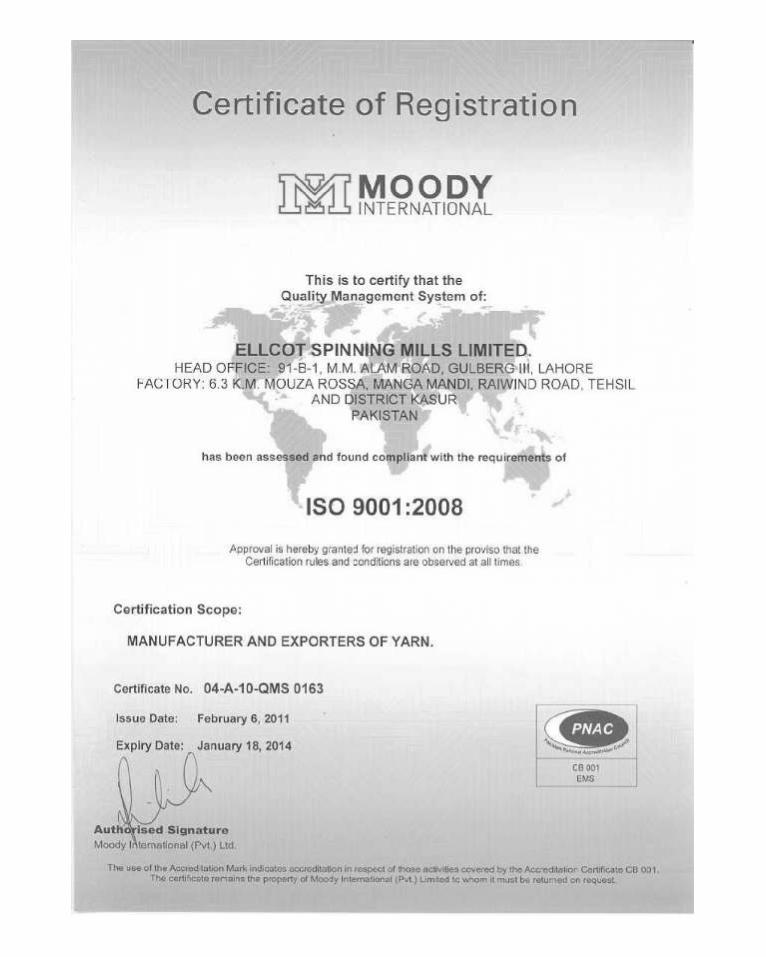
ISO 9001 : 2008 Certification
The Company continues to operate the high standard of quality and had obtained latest version of
certification for the period from February 6, 2011 to January 18, 2014. The quality control
certification helps to build up trust of new and old customers.
Environment, Health and Safety
The Company maintains safe working conditions avoiding the risk to the health of employees and
public at large. The management has maintained safe environment in all its operations throughout
the year and is constantly upgrading their safety and living facilities.
Corporate Governance & Financial Reporting Framework
As required by the Code of Corporate Governance, Directors are pleased to report that:
a) The financial statements prepared by the management of the Company present fair state of
Company's operations, cash flows and changes in equity.
b) Proper books of account of the Company have been maintained.
c) Appropriate accounting policies have been consistently applied in the preparation of financial
statements and accounting estimates are based upon reasonable and prudent judgment.
NAGINA
NAGINA GROUP
NAGINA
10
ANNUAL REPORT 2012
d)preparation of financial statements.
e) The system of internal control is sound in design and has been effectively implemented and monitored.
f) There are no doubts upon the Company's ability to continue as a going concern.
g) Key operating and financial data for the last six years is annexed.
h) There are no statutory payments on account of taxes, duties, levies and charges which are outstanding as on June 30, 2012 except for those disclosed in the financial statements.
i) No adverse material changes and commitments affecting the financial position of the Company have occurred between the end of the financial year to which this balance sheet relates and the date of the Director's Report.
j) During the year, no trade in the shares of the Company were carried out by the Directors, CEO, CFO, Company secretary, their spouses and minor children.
k) Requirement under Listing Regulation No. 35 (xi) has been complied with.
Related Parties
The transactions between the related parties were carried out at an arm's length basis. The Company has fully complied with the best practices of the transfer pricing as contained in the listing regulation of stock exchanges in Pakistan.
Financial Statements Audit
Financial statements of the Company have been audited without any qualification by Messrs. Rahman Sarfraz Rahim Iqbal Rafiq, Chartered Accountants, the auditors of the Company.
Shareholding pattern
The shareholding pattern as at June 30, 2012 including the information under the Code of Corporate Governance, for ordinary shares, is annexed.
Notice u/s 218 of the Companies Ordinance, 1984
Notice u/s 218 of the Companies Ordinance, 1984 is annexed.
Committees of the Board
In compliance with the Code of Corporate Governance and Articles of the Association of the Company, the Board of Directors had formed following Committees.
International Financial Reporting Standards, as applicable in Pakistan, have been followed in
ELLCOT SPINNING MILLS LTD.
NAGINA
NAGINA GROUP
NAGINA
11
· Audit Committee
· Human Resource and Remuneration Committee
· Executive Committee
The names of the members of above committees are given in the Company information.
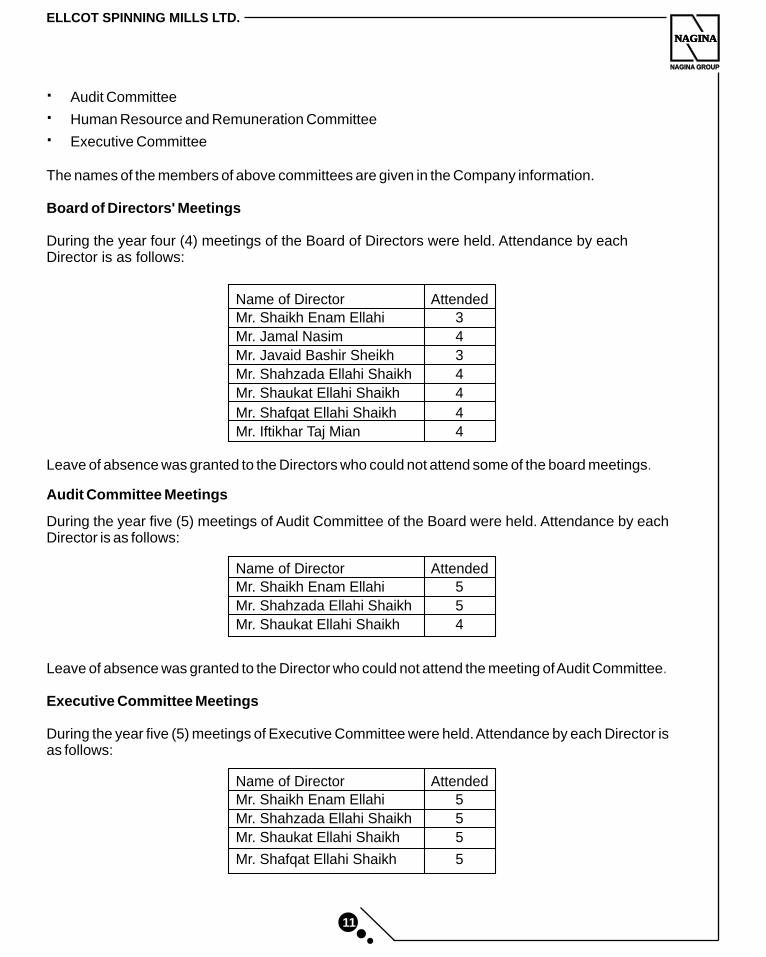
Board of Directors' Meetings
During the year four (4) meetings of the Board of Directors were held. Attendance by each Director is as follows:
Name of Director AttendedMr. Shaikh Enam Ellahi 3
Mr. Jamal Nasim 4
Mr. Javaid Bashir Sheikh 3
Mr. Shahzada Ellahi Shaikh 4
Mr. Shaukat Ellahi Shaikh 4
Mr. Shafqat Ellahi Shaikh 4
Mr. Iftikhar Taj Mian 4
Leave of absence was granted to the Directors who could not attend some of the board meetings
Audit Committee Meetings
During the year five (5) meetings of Audit Committee of the Board were held. Attendance by each Director is as follows:
.
Name of Director AttendedMr. Shaikh Enam Ellahi 5
Mr. Shahzada Ellahi Shaikh 5
Mr. Shaukat Ellahi Shaikh 4
Leave of absence was granted to the Director who could not attend the meeting of Audit Committee
Executive Committee Meetings
During the year five (5) meetings of Executive Committee were held. Attendance by each Director is as follows:
.
Name of Director AttendedMr. Shaikh Enam Ellahi 5
Mr. Shahzada Ellahi Shaikh 5
Mr. Shaukat Ellahi Shaikh
Mr. Shafqat Ellahi Shaikh
5
5
NAGINA
NAGINA GROUP
NAGINA
12
ANNUAL REPORT 2012
Human Resource & Remuneration (HR & R) Committee Meetings
The Board of Directors formed HR & R Committee in April, 2012. During the year, one (1) meeting of HR & R Committee of the Board was held. Attendance by each Director is as follows:
Name of Director AttendedMr. Shaukat Ellahi Shaikh 1
Mr. Shahzada Ellahi Shaikh 1
Mr. Iftikhar Taj Mian 1
Appointment of Auditors
The Audit Committee has recommended for re-appointment of present auditors, Messrs. Rahman Sarfraz Rahim Iqbal Rafiq, Chartered Accountants, Lahore. They are due to retire and being eligible, offer themselves for re-appointment as auditors for the year 2012-2013.
Acknowledgment
The continued good results have been possible due to continued diligence and devotion of the Staff and workers of the Company and the continued good human relations at all levels deserve acknowledgement. On behalf of the Board
Shafqat Ellahi ShaikhLahore: September 27, 2012 Mg. Director (Chief Executive).
ELLCOT SPINNING MILLS LTD.
NAGINA
NAGINA GROUP
NAGINA
13
STATEMENT OF COMPLIANCE WITH THECODE OF CORPORATE GOVERNANCEFOR THE YEAR ENDED JUNE 30, 2012
This statement is being presented to comply with the Code of Corporate Governance contained in Regulation No. 35 of listing regulations of Karachi & Lahore Stock Exchanges for the purpose of establishing a framework of good governance, whereby a listed company is managed in compliance with the best practices of corporate governance.
The Company has applied the principles contained in the CCG in the following manner:
1. The Board of Directors of the Ellcot Spinning Mills Ltd., has always supported and re-confirms its commitment to continued support and implementation of the highest standards of Corporate Governance at all times.
2. The Company encourages representation of independent, non-executive directors and directors representing minority interests on its Board of Directors. At present the Board includes:
Mr. Shaikh Enam Ellahi Mr. Jamal Nasim Mr. Javaid Bashir Sheikh Mr. Shahzada Ellahi Shaikh Mr. Shaukat Ellahi Shaikh Mr. Shafqat Ellahi Shaikh Mr. Iftikhar Taj Mian
Non-Executive Director Non Executive DirectorNon-Executive DirectorNon-Executive DirectorNon-Executive DirectorExecutive Director
Executive Director
3. The Directors have confirmed that none of them is serving as a Director on more than seven listed companies, including this Company.
4. All the resident Directors of the Company are registered as taxpayers and none of them has defaulted in payment of any loan to a banking company, a DFI or an NBFI or, being a member of a stock exchange, has been declared as a defaulter by that stock exchange.
5. No casual vacancy occurred during the year.
6. The Company has prepared a “Code of Conduct” and has ensured that appropriate steps have been taken to disseminate it throughout the Company along with its supporting policies and procedures.
7. The Board has developed a vision/mission statement, overall corporate strategy and significant policies of the Company. A complete record of particulars of significant policies along with the dates on which they were approved or amended has been maintained.
8. All the powers of the Board have been duly exercised and decisions on material transactions, including appointment and determination of remuneration and terms and conditions of employment of the CEO, other executive and non-executive directors, have been taken by the Board in line with Articles of Association of the Company.
NAGINA
NAGINA GROUP
NAGINA
14
ANNUAL REPORT 2012
9. The meetings of the Board were presided over by the Chairman and, in his absence, by a Director elected by the Board for this purpose and the Board met at least once in every quarter. Written notices of the Board meetings, along with agenda and working papers, were circulated at least seven days before the meetings. The minutes of the meetings were appropriately recorded and circulated.
10. Requirement under Listing Regulation No. 35 (xi) have been complied with.
11. The Board had approved appointment of CFO, Company Secretary and Head of Internal Audit, in line with Code of Corporate Governance.
12. The Directors' report for this year has been prepared in compliance with the requirements of CCG and fully describes the salient matters required to be disclosed. 13. The financial statements of the Company were duly endorsed by CEO and CFO before approval of the Board.
14. The Directors, CEO and executives do not hold any interest in the shares of the Company other than that disclosed in the pattern of shareholding.
15. The Company has complied with all the corporate and financial reporting requirements of the CCG.
16. The Board has formed an Audit Committee. It comprises three members, all members are non-executive directors.
17. The meetings of the Audit Committee were held at least once every quarter prior to approval of interim and final results of the Company and as required by the CCG. The terms of reference of the committee have been formed and advised to the committee for compliance.
18. The Board has formed a Human Resource and Remuneration Committee. It comprises three members, of whom two are non-executive directors including the Chairman.
19. The Board has formed an executive committee comprising four Directors to meet and take decisions on behalf of Board in the absence of full Board. The minutes of the meetings are properly maintained.
20. The Board has set up an effective internal audit function.
21. The statutory auditors of the Company have confirmed that they have been given a satisfactory rating under the quality control review program of the ICAP, that they or any of the partners of the firm, their spouses and minor children do not hold shares of the Company and that the firm and all its partners are in compliance with International Federation of Accountants (IFAC) guidelines on code of ethics as adopted by the ICAP.
22. The statutory auditors or the persons associated with them have not been appointed to provide other services except in accordance with the listing regulations and the auditors have confirmed that they have observed IFAC guidelines in this regard.
ELLCOT SPINNING MILLS LTD.
NAGINA
NAGINA GROUP
NAGINA
15
23. The 'closed period', prior to the announcement of interim/final results, and business decisions, which may materially affect the market price of Company's securities, was determined and intimated to Directors, employees and stock exchange(s).
24. The related party transactions have been placed before the Audit Committee and approved by the Board of Directors.
25. Material/price sensitive information has been disseminated among all market participants at once through stock exchange(s).
26. We confirm that all other material principles enshrined in the CCG have been complied with.
for & on behalf of the Board
SHAFQAT ELLAHI SHAIKHLahore: September 27, 2012 Mg. Director (Chief Executive)
NAGINA
NAGINA GROUP
NAGINA
16
ANNUAL REPORT 2012
Shareholders' Information
Annual General Meeting
thThe 24 Annual General Meeting of ELLCOT SPINNING MILLS LTD. will be held at the Registered Office of the Company, Nagina House, 91-B-1, M.M. Alam Road, Gulberg-III, Lahore-54660 on Wednesday, October 24, 2012 at 11:30 a.m.
Eligible shareholders are encouraged to participate and vote.
Ownership
On June 30, 2012, the Company has 632 Shareholders.
Web Reference The Company maintains a functional website. Annual, Half-yearly and Quarterly reports are regularly posted at the Company's website: www.nagina.com
Dividend
The Board of Directors have recommended in their meeting held on September 27, 2012, payment of final cash dividend at the rate of Rs. 5/= per share i.e. 50% for the year ended June 30, 2012.
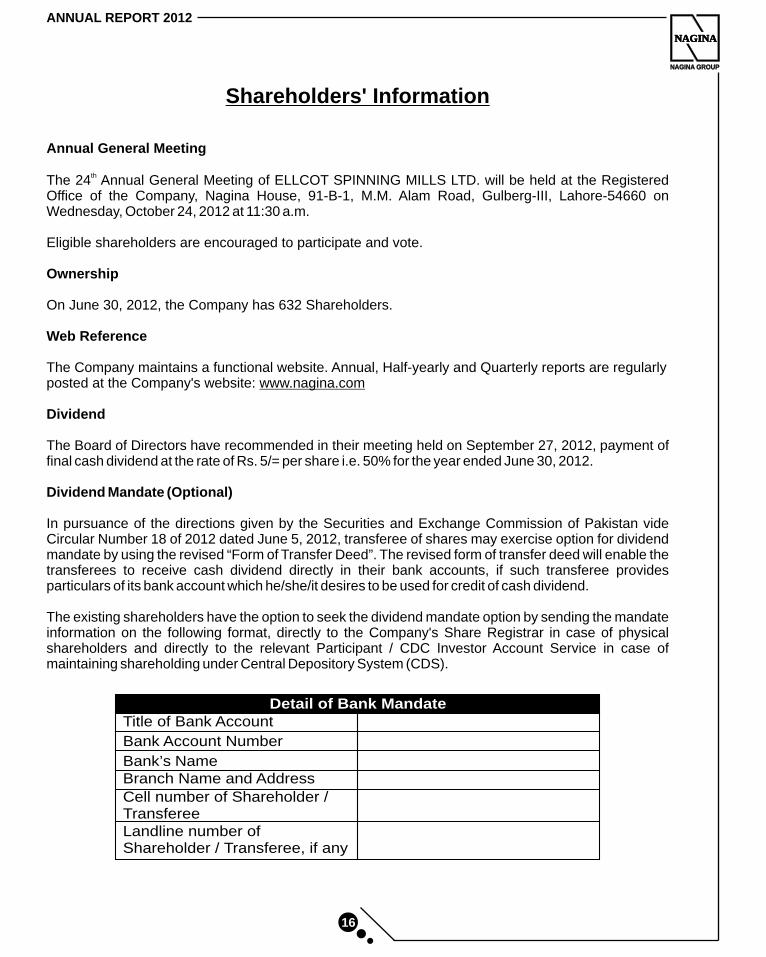
Dividend Mandate (Optional)
In pursuance of the directions given by the Securities and Exchange Commission of Pakistan vide Circular Number 18 of 2012 dated June 5, 2012, transferee of shares may exercise option for dividend mandate by using the revised “Form of Transfer Deed”. The revised form of transfer deed will enable the transferees to receive cash dividend directly in their bank accounts, if such transferee provides particulars of its bank account which he/she/it desires to be used for credit of cash dividend.
The existing shareholders have the option to seek the dividend mandate option by sending the mandate information on the following format, directly to the Company's Share Registrar in case of physical shareholders and directly to the relevant Participant / CDC Investor Account Service in case of maintaining shareholding under Central Depository System (CDS).
Title of Bank Account
Bank Account Number
Bank’s NameBranch Name and Address
Cell number of Shareholder / TransfereeLandline number of Shareholder / Transferee, if any
Detail of Bank Mandate
ELLCOT SPINNING MILLS LTD.
NAGINA
NAGINA GROUP
NAGINA
17
It is stated that the above-mentioned information is correct, that I will intimate the changes in the above-mentioned information to the Company and the concerned Share Registrar as soon as these occur.
_______________________Signature of the Shareholder
Requirement of CNIC Number / National Tax Number (NTN) Certificate
With reference to the notification of Securities and Exchange Commission of Pakistan (SECP), SRO 779(I)/2011 dated August 18, 2011 and SRO 831(I)2012 dated July 5, 2012 which mandate that dividend warrants should bear CNIC number of the registered member.
Members who have not yet submitted copy of their valid Computerized National Identity Card (CNIC) / National Tax Number (NTN) Certificate (in case of Corporate Entity) are requested to submit the same at the earliest.
Copy of CNIC/NTN may be sent directly to the Share Registrar:
M/s Hameed Majeed Associates (Pvt.) Limited, H.M. House, 7-Bank Square, LahorePh # (+92-42) 37235081-82Fax # (+92-42) 7358817
Kindly note that in case of non compliance of the submission of CNIC the Company may be constrained to withhold the dispatch of dividend warrant in future.
Investor Relations Contact
Mr. Iftikhar Taj Mian, Corporate SecretaryEmail: [email protected], Ph # (+92-42) 35756270, Fax: (+92-42) 35711856
Delivery of the Unclaimed / Undelivered Shares
Members are requested to contact the Registered Office of the Company or the Share Registrar, M/s. Hameed Majeed Associates (Pvt) Ltd., H.M. House, 7-Bank Square, Lahore., for collection of their shares which they have not received due to any reasons.
NAGINA
NAGINA GROUP
NAGINA
18
ANNUAL REPORT 2012
To: All members of the Company
NOTICE UNDER SECTION 218 OF THE COMPANIES ORDINANCE, 1984
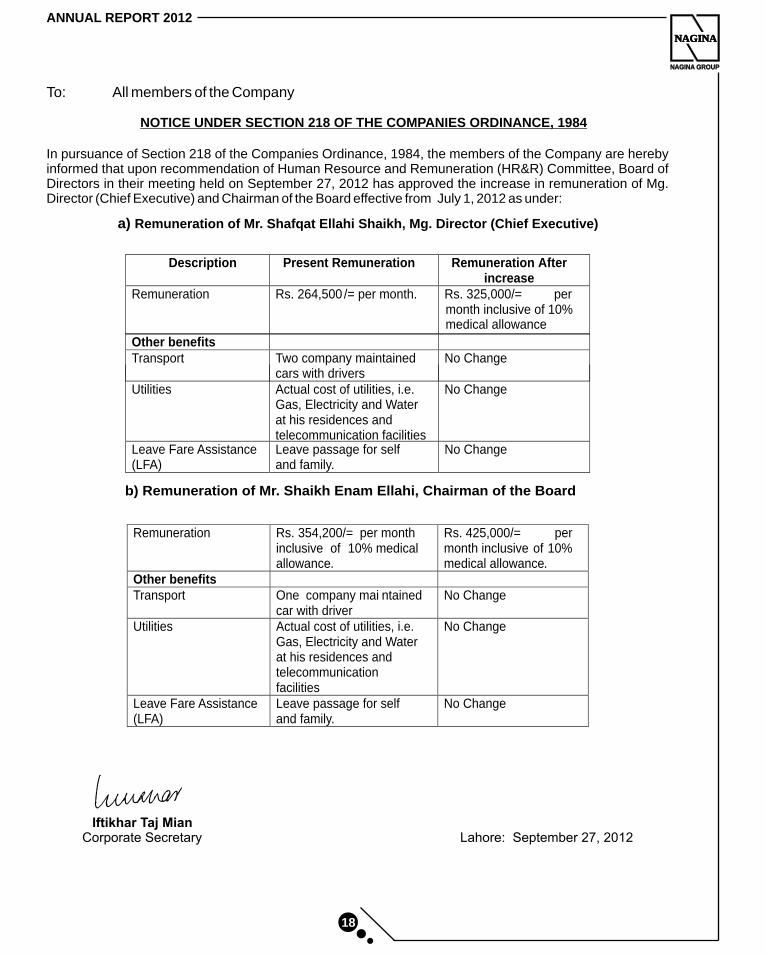
In pursuance of Section 218 of the Companies Ordinance, 1984, the members of the Company are hereby informed that upon recommendation of Human Resource and Remuneration (HR&R) Committee, Board of Directors in their meeting held on September 27, 2012 has approved the increase in remuneration of Mg. Director (Chief Executive) and Chairman of the Board effective from July 1, 2012 as under:
Description Present Remuneration Remuneration After increase
Remuneration Rs. 264,500 /= per month.
Rs. 325,000/= per
Other benefits Transport Two company maintained
cars with drivers
No Change
Utilities Actual cost of utilities, i.e. Gas, Electricity and Water at his residences and telecommunication facilities
No Change
Leave Fare Assistance (LFA)
Leave passage for self and family.
No Change
a) Remuneration of Mr. Shafqat Ellahi Shaikh, Mg. Director (Chief Executive)
b) Remuneration of Mr. Shaikh Enam Ellahi, Chairman of the Board
Remuneration Rs. 354,200/= per month inclusive of 10% medical allowance.
Rs. 425,000/= per month inclusive of 10% medical allowance.
Other benefits Transport One company mai ntained
car with driver
No Change
Utilities Actual cost of utilities, i.e. Gas, Electricity and Water at his residences and telecommunication facilities
No Change
Leave Fare Assistance (LFA)
Leave passage for self and family.
No Change
month inclusive of 10% medical allowance
ELLCOT SPINNING MILLS LTD.
NAGINA
NAGINA GROUP
NAGINA
19
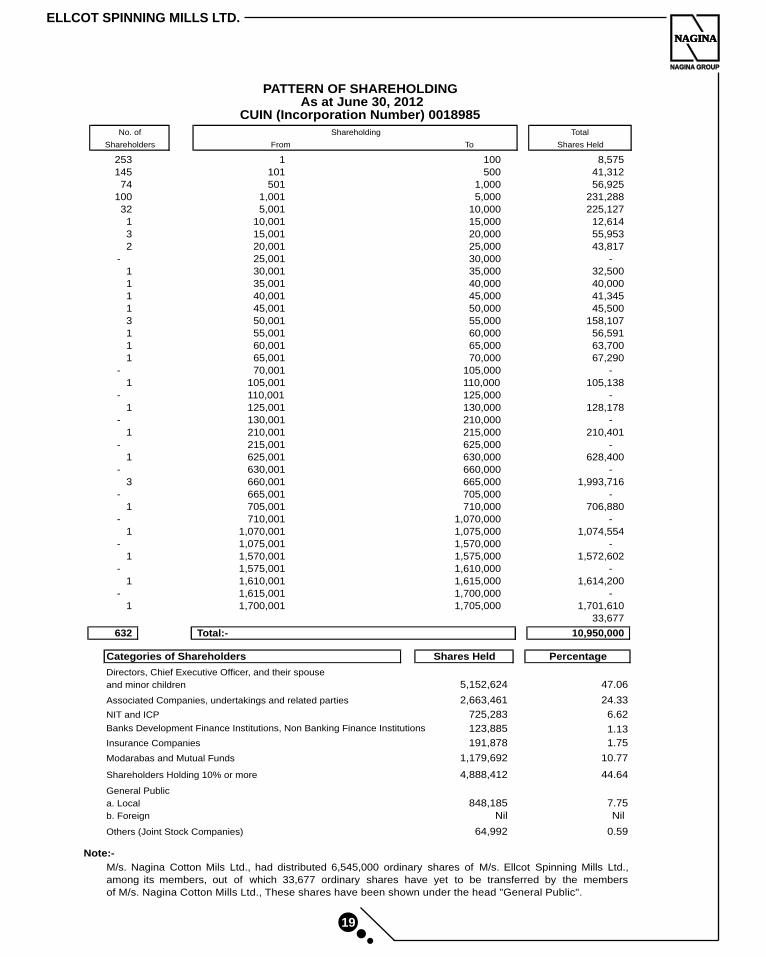
Categories of Shareholders Shares Held Percentage
Directors, Chief Executive Officer, and their spouse
5,152,624 47.06
Associated Companies, undertakings and related parties 2,663,461 24.33
NIT and ICP 725,283 6.62
Banks Development Finance Institutions, Non Banking Finance Institutions 123,885 1.13
Insurance Companies 191,878 1.75
Modarabas and Mutual Funds 1,179,692 10.77
Shareholders Holding 10% or more 4,888,412 44.64
General Public
a. Local 848,185 7.75b. Foreign Nil Nil
Others (Joint Stock Companies) 64,992 0.59
Note:-
M/s. Nagina Cotton Mils Ltd., had distributed 6,545,000 ordinary shares of M/s. Ellcot Spinning Mills Ltd.,members, out of which 33,677 ordinary shares have yet to be transferred by the members
of M/s. Nagina Cotton Mills Ltd., These shares have been shown under the head "General Public".
and minor children
itsamong
Total
From To Shares Held
253 1
100
8,575
145 101
500
41,312
74 501
1,000
56,925
100 1,001
5,000
231,288
32 5,001
10,000
225,127
1 10,001 15,000
12,614
3 15,001 20,000
55,953
2 20,001 25,000
43,817
- 25,001 30,000
-1 30,001 35,000 32,500 1 35,001 40,000 40,000 1 40,001 45,000 41,345 1 45,001 50,000
45,500
3 50,001 55,000
158,107
1 55,001 60,000
56,591
1 60,001 65,000
63,700
1 65,001 70,000
67,290
- 70,001 105,000
-1 105,001 110,000
105,138
- 110,001 125,000
-1 125,001 130,000
128,178
- 130,001 210,000
-1 210,001 215,000
210,401
- 215,001 625,000
-1 625,001 630,000
628,400
- 630,001 660,000
-3 660,001 665,000
1,993,716
- 665,001 705,000
-1 705,001 710,000 706,880
- 710,001 1,070,000 -1 1,070,001 1,075,000 1,074,554
- 1,075,001 1,570,000 -1 1,570,001 1,575,000 1,572,602
- 1,575,001 1,610,000 -1 1,610,001 1,615,000 1,614,200
- 1,615,001 1,700,000 -1 1,700,001 1,705,000 1,701,610
33,677
632 Total:- 10,950,000
PATTERN OF SHAREHOLDING
No. of
Shareholders
As at June 30, 2012CUIN (Incorporation Number) 0018985
Shareholding
NAGINA
NAGINA GROUP
NAGINA
20
ANNUAL REPORT 2012
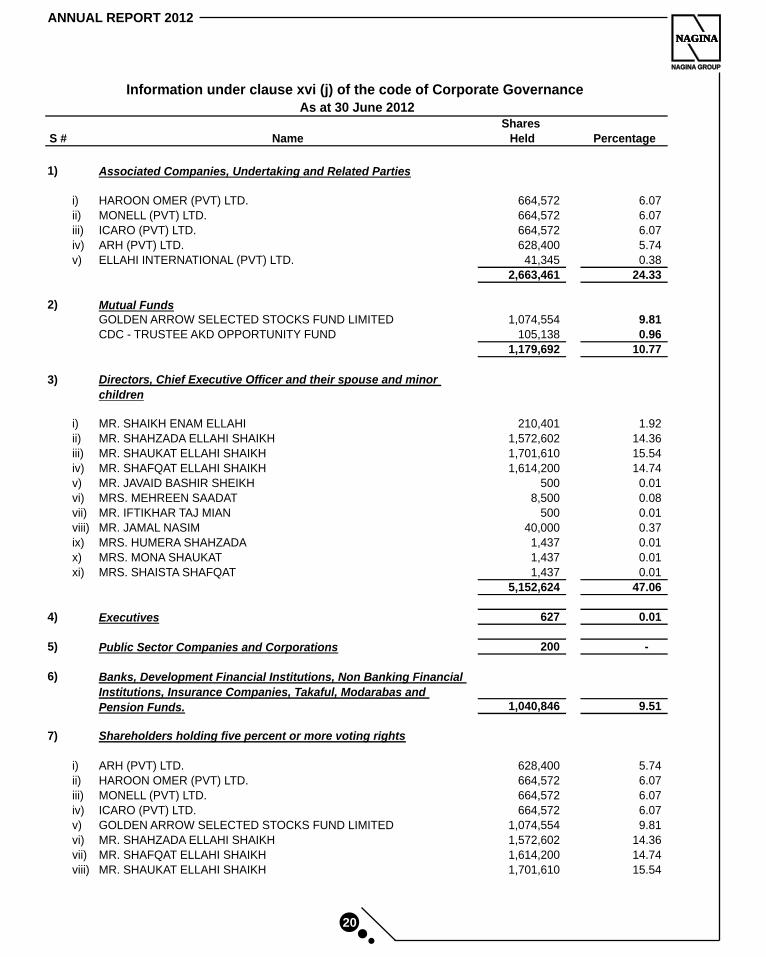
Shares S # Name Held Percentage
1) Associated Companies, Undertaking and Related Parties
i) HAROON OMER (PVT) LTD. 664,572
6.07
ii) MONELL (PVT) LTD. 664,572
6.07
iii) ICARO (PVT) LTD. 664,572
6.07
iv) ARH (PVT) LTD. 628,400
5.74
v) ELLAHI INTERNATIONAL (PVT) LTD. 41,345
0.38
2,663,461
24.33
2) Mutual FundsGOLDEN ARROW SELECTED STOCKS FUND LIMITED 1,074,554
9.81
CDC - TRUSTEE AKD OPPORTUNITY FUND 105,138
0.96
1,179,692
10.77
3) Directors, Chief Executive Officer and their spouse and minor
children
i) MR. SHAIKH ENAM ELLAHI 210,401
1.92
ii) MR. SHAHZADA ELLAHI SHAIKH 1,572,602
14.36
iii) MR. SHAUKAT ELLAHI SHAIKH 1,701,610
15.54
iv) MR. SHAFQAT ELLAHI SHAIKH 1,614,200
14.74
v) MR. JAVAID BASHIR SHEIKH 500
0.01
vi) MRS. MEHREEN SAADAT 8,500
0.08
vii) MR. IFTIKHAR TAJ MIAN 500
0.01
viii) MR. JAMAL NASIM 40,000
0.37
ix) MRS. HUMERA SHAHZADA 1,437 0.01
x) MRS. MONA SHAUKAT 1,437 0.01
xi) MRS. SHAISTA SHAFQAT 1,437 0.01
5,152,624 47.06
4) Executives 627 0.01
5) Public Sector Companies and Corporations 200 -
6)
1,040,846
9.51
7) Shareholders holding five percent or more voting rights
i) ARH (PVT) LTD. 628,400
5.74
ii) HAROON OMER (PVT) LTD. 664,572
6.07
iii) MONELL (PVT) LTD. 664,572
6.07
iv) ICARO (PVT) LTD. 664,572
6.07
v) GOLDEN ARROW SELECTED STOCKS FUND LIMITED 1,074,554
9.81
vi) MR. SHAHZADA ELLAHI SHAIKH 1,572,602 14.36vii) MR. SHAFQAT ELLAHI SHAIKH 1,614,200 14.74viii) MR. SHAUKAT ELLAHI SHAIKH 1,701,610 15.54
Information under clause xvi (j) of the code of Corporate Governance As at 30 June 2012
Banks, Development Financial Institutions, Non Banking Financial
Institutions, Insurance Companies, Takaful, Modarabas and
Pension Funds.
ELLCOT SPINNING MILLS LTD.
NAGINA
NAGINA GROUP
NAGINA
21
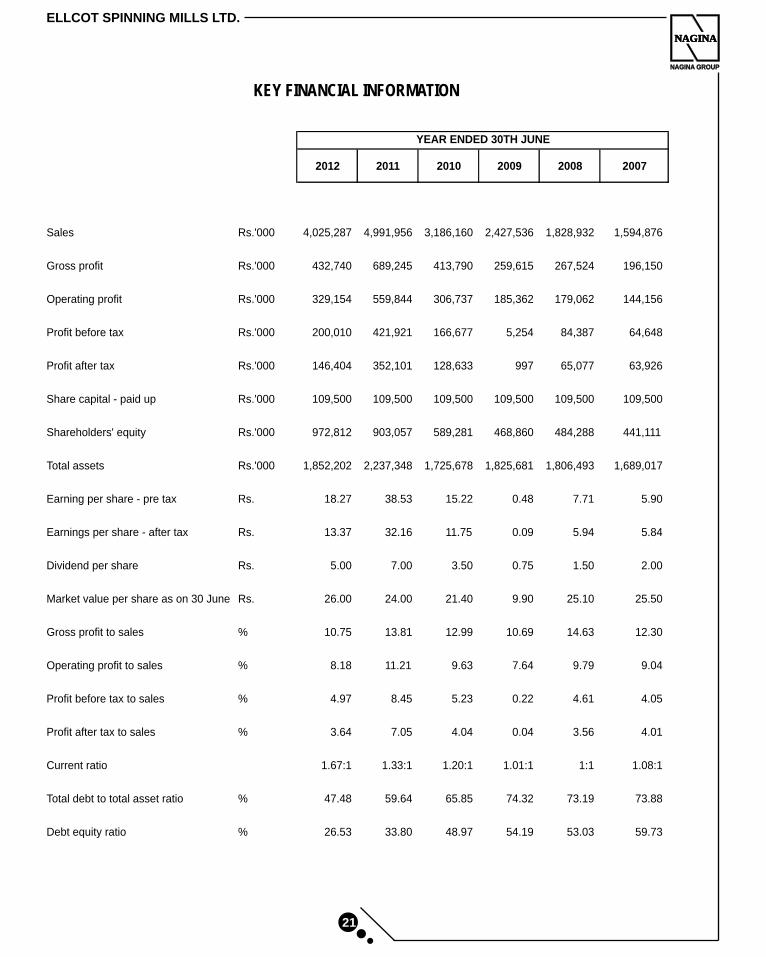
YEAR ENDED 30TH JUNE
2012 2011 2010 2009 2008 2007
Sales Rs.'000 4,025,287
4,991,956
3,186,160
2,427,536
1,828,932
1,594,876
Gross profit Rs.'000 432,740
689,245
413,790
259,615
267,524
196,150
Operating profit Rs.'000 329,154
559,844
306,737
185,362
179,062
144,156
Profit before tax Rs.'000 200,010
421,921
166,677
5,254
84,387
64,648
Profit after tax Rs.'000 146,404
352,101
128,633
997
65,077
63,926
Share capital - paid up Rs.'000 109,500
109,500
109,500
109,500
109,500
109,500
Shareholders' equity Rs.'000 972,812
903,057
589,281
468,860
484,288
441,111
Total assets Rs.'000 1,852,202
2,237,348
1,725,678
1,825,681
1,806,493
1,689,017
Earning per share - pre tax Rs. 18.27
38.53
15.22
0.48
7.71
5.90
Earnings per share - after tax Rs. 13.37
5.00
32.16
11.75
0.09
5.94
5.84
Dividend per share Rs. 7.00 3.50 0.75 1.50 2.00
Market value per share as on 30 June Rs. 26.00 24.00 21.40 9.90 25.10 25.50
Gross profit to sales % 10.75
13.81
12.99
10.69
14.63
12.30
Operating profit to sales % 8.18
11.21
9.63
7.64
9.79
9.04
Profit before tax to sales % 4.97
8.45
5.23
0.22
4.61
4.05
Profit after tax to sales % 3.64
7.05
4.04
0.04
3.56
4.01
Current ratio 1.67:1 1.33:1 1.20:1 1.01:1 1:1 1.08:1
Total debt to total asset ratio % 47.48 59.64 65.85 74.32 73.19 73.88
Debt equity ratio % 26.53 33.80 48.97 54.19 53.03 59.73
KEY FINANCIAL INFORMATION
Javaid Bashir SheikhDirector
NAGINA
NAGINA GROUP
NAGINA
24
ANNUAL REPORT 2012
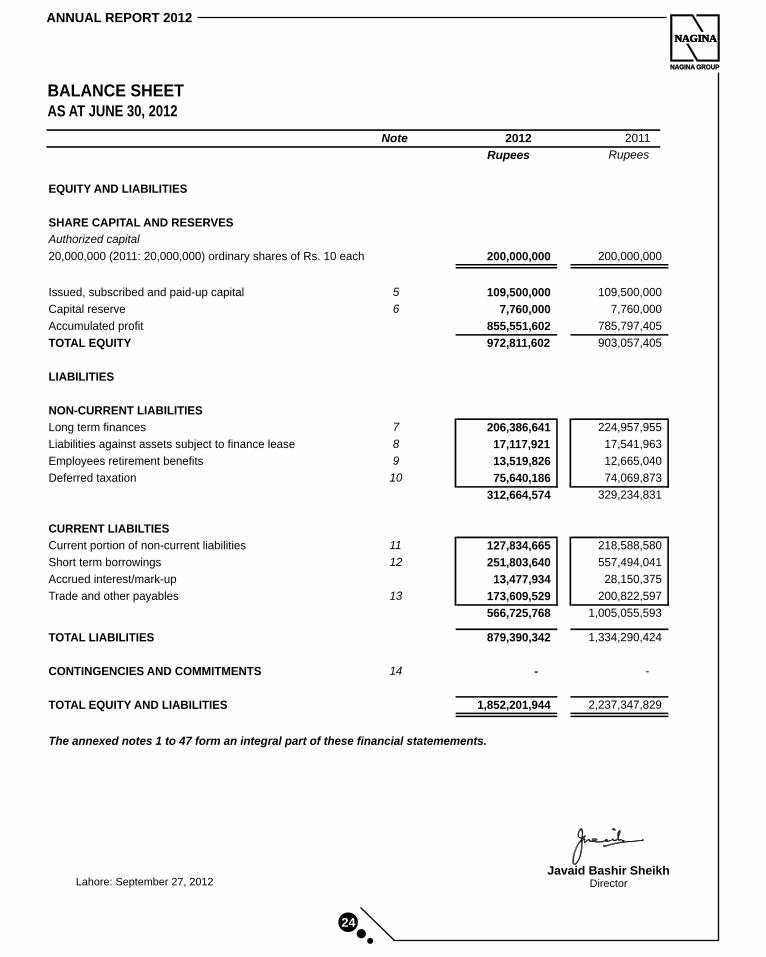
BALANCE SHEETAS AT JUNE 30, 2012
EQUITY AND LIABILITIES
SHARE CAPITAL AND RESERVES
Authorized capital
20,000,000 (2011: 20,000,000) ordinary shares of Rs. 10 each 200,000,000
200,000,000
Issued, subscribed and paid-up capital 5 109,500,000
109,500,000
Capital reserve 6 7,760,000
7,760,000
Accumulated profit 855,551,602
785,797,405
TOTAL EQUITY 972,811,602
903,057,405
LIABILITIES
NON-CURRENT LIABILITIES
Long term finances 7 206,386,641
224,957,955
Liabilities against assets subject to finance lease 8 17,117,921
17,541,963
Employees retirement benefits 9 13,519,826
12,665,040
Deferred taxation 10 75,640,186
74,069,873
312,664,574
329,234,831
CURRENT LIABILTIES
Current portion of non-current liabilities 11 127,834,665
218,588,580
Short term borrowings 12 251,803,640
557,494,041
Accrued interest/mark-up 13,477,934
28,150,375
Trade and other payables 13 173,609,529
200,822,597
566,725,768
1,005,055,593
TOTAL LIABILITIES 879,390,342
1,334,290,424
CONTINGENCIES AND COMMITMENTS 14 -
-
TOTAL EQUITY AND LIABILITIES 1,852,201,944
2,237,347,829
The annexed notes 1 to 47 form an integral part of these financial statemements.
Note 2012 2011
Rupees Rupees
Lahore: September 27, 2012
Shafqat Ellahi ShaikhMg. Director (Chief Executive)
ELLCOT SPINNING MILLS LTD.
NAGINA
NAGINA GROUP
NAGINA
25
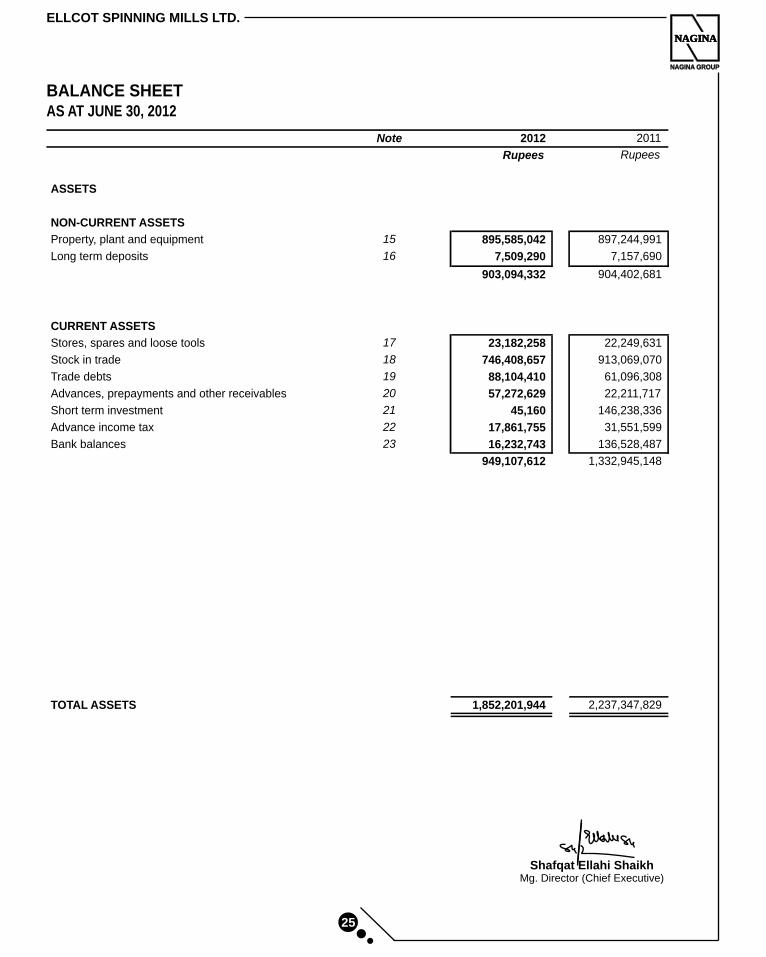
BALANCE SHEETAS AT JUNE 30, 2012
ASSETS
NON-CURRENT ASSETS
Property, plant and equipment
Long term deposits
CURRENT ASSETS
Stores, spares and loose tools
Stock in trade
Trade debts
Advances, prepayments and other receivables
Short term investment
Advance income tax
Bank balances
TOTAL ASSETS
15 895,585,042
897,244,991
16 7,509,290
7,157,690
903,094,332
904,402,681
17 23,182,258
22,249,631
18 746,408,657
913,069,070
19 88,104,410
61,096,308
20 57,272,629
22,211,717
21 45,160
146,238,336
22 17,861,755
31,551,599
23 16,232,743
136,528,487
949,107,612
1,332,945,148
1,852,201,944
2,237,347,829
Note 2012 2011
Rupees Rupees
NAGINA
NAGINA GROUP
NAGINA
26
ANNUAL REPORT 2012
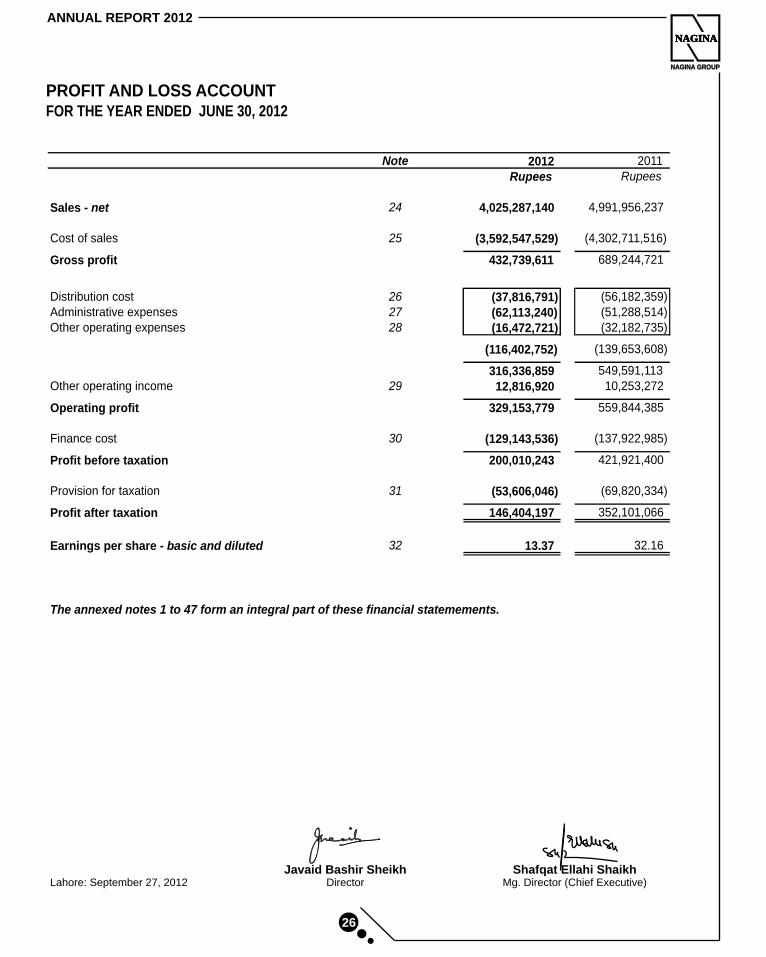
PROFIT AND LOSS ACCOUNTFOR THE YEAR ENDED JUNE 30, 2012
Note 2012 2011
Rupees Rupees
Sales - net 24 4,025,287,140
4,991,956,237
Cost of sales 25 (3,592,547,529)
(4,302,711,516)
Gross profit 432,739,611
689,244,721
Distribution cost 26 (37,816,791)
(56,182,359)
Administrative expenses 27 (62,113,240)
(51,288,514)
Other operating expenses 28 (16,472,721) (32,182,735)
(116,402,752) (139,653,608)
316,336,859 549,591,113 Other operating income 29 12,816,920 10,253,272
Operating profit 329,153,779 559,844,385
Finance cost 30 (129,143,536)
(137,922,985)
Profit before taxation 200,010,243
421,921,400
Provision for taxation 31 (53,606,046)
(69,820,334)
Profit after taxation 146,404,197
352,101,066
Earnings per share - basic and diluted 32 13.37
32.16
The annexed notes 1 to 47 form an integral part of these financial statemements.
Javaid Bashir SheikhDirector
Shafqat Ellahi ShaikhMg. Director (Chief Executive)Lahore: September 27, 2012
ELLCOT SPINNING MILLS LTD.
NAGINA
NAGINA GROUP
NAGINA
27
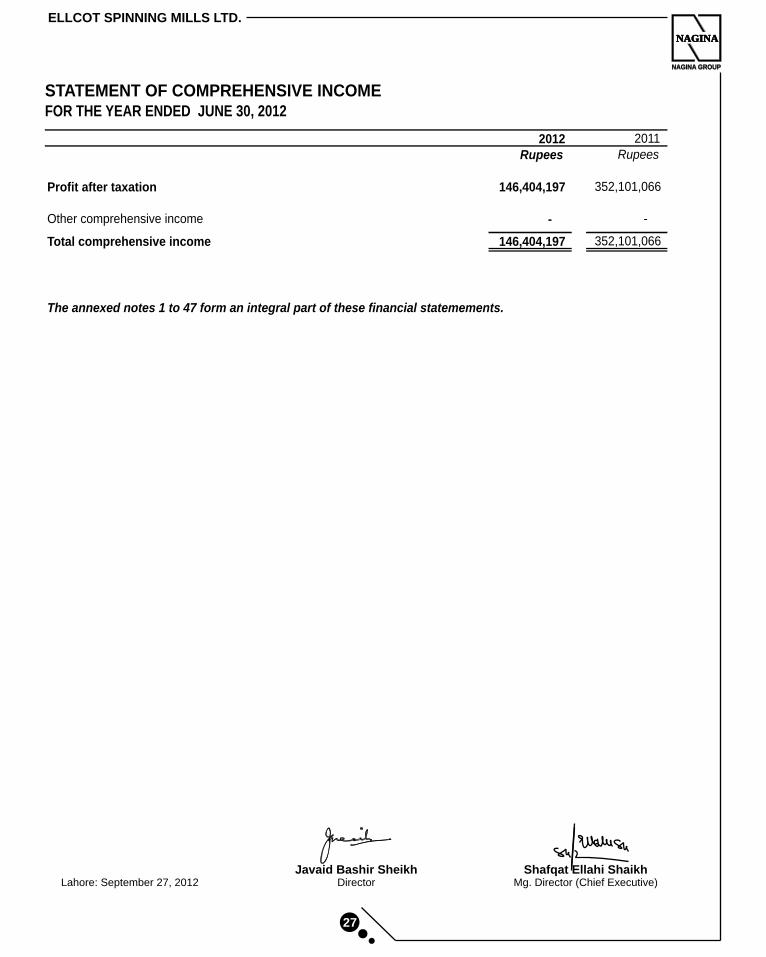
STATEMENT OF COMPREHENSIVE INCOMEFOR THE YEAR ENDED JUNE 30, 2012
2012 2011
Rupees Rupees
Profit after taxation 146,404,197 352,101,066
Other comprehensive income - -
Total comprehensive income 146,404,197 352,101,066
The annexed notes 1 to 47 form an integral part of these financial statemements.
Javaid Bashir SheikhDirector
Shafqat Ellahi ShaikhMg. Director (Chief Executive)Lahore: September 27, 2012
NAGINA
NAGINA GROUP
NAGINA
28
ANNUAL REPORT 2012
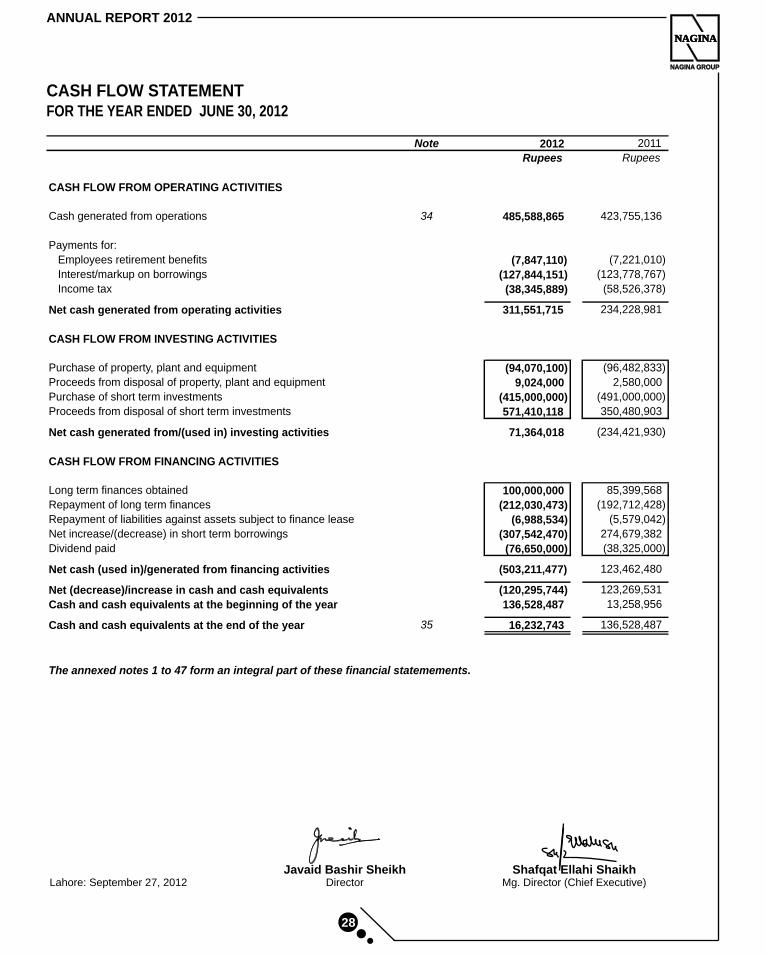
CASH FLOW STATEMENTFOR THE YEAR ENDED JUNE 30, 2012
Note 2012 2011
Rupees Rupees
CASH FLOW FROM OPERATING ACTIVITIES
Cash generated from operations 34 485,588,865
423,755,136
Payments for:
Employees retirement benefits (7,847,110)
(7,221,010)
Interest/markup on borrowings (127,844,151)
(123,778,767)
Income tax (38,345,889)
(58,526,378)
Net cash generated from operating activities 311,551,715
234,228,981
CASH FLOW FROM INVESTING ACTIVITIES
Purchase of property, plant and equipment (94,070,100) (96,482,833)
Proceeds from disposal of property, plant and equipment 9,024,000 2,580,000
Purchase of short term investments (415,000,000) (491,000,000) Proceeds from disposal of short term investments 571,410,118 350,480,903
Net cash generated from/(used in) investing activities 71,364,018 (234,421,930)
CASH FLOW FROM FINANCING ACTIVITIES
Long term finances obtained 100,000,000
85,399,568
Repayment of long term finances (212,030,473)
(192,712,428)
Repayment of liabilities against assets subject to finance lease (6,988,534)
(5,579,042) Net increase/(decrease) in short term borrowings (307,542,470)
274,679,382
Dividend paid (76,650,000)
(38,325,000)
Net cash (used in)/generated from financing activities (503,211,477)
123,462,480
Net (decrease)/increase in cash and cash equivalents (120,295,744)
123,269,531
Cash and cash equivalents at the beginning of the year 136,528,487
13,258,956
Cash and cash equivalents at the end of the year 35 16,232,743
136,528,487
The annexed notes 1 to 47 form an integral part of these financial statemements.
Javaid Bashir SheikhDirector
Shafqat Ellahi ShaikhMg. Director (Chief Executive)Lahore: September 27, 2012
ELLCOT SPINNING MILLS LTD.
NAGINA
NAGINA GROUP
NAGINA
29
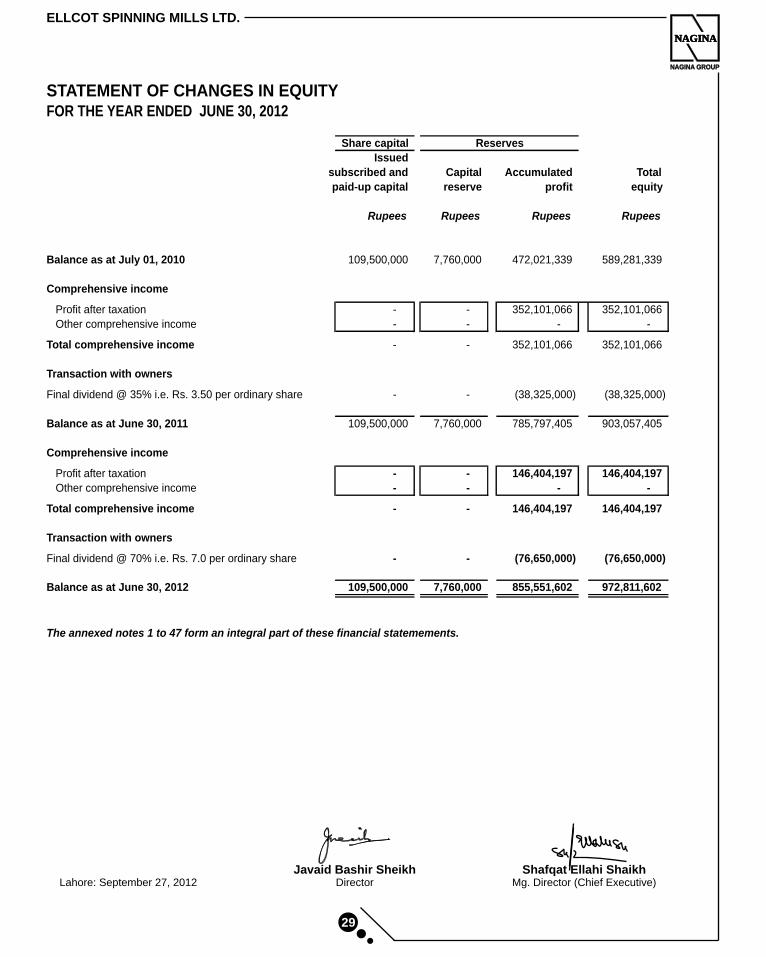
STATEMENT OF CHANGES IN EQUITYFOR THE YEAR ENDED JUNE 30, 2012
Share capital
Issued
subscribed and Capital Accumulated Total
paid-up capital reserve profit equity
Rupees Rupees Rupees Rupees
Balance as at July 01, 2010 109,500,000
7,760,000
472,021,339
589,281,339
Comprehensive income
Profit after taxation -
-
352,101,066
352,101,066
Other comprehensive income -
-
-
-
Total comprehensive income -
-
352,101,066
352,101,066
Transaction with owners
Final dividend @ 35% i.e. Rs. 3.50 per ordinary share -
-
(38,325,000)
(38,325,000)
Balance as at June 30, 2011 109,500,000
7,760,000
785,797,405
903,057,405
Comprehensive income
Profit after taxation -
-
146,404,197
146,404,197
Other comprehensive income -
-
-
-
Total comprehensive income -
-
146,404,197
146,404,197
Transaction with owners
Final dividend @ 70% i.e. Rs. 7.0 per ordinary share - - (76,650,000) (76,650,000)
Balance as at June 30, 2012 109,500,000 7,760,000 855,551,602 972,811,602
The annexed notes 1 to 47 form an integral part of these financial statemements.
Reserves
Javaid Bashir SheikhDirector
Shafqat Ellahi ShaikhMg. Director (Chief Executive)Lahore: September 27, 2012
NAGINA
NAGINA GROUP
NAGINA
30
ANNUAL REPORT 2012
NOTES TO AND FORMING PART OF FINANCIAL STATEMENTSFOR THE YEAR ENDED JUNE 30, 2012
1 REPORTING ENTITY
2 BASIS OF PREPARATION
2.1 Statement of compliance
2.2 Basis of measurement
2.3 Judgements, estimates and assumptions
2.3.1 Depreciation method, rates and useful lives of property and equipment
The preparation of financial statements requires management to make judgements, estimates andassumptions that affect the application of accounting policies and the reported amounts of assets,liabilities, income and expenses. The estimates and associated assumptions and judgements are basedon historical experience and various other factors that are believed to be reasonable under thecircumstances, the result of which forms the basis of making judgements about carrying values of assetsand liabilities that are not readily apparent from other sources. Subsequently, actual results may differfrom these estimates. Estimates and underlying assumptions are reviewed on an ongoing basis.Revisions to accounting estimates are recognized in the period in which the estimate is revised and in anyfuture periods affected. Judgements made by management in the application of approved accountingstandards that have significant effect on the financial statements and estimates with a risk of materialadjustment in subsequent years are as follows:
The Company reassesses useful lives, depreciation method and rates for each item of propertyand equipment annually by considering expected pattern of economic benefits that the Companyexpects to derive from that item.
Ellcot Spinning Mills Limited ('the Company') is incorporated in Pakistan as a Public Limited Company underthe Companies Ordinance, 1984 and is listed on Karachi Stock Exchange (Guarantee) Limited and LahoreStock Exchange (Guarantee) Limited. The Company is primarily a spinning unit engaged in the manufactureand sale of yarn, however, it has also been engaged in the generation and sale of electricity under a licensefrom National Electric Power Regulatory Authority uptill year ended June 30, 2011. The registered office of theCompany is situated at Nagina House, 91-B-1, M.M. Alam Road, Gulberg III, Lahore. The manufacturingfacility, including the power generation unit, is located in District Kasur in the Province of Punjab.
These financial statements have been prepared in accordance with approved accounting standards asapplicable in Pakistan and the requirements of Companies Ordinance, 1984. Approved accountingstandards comprise of such International Financial Reporting Standards ('IFRSs') issued by theInternational Accounting Standards Board as notified under the provisions of the Companies Ordinance,1984, provisions of and directives issued under the Companies Ordinance, 1984. In case requirementsdiffer, the provisions of or directives under the Companies Ordinance, 1984 prevail.
These financial statements have been prepared under the historical cost convention except for employeeretirement benefits liabilities measured at present value and certain financial instruments measured at fairvalue/amortized cost. In these financial statements, except for the amounts reflected in the cash flowstatement, all transactions have been accounted for on accrual basis.
ELLCOT SPINNING MILLS LTD.
NAGINA
NAGINA GROUP
NAGINA
31
2.3.2 Recoverable amount and impairment
2.3.3 Obligation under defined benefit plan
2.3.4 Taxation
2.3.5 Provisions
2.4 Functional currency
3 SIGNIFICANT ACCOUNTING POLICIES
The accounting policies set out below have been applied consistently to all periods presented in these financial statements.
3.1 Property, plant and equipment
3.1.1 Operating fixed assets
The Company recognizes depreciation in profit or loss by applying reducing balance method overthe useful life of each operating fixed asset using rates specified in note 15.1 to the financialstatements. Depreciation on additions to operating fixed assets is charged from the month in whichthe item becomes available for use. Depreciation is discontinued from the month in which it isdisposed or classified as held for disposal.
An operating fixed asset is de-recognized when permanently retired from use. Any gain or loss ondisposal of operating fixed assets is recognized in profit or loss.
Provisions are based on best estimate of the expenditure required to settle the present obligationat the reporting date, that is, the amount that the Company would rationally pay to settle theobligation at the reporting date or to transfer it to a third party.
These financial statements have been prepared in Pak Rupees which is the Company's functionalcurrency.
Operating fixed assets are measured at cost less accumulated depreciation and accumulatedimpairment losses with the exception of freehold land, which is stated at cost less accumulatedimpairment losses. Cost comprises purchase price, including import duties and non-refundablepurchase taxes, after deducting trade discounts and rebates, and includes other costs directlyattributable to the acquisition or construction, erection and installation.
Major renewals and improvements to operating fixed assets are recognized in the carrying amountof the item if it is probable that the embodied future economic benefits will flow to the Companyand the cost of renewal or improvement can be measured reliably. The cost of the day-to-dayservicing of operating fixed assets are recognized in profit or loss as incurred.
The Company's obligation under the defined benefit plan is based on assumptions of futureoutcomes, the principal ones being in respect of increases in remuneration, remaining workinglives of employees and discount rates to be used to determine present value of defined benefitobligation. These assumptions are determined periodically by independent actuaries.
The Company takes into account the current income tax law and decisions taken by appellate andother relevant legal forums while estimating its provision for current tax. Provision for deferred taxis estimated after taking into account historical and expected future turnover and profit trends andtheir taxability under the current tax law.
The management of the Company reviews carrying amounts of its assets for possible impairmentand makes formal estimates of recoverable amount if there is any such indication.
NAGINA
NAGINA GROUP
NAGINA
32
ANNUAL REPORT 2012
3.5 Financial instruments
3.5.1 Recognition
who have completed the minimum qualifying service period. Liability is adjusted on each reportingdate to cover the obligation and the adjustment is charged to profit or loss. The amount recognizedon balance sheet represents the present value of defined benefit obligation as adjusted forunrecognized actuarial gains or losses. Actuarial gains or loss are recognized using '10% corridorapproach' as set out by International Accounting Standard 19 - Employee Benefits. The details ofthe scheme are referred to in note 9 to the financial statements.
A financial instrument is recognized when the Company becomes a party to the contractual provisionsof the instrument.
3.1.2 Capital work in progress
3.2 Stores, spares and loose tools
3.3 Stock in trade
Raw materialsWork in processFinished goodsStock in transit
First In First OutAverage manufacturing costAverage manufacturing costInvoice price plus related cost incurred up to the reporting date
3.4 Employee benefits
3.4.1 Short-term employee benefits
3.4.2 Post-employment benefits
Net realizable value signifies the estimated selling price in the ordinary course of business less estimatedcosts of completion and estimated costs necessary to make the sale.
The Company recognizes the undiscounted amount of short term employee benefits to be paid inexchange for services rendered by employees as a liability after deducting amount already paidand as an expense in profit or loss unless it is included in the cost of inventories or property, plantand equipment as permitted or required by the approved accounting standards. If the amount paidexceeds the undiscounted amount of benefits, the excess is recognized as an asset to the extentthat the prepayment would lead to a reduction in future payments or cash refund.
The Company operates an unfunded gratuity scheme (defined benefit plan) for all its employees
Capital work in progress is stated at cost less identified impairment loss, if any, and includes thecost of material, labour and appropriate overheads directly relating to the construction, erection orinstallation of an item of operating fixed assets. These costs are transferred to operating fixedassets as and when related items become available for intended use.
These are generally held for internal use and are valued at cost. Cost is determined on the basis ofweighted average except for items in transit, which are valued at invoice price plus related cost incurredup to the reporting date. For items which are considered obsolete, the carrying amount is written down tonil.
These are valued at lower of cost and net realizable value, with the exception of stock of waste which isvalued at net realizable value. Cost is determined using the following basis:
Average manufacturing cost in relation to work in process and finished goods consists of direct material,labour and an appropriate proportion of manufacturing overheads.
ELLCOT SPINNING MILLS LTD.
NAGINA
NAGINA GROUP
NAGINA
33
3.5.2 Classification
3.5.2(a) Loans and receivables
3.5.2(b)Financial assets at fair value through profit or loss
3.5.2(c) Financial liabilities at amortized cost
3.5.3 Measurement
3.5.4 De-recognition
3.5.5 Off-setting
Financial assets at fair value through profit or loss are financial assets that are eitherdesignated as such on initial recognition or are classified as held for trading. Financialassets are designated as financial assets at fair value through profit or loss if the Companymanages such assets and evaluates their performance based on their fair value inaccordance with the Company’s risk management and investment strategy. Financialassets are classified as held for trading when these are acquired principally for thepurpose of selling and repurchasing in the near term, or when these are part of a portfolioof identified financial instruments that are managed together and for which there is arecent actual pattern of profit taking, or where these are derivatives, excluding derivativesthat are financial guarantee contracts or that are designated and effective hedginginstruments. Financial assets in this category are presented as current assets.
Non-derivative financial liabilities that are not financial liabilities at fair value through profitor loss are classified as financial liabilities at amortized cost. Financial liabilities in thiscategory are presented as current liabilities except for maturities greater than twelvemonths from the reporting date where these are presented as non-current liabilities.
The particular measurement methods adopted are disclosed in the individual policy statementsassociated with each instrument.
Financial assets are de-recognized if the Company's contractual rights to the cash flows from thefinancial assets expire or if the Company transfers the financial asset to another party withoutretaining control or substantially all risks and rewards of the asset. Financial liabilities are de-recognized if the Company's obligations specified in the contract expire or are discharged orcancelled. Any gain or loss on de-recognition of financial assets and financial liabilities isrecognized in profit or loss.
A financial asset and a financial liability is offset and the net amount reported in the balance sheetif the Company has legally enforceable right to set-off the recognized amounts and intends eitherto settle on a net basis or to realize the asset and settle the liability simultaneously.
The Company classifies its financial instruments into following classes depending on the purposefor which the financial assets and liabilities are acquired or incurred. The Company determines theclassification of its financial assets and liabilities at initial recognition.
Non-derivative financial assets with fixed or determinable payments that are not quoted inan active market are classified as loans and receivables. Assets in this category arepresented as current assets except for maturities greater than twelve months from thereporting date, where these are presented as non-current assets.
NAGINA
NAGINA GROUP
NAGINA
34
ANNUAL REPORT 2012
3.6 Ordinary share capital
3.7 Loans and borrowings
3.8 Investments in mutual funds
3.9 Finance leases
3.10 Operating leases
3.11 Trade and other payables
3.11.1 Financial liabilities
Loans and borrowings are classified as 'financial liabilities at amortized cost'. On initial recognition, theseare measured at cost, being fair value at the date the liability is incurred, less attributable transactioncosts. Subsequent to initial recognition, these are measured at amortized cost with any differencebetween cost and value at maturity recognized in the profit or loss over the period of the borrowings on aneffective interest basis.
Investment in mutual funds units which are acquired principally for the purpose of selling in the near termand short term profit taking are classified as 'financial assets at fair value through profit or loss'. On initialrecognition, these are measured at cost, being their fair value on the date of acquisition. Subsequent toinitial recognition, these are measured at fair value. Changes in fair value are recognized in profit or loss.Gains and losses on de-recognition are recognized in profit or loss.
Leases in terms of which the Company assumes substantially all risks and rewards of ownership areclassified as finance leases. Assets subject to finance lease are classified as 'operating fixed assets'. Oninitial recognition, these are measured at cost, being an amount equal to the lower of its fair value and thepresent value of minimum lease payments. Subsequent to initial recognition, these are measured at costless accumulated depreciation and accumulated impairment losses. Depreciation, subsequentexpenditure, de-recognition, and gains and losses on de-recognition are accounted for in accordance withthe respective policies for operating fixed assets. Liabilities against assets subject to finance lease anddeposits against finance lease are classified as 'financial liabilities at amortized cost' and 'loans andreceivables' respectively, however, since they fall outside the scope of measurement requirements of IAS39 'Financial Instruments - Recognition and Measurement', these are measured in accordance with therequirements of IAS 17 'Leases'. On initial recognition, these are measured at cost, being their fair valueat the date of commencement of lease, less attributable transaction costs. Subsequent to initialrecognition, minimum lease payments made under finance leases are apportioned between the financecharge and the reduction of outstanding liability. The finance charge is allocated to each period during thelease term so as to produce a constant periodic rate of interest on the remaining balance of the liability.Deposits against finance leases, subsequent to initial recognition are carried at cost.
Leases that do not transfer substantially all risks and rewards of ownership are classified as operatingleases. Payments made under operating leases are recognized in profit or loss on a straight line basisover the lease term.
These are classified as 'financial liabilities at amortized cost'. On initial recognition, these aremeasured at cost, being their fair value at the date the liability is incurred, less attributabletransaction costs. Subsequent to initial recognition, these are measured at amortized cost usingthe effective interest method, with interest recognized in profit or loss.
Ordinary share capital is recognized as equity. Transaction costs directly attributable to the issue ofordinary shares are recognized as deduction from equity.
ELLCOT SPINNING MILLS LTD.
NAGINA
NAGINA GROUP
NAGINA
35
3.11.2 Non-financial liabilities
3.12 Provisions and contingencies
3.13 Trade and other receivables
3.13.1 Financial assets
3.13.2 Non-financial assets
3.14 Revenue
Interest income is recognized using effective interest method.
3.15 Comprehensive income
Export rebate is recognized at the same time when revenue from export sales is recognized.
Comprehensive income is the change in equity resulting from transactions and other events, other thanchanges resulting from transactions with shareholders in their capacity as shareholders. Totalcomprehensive income comprises all components of profit or loss and other comprehensive income.Other comprehensive income comprises items of income and expense, including reclassificationadjustments, that are not recognized in profit or loss as required or permitted by approved accountingstandards, and is presented in 'statement of other comprehensive income'.
Provisions are recognized when the Company has a legal and constructive obligation as a result of pastevents and it is probable that outflow of resources embodying economic benefits will be required to settlethe obligation and a reliable estimate can be made of the amount of obligation. Provision is recognized atan amount that is the best estimate of the expenditure required to settle the present obligation at thereporting date. Where outflow of resources embodying economic benefits is not probable, or where areliable estimate of the amount of obligation cannot be made, a contingent liability is disclosed, unless thepossibility of outflow is remote.
These are classified as 'loans and receivables'. On initial recognition, these are measured at cost,being their fair value at the date of transaction, plus attributable transaction costs. Subsequent toinitial recognition, these are measured at amortized cost using the effective interest method, withinterest recognized in profit or loss.
These, both on initial recognition and subsequently, are measured at cost.
Revenue is measured at the fair value of the consideration received or receivable, net of returnsallowances, trade discounts and rebates, and represents amounts received or receivable for goods andservices provided and other income earned in the normal course of business. Revenue is recognizedwhen it is probable that the economic benefits associated with the transaction will flow to the Company,and the amount of revenue and the associated costs incurred or to be incurred can be measured reliably.
Revenue from different sources is recognized as follows:
Revenue from sale of goods is recognized when risks and rewards incidental to the ownership of goodsare transferred to the buyer. Transfer of risks and rewards vary depending on the individual terms of thecontract of sale. For local sales transfer usually occurs on dispatch of goods to customers. For exportsales transfer occurs upon loading the goods on to the relevant carrier.
These, both on initial recognition and subsequently, are measured at cost.
NAGINA
NAGINA GROUP
NAGINA
36
ANNUAL REPORT 2012
3.16 Borrowing costs
3.17 Income tax
3.17.1 Current taxation
3.17.2 Deferred taxation
3.18 Government grants
3.19 Earnings per share ('EPS')
Government grants that compensate the Company for expenses or losses already incurred arerecognized in profit or loss in the period in which these are received and are deducted in reporting therelevant expenses or losses.
Basic EPS is calculated by dividing the profit or loss attributable to ordinary shareholders of the Companyby the weighted average number of ordinary shares outstanding during the year.
Diluted EPS is calculated by adjusting basic EPS by the weighted average number of ordinary shares thatwould be issued on conversion of all dilutive potential ordinary shares into ordinary shares and post-taxeffect of changes in profit or loss attributable to ordinary shareholders of the Company that would resultfrom conversion of all dilutive potential ordinary shares into ordinary shares.
Borrowing costs directly attributable to the acquisition, construction or production of qualifying assets,which are assets that necessarily take a substantial period of time to get ready for their intended use orsale, are added to the cost of those assets, until such time as the assets are substantially ready for theirintended use or sale. Investment income earned on the temporary investment of specific borrowingspending their expenditure on qualifying asset is deducted from the borrowing costs eligible forcapitalization. All other borrowing costs are recognized in profit or loss as incurred.
Income tax expense comprises current tax and deferred tax. Income tax expense is recognized in profitor loss except to the extent that it relates to items recognized directly in other comprehensive income, inwhich case it is recognized in other comprehensive income.
Current tax is the amount of tax payable on taxable income for the year and any adjustment to thetax payable in respect of previous years. Provision for current tax is based on current rates oftaxation in Pakistan after taking into account tax credits, rebates and exemptions available, if any.The amount of unpaid income tax in respect of the current or prior periods is recognized as aliability. Any excess paid over what is due in respect of the current or prior periods is recognized asan asset.
Deferred tax is accounted for using the 'balance sheet approach' providing for temporarydifferences between the carrying amounts of assets and liabilities for financial reporting purposesand the amounts used for tax purposes. In this regard, the effects on deferred taxation of theportion of income that is subject to final tax regime is also considered in accordance with thetreatment prescribed by The Institute of Chartered Accountants of Pakistan. Deferred tax ismeasured at rates that are expected to be applied to the temporary differences when they reverse,based on laws that have been enacted or substantively enacted by the reporting date. A deferredtax liability is recognized for all taxable temporary differences. A deferred tax asset is recognizedfor deductible temporary differences to the extent that future taxable profits will be available against which temporary differences can be utilized. Deferred tax assets are reviewed at each reportingdate and are reduced to the extent that it is no longer probable that the related tax benefit will berealized.
ELLCOT SPINNING MILLS LTD.
NAGINA
NAGINA GROUP
NAGINA
37
3.20 Cash and cash equivalents
3.21 Foreign currency transactions and balances
3.22 Impairment
3.22.1 Financial assets
3.22.2 Non-financial assets
An impairment loss in respect of a financial asset measured at amortized cost is calculated as thedifference between its carrying amount, and the present value of the estimated future cash flowsdiscounted at the original effective interest rate. Impairment loss in respect of a financial assetmeasured at fair value is determined by reference to that fair value. All impairment losses arerecognized in profit or loss. An impairment loss is reversed if the reversal can be related objectivelyto an event occurring after the impairment loss was recognized. An impairment loss is reversedonly to the extent that the financial asset’s carrying amount after the reversal does not exceed thecarrying amount that would have been determined, net of amortization, if no impairment loss hadbeen recognized.
The carrying amount of the Company’s non-financial assets, other than inventories and deferredtax assets are reviewed at each reporting date to determine whether there is any indication ofimpairment. If any such indication exists, then the asset’s recoverable amount is estimated. Therecoverable amount of an asset or cash generating unit is the greater of its value in use and its fairvalue less costs to sell. In assessing value in use, the estimated future cash flows are discountedto their present values using a pre-tax discount rate that reflects current market assessments ofthe time value of money and the risks specific to the asset or cash generating unit.
Cash and cash equivalents for the purpose of cash flow statement comprise cash in hand and cash atbanks. These are classified as 'loans and receivables' and are carried at cost.
Transactions in foreign currency are translated to the functional currency of the Company using exchangerate prevailing at the date of transaction. Monetary assets and liabilities denominated in foreign currencyare translated to the functional currency at exchange rate prevailing at the reporting date. Non-monetaryassets and liabilities denominated in foreign currency that are measured at fair value are translated to thefunctional currency at exchange rate prevailing at the date the fair value is determined. Non-monetaryassets and liabilities denominated in foreign currency that are measured at historical cost are translated tofunctional currency at exchange rate prevailing at the date of initial recognition. Any gain or loss arising ontranslation of foreign currency transactions and balances is recognized in profit or loss.
A financial asset is assessed at each reporting date to determine whether there is any objectiveevidence that it is impaired. Individually significant financial assets are tested for impairment on anindividual basis. The remaining financial assets are assessed collectively in groups that sharesimilar credit risk characteristics. A financial asset is considered to be impaired if objectiveevidence indicates that one or more events have had a negative effect on the estimated futurecash flows of the asset.
NAGINA
NAGINA GROUP
NAGINA
38
ANNUAL REPORT 2012
3.23 Dividend distribution to ordinary shareholders
4 NEW AND REVISED APPROVED ACCOUNTING STANDARDS, INTERPRETATIONS AND AMENDMENTS THERETO
4.1 Approved accounting standards, interpretations and amendments thereto issued but not effective as at the reporting date
IFRS 9 - Financial Instruments: Classification and Measurement
IFRS 10 - Consolidated Financial Statements
IFRS 11 - Joint Arrangements
IFRS 12 - Disclosure of Interests in Other Entities
IFRS 13 - Fair Value Measurement
The standard establishes a single framework for measuring fair value where that is required by otherstandards. The standard is effective for annual periods beginning on or after January 01, 2013.
The standard introduces disclosure requirements relating to interests in subsidiaries, joint arrangements,associates and unconsolidated structured entities. The standard is effective for annual periods beginningon or after January 01, 2013.
The following standards, interpretations and amendments are in issue which are not effective as at thereporting date. Their impact on the Company's financial statements cannot be ascertained as at thereporting date.
The standard introduces new requirements for the classification and measurement of financialinstruments and replaces relevant requirements in IAS 39 - Financial Instruments: Recognition andMeasurement. The standard is effective for annual periods beginning on or after January 01, 2013.
The standard replaces those parts of IAS 27 - Consolidated and Separate Financial Statements, thataddress when and how an investor should prepare consolidated financial statements and supersedes SIC12 - Consolidation: Special Purpose Entities. The standard is effective for annual periods beginning on orafter January 01, 2013.
The standard supersedes IAS 31 - Interest in Joint Ventures and SIC 13 - Jointly Controlled Entities: Non-monetary Contributions by Venturers. The standard is effective for annual periods beginning on or afterJanuary 01, 2013.
An impairment loss is recognized if the carrying amount of the asset or its cash generating unitexceeds its estimated recoverable amount. Impairment losses are recognized in profit or loss.Impairment losses recognized in respect of cash generating units are allocated to reduce thecarrying amounts of the assets in a unit on a pro rata basis. Impairment losses recognized in priorperiods are assessed at each reporting date for any indications that the loss has decreased or nolonger exists. An impairment loss is reversed if there has been a change in the estimates used indetermine the recoverable amount. An impairment loss is reversed only to that extent that theasset’s carrying amount after the reversal does not exceed the carrying amount that would havebeen determined, net of depreciation and amortization, if no impairment loss had been recognized.
Dividend to ordinary shareholders is recognized as a deduction from accumulated profit in statement ofchanges in equity and as a liability, to the extent it is unclaimed/unpaid, in the Company’s financialstatements in the year in which the dividends are approved by the Company’s shareholders.
ELLCOT SPINNING MILLS LTD.
NAGINA
NAGINA GROUP
NAGINA
39
IAS 12 - Income Taxes (amendements)
IAS 19 - Employee Benefits (amendements)
IAS 1 - Presentation of Financial Statements (amendements)
IAS 27 - Separate Financial Statements (revised 2011)
IAS 28 - Investments in Associates and Joint Ventures (revised 2011)
IAS 32 - Financial Instruments: Presentation (amendments)
IFRS 7 - Financial Instruments: Disclosure (amendments)
The amendments require presentation of items of other comprehensive income that would be reclassifiedto profit or loss in future if certain conditions are met separately from those items which will never be soreclassifed. The amendemens are effective for annual periods beginning on or after July 01, 2012.
The amendments contain new disclosure requirements for financial assets and liabilities that are offset inthe statement of financial position or subject to master netting agreement or similar arrangement.Theamendments are effective for annual periods beginning on or after January 01, 2013.
The amendments provide exception to the general principal of IAS 12 for investment property measuredusing the fair value model and introduces a rebuttable presumption that the carrying amount of such anasset will be recovered entirely through sale. The amendments are effective for annual periods beginningon or after January 01, 2012.
The amendments require actuarial gains and losses to be recognized immediately in othercomprehensive income and remove the corridor method as well as the option to recognize all changes indefined benefit obligation and plan assets in profit or loss. The amendments are effective for annualperiods begining on or after January 01, 2013.
The revised standard supercedes IAS 27 - Consolidated and Separate Financial Statements (revised2008). The revised standard carries forward existing accounting and disclosure requirements for separatefinancial statements with some minor clarifications. The revised standard is effective for annual periodsbegining on or after January 01, 2013.
The revised standard supercedes IAS 28 - Investments in Associates (revised 2008). The revisedstandard makes amendments to apply IFRS 5 - Non-Current Assets Held for Sale and DiscontinuedOperations to investment, or a portion thereof, in an associate or joint venture, that meets the criteria tobe classified as held for sale. The revised standard is effective for annual periods begining on or afterJanuary 01, 2013.
The amendments address inconsistencies in current practice when applying the offsetting criteria in IAS32 Financial Instruments: Presentation. The amendments clarify the meaning of ‘currently has a legallyenforceable right of set-off’; and that some gross settlement systems may be considered equivalent to netsettlement. The amendments are effective for annual periods beginning on or after January 01, 2014.
NAGINA
NAGINA GROUP
NAGINA
40
ANNUAL REPORT 2012
IFRIC 20 -Stripping Cost in the Production Phase of a Surface Mining
Annual Improvements 2009-2011(effective for annual periods beginning on or after January 01, 2013)
IAS 1 - Presentation of Financial Statements (amendements)
IAS 16 - Property, Plant and Equipment (amendments)
IAS 32 - Financial Instruments: Presentation (amendments)
IAS 34 - Interim Financial Reporting (amendments)
IAS 34 - Interim Financial Reporting (amendments)
The interpretation requires production stripping cost in a surface mine to be capitalized if certain criteriaare met.
The amendement clarifies that only one comparative period – which is the preceding period – isrequired for a complete set of financial statements. If an entity presents additional comparativeinformation, then that additional information need not be in the form of a complete set of financialstatements. However, such information should be accompanied by related notes and should be inaccordance with IFRS. Furthermore, it clarifies that the ‘third statement of financial position’, whenrequired, is only required if the effect of restatement is material to statement of financial position.
The amendement clarifies that IAS 12 - Income Taxes applies to the accounting for income taxesrelating to distributions to holders of an equity instrument and transaction costs of an equitytransaction. The amendment removes a perceived inconsistency between IAS 32 and IAS 12.
The amendement aligns the disclosure requirements for segment assets and segment liabilities ininterim financial reports with those in IFRS 8 - Operating Segments. IAS 34 now requires thedisclosure of a measure of total assets and liabilities for a particular reportable segment. Inaddition, such disclosure is only required when the amount is regularly provided to the chiefoperating decision maker and there has been a material change from the amount disclosed in thelast annual financial statements for that reportable segment.
The amendement aligns the disclosure requirements for segment assets and segment liabilities ininterim financial reports with those in IFRS 8 - Operating Segments. IAS 34 now requires thedisclosure of a measure of total assets and liabilities for a particular reportable segment. Inaddition, such disclosure is only required when the amount is regularly provided to the chiefoperating decision maker and there has been a material change from the amount disclosed in thelast annual financial statements for that reportable segment.
The new cycle of improvements contains amendments to the following standards, with consequentialamendments to other standards and interpretations.
The amendement clarifies the accounting of spare parts, stand-by equipment and servicingequipment. The definition of ‘property, plant and equipment’ in IAS 16 is now considered indetermining whether these items should be accounted for under that standard. If these items donot meet the definition, then they are accounted for using IAS 2 Inventories.
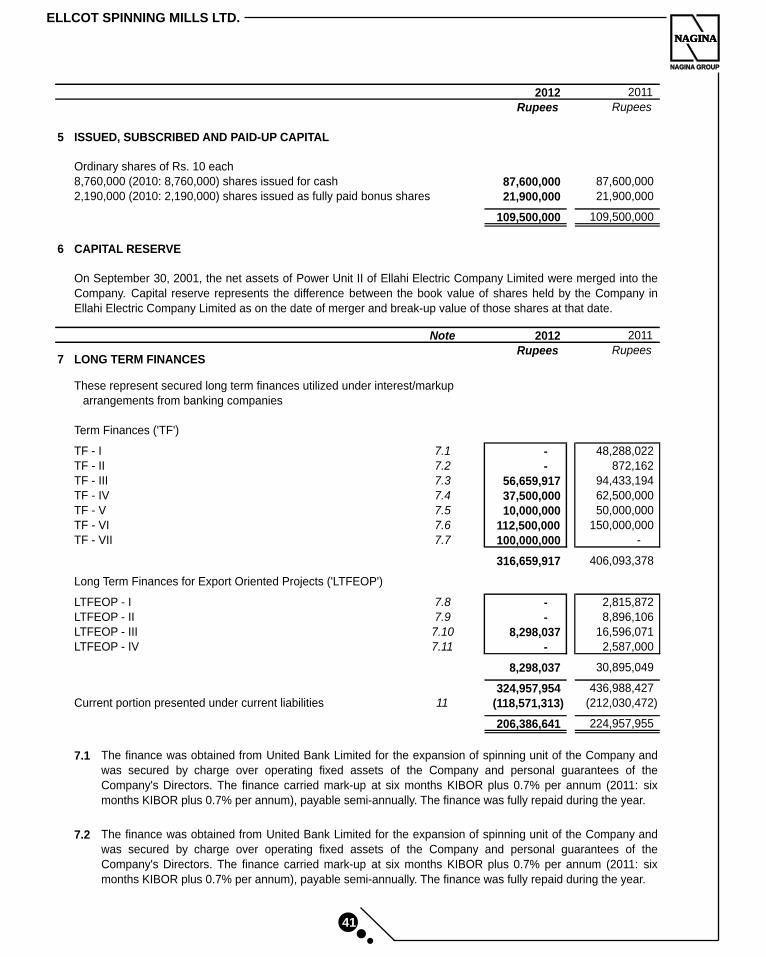
ELLCOT SPINNING MILLS LTD.
NAGINA
NAGINA GROUP
NAGINA
41
2012 2011
Rupees Rupees
5 ISSUED, SUBSCRIBED AND PAID-UP CAPITAL
Ordinary shares of Rs. 10 each8,760,000 (2010: 8,760,000) shares issued for cash 87,600,000
87,600,000
2,190,000 (2010: 2,190,000) shares issued as fully paid bonus shares 21,900,000
21,900,000
109,500,000
109,500,000
6 CAPITAL RESERVE
Note 2012 2011
Rupees Rupees7 LONG TERM FINANCES
These represent secured long term finances utilized under interest/markuparrangements from banking companies
Term Finances ('TF')
TF - I 7.1 -
48,288,022
TF - II 7.2 - 872,162
TF - III 7.3 56,659,917 94,433,194
TF - IV 7.4 37,500,000 62,500,000
TF - V 7.5 10,000,000 50,000,000 TF - VI 7.6 112,500,000 150,000,000 TF - VII 7.7 100,000,000 -
316,659,917 406,093,378 Long Term Finances for Export Oriented Projects ('LTFEOP')
LTFEOP - I 7.8 -
2,815,872 LTFEOP - II 7.9 -
8,896,106
LTFEOP - III 7.10 8,298,037
16,596,071
LTFEOP - IV 7.11 -
2,587,000
8,298,037
30,895,049
324,957,954
436,988,427
Current portion presented under current liabilities 11 (118,571,313)
(212,030,472)
206,386,641
224,957,955
7.1
7.2
On September 30, 2001, the net assets of Power Unit II of Ellahi Electric Company Limited were merged into theCompany. Capital reserve represents the difference between the book value of shares held by the Company inEllahi Electric Company Limited as on the date of merger and break-up value of those shares at that date.
The finance was obtained from United Bank Limited for the expansion of spinning unit of the Company andwas secured by charge over operating fixed assets of the Company and personal guarantees of theCompany's Directors. The finance carried mark-up at six months KIBOR plus 0.7% per annum (2011: sixmonths KIBOR plus 0.7% per annum), payable semi-annually. The finance was fully repaid during the year.
The finance was obtained from United Bank Limited for the expansion of spinning unit of the Company andwas secured by charge over operating fixed assets of the Company and personal guarantees of theCompany's Directors. The finance carried mark-up at six months KIBOR plus 0.7% per annum (2011: sixmonths KIBOR plus 0.7% per annum), payable semi-annually. The finance was fully repaid during the year.
NAGINA
NAGINA GROUP
NAGINA
42
ANNUAL REPORT 2012
7.3
7.4
7.5
7.6
7.7
7.8
7.9
7.10
7.11
The finance has been obtained from United Bank Limited to finance capital expenditure and is secured bycharge over operating fixed assets of the Company and personal guarantees of the Company's Directors.The finance carries mark-up at six months KIBOR plus 1.5% per annum, payable semi-annually. The financeis repayable in eight equal semi-annual installments with the first installment due in December 2013.
The finance was obtained from Bank Alfalah Limited as partial conversion of TF-V and was secured bycharge over operating assets of the Company and personal guarantees of the Company's Directors. Thefinance carried mark-up at 7% per annum (2011: 7% per annum), payable quarterly. The finance was fullyrepaid during the year.
The finance was obtained from United Bank Limited as partial conversion of TF-I and was secured by chargeover operating fixed assets of the Company and personal guarantees of the Company's Directors. Thefinance carried mark-up at 7% per annum (2011: 7% per annum), payable semi-annually. The finance wasfully repaid during the year.
The finance was obtained from United Bank Limited as partial conversion of TF-I and was secured by chargeover operating fixed assets of the Company and personal guarantees of the Company's Directors. Thefinance carried mark-up at 7% per annum (2011: 7% per annum), payable semi-annually. The finance wasfully repaid during the year.
The finance has been obtained from United Bank Limited as partial conversion of TF-II and is secured bycharge over operating fixed assets of the Company and personal guarantees of the Company's Directors.The finance carries mark-up at 7% per annum (2011: 7% per annum), payable semi-annually. The finance isrepayable in eleven equal semi-annual installments with the first installment due in February 2007.
The finance has been obtained from United Bank Limited to finance capital expenditure and is secured bycharge over operating fixed assets of the Company and personal guarantees of the Company's Directors.The finance carries mark-up at six months KIBOR plus 1.5% per annum (2011: six months KIBOR plus 1.5%per annum), payable semi-annually. The finance is repayable in ten equal semi-annual installments with thefirst installment due in February 2009.
The finance has been obtained from National Bank of Pakistan for financial restructuring and is secured bycharge over operating fixed assets of the Company and personal guarantees of the Company's Directors.The finance carries mark-up at six months KIBOR plus 2.5% per annum (2011: six months KIBOR plus 2.5%per annum), payable quarterly. The finance is repayable in eight equal semi-annual installments with the firstinstallment due in June 2010.
The finance has been obtained from Faysal Bank Limited for financial restructuring and is secured by chargeover operating fixed assets of the Company and personal guarantees of the Company's Directors. Thefinance carries mark-up at three months KIBOR plus 2.25% per annum, payable quarterly. The finance isrepayable in ten equal quarterly installments with the first installment due in May 2010.
The finance has been obtained from United Bank Limited to finance capital expenditure and is secured bycharge over operating fixed assets of the Company and personal guarantees of the Company's Directors.The finance carries mark-up at six months KIBOR plus 1.75% per annum, payable semi-annually. Thefinance is repayable in eight equal semi-annual installments with the first installment due in December 2011.
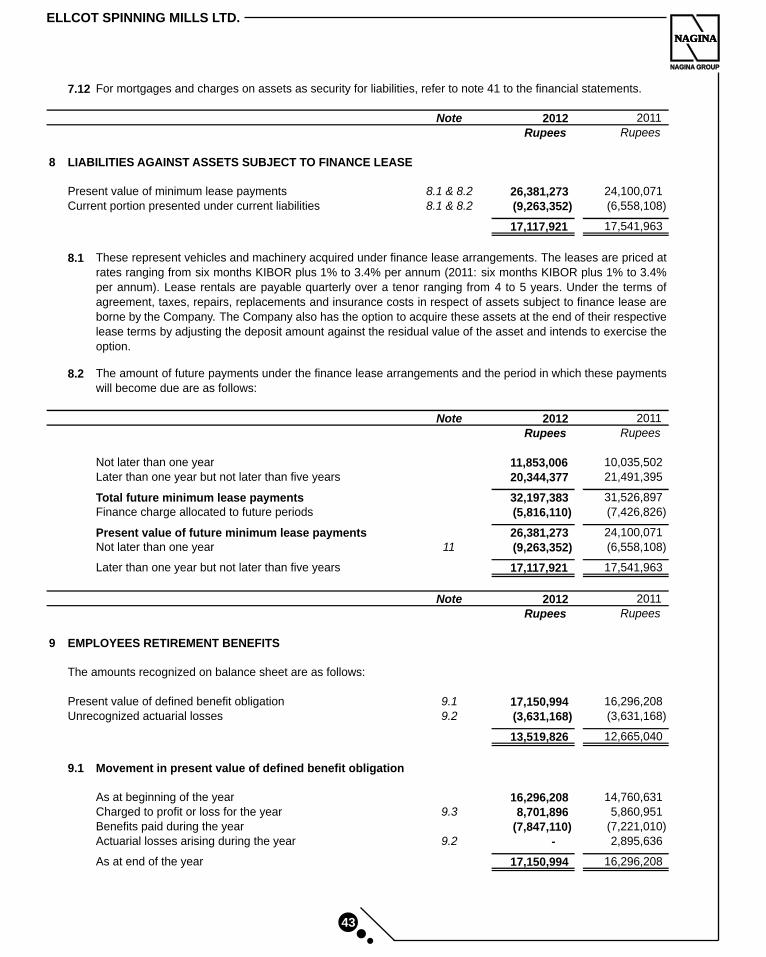
ELLCOT SPINNING MILLS LTD.
NAGINA
NAGINA GROUP
NAGINA
43
7.12 For mortgages and charges on assets as security for liabilities, refer to note 41 to the financial statements.
Note 2012 2011
Rupees Rupees
8 LIABILITIES AGAINST ASSETS SUBJECT TO FINANCE LEASE
Present value of minimum lease payments 8.1 & 8.2 26,381,273
24,100,071
Current portion presented under current liabilities 8.1 & 8.2 (9,263,352)
(6,558,108)
17,117,921
17,541,963
8.1
8.2
Note 2012 2011
Rupees Rupees
Not later than one year 11,853,006
10,035,502
Later than one year but not later than five years 20,344,377
21,491,395
Total future minimum lease payments 32,197,383
31,526,897
Finance charge allocated to future periods (5,816,110)
(7,426,826)
Present value of future minimum lease payments 26,381,273
24,100,071
Not later than one year 11 (9,263,352)
(6,558,108)
Later than one year but not later than five years 17,117,921
17,541,963
Note 2012 2011
Rupees Rupees
9 EMPLOYEES RETIREMENT BENEFITS
The amounts recognized on balance sheet are as follows:
Present value of defined benefit obligation 9.1 17,150,994
16,296,208 Unrecognized actuarial losses 9.2 (3,631,168)
(3,631,168)
13,519,826
12,665,040
9.1 Movement in present value of defined benefit obligation
As at beginning of the year 16,296,208
14,760,631
Charged to profit or loss for the year 9.3 8,701,896
5,860,951
Benefits paid during the year (7,847,110)
(7,221,010)
Actuarial losses arising during the year 9.2 -
2,895,636
As at end of the year 17,150,994 16,296,208
These represent vehicles and machinery acquired under finance lease arrangements. The leases are priced atrates ranging from six months KIBOR plus 1% to 3.4% per annum (2011: six months KIBOR plus 1% to 3.4%per annum). Lease rentals are payable quarterly over a tenor ranging from 4 to 5 years. Under the terms ofagreement, taxes, repairs, replacements and insurance costs in respect of assets subject to finance lease areborne by the Company. The Company also has the option to acquire these assets at the end of their respectivelease terms by adjusting the deposit amount against the residual value of the asset and intends to exercise theoption.
The amount of future payments under the finance lease arrangements and the period in which these paymentswill become due are as follows:
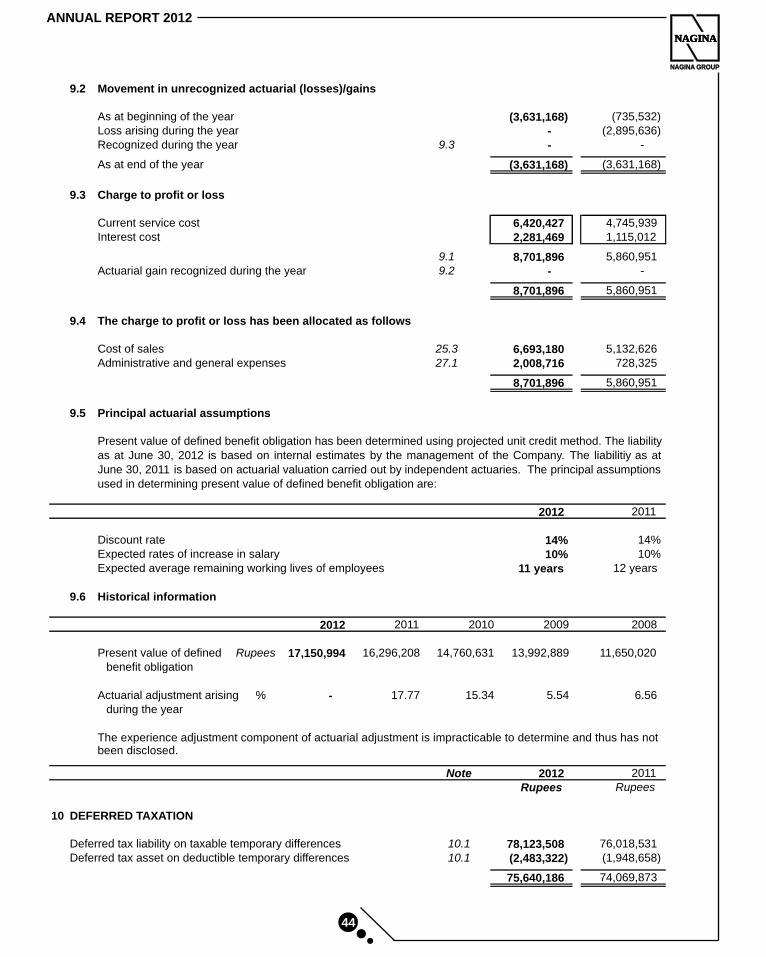
NAGINA
NAGINA GROUP
NAGINA
44
ANNUAL REPORT 2012
9.2 Movement in unrecognized actuarial (losses)/gains
As at beginning of the year (3,631,168) (735,532)Loss arising during the year - (2,895,636)Recognized during the year 9.3 - -
As at end of the year (3,631,168)
(3,631,168)
9.3 Charge to profit or loss
Current service cost 6,420,427
4,745,939
Interest cost 2,281,469
1,115,012
9.1 8,701,896
5,860,951
Actuarial gain recognized during the year 9.2 -
-
8,701,896
5,860,951
9.4 The charge to profit or loss has been allocated as follows
Cost of sales 25.3 6,693,180
5,132,626
Administrative and general expenses 27.1 2,008,716
728,325
8,701,896
5,860,951
9.5 Principal actuarial assumptions
2012 2011
Discount rate 14% 14%Expected rates of increase in salary 10% 10%Expected average remaining working lives of employees 11 years 12 years
9.6 Historical information
2012 2011 2010 2009 2008
Present value of defined Rupees 17,150,994
16,296,208
14,760,631
13,992,889
11,650,020
benefit obligation
Actuarial adjustment arising % - 17.77 15.34 5.54 6.56 during the year
The experience adjustment component of actuarial adjustment is impracticable to determine and thus has not been disclosed.
Note 2012 2011
Rupees Rupees
10 DEFERRED TAXATION
Deferred tax liability on taxable temporary differences 10.1 78,123,508 76,018,531Deferred tax asset on deductible temporary differences 10.1 (2,483,322) (1,948,658)
75,640,186 74,069,873
Present value of defined benefit obligation has been determined using projected unit credit method. The liability as at June 30, 2012 is based on internal estimates by the management of the Company. The liabilitiy as atJune 30, 2011 is based on actuarial valuation carried out by independent actuaries. The principal assumptionsused in determining present value of defined benefit obligation are:
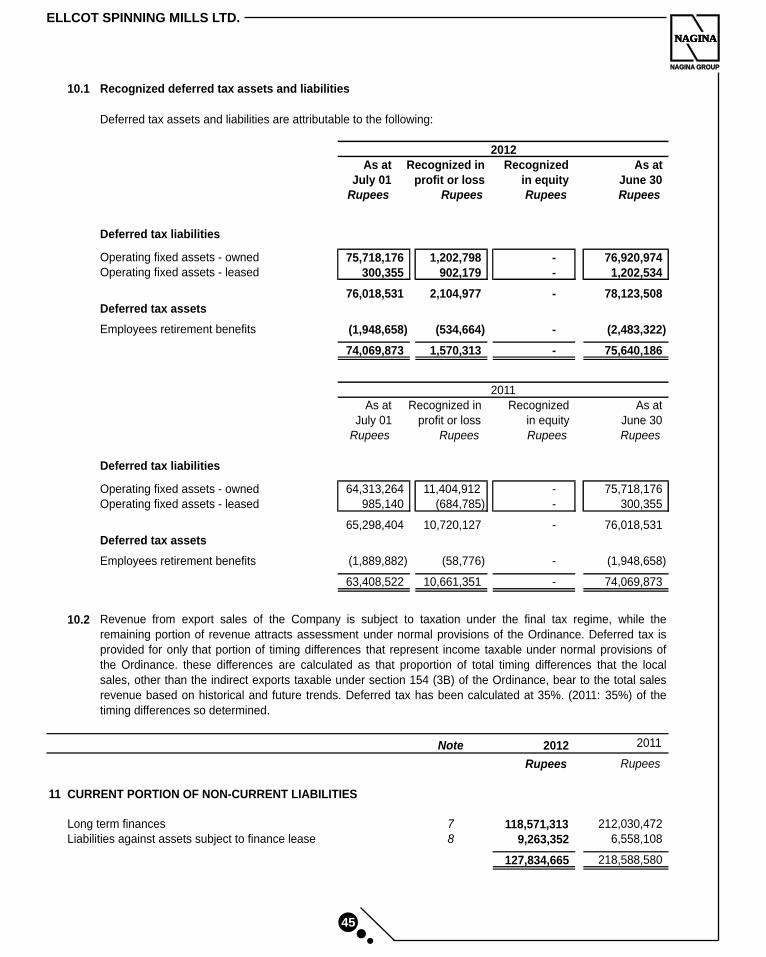
ELLCOT SPINNING MILLS LTD.
NAGINA
NAGINA GROUP
NAGINA
45
10.1 Recognized deferred tax assets and liabilities
Deferred tax assets and liabilities are attributable to the following:
As at Recognized in Recognized As atJuly 01 profit or loss in equity June 30
Rupees Rupees Rupees Rupees
Deferred tax liabilities
Operating fixed assets - owned 75,718,176 1,202,798
-
76,920,974
Operating fixed assets - leased 300,355 902,179
-
1,202,534
76,018,531
2,104,977
-
78,123,508
Deferred tax assets
Employees retirement benefits (1,948,658)
(534,664)
-
(2,483,322)
74,069,873
1,570,313
-
75,640,186
Recognized in Recognized As atprofit or loss in equity June 30
As atJuly 01
Rupees Rupees Rupees Rupees
Deferred tax liabilities
Operating fixed assets - owned 64,313,264
11,404,912
-
75,718,176
Operating fixed assets - leased 985,140
(684,785)
-
300,355
65,298,404
10,720,127
-
76,018,531
Deferred tax assets
Employees retirement benefits (1,889,882)
(58,776)
-
(1,948,658)
63,408,522
10,661,351
-
74,069,873
10.2
Note 2012 2011
Rupees Rupees
11 CURRENT PORTION OF NON-CURRENT LIABILITIES
Long term finances 7 118,571,313 212,030,472 Liabilities against assets subject to finance lease 8 9,263,352 6,558,108
127,834,665 218,588,580
2011
2012
Revenue from export sales of the Company is subject to taxation under the final tax regime, while theremaining portion of revenue attracts assessment under normal provisions of the Ordinance. Deferred tax isprovided for only that portion of timing differences that represent income taxable under normal provisions ofthe Ordinance. these differences are calculated as that proportion of total timing differences that the localsales, other than the indirect exports taxable under section 154 (3B) of the Ordinance, bear to the total salesrevenue based on historical and future trends. Deferred tax has been calculated at 35%. (2011: 35%) of thetiming differences so determined.

NAGINA
NAGINA GROUP
NAGINA
46
ANNUAL REPORT 2012
Note 2012 2011
Rupees Rupees
12 SHORT TERM BORROWINGS
These represent secured short term finances utilized under interest/mark-up arrangements from banking companies
Running finances 12.1 124,462,685
222,170
Term loans 12.1 127,340,955
557,271,871
251,803,640
557,494,041
12.1
12.2 For mortgages and charges on assets as security for liabilities, refer to note 41 to the financial statements.
Note 2012 2011
Rupees Rupees
13 TRADE AND OTHER PAYABLES
Trade creditors - Unsecured 21,450,550 28,360,393
Accrued liabilities 83,624,862 57,392,642
Advances from customers - Unsecured 10,195,090 30,336,790
Infrastructure tax 13.1 34,700,672 49,102,144 Workers' Profit Participation Fund 13.2 10,755,645 22,755,967 Workers' Welfare Fund 13.3 7,064,242 8,453,997 Unclaimed dividend 1,699,235 1,046,219 Other payables - Unsecured 4,119,233
3,374,445
173,609,529
200,822,597
13.1
Interest/mark-up on running finances is payable quarterly whereas interest/mark-up on terms loans is payablealong with principal on maturity, except where interest/mark-up is paid in advance at the time of disbursement.Local currency finances carry mark up at rates ranging from one to three months KIBOR plus 0.25% to 1.5%per annum (2011: one to three months KIBOR 1% to 1.5%).
The aggregate available short term funded facilities amounts to Rs. 2,632 million (2011: Rs. 2,715 million) outof which Rs. 2,380 million (2011: Rs. 2,158 million) remained unavailed as at the reporting date.
These facilities have been obtained from various banking companies for working capital requirements and aresecured by charge over all present and future current assets of the Company, lien over documents of title ofimported goods, lien over firm export orders, trust receipts, demand promissory notes, counter guarantees,specific indemnities and personal guarantees of the Company's Directors.
This represents tax levied by the Sindh Government on movement of imported goods entering the SindhProvince from outside Pakistan.
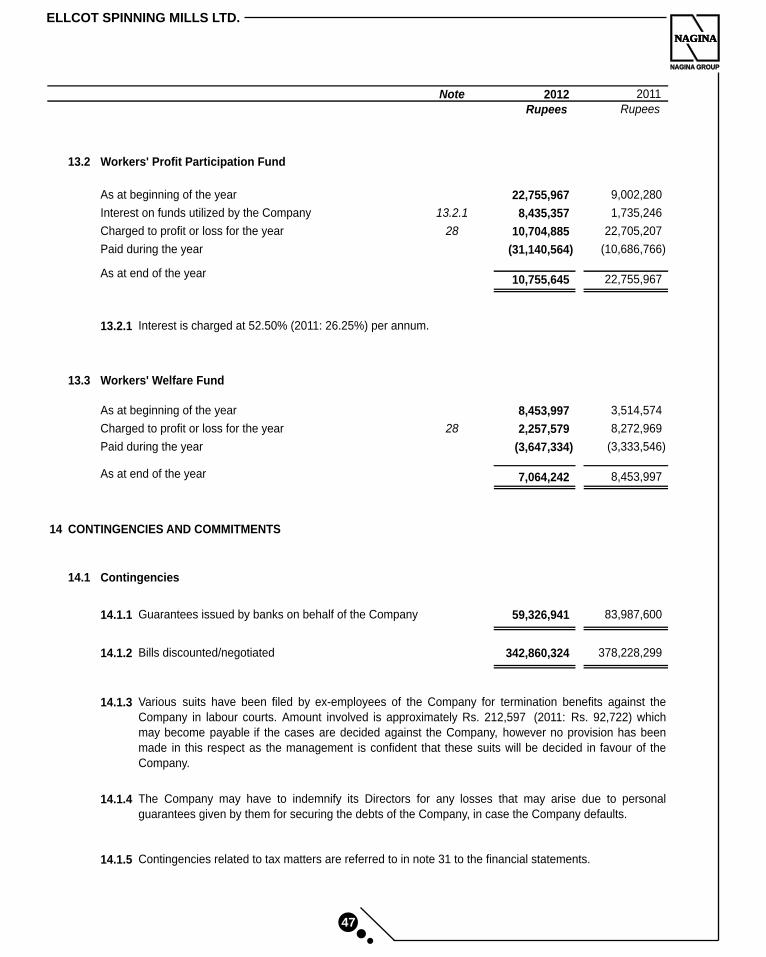
ELLCOT SPINNING MILLS LTD.
NAGINA
NAGINA GROUP
NAGINA
47
13.2 Workers' Profit Participation Fund
As at beginning of the year 22,755,967
9,002,280
Interest on funds utilized by the Company 13.2.1 8,435,357
1,735,246
Charged to profit or loss for the year 28 10,704,885 22,705,207
Paid during the year (31,140,564) (10,686,766)
As at end of the year10,755,645 22,755,967
13.2.1 Interest is charged at 52.50% (2011: 26.25%) per annum.
13.3 Workers' Welfare Fund
As at beginning of the year 8,453,997
3,514,574
Charged to profit or loss for the year 28 2,257,579
8,272,969
Paid during the year (3,647,334)
(3,333,546)
As at end of the year 7,064,242
8,453,997
14 CONTINGENCIES AND COMMITMENTS
14.1 Contingencies
14.1.1 Guarantees issued by banks on behalf of the Company 59,326,941
83,987,600
14.1.2 Bills discounted/negotiated 342,860,324
378,228,299
14.1.3
14.1.4
14.1.5 Contingencies related to tax matters are referred to in note 31 to the financial statements.
The Company may have to indemnify its Directors for any losses that may arise due to personalguarantees given by them for securing the debts of the Company, in case the Company defaults.
Various suits have been filed by ex-employees of the Company for termination benefits against theCompany in labour courts. Amount involved is approximately Rs. 212,597 (2011: Rs. 92,722) whichmay become payable if the cases are decided against the Company, however no provision has beenmade in this respect as the management is confident that these suits will be decided in favour of theCompany.
Note 2012 2011
Rupees Rupees

NAGINA
NAGINA GROUP
NAGINA
48
ANNUAL REPORT 2012
2012 2011
Rupees Rupees
14.2 Commitments
14.2.1 Commitments under irrevocable letters of credit for:
- purchase of stores, spare and loose tools 4,932,724
23,299,491
- purchase of machinery 7,702,500
55,927,169
- purchase of raw material 81,596,273
80,247,355
94,231,497
159,474,015
14.2.2 Commitments for capital expenditure -
12,221,454
14.2.3 Commitments under operating leases
Note 2012 2011
Rupees Rupees
- payments not later than one year 240,000
240,000
- payments later than one year -
-
240,000
240,000
15 PROPERTY, PLANT AND EQUIPMENT
Operating fixed assets 15.1 895,585,042 894,497,050
Capital work in progress 15.2 - 2,747,941
895,585,042 897,244,991
The Company has rented office premises from an associated undertaking under operating leasearrangements. Lease agreement covers a period of one year and is renewable/extendable on mutualconsent. Lease rentals are payable quarterly in advance. Commitments for payments in future periodsunder the lease agreement are as follows:

NAGINA
NAGINA GROUP
NAGINA
ELLCOT SPINNING MILLS LTD.
49
15.1
Oper
ating
fixed
asse
ts
Net b
ook v
alue
As at
As at
As at
As at
as at
July
01Ad
dition
sDi
spos
alsTr
ansfe
rsJu
ne 30
Rate
July
01Fo
r the
year
Adjus
tmen
tJu
ne 30
June
30
Rupe
esRu
pees
Rupe
esRu
pees
Rupe
es%
Rupe
esRu
pees
Rupe
esRu
pees
Rupe
es
Asse
ts ow
ned b
y the
Com
pany
Free
hold
land
6,093
,568
-
-
-
6,0
93,56
8
-
-
-
--
6,093
,568
Build
ings o
n free
hold
land
-
Mills
173,4
01,44
6
-
-
-
173,4
01,44
6
1097
,109,9
36
7,6
29,15
1-
104,7
39,08
768
,662,3
59
Othe
r facto
ry bu
ilding
s50
,571,5
23
-
-
18
,269,6
13
68
,841,1
36
5
21,54
4,894
2,060
,259
-23
,605,1
5345
,235,9
83
Non-f
actor
y buil
dings
6,773
,921
-
-
-
6,7
73,92
1
10
3,658
,461
31
1,546
-3,9
70,00
72,8
03,91
4
230,7
46,89
0
-
-
18,26
9,613
249,0
16,50
3
122,3
13,29
1
10
,000,9
56-
132,3
14,24
711
6,702
,256
Plant
and m
achin
ery1,3
73,49
7,862
574,2
21
(35,73
4,115
)
73
,407,4
09
1,4
11,74
5,377
1069
2,882
,239
70,87
9,955
(25,13
2,411
)73
8,629
,783
673,1
15,59
4
Electr
ic ins
tallat
ions a
nd eq
uipme
nt75
,906,4
72
-
-
1,8
68,54
5
77,77
5,017
1038
,235,9
12
3,7
82,62
7-
42,01
8,539
35,75
6,478
Facto
ry eq
uipme
nt6,5
82,76
3
-
-
-
6,582
,763
103,7
60,02
8
282,2
74-
4,042
,302
2,540
,461
Labo
ratory
equip
ment
11,16
6,359
-
-
-
11,16
6,359
105,1
10,85
7
605,5
50-
5,716
,407
5,449
,952
Fire f
ightin
g equ
ipmen
t1,8
46,66
5
-
-
-
1,846
,665
101,2
50,98
1
59,56
8-
1,310
,549
536,1
16
Offic
e equ
ipmen
t12
,283,0
41
23
3,200
-
-
12,51
6,241
108,1
29,76
6
424,5
65-
8,554
,331
3,961
,910
Furni
ture a
nd fix
tures
6,269
,547
46
8,215
-
-
6,737
,762
103,9
18,65
0
242,1
99-
4,160
,849
2,576
,913
Arms
and a
mmun
itions
763,0
13
-
-
-
76
3,013
10
488,4
94
27
,452
-51
5,946
247,0
67
Vehic
les23
,730,9
46
96
6,868
(2,
142,7
16)
1,811
,370
24
,366,4
68
20
11,77
8,873
2,595
,441
(538,7
78)
13,83
5,536
10,53
0,932
1,748
,887,1
26
2,2
42,50
4
(37
,876,8
31)
95,35
6,937
1,808
,609,7
36
88
7,869
,091
88,90
0,587
(25,67
1,189
)95
1,098
,489
857,5
11,24
7
Asse
ts su
bject
to fin
ance
leas
e
Plant
and m
achin
ery33
,343,6
07
10
,299,7
06
-
-
43
,643,3
13
10
6,873
,621
3,2
77,48
8-
10,15
1,109
33,49
2,204
Vehil
ces
9,646
,835
-
-
(1,
811,3
70)
7,8
35,46
5
20
2,637
,806
1,4
33,57
1(81
7,503
)3,2
53,87
44,5
81,59
1
1,791
,877,5
68
12
,542,2
10
(37,87
6,831
)
93
,545,5
67
1,8
60,08
8,514
897,3
80,51
8
93
,611,6
46(26
,488,6
92)
964,5
03,47
289
5,585
,042
2012
COST
/ REV
ALUE
D AM
OUNT
DEPR
ECIA
TION
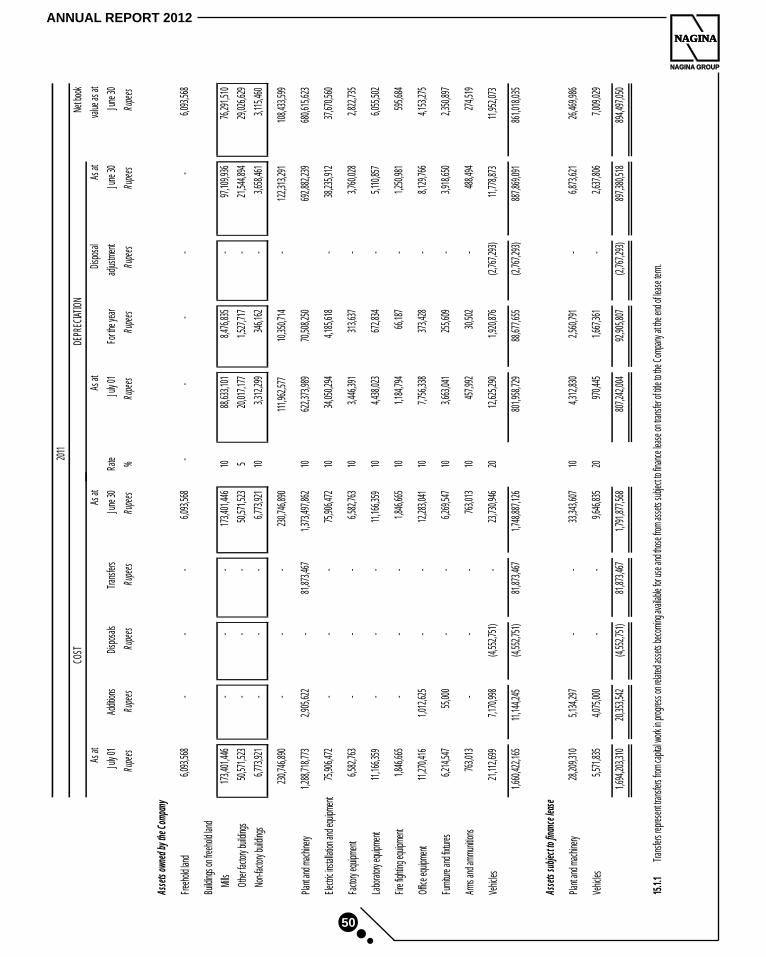
NAGINA
NAGINA GROUP
NAGINA
50
ANNUAL REPORT 2012
Net b
ook
As at
As at
As at
Disp
osal
As at
value
as at
July
01Ad
dition
sDi
spos
alsTr
ansfe
rsJu
ne 30
Rate
July
01Fo
r the
year
adjus
tmen
tJu
ne 30
June
30
Rupe
esRu
pees
Rupe
esRu
pees
Rupe
es%
Rupe
esRu
pees
Rupe
esRu
pees
Rupe
es
Asse
ts o
wned
by t
he C
ompa
ny
Free
hold
land
6,093
,568
-
-
-
6,0
93,56
8
-
-
-
--
6,093
,568
Build
ings o
n fre
ehold
land
Mills
173,4
01,44
6
-
-
-
17
3,401
,446
10
88,63
3,101
8,476
,835
-
97,10
9,936
76,29
1,510
Othe
r fac
tory b
uildin
gs50
,571,5
23
-
-
-
50,57
1,523
520
,017,1
77
1,5
27,71
7
-21
,544,8
9429
,026,6
29
Non-
factor
y buil
dings
6,773
,921
-
-
-
6,7
73,92
1
10
3,312
,299
34
6,162
-3,6
58,46
13,1
15,46
0
230,7
46,89
0
-
-
-
23
0,746
,890
11
1,962
,577
10,35
0,714
-
122,3
13,29
110
8,433
,599
Plan
t and
mac
hiner
y1,2
88,71
8,773
2,9
05,62
2
-
81
,873,4
67
1,3
73,49
7,862
1062
2,373
,989
70,50
8,250
69
2,882
,239
680,6
15,62
3
Elec
tric in
stalla
tion a
nd eq
uipme
nt75
,906,4
72
-
-
-
75,90
6,472
1034
,050,2
94
4,1
85,61
8
-38
,235,9
1237
,670,5
60
Facto
ry eq
uipme
nt6,5
82,76
3
-
-
-
6,582
,763
103,4
46,39
1
313,6
37
-
3,760
,028
2,822
,735
Labo
rator
y equ
ipmen
t11
,166,3
59
-
-
-
11,16
6,359
104,4
38,02
3
672,8
34
-
5,110
,857
6,055
,502
Fire f
ightin
g equ
ipmen
t1,8
46,66
5
-
-
-
1,846
,665
101,1
84,79
4
66,18
7
-1,2
50,98
159
5,684
Offic
e equ
ipmen
t11
,270,4
16
1,012
,625
-
-
12,28
3,041
107,7
56,33
8
373,4
28
-
8,129
,766
4,153
,275
Furn
iture
and f
ixtur
es6,2
14,54
7
55,00
0
-
-
6,269
,547
103,6
63,04
1
255,6
09
-
3,918
,650
2,350
,897
Arms
and a
mmun
itions
763,0
13
-
-
-
76
3,013
10
457,9
92
30
,502
-
488,4
9427
4,519
Vehic
les21
,112,6
99
7,170
,998
(4,55
2,751
)
-
23
,730,9
46
20
12,62
5,290
1,920
,876
(2
,767,2
93)
11,77
8,873
11,95
2,073
1,660
,422,1
65
11,14
4,245
(4,55
2,751
)
81,87
3,467
1,748
,887,1
26
801,9
58,72
9
88,67
7,655
(2,76
7,293
)88
7,869
,091
861,0
18,03
5
Asse
ts su
bjec
t to
finan
ce le
ase
Plan
t and
mac
hiner
y28
,209,3
10
5,134
,297
-
-
33,34
3,607
104,3
12,83
0
2,560
,791
-6,8
73,62
126
,469,9
86
Vehic
les5,5
71,83
5
4,075
,000
-
-
9,646
,835
2097
0,445
1,667
,361
-2,6
37,80
67,0
09,02
9
1,694
,203,3
10
20,35
3,542
(4,55
2,751
)
81,87
3,467
1,791
,877,5
68
807,2
42,00
4
92,90
5,807
(2,76
7,293
)89
7,380
,518
894,4
97,05
0
15.1.
1Tr
ansfe
rs re
pres
ent tr
ansfe
rs fro
m ca
pital
work
in pr
ogre
ss on
relat
ed as
sets
beco
ming
avail
able
for us
e and
thos
e fro
m as
sets
subje
ct to
finan
ce le
ase o
n tra
nsfer
of tit
le to
the C
ompa
ny at
the e
nd of
leas
e ter
m.
2011
COST
DEPR
ECIA
TION
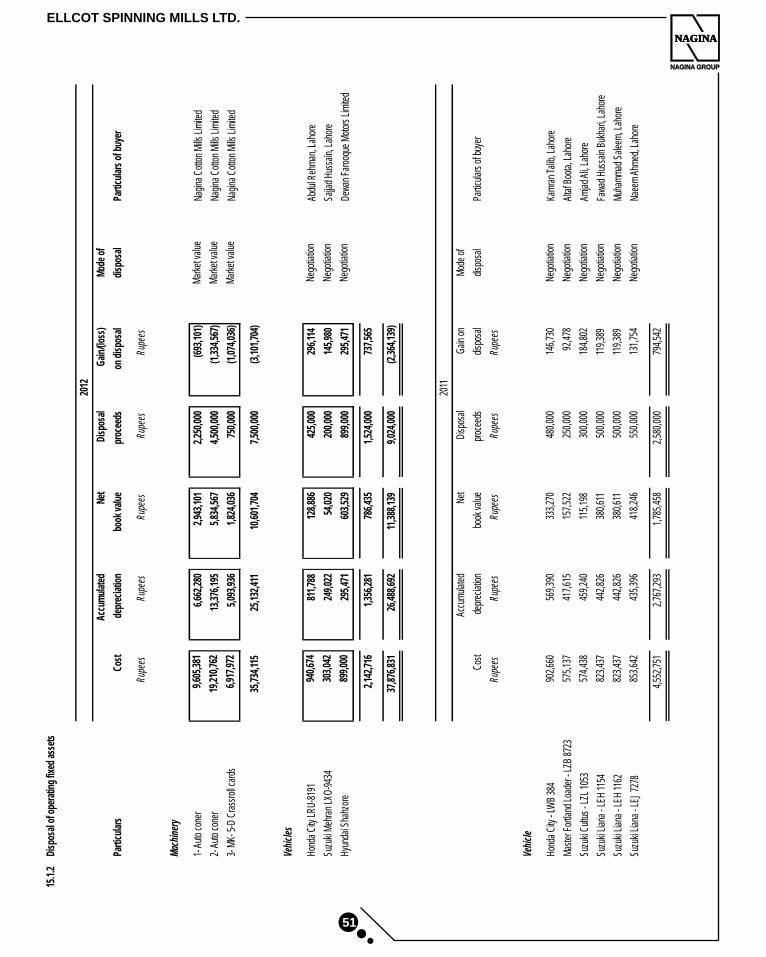
ELLCOT SPINNING MILLS LTD.
NAGINA
NAGINA GROUP
NAGINA
51
15.1
.2Di
spos
al o
f ope
ratin
g fix
ed a
sset
s
Accu
mul
ated
Net
Disp
osal
Gai
n/(lo
ss)
Mod
e of
Parti
cula
rsCo
stde
prec
iatio
nbo
ok v
alue
proc
eeds
on d
ispo
sal
disp
osal
Parti
cula
rs o
f buy
er
Rupe
esRu
pees
Rupe
esRu
pees
Rupe
es
Mac
hine
ry
1- A
uto
cone
r9,
605,
381
6,66
2,28
0
2,94
3,10
1
2,25
0,00
0
(693
,101
)
M
arke
t val
ueNa
gina
Cot
ton
Mills
Lim
ited
2- A
uto
cone
r19
,210
,762
13
,376
,195
5,
834,
567
4,
500,
000
(1
,334
,567
)
Mar
ket v
alue
Nagi
na C
otto
n M
ills L
imite
d
3- M
K- 5
-D C
rass
roll c
ards
6,91
7,97
2
5,
093,
936
1,
824,
036
75
0,00
0
(1
,074
,036
)
Mar
ket v
alue
Nagi
na C
otto
n M
ills L
imite
d
35,7
34,1
15
25,1
32,4
11
10,6
01,7
04
7,50
0,00
0
(3,1
01,7
04)
Vehi
cles
Hond
a Ci
ty L
RU-8
191
940,
674
81
1,78
8
12
8,88
6
42
5,00
0
29
6,11
4
Nego
tiatio
nAb
dul R
ehm
an, L
ahor
e
Suzu
ki M
ehra
n LX
O-9
434
303,
042
24
9,02
2
54
,020
20
0,00
0
14
5,98
0
Nego
tiatio
nSa
jjad
Huss
ain,
Lah
ore
Hyun
dai S
hahz
ore
899,
000
29
5,47
1
60
3,52
9
89
9,00
0
29
5,47
1
Nego
tiatio
nDe
wan
Faro
oque
Mot
ors
Lim
ited
2,14
2,71
6
1,
356,
281
78
6,43
5
1,
524,
000
73
7,56
5
37,8
76,8
31
26,4
88,6
92
11,3
88,1
39
9,02
4,00
0
(2,3
64,1
39)
Accu
mul
ated
Net
Disp
osal
Gai
n on
Mod
e of
Cost
depr
ecia
tion
book
val
uepr
ocee
dsdi
spos
aldi
spos
alPa
rticu
lars
of b
uyer
Rupe
esRu
pees
Rupe
esRu
pees
Rupe
es
Vehi
cle
Hond
a Ci
ty -
LWB
384
902,
660
56
9,39
0
33
3,27
0
48
0,00
0
14
6,73
0
Nego
tiatio
nKa
mra
n Ta
lib, L
ahor
e
Mas
ter F
ortla
nd L
oade
r - L
ZB 8
723
575,
137
41
7,61
5
15
7,52
2
25
0,00
0
92
,478
Ne
gotia
tion
Alta
f Boo
ta, L
ahor
e
Suzu
ki Cu
ltus
- LZL
105
357
4,43
8
459,
240
115,
198
300,
000
184,
802
Ne
gotia
tion
Amja
d Al
i, La
hore
Suzu
ki Li
ana
- LEH
115
482
3,43
7
442,
826
380,
611
500,
000
119,
389
Ne
gotia
tion
Fawa
d Hu
ssai
n Bu
khar
i, La
hore
Suzu
ki Li
ana
- LEH
116
282
3,43
7
442,
826
380,
611
500,
000
119,
389
Ne
gotia
tion
Muh
amm
ad S
alee
m, L
ahor
e
Suzu
ki Li
ana
- LEJ
727
885
3,64
2
435,
396
418,
246
550,
000
131,
754
Ne
gotia
tion
Naee
m A
hmed
, Lah
ore
4,55
2,75
1
2,
767,
293
1,
785,
458
2,
580,
000
79
4,54
2
2011
2012
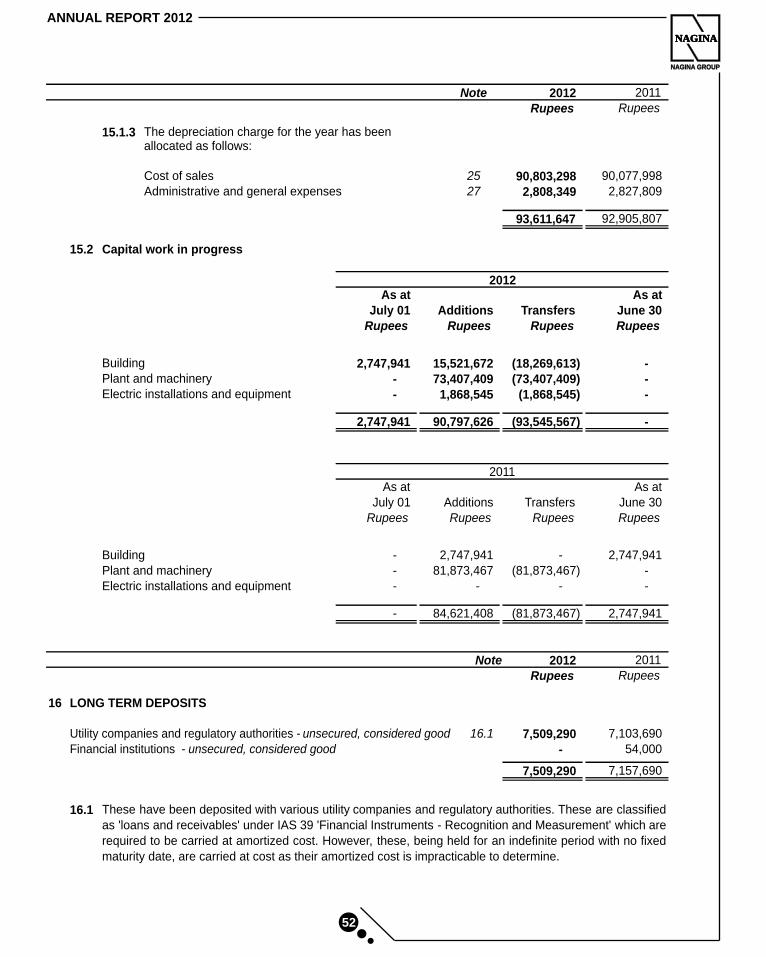
52
NAGINA
NAGINA GROUP
NAGINA
ANNUAL REPORT 2012
Note 2012 2011
Rupees Rupees
15.1.3 The depreciation charge for the year has been allocated as follows:
Cost of sales 25 90,803,298
90,077,998
Administrative and general expenses 27 2,808,349
2,827,809
93,611,647
92,905,807
15.2 Capital work in progress
As at As atJuly 01 Additions Transfers June 30
Rupees Rupees Rupees Rupees
Building 2,747,941
15,521,672
(18,269,613)
-
Plant and machinery -
73,407,409
(73,407,409)
-
Electric installations and equipment - 1,868,545 (1,868,545) -
2,747,941 90,797,626 (93,545,567) -
As at As atJuly 01 Additions Transfers June 30
Rupees Rupees Rupees Rupees
Building -
2,747,941
-
2,747,941
Plant and machinery -
81,873,467
(81,873,467)
- Electric installations and equipment -
-
-
-
-
84,621,408
(81,873,467)
2,747,941
Note 2012 2011
Rupees Rupees
16 LONG TERM DEPOSITS
Utility companies and regulatory authorities - unsecured, considered good 16.1 7,509,290
7,103,690
Financial institutions - unsecured, considered good -
54,000
7,509,290
7,157,690
16.1
2012
2011
These have been deposited with various utility companies and regulatory authorities. These are classifiedas 'loans and receivables' under IAS 39 'Financial Instruments - Recognition and Measurement' which arerequired to be carried at amortized cost. However, these, being held for an indefinite period with no fixedmaturity date, are carried at cost as their amortized cost is impracticable to determine.
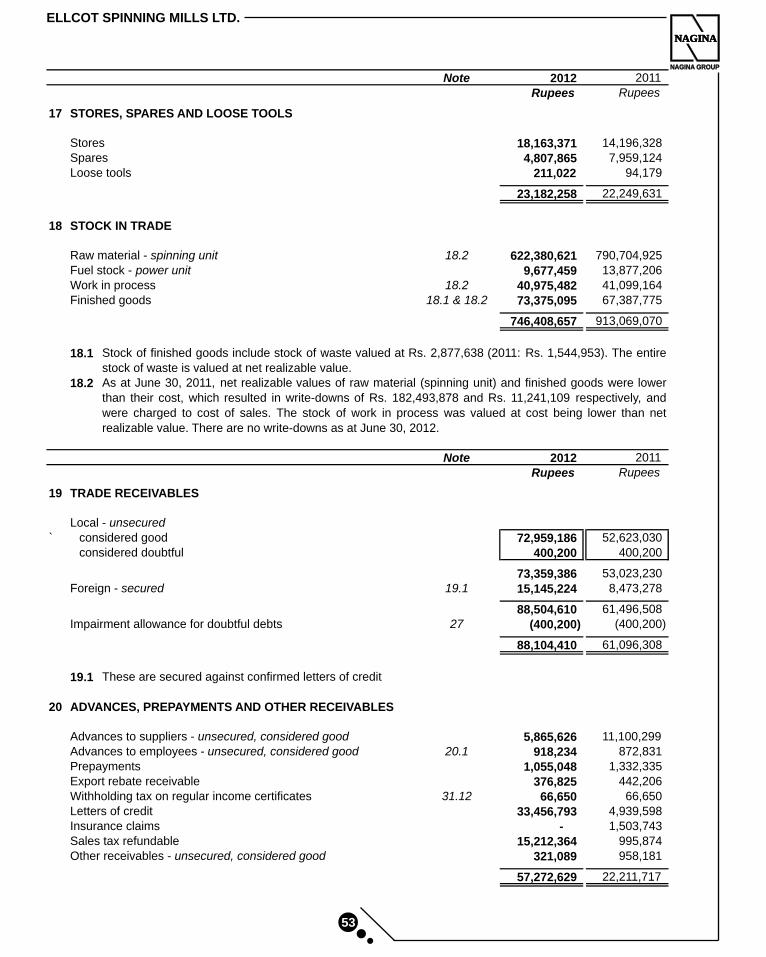
ELLCOT SPINNING MILLS LTD.
NAGINA
NAGINA GROUP
NAGINA
53
Note 2012 2011
Rupees Rupees
17 STORES, SPARES AND LOOSE TOOLS
Stores 18,163,371
14,196,328
Spares 4,807,865
7,959,124
Loose tools 211,022
94,179
23,182,258
22,249,631
18 STOCK IN TRADE
Raw material - spinning unit 18.2 622,380,621
790,704,925
Fuel stock - power unit 9,677,459
13,877,206
Work in process 18.2 40,975,482
41,099,164
Finished goods 18.1 & 18.2 73,375,095
67,387,775
746,408,657
913,069,070
18.1
18.2
Note 2012 2011
Rupees Rupees
19 TRADE RECEIVABLES
Local - unsecured` considered good 72,959,186
52,623,030
considered doubtful 400,200
400,200
73,359,386
53,023,230
Foreign - secured 19.1 15,145,224
8,473,278
88,504,610
61,496,508
Impairment allowance for doubtful debts 27 (400,200)
(400,200)
88,104,410
61,096,308
19.1 These are secured against confirmed letters of credit
20 ADVANCES, PREPAYMENTS AND OTHER RECEIVABLES
Advances to suppliers - unsecured, considered good 5,865,626
11,100,299
Advances to employees - unsecured, considered good 20.1 918,234
872,831
Prepayments 1,055,048
1,332,335
Export rebate receivable 376,825
442,206
Withholding tax on regular income certificates 31.12 66,650
66,650
Letters of credit 33,456,793
4,939,598
Insurance claims -
1,503,743
Sales tax refundable 15,212,364 995,874Other receivables - unsecured, considered good 321,089 958,181
57,272,629 22,211,717
As at June 30, 2011, net realizable values of raw material (spinning unit) and finished goods were lowerthan their cost, which resulted in write-downs of Rs. 182,493,878 and Rs. 11,241,109 respectively, andwere charged to cost of sales. The stock of work in process was valued at cost being lower than netrealizable value. There are no write-downs as at June 30, 2012.
Stock of finished goods include stock of waste valued at Rs. 2,877,638 (2011: Rs. 1,544,953). The entirestock of waste is valued at net realizable value.
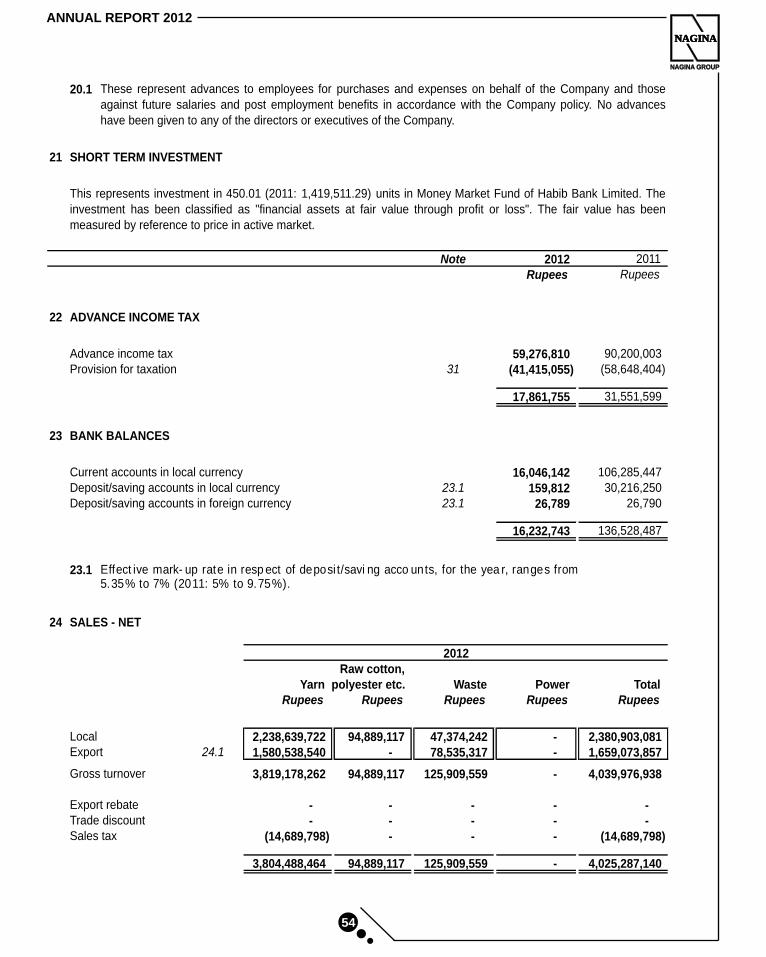
NAGINA
NAGINA GROUP
NAGINA
54
ANNUAL REPORT 2012
20.1
21 SHORT TERM INVESTMENT
Note 2012 2011
Rupees Rupees
22 ADVANCE INCOME TAX
Advance income tax 59,276,810
90,200,003
Provision for taxation 31 (41,415,055)
(58,648,404)
17,861,755
31,551,599
23 BANK BALANCES
Current accounts in local currency 16,046,142
106,285,447
Deposit/saving accounts in local currency 23.1 159,812
30,216,250
Deposit/saving accounts in foreign currency 23.1 26,789
26,790
16,232,743
136,528,487
23.1 Effect ive mark- up rate in resp ect of deposi t/savi ng acco unts, for the yea r, ranges from 5.35% to 7% (2011: 5% to 9.75%).
24 SALES - NET
Raw cotton,Yarn polyester etc. Waste Power Total
Rupees Rupees Rupees Rupees Rupees
Local 2,238,639,722
94,889,117
47,374,242
-
2,380,903,081
Export 24.1 1,580,538,540
-
78,535,317
-
1,659,073,857
Gross turnover 3,819,178,262
94,889,117
125,909,559
-
4,039,976,938
Export rebate -
-
-
-
-
Trade discount - - - - -Sales tax (14,689,798) - - - (14,689,798)
3,804,488,464 94,889,117 125,909,559 - 4,025,287,140
These represent advances to employees for purchases and expenses on behalf of the Company and thoseagainst future salaries and post employment benefits in accordance with the Company policy. No advanceshave been given to any of the directors or executives of the Company.
This represents investment in 450.01 (2011: 1,419,511.29) units in Money Market Fund of Habib Bank Limited. Theinvestment has been classified as "financial assets at fair value through profit or loss". The fair value has beenmeasured by reference to price in active market.
2012
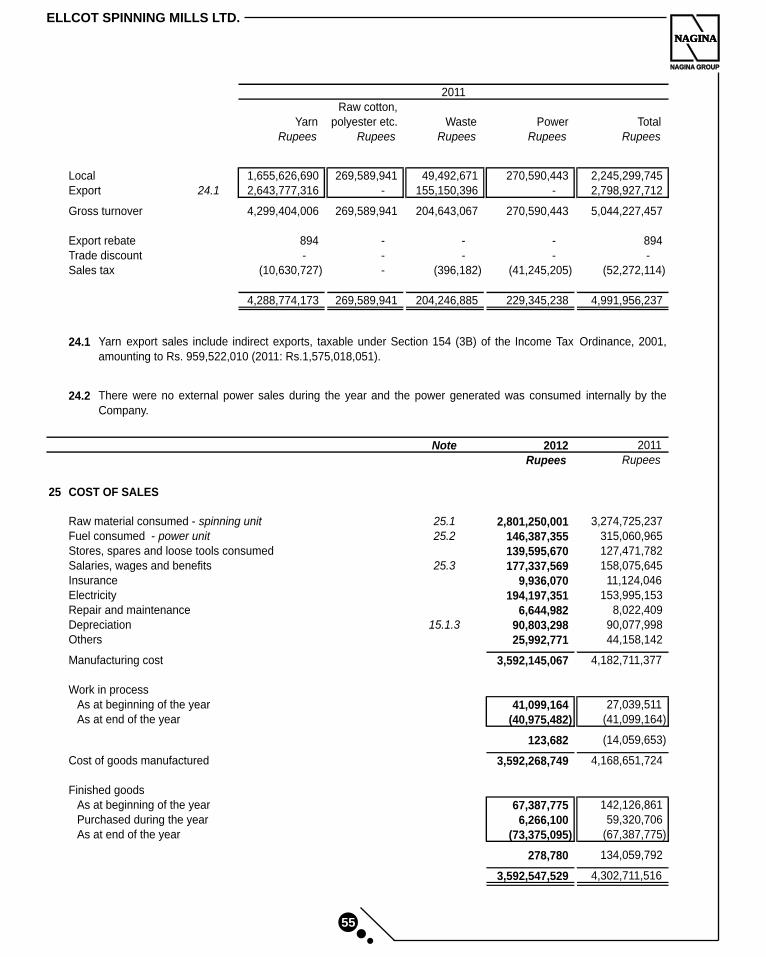
ELLCOT SPINNING MILLS LTD.
NAGINA
NAGINA GROUP
NAGINA
55
Raw cotton,Yarn polyester etc. Waste Power Total
Rupees Rupees Rupees Rupees Rupees
Local 1,655,626,690
269,589,941
49,492,671
270,590,443
2,245,299,745
Export 24.1 2,643,777,316
-
155,150,396
-
2,798,927,712
Gross turnover 4,299,404,006
269,589,941
204,643,067
270,590,443
5,044,227,457
Export rebate 894
-
-
-
894
Trade discount -
-
-
-
-
Sales tax (10,630,727)
-
(396,182)
(41,245,205)
(52,272,114)
4,288,774,173
269,589,941
204,246,885
229,345,238
4,991,956,237
24.1
24.2
Note 2012 2011
Rupees Rupees
25 COST OF SALES
Raw material consumed - spinning unit 25.1 2,801,250,001
3,274,725,237
Fuel consumed - power unit 25.2 146,387,355
315,060,965
Stores, spares and loose tools consumed 139,595,670
127,471,782
Salaries, wages and benefits 25.3 177,337,569
158,075,645
Insurance 9,936,070
11,124,046
Electricity 194,197,351
153,995,153
Repair and maintenance 6,644,982
8,022,409
Depreciation 15.1.3 90,803,298 90,077,998
Others 25,992,771 44,158,142
Manufacturing cost 3,592,145,067 4,182,711,377
Work in processAs at beginning of the year 41,099,164 27,039,511 As at end of the year (40,975,482) (41,099,164)
123,682
(14,059,653)
Cost of goods manufactured 3,592,268,749
4,168,651,724
Finished goodsAs at beginning of the year 67,387,775
142,126,861
Purchased during the year 6,266,100
59,320,706
As at end of the year (73,375,095) (67,387,775)
278,780 134,059,792
3,592,547,529 4,302,711,516
There were no external power sales during the year and the power generated was consumed internally by theCompany.
2011
Yarn export sales include indirect exports, taxable under Section 154 (3B) of the Income Tax Ordinance, 2001,amounting to Rs. 959,522,010 (2011: Rs.1,575,018,051).
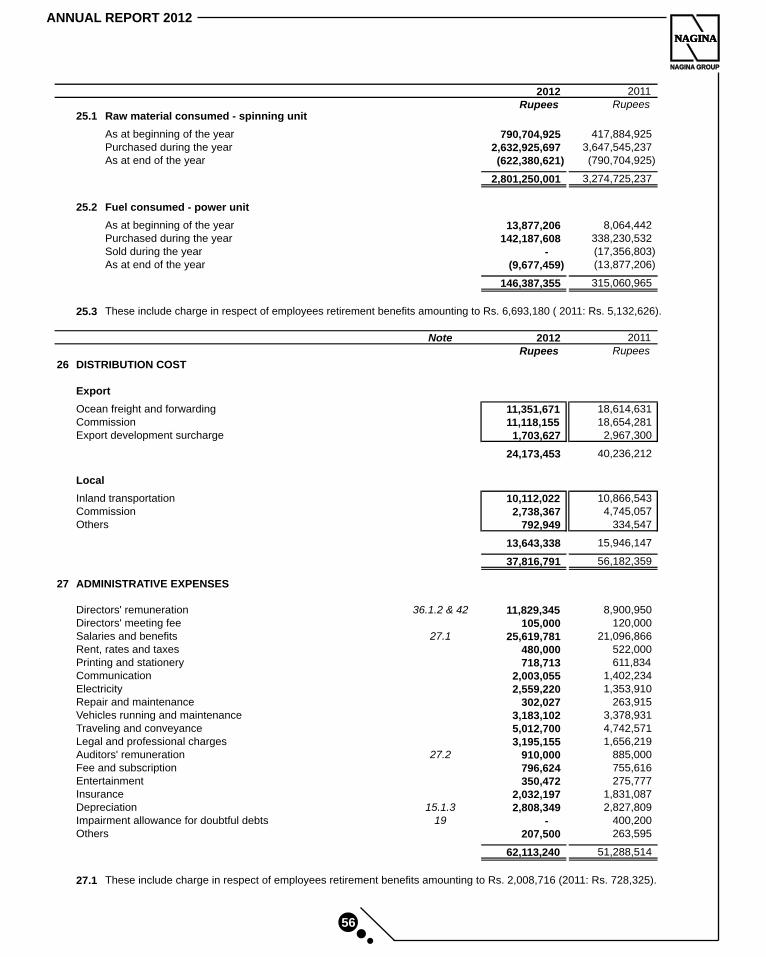
NAGINA
NAGINA GROUP
NAGINA
56
ANNUAL REPORT 2012
25.1 Raw material consumed - spinning unit
As at beginning of the year 790,704,925 417,884,925Purchased during the year 2,632,925,697 3,647,545,237As at end of the year (622,380,621) (790,704,925)
2,801,250,001 3,274,725,237
25.2 Fuel consumed - power unit
As at beginning of the year 13,877,206
8,064,442
Purchased during the year 142,187,608
338,230,532
Sold during the year -
(17,356,803)
As at end of the year (9,677,459) (13,877,206)
146,387,355
315,060,965
25.3 These include charge in respect of employees retirement benefits amounting to Rs. 6,693,180 ( 2011: Rs. 5,132,626).
26 DISTRIBUTION COST
Export
Ocean freight and forwarding 11,351,671
18,614,631
Commission 11,118,155
18,654,281
Export development surcharge 1,703,627
2,967,300
24,173,453
40,236,212
Local
Inland transportation 10,112,022
10,866,543
Commission 2,738,367
4,745,057
Others 792,949 334,547
13,643,338 15,946,147
37,816,791 56,182,359
27 ADMINISTRATIVE EXPENSES
Directors' remuneration 36.1.2 & 42 11,829,345
8,900,950
Directors' meeting fee 105,000
120,000
Salaries and benefits 27.1 25,619,781
21,096,866
Rent, rates and taxes 480,000
522,000
Printing and stationery 718,713
611,834
Communication 2,003,055
1,402,234
Electricity 2,559,220
1,353,910
Repair and maintenance 302,027
263,915
Vehicles running and maintenance 3,183,102
3,378,931
Traveling and conveyance 5,012,700
4,742,571
Legal and professional charges 3,195,155
1,656,219
Auditors' remuneration 27.2 910,000
885,000
Fee and subscription 796,624
755,616
Entertainment 350,472
275,777
Insurance 2,032,197 1,831,087Depreciation 15.1.3 2,808,349 2,827,809Impairment allowance for doubtful debts 19 - 400,200Others 207,500 263,595
62,113,240 51,288,514
27.1 These include charge in respect of employees retirement benefits amounting to Rs. 2,008,716 (2011: Rs. 728,325).
Note 2012 2011
Rupees Rupees
2012 2011
Rupees Rupees

ELLCOT SPINNING MILLS LTD.
NAGINA
NAGINA GROUP
NAGINA
57
Note 2012 2011
Rupees Rupees27.2 Auditor's remuneration
Annual statutory audit 750,000 750,000Half yearly review 100,000 75,000Review report under Code of Corporate Governance 50,000
50,000
Out of pocket expenses 10,000
10,000
910,000
885,000
28 OTHER OPERATING EXPENSES
Loss on financial instruments
Foreign exchange loss 46,119
-
Other expenses
Loss on disposal of property, plant and equipment 15.1.2 2,364,138
-
Workers' Profit Participation Fund 13.2 10,704,885
22,705,207
Workers' Welfare Fund 13.3 2,257,579
8,272,969
Donations 28.1 1,100,000
1,204,559
16,426,602
32,182,735
16,472,721
32,182,735
28.1 None of the directors or their spouses had any interest in donations made by the Company.
29 OTHER OPERATING INCOME
Gain on financial instruments
Gain on disposal of short term investments 10,171,782
5,480,903
Changes in fair value of financial assets at fair value through profit or loss 45,160
238,336
Return on bank deposits 1,052,069
270,520
Foreign exchange gain -
582,908
11,269,011
6,572,667
Other income
Gain on disposal of property, plant and equipment - 794,542 Scrap sale 1,547,909 2,886,063
1,547,909 3,680,605
12,816,920 10,253,272
30 FINANCE COST
Interest / mark-up on borrowings:long term finances 30.1 47,573,237
67,147,351
liabilities against assets subject to finance lease 30.2 4,377,741
3,286,575
short term borrowings 61,218,924
54,460,341
113,169,902
124,894,267
Interest on workers' profit participation fund 8,435,357
1,735,246
Foreign exchange loss 1,853,877
4,025,503
Bank charges and commission 5,684,400
7,267,969
129,143,536 137,922,985
30.1
30.2 This includes interest/mark-up rate subsidy amouting to Rs. 92,000 (2011: Rs. 111,126) recognized asgovernment grants. See note 33.
This includes interest/mark-up rate subsidy amouting to Rs. 1,740,099 (2011: Rs. 2,594,925) recognized asgovernment grants. See note 33.
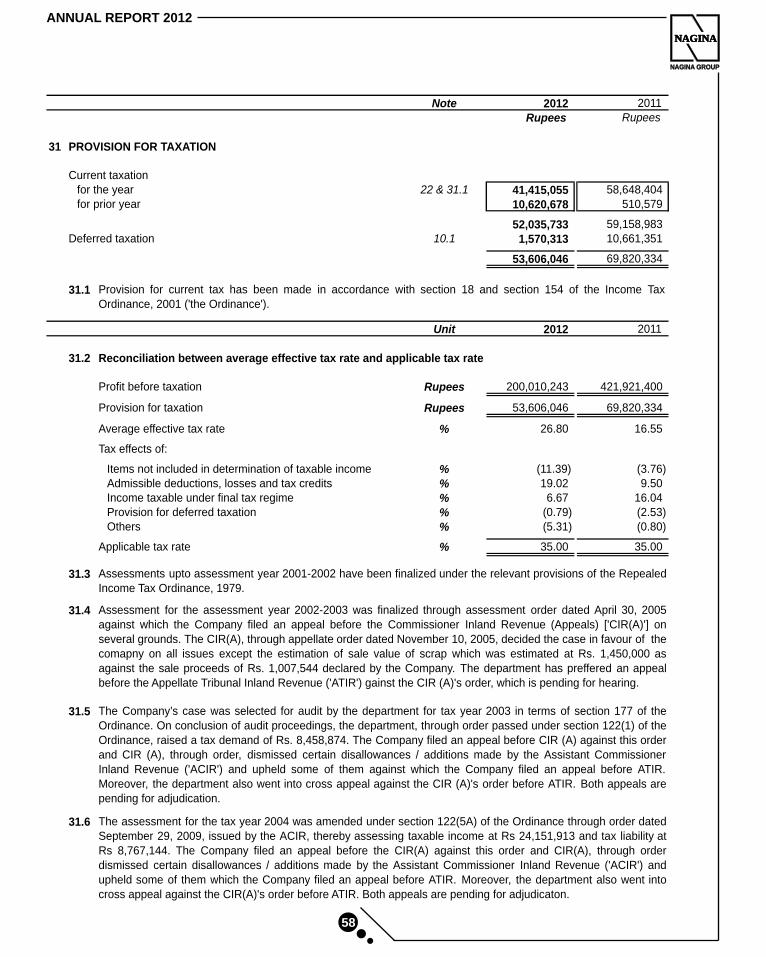
NAGINA
NAGINA GROUP
NAGINA
58
ANNUAL REPORT 2012
Note 2012 2011
Rupees Rupees
31 PROVISION FOR TAXATION
Current taxationfor the year 22 & 31.1 41,415,055
58,648,404
for prior year 10,620,678
510,579
52,035,733
59,158,983
Deferred taxation 10.1 1,570,313
10,661,351
53,606,046
69,820,334
31.1
Unit 2012 2011
31.2 Reconciliation between average effective tax rate and applicable tax rate
Profit before taxation Rupees 200,010,243
421,921,400
Provision for taxation Rupees 53,606,046
69,820,334
Average effective tax rate % 26.80
16.55
Tax effects of:
Items not included in determination of taxable income % (11.39)
(3.76)
Admissible deductions, losses and tax credits % 19.02 9.50
Income taxable under final tax regime % 6.67 16.04 Provision for deferred taxation % (0.79) (2.53) Others % (5.31) (0.80)
Applicable tax rate % 35.00
35.00
31.3
31.4
31.5
31.6
Assessment for the assessment year 2002-2003 was finalized through assessment order dated April 30, 2005against which the Company filed an appeal before the Commissioner Inland Revenue (Appeals) ['CIR(A)'] onseveral grounds. The CIR(A), through appellate order dated November 10, 2005, decided the case in favour of thecomapny on all issues except the estimation of sale value of scrap which was estimated at Rs. 1,450,000 asagainst the sale proceeds of Rs. 1,007,544 declared by the Company. The department has preffered an appealbefore the Appellate Tribunal Inland Revenue ('ATIR') gainst the CIR (A)'s order, which is pending for hearing.
Assessments upto assessment year 2001-2002 have been finalized under the relevant provisions of the RepealedIncome Tax Ordinance, 1979.
The Company’s case was selected for audit by the department for tax year 2003 in terms of section 177 of theOrdinance. On conclusion of audit proceedings, the department, through order passed under section 122(1) of theOrdinance, raised a tax demand of Rs. 8,458,874. The Company filed an appeal before CIR (A) against this orderand CIR (A), through order, dismissed certain disallowances / additions made by the Assistant CommissionerInland Revenue ('ACIR') and upheld some of them against which the Company filed an appeal before ATIR.Moreover, the department also went into cross appeal against the CIR (A)'s order before ATIR. Both appeals arepending for adjudication.
The assessment for the tax year 2004 was amended under section 122(5A) of the Ordinance through order datedSeptember 29, 2009, issued by the ACIR, thereby assessing taxable income at Rs 24,151,913 and tax liability atRs 8,767,144. The Company filed an appeal before the CIR(A) against this order and CIR(A), through orderdismissed certain disallowances / additions made by the Assistant Commissioner Inland Revenue ('ACIR') andupheld some of them which the Company filed an appeal before ATIR. Moreover, the department also went intocross appeal against the CIR(A)'s order before ATIR. Both appeals are pending for adjudicaton.
Provision for current tax has been made in accordance with section 18 and section 154 of the Income TaxOrdinance, 2001 ('the Ordinance').
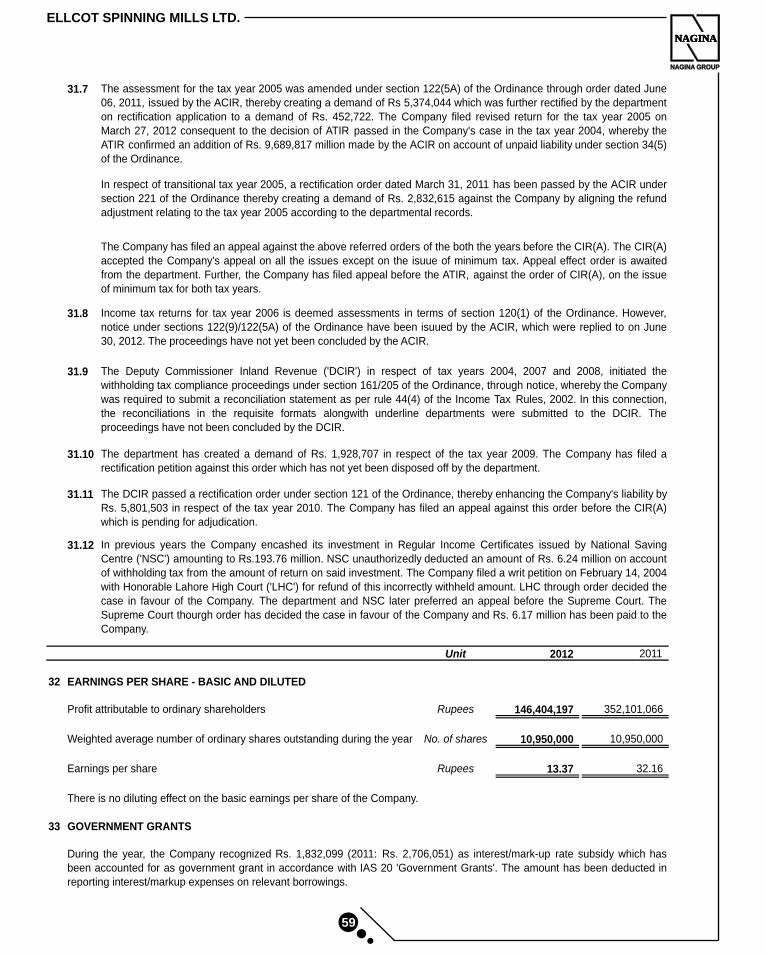
ELLCOT SPINNING MILLS LTD.
NAGINA
NAGINA GROUP
NAGINA
59
31.7
31.8
31.9
31.10
31.11
31.12
Unit 2012 2011
32 EARNINGS PER SHARE - BASIC AND DILUTED
Profit attributable to ordinary shareholders Rupees 146,404,197
352,101,066
Weighted average number of ordinary shares outstanding during the year No. of shares 10,950,000
10,950,000
Earnings per share Rupees 13.37
32.16
There is no diluting effect on the basic earnings per share of the Company.
33 GOVERNMENT GRANTS
The assessment for the tax year 2005 was amended under section 122(5A) of the Ordinance through order dated June06, 2011, issued by the ACIR, thereby creating a demand of Rs 5,374,044 which was further rectified by the departmenton rectification application to a demand of Rs. 452,722. The Company filed revised return for the tax year 2005 onMarch 27, 2012 consequent to the decision of ATIR passed in the Company's case in the tax year 2004, whereby theATIR confirmed an addition of Rs. 9,689,817 million made by the ACIR on account of unpaid liability under section 34(5)of the Ordinance.
In respect of transitional tax year 2005, a rectification order dated March 31, 2011 has been passed by the ACIR undersection 221 of the Ordinance thereby creating a demand of Rs. 2,832,615 against the Company by aligning the refundadjustment relating to the tax year 2005 according to the departmental records.
Income tax returns for tax year 2006 is deemed assessments in terms of section 120(1) of the Ordinance. However,notice under sections 122(9)/122(5A) of the Ordinance have been isuued by the ACIR, which were replied to on June30, 2012. The proceedings have not yet been concluded by the ACIR.
The Deputy Commissioner Inland Revenue ('DCIR') in respect of tax years 2004, 2007 and 2008, initiated thewithholding tax compliance proceedings under section 161/205 of the Ordinance, through notice, whereby the Companywas required to submit a reconciliation statement as per rule 44(4) of the Income Tax Rules, 2002. In this connection,the reconciliations in the requisite formats alongwith underline departments were submitted to the DCIR. Theproceedings have not been concluded by the DCIR.
The Company has filed an appeal against the above referred orders of the both the years before the CIR(A). The CIR(A)accepted the Company's appeal on all the issues except on the isuue of minimum tax. Appeal effect order is awaitedfrom the department. Further, the Company has filed appeal before the ATIR, against the order of CIR(A), on the issueof minimum tax for both tax years.
In previous years the Company encashed its investment in Regular Income Certificates issued by National SavingCentre ('NSC') amounting to Rs.193.76 million. NSC unauthorizedly deducted an amount of Rs. 6.24 million on accountof withholding tax from the amount of return on said investment. The Company filed a writ petition on February 14, 2004with Honorable Lahore High Court ('LHC') for refund of this incorrectly withheld amount. LHC through order decided thecase in favour of the Company. The department and NSC later preferred an appeal before the Supreme Court. TheSupreme Court thourgh order has decided the case in favour of the Company and Rs. 6.17 million has been paid to theCompany.
During the year, the Company recognized Rs. 1,832,099 (2011: Rs. 2,706,051) as interest/mark-up rate subsidy which hasbeen accounted for as government grant in accordance with IAS 20 'Government Grants'. The amount has been deducted inreporting interest/markup expenses on relevant borrowings.
The department has created a demand of Rs. 1,928,707 in respect of the tax year 2009. The Company has filed arectification petition against this order which has not yet been disposed off by the department.
The DCIR passed a rectification order under section 121 of the Ordinance, thereby enhancing the Company's liability byRs. 5,801,503 in respect of the tax year 2010. The Company has filed an appeal against this order before the CIR(A)which is pending for adjudication.
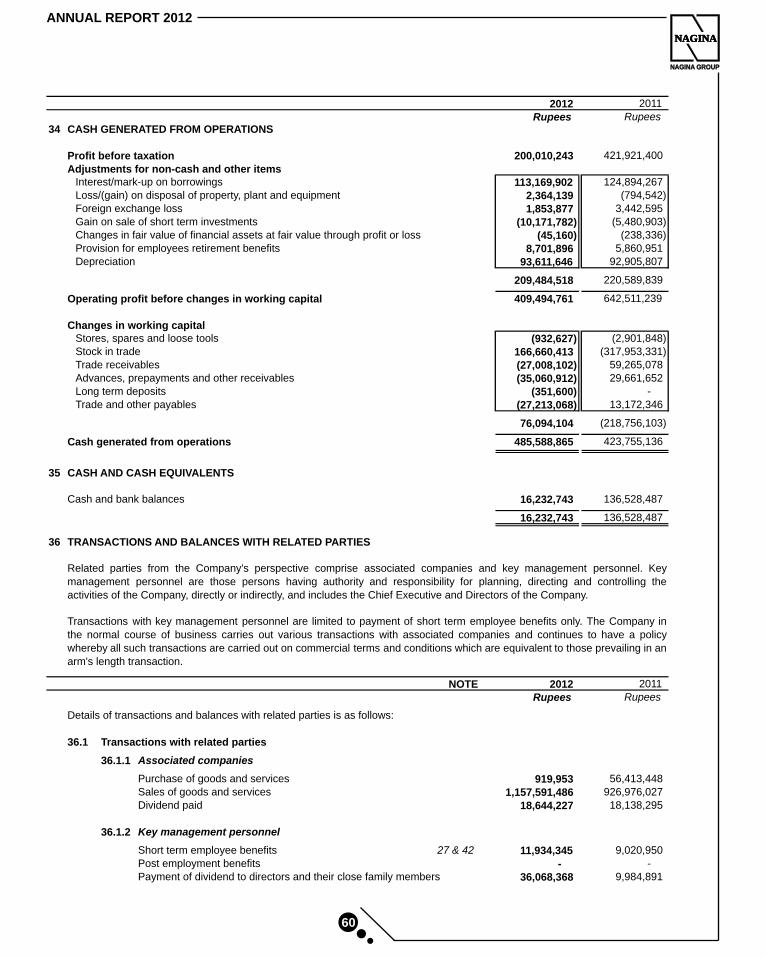
NAGINA
NAGINA GROUP
NAGINA
60
ANNUAL REPORT 2012
34 CASH GENERATED FROM OPERATIONS
Profit before taxation 200,010,243 421,921,400
Adjustments for non-cash and other itemsInterest/mark-up on borrowings 113,169,902
124,894,267Loss/(gain) on disposal of property, plant and equipment 2,364,139
(794,542)
Foreign exchange loss 1,853,877
3,442,595
Gain on sale of short term investments (10,171,782)
(5,480,903)
Changes in fair value of financial assets at fair value through profit or loss (45,160)
(238,336)
Provision for employees retirement benefits 8,701,896
5,860,951
Depreciation 93,611,646
92,905,807
209,484,518
220,589,839
Operating profit before changes in working capital 409,494,761
642,511,239
Changes in working capitalStores, spares and loose tools (932,627)
(2,901,848)
Stock in trade 166,660,413
(317,953,331)
Trade receivables (27,008,102)
59,265,078
Advances, prepayments and other receivables (35,060,912)
29,661,652
Long term deposits (351,600)
-
Trade and other payables (27,213,068)
13,172,346
76,094,104
(218,756,103)
Cash generated from operations 485,588,865
423,755,136
35 CASH AND CASH EQUIVALENTS
Cash and bank balances 16,232,743 136,528,487
16,232,743
136,528,487
36 TRANSACTIONS AND BALANCES WITH RELATED PARTIES
2012 2011
Rupees Rupees
Details of transactions and balances with related parties is as follows:
36.1 Transactions with related parties
36.1.1 Associated companies
Purchase of goods and services 919,953
56,413,448
Sales of goods and services 1,157,591,486
926,976,027
Dividend paid 18,644,227 18,138,295
36.1.2 Key management personnel
Short term employee benefits 27 & 42 11,934,345 9,020,950Post employment benefits - -Payment of dividend to directors and their close family members 36,068,368 9,984,891
Related parties from the Company's perspective comprise associated companies and key management personnel. Keymanagement personnel are those persons having authority and responsibility for planning, directing and controlling theactivities of the Company, directly or indirectly, and includes the Chief Executive and Directors of the Company.
Transactions with key management personnel are limited to payment of short term employee benefits only. The Company inthe normal course of business carries out various transactions with associated companies and continues to have a policywhereby all such transactions are carried out on commercial terms and conditions which are equivalent to those prevailing in anarm's length transaction.
2012 2011
Rupees Rupees
NOTE
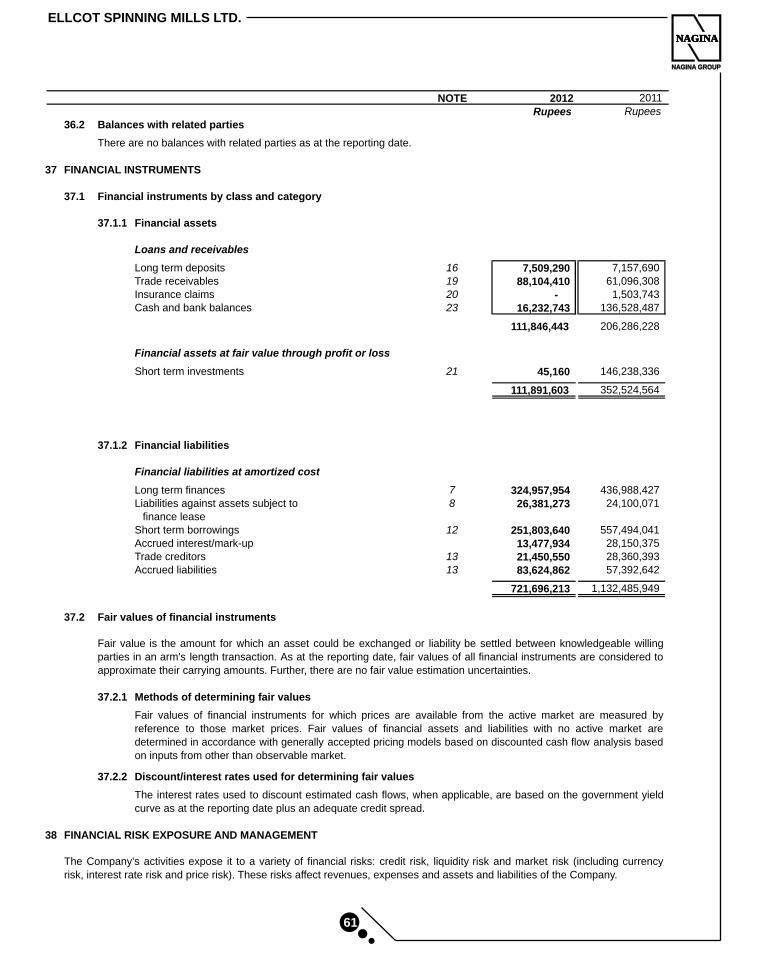
ELLCOT SPINNING MILLS LTD.
NAGINA
NAGINA GROUP
NAGINA
61
36.2 Balances with related parties
There are no balances with related parties as at the reporting date.
37 FINANCIAL INSTRUMENTS
37.1 Financial instruments by class and category
37.1.1 Financial assets
Loans and receivables
Long term deposits 16 7,509,290
7,157,690
Trade receivables 19 88,104,410
61,096,308
Insurance claims 20 -
1,503,743
Cash and bank balances 23 16,232,743
136,528,487
111,846,443
206,286,228
Financial assets at fair value through profit or loss
Short term investments 21 45,160
146,238,336
111,891,603
352,524,564
37.1.2 Financial liabilities
Financial liabilities at amortized cost
Long term finances 7 324,957,954
436,988,427
Liabilities against assets subject to 8 26,381,273
24,100,071
finance leaseShort term borrowings 12 251,803,640
557,494,041
Accrued interest/mark-up 13,477,934
28,150,375
Trade creditors 13 21,450,550 28,360,393
Accrued liabilities 13 83,624,862 57,392,642
721,696,213 1,132,485,949
37.2 Fair values of financial instruments
37.2.1 Methods of determining fair values
37.2.2 Discount/interest rates used for determining fair values
38 FINANCIAL RISK EXPOSURE AND MANAGEMENT
The interest rates used to discount estimated cash flows, when applicable, are based on the government yieldcurve as at the reporting date plus an adequate credit spread.
The Company’s activities expose it to a variety of financial risks: credit risk, liquidity risk and market risk (including currencyrisk, interest rate risk and price risk). These risks affect revenues, expenses and assets and liabilities of the Company.
Fair values of financial instruments for which prices are available from the active market are measured byreference to those market prices. Fair values of financial assets and liabilities with no active market aredetermined in accordance with generally accepted pricing models based on discounted cash flow analysis basedon inputs from other than observable market.
Fair value is the amount for which an asset could be exchanged or liability be settled between knowledgeable willingparties in an arm's length transaction. As at the reporting date, fair values of all financial instruments are considered toapproximate their carrying amounts. Further, there are no fair value estimation uncertainties.
2012 2011
Rupees Rupees
NOTE
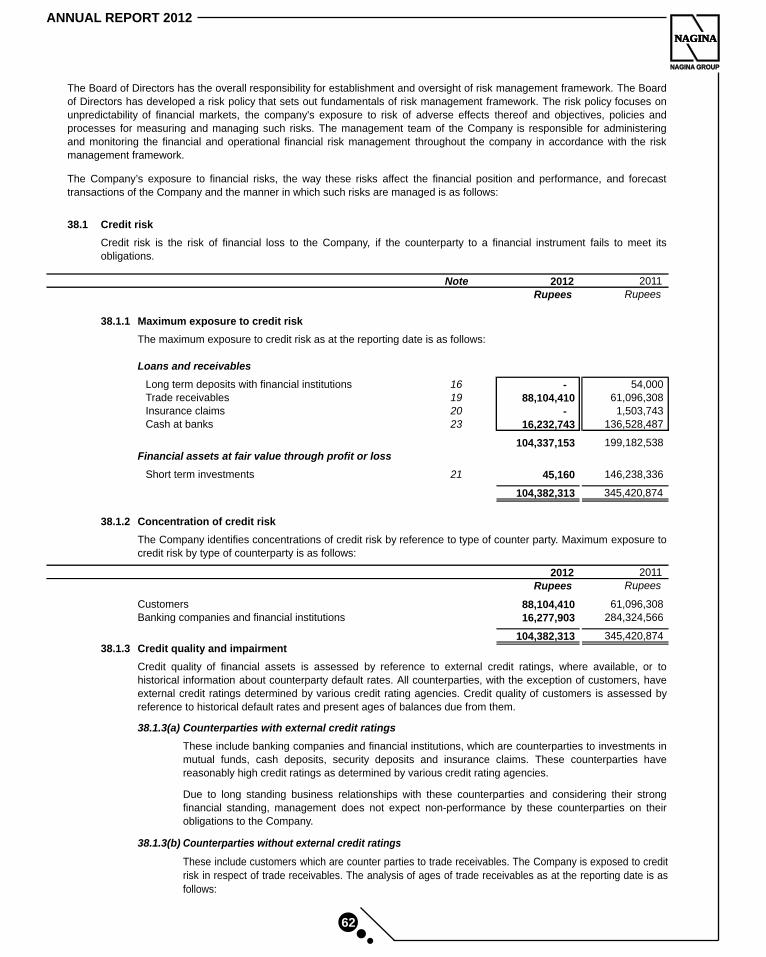
NAGINA
NAGINA GROUP
NAGINA
62
ANNUAL REPORT 2012
38.1 Credit risk
Note 2012 2011
Rupees Rupees
38.1.1 Maximum exposure to credit risk
The maximum exposure to credit risk as at the reporting date is as follows:
Loans and receivables
Long term deposits with financial institutions 16 - 54,000 Trade receivables 19 88,104,410 61,096,308 Insurance claims 20 - 1,503,743 Cash at banks 23 16,232,743 136,528,487
104,337,153 199,182,538
Financial assets at fair value through profit or loss
Short term investments 21 45,160 146,238,336
104,382,313 345,420,874
38.1.2 Concentration of credit risk
2012 2011
Rupees Rupees
Customers 88,104,410 61,096,308 Banking companies and financial institutions 16,277,903 284,324,566
104,382,313 345,420,874 38.1.3 Credit quality and impairment
38.1.3(a)
38.1.3(b)
Counterparties with external credit ratings
Due to long standing business relationships with these counterparties and considering their strongfinancial standing, management does not expect non-performance by these counterparties on theirobligations to the Company.
Credit risk is the risk of financial loss to the Company, if the counterparty to a financial instrument fails to meet itsobligations.
The Board of Directors has the overall responsibility for establishment and oversight of risk management framework. The Boardof Directors has developed a risk policy that sets out fundamentals of risk management framework. The risk policy focuses onunpredictability of financial markets, the company's exposure to risk of adverse effects thereof and objectives, policies andprocesses for measuring and managing such risks. The management team of the Company is responsible for administeringand monitoring the financial and operational financial risk management throughout the company in accordance with the riskmanagement framework.
Credit quality of financial assets is assessed by reference to external credit ratings, where available, or tohistorical information about counterparty default rates. All counterparties, with the exception of customers, haveexternal credit ratings determined by various credit rating agencies. Credit quality of customers is assessed byreference to historical default rates and present ages of balances due from them.
These include banking companies and financial institutions, which are counterparties to investments inmutual funds, cash deposits, security deposits and insurance claims. These counterparties havereasonably high credit ratings as determined by various credit rating agencies.
The Company identifies concentrations of credit risk by reference to type of counter party. Maximum exposure tocredit risk by type of counterparty is as follows:
The Company’s exposure to financial risks, the way these risks affect the financial position and performance, and forecasttransactions of the Company and the manner in which such risks are managed is as follows:
Counterparties without external credit ratings
These include customers which are counter parties to trade receivables. The Company is exposed to creditrisk in respect of trade receivables. The analysis of ages of trade receivables as at the reporting date is asfollows:
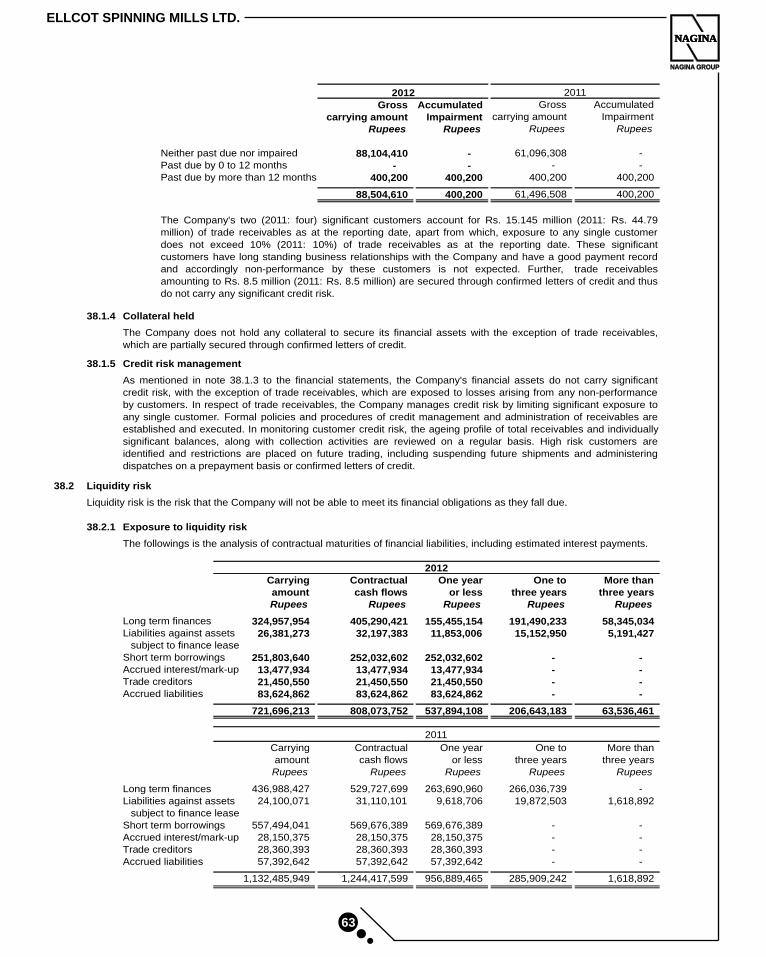
ELLCOT SPINNING MILLS LTD.
NAGINA
NAGINA GROUP
NAGINA
63
Gross Accumulated Gross Accumulated
carrying amount Impairment carrying amount Impairment
Rupees Rupees Rupees Rupees
Neither past due nor impaired 88,104,410 - 61,096,308 -Past due by 0 to 12 months - - - -Past due by more than 12 months 400,200 400,200 400,200 400,200
88,504,610 400,200 61,496,508 400,200
38.1.4 Collateral held
38.1.5 Credit risk management
38.2 Liquidity risk
Liquidity risk is the risk that the Company will not be able to meet its financial obligations as they fall due.
38.2.1 Exposure to liquidity risk
The followings is the analysis of contractual maturities of financial liabilities, including estimated interest payments.
Carrying Contractual One year One to More thanamount cash flows or less three years three yearsRupees Rupees Rupees Rupees Rupees
Long term finances 324,957,954
405,290,421
155,455,154
191,490,233
58,345,034
Liabilities against assets 26,381,273
32,197,383
11,853,006
15,152,950
5,191,427
subject to finance leaseShort term borrowings 251,803,640
252,032,602
252,032,602
-
-
Accrued interest/mark-up 13,477,934
13,477,934
13,477,934
-
-
Trade creditors 21,450,550
21,450,550
21,450,550
-
-
Accrued liabilities 83,624,862
83,624,862
83,624,862
-
-
721,696,213
808,073,752
537,894,108
206,643,183
63,536,461
Carrying Contractual One year One to More thanamount cash flows or less three years three yearsRupees Rupees Rupees Rupees Rupees
Long term finances 436,988,427 529,727,699 263,690,960 266,036,739 -Liabilities against assets 24,100,071 31,110,101 9,618,706 19,872,503 1,618,892
subject to finance leaseShort term borrowings 557,494,041 569,676,389 569,676,389 - -Accrued interest/mark-up 28,150,375 28,150,375 28,150,375 - -Trade creditors 28,360,393 28,360,393 28,360,393 - -Accrued liabilities 57,392,642 57,392,642 57,392,642 - -
1,132,485,949 1,244,417,599 956,889,465 285,909,242 1,618,892
The Company's two (2011: four) significant customers account for Rs. 15.145 million (2011: Rs. 44.79million) of trade receivables as at the reporting date, apart from which, exposure to any single customerdoes not exceed 10% (2011: 10%) of trade receivables as at the reporting date. These significantcustomers have long standing business relationships with the Company and have a good payment recordand accordingly non-performance by these customers is not expected. Further, trade receivablesamounting to Rs. 8.5 million (2011: Rs. 8.5 million) are secured through confirmed letters of credit and thusdo not carry any significant credit risk.
The Company does not hold any collateral to secure its financial assets with the exception of trade receivables,which are partially secured through confirmed letters of credit.
As mentioned in note 38.1.3 to the financial statements, the Company's financial assets do not carry significantcredit risk, with the exception of trade receivables, which are exposed to losses arising from any non-performanceby customers. In respect of trade receivables, the Company manages credit risk by limiting significant exposure toany single customer. Formal policies and procedures of credit management and administration of receivables areestablished and executed. In monitoring customer credit risk, the ageing profile of total receivables and individuallysignificant balances, along with collection activities are reviewed on a regular basis. High risk customers areidentified and restrictions are placed on future trading, including suspending future shipments and administeringdispatches on a prepayment basis or confirmed letters of credit.
2011
2012 2011
2012
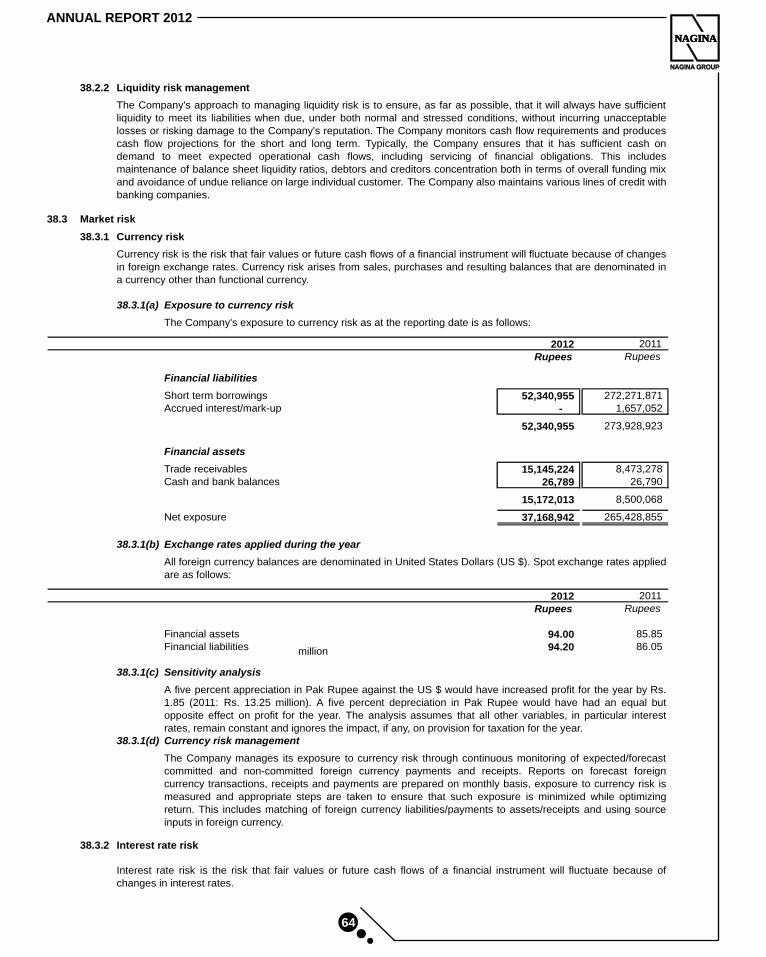
NAGINA
NAGINA GROUP
NAGINA
64
ANNUAL REPORT 2012
38.2.2 Liquidity risk management
38.3 Market risk
38.3.1 Currency risk
38.3.1(a) Exposure to currency risk
2012 2011
Rupees Rupees
Financial liabilities
Short term borrowings 52,340,955
272,271,871
Accrued interest/mark-up -
1,657,052
52,340,955
273,928,923
Financial assets
Trade receivables 15,145,224
8,473,278
Cash and bank balances 26,789 26,790
15,172,013 8,500,068
Net exposure 37,168,942 265,428,855
38.3.1(b) Exchange rates applied during the year
2012 2011
Rupees Rupees
Financial assets 94.00
85.85
Financial liabilities 94.20
86.05
38.3.1(c) Sensitivity analysis
38.3.1(d) Currency risk management
38.3.2 Interest rate risk
A five percent appreciation in Pak Rupee against the US $ would have increased profit for the year by Rs.1.85 (2011: Rs. 13.25 million). A five percent depreciation in Pak Rupee would have had an equal butopposite effect on profit for the year. The analysis assumes that all other variables, in particular interestrates, remain constant and ignores the impact, if any, on provision for taxation for the year.
The Company manages its exposure to currency risk through continuous monitoring of expected/forecastcommitted and non-committed foreign currency payments and receipts. Reports on forecast foreigncurrency transactions, receipts and payments are prepared on monthly basis, exposure to currency risk ismeasured and appropriate steps are taken to ensure that such exposure is minimized while optimizingreturn. This includes matching of foreign currency liabilities/payments to assets/receipts and using sourceinputs in foreign currency.
Interest rate risk is the risk that fair values or future cash flows of a financial instrument will fluctuate because ofchanges in interest rates.
All foreign currency balances are denominated in United States Dollars (US $). Spot exchange rates appliedare as follows:
The Company's approach to managing liquidity risk is to ensure, as far as possible, that it will always have sufficientliquidity to meet its liabilities when due, under both normal and stressed conditions, without incurring unacceptablelosses or risking damage to the Company's reputation. The Company monitors cash flow requirements and producescash flow projections for the short and long term. Typically, the Company ensures that it has sufficient cash ondemand to meet expected operational cash flows, including servicing of financial obligations. This includesmaintenance of balance sheet liquidity ratios, debtors and creditors concentration both in terms of overall funding mixand avoidance of undue reliance on large individual customer. The Company also maintains various lines of credit withbanking companies.
Currency risk is the risk that fair values or future cash flows of a financial instrument will fluctuate because of changesin foreign exchange rates. Currency risk arises from sales, purchases and resulting balances that are denominated ina currency other than functional currency.
The Company's exposure to currency risk as at the reporting date is as follows:
million
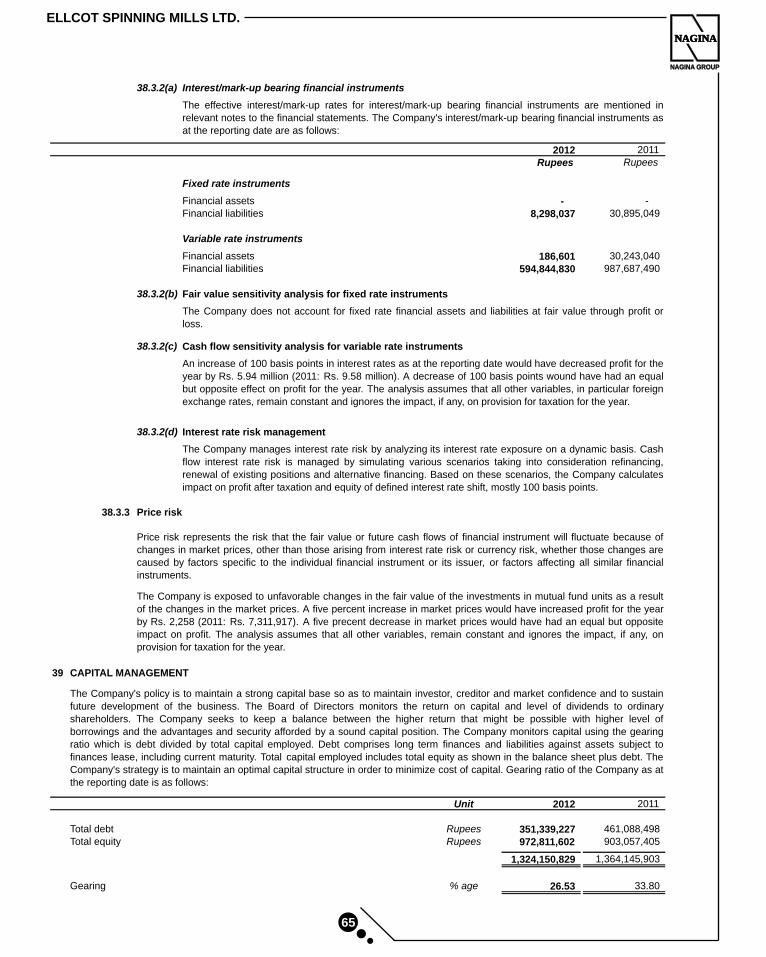
ELLCOT SPINNING MILLS LTD.
NAGINA
NAGINA GROUP
NAGINA
65
38.3.2(a) Interest/mark-up bearing financial instruments
2012 2011
Rupees Rupees
Fixed rate instruments
Financial assets -
-Financial liabilities 8,298,037
30,895,049
Variable rate instruments
Financial assets 186,601
30,243,040Financial liabilities 594,844,830
987,687,490
38.3.2(b) Fair value sensitivity analysis for fixed rate instruments
38.3.2(c) Cash flow sensitivity analysis for variable rate instruments
38.3.2(d) Interest rate risk management
38.3.3 Price risk
39 CAPITAL MANAGEMENT
Unit 2012 2011
Total debt Rupees 351,339,227 461,088,498Total equity Rupees 972,811,602 903,057,405
1,324,150,829 1,364,145,903
Gearing % age 26.53 33.80
An increase of 100 basis points in interest rates as at the reporting date would have decreased profit for theyear by Rs. 5.94 million (2011: Rs. 9.58 million). A decrease of 100 basis points wound have had an equalbut opposite effect on profit for the year. The analysis assumes that all other variables, in particular foreignexchange rates, remain constant and ignores the impact, if any, on provision for taxation for the year.
The Company does not account for fixed rate financial assets and liabilities at fair value through profit orloss.
The Company's policy is to maintain a strong capital base so as to maintain investor, creditor and market confidence and to sustainfuture development of the business. The Board of Directors monitors the return on capital and level of dividends to ordinaryshareholders. The Company seeks to keep a balance between the higher return that might be possible with higher level ofborrowings and the advantages and security afforded by a sound capital position. The Company monitors capital using the gearingratio which is debt divided by total capital employed. Debt comprises long term finances and liabilities against assets subject tofinances lease, including current maturity. Total capital employed includes total equity as shown in the balance sheet plus debt. TheCompany's strategy is to maintain an optimal capital structure in order to minimize cost of capital. Gearing ratio of the Company as atthe reporting date is as follows:
The effective interest/mark-up rates for interest/mark-up bearing financial instruments are mentioned inrelevant notes to the financial statements. The Company's interest/mark-up bearing financial instruments asat the reporting date are as follows:
The Company manages interest rate risk by analyzing its interest rate exposure on a dynamic basis. Cashflow interest rate risk is managed by simulating various scenarios taking into consideration refinancing,renewal of existing positions and alternative financing. Based on these scenarios, the Company calculatesimpact on profit after taxation and equity of defined interest rate shift, mostly 100 basis points.
Price risk represents the risk that the fair value or future cash flows of financial instrument will fluctuate because ofchanges in market prices, other than those arising from interest rate risk or currency risk, whether those changes arecaused by factors specific to the individual financial instrument or its issuer, or factors affecting all similar financialinstruments.
The Company is exposed to unfavorable changes in the fair value of the investments in mutual fund units as a resultof the changes in the market prices. A five percent increase in market prices would have increased profit for the yearby Rs. 2,258 (2011: Rs. 7,311,917). A five precent decrease in market prices would have had an equal but oppositeimpact on profit. The analysis assumes that all other variables, remain constant and ignores the impact, if any, onprovision for taxation for the year.
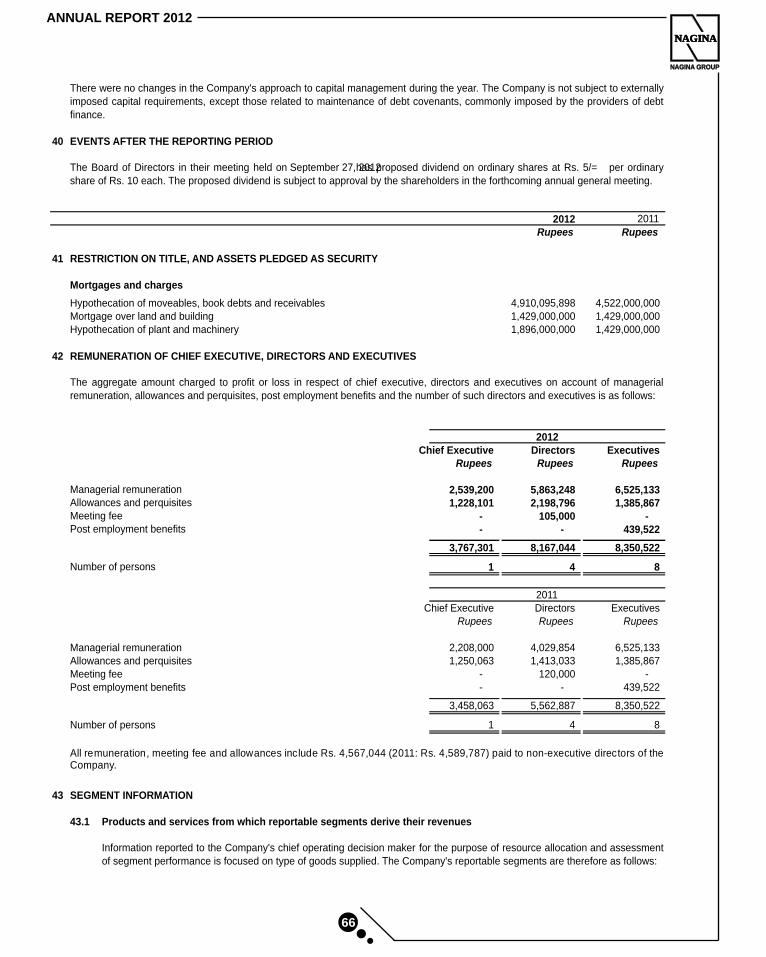
NAGINA
NAGINA GROUP
NAGINA
66
ANNUAL REPORT 2012
40 EVENTS AFTER THE REPORTING PERIOD
2012 2011
Rupees Rupees
41 RESTRICTION ON TITLE, AND ASSETS PLEDGED AS SECURITY
Mortgages and charges
Hypothecation of moveables, book debts and receivables 4,910,095,898
4,522,000,000
Mortgage over land and building 1,429,000,000
1,429,000,000
Hypothecation of plant and machinery 1,896,000,000
1,429,000,000
42 REMUNERATION OF CHIEF EXECUTIVE, DIRECTORS AND EXECUTIVES
Chief Executive Directors ExecutivesRupees Rupees Rupees
Managerial remuneration 2,539,200
5,863,248
6,525,133
Allowances and perquisites 1,228,101
2,198,796
1,385,867
Meeting fee -
105,000
-
Post employment benefits - - 439,522
3,767,301 8,167,044 8,350,522
Number of persons 1 4 8
Chief Executive Directors ExecutivesRupees Rupees Rupees
Managerial remuneration 2,208,000
4,029,854
6,525,133
Allowances and perquisites 1,250,063
1,413,033
1,385,867
Meeting fee -
120,000
-
Post employment benefits -
-
439,522
3,458,063
5,562,887
8,350,522
Number of persons 1
4
8
All remuneration, meeting fee and allowances include Rs. 4,567,044 (2011: Rs. 4,589,787) paid to non-executive directors of theCompany.
43 SEGMENT INFORMATION
43.1 Products and services from which reportable segments derive their revenues
There were no changes in the Company's approach to capital management during the year. The Company is not subject to externallyimposed capital requirements, except those related to maintenance of debt covenants, commonly imposed by the providers of debtfinance.
The Board of Directors in their meeting held on September 27, 2012has proposed dividend on ordinary shares at Rs. 5/= per ordinaryshare of Rs. 10 each. The proposed dividend is subject to approval by the shareholders in the forthcoming annual general meeting.
The aggregate amount charged to profit or loss in respect of chief executive, directors and executives on account of managerialremuneration, allowances and perquisites, post employment benefits and the number of such directors and executives is as follows:
2012
Information reported to the Company's chief operating decision maker for the purpose of resource allocation and assessmentof segment performance is focused on type of goods supplied. The Company's reportable segments are therefore as follows:
2011
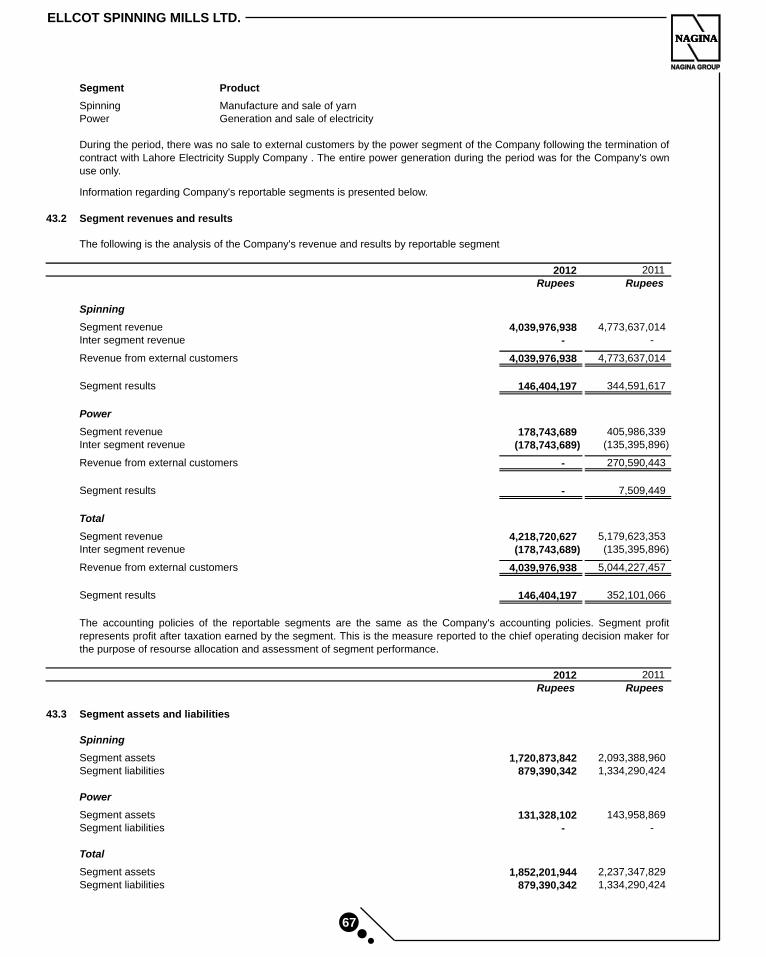
ELLCOT SPINNING MILLS LTD.
NAGINA
NAGINA GROUP
NAGINA
67
Segment Product
Spinning Manufacture and sale of yarnPower Generation and sale of electricity
Information regarding Company's reportable segments is presented below.
43.2 Segment revenues and results
The following is the analysis of the Company's revenue and results by reportable segment
2012 2011
Rupees Rupees
Spinning
Segment revenue 4,039,976,938
4,773,637,014
Inter segment revenue -
-
Revenue from external customers 4,039,976,938
4,773,637,014
Segment results 146,404,197
344,591,617
Power
Segment revenue 178,743,689
405,986,339
Inter segment revenue (178,743,689)
(135,395,896)
Revenue from external customers -
270,590,443
Segment results - 7,509,449
Total
Segment revenue 4,218,720,627
5,179,623,353
Inter segment revenue (178,743,689)
(135,395,896)
Revenue from external customers 4,039,976,938
5,044,227,457
Segment results 146,404,197
352,101,066
2012 2011
Rupees Rupees
43.3 Segment assets and liabilities
Spinning
Segment assets 1,720,873,842
2,093,388,960Segment liabilities 879,390,342
1,334,290,424
Power
Segment assets 131,328,102 143,958,869Segment liabilities - -
Total
Segment assets 1,852,201,944 2,237,347,829Segment liabilities 879,390,342 1,334,290,424
The accounting policies of the reportable segments are the same as the Company's accounting policies. Segment profitrepresents profit after taxation earned by the segment. This is the measure reported to the chief operating decision maker forthe purpose of resourse allocation and assessment of segment performance.
During the period, there was no sale to external customers by the power segment of the Company following the termination ofcontract with Lahore Electricity Supply Company . The entire power generation during the period was for the Company's ownuse only.
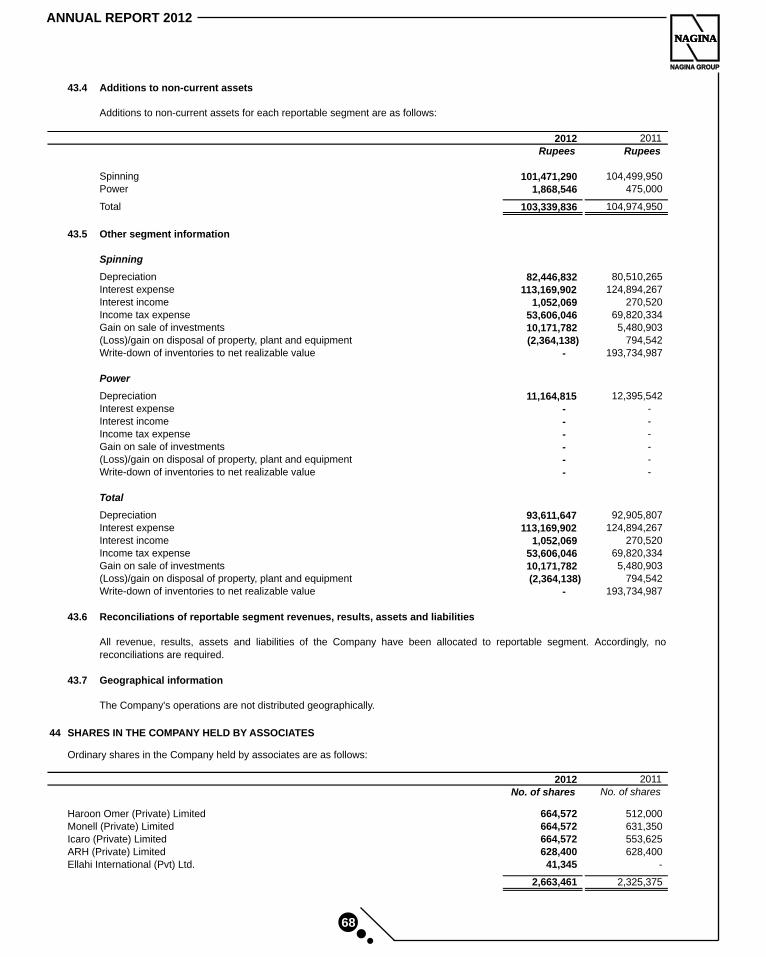
NAGINA
NAGINA GROUP
NAGINA
68
ANNUAL REPORT 2012
43.4 Additions to non-current assets
Additions to non-current assets for each reportable segment are as follows:
2012 2011
Rupees Rupees
Spinning 101,471,290 104,499,950Power 1,868,546 475,000
Total 103,339,836 104,974,950
43.5 Other segment information
Spinning
Depreciation 82,446,832
80,510,265Interest expense 113,169,902
124,894,267Interest income 1,052,069
270,520Income tax expense 53,606,046
69,820,334Gain on sale of investments 10,171,782
5,480,903(Loss)/gain on disposal of property, plant and equipment (2,364,138)
794,542Write-down of inventories to net realizable value -
193,734,987
Power
Depreciation 11,164,815
12,395,542Interest expense -
-Interest income -
-Income tax expense -
-Gain on sale of investments -
-(Loss)/gain on disposal of property, plant and equipment -
-Write-down of inventories to net realizable value -
-
Total
Depreciation 93,611,647
92,905,807Interest expense 113,169,902
124,894,267
Interest income 1,052,069
270,520Income tax expense 53,606,046
69,820,334
Gain on sale of investments 10,171,782 5,480,903(Loss)/gain on disposal of property, plant and equipment (2,364,138) 794,542Write-down of inventories to net realizable value - 193,734,987
43.6 Reconciliations of reportable segment revenues, results, assets and liabilities
43.7 Geographical information
44 SHARES IN THE COMPANY HELD BY ASSOCIATES
Ordinary shares in the Company held by associates are as follows:
2012 2011
No. of shares No. of shares
Haroon Omer (Private) Limited 664,572 512,000Monell (Private) Limited 664,572 631,350Icaro (Private) Limited 664,572 553,625ARH (Private) Limited 628,400 628,400Ellahi International (Pvt) Ltd. 41,345 -
2,663,461 2,325,375
All revenue, results, assets and liabilities of the Company have been allocated to reportable segment. Accordingly, noreconciliations are required.
The Company's operations are not distributed geographically.
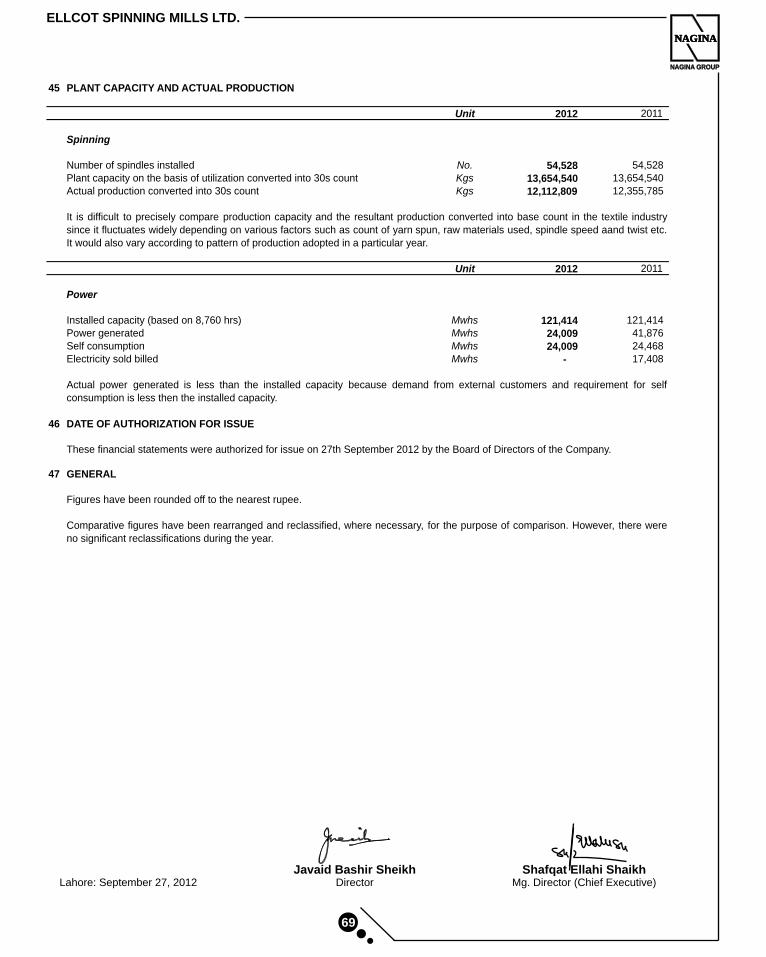
ELLCOT SPINNING MILLS LTD.
NAGINA
NAGINA GROUP
NAGINA
69
45 PLANT CAPACITY AND ACTUAL PRODUCTION
Unit 2012 2011
Spinning
Number of spindles installed No. 54,528
54,528
Plant capacity on the basis of utilization converted into 30s count Kgs 13,654,540
13,654,540
Actual production converted into 30s count Kgs 12,112,809
12,355,785
Unit 2012 2011
Power
Installed capacity (based on 8,760 hrs) Mwhs 121,414 121,414 Power generated Mwhs 24,009
41,876
Self consumption Mwhs 24,009
24,468 Electricity sold billed Mwhs - 17,408
46 DATE OF AUTHORIZATION FOR ISSUE
47 GENERAL
Figures have been rounded off to the nearest rupee.
Comparative figures have been rearranged and reclassified, where necessary, for the purpose of comparison. However, there wereno significant reclassifications during the year.
Actual power generated is less than the installed capacity because demand from external customers and requirement for selfconsumption is less then the installed capacity.
It is difficult to precisely compare production capacity and the resultant production converted into base count in the textile industrysince it fluctuates widely depending on various factors such as count of yarn spun, raw materials used, spindle speed aand twist etc.It would also vary according to pattern of production adopted in a particular year.
These financial statements were authorized for issue on 27th September 2012 by the Board of Directors of the Company.
Javaid Bashir SheikhDirector
Shafqat Ellahi ShaikhMg. Director (Chief Executive)Lahore: September 27, 2012
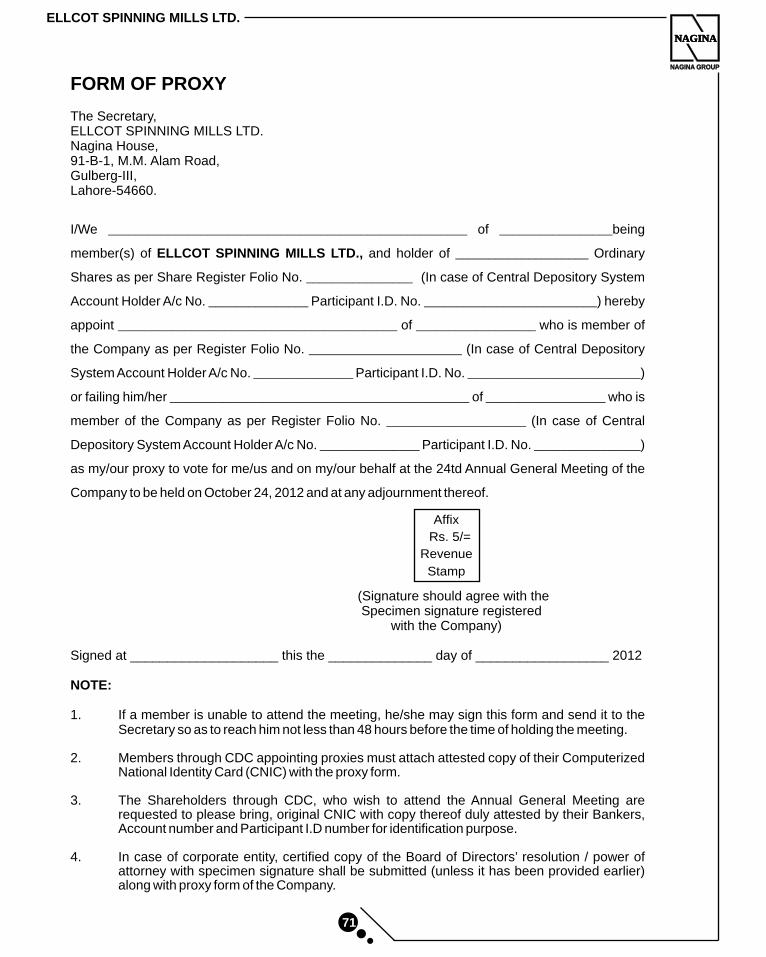
ELLCOT SPINNING MILLS LTD.
NAGINA
NAGINA GROUP
NAGINA
71
FORM OF PROXY
The Secretary,ELLCOT SPINNING MILLS LTD.Nagina House, 91-B-1, M.M. Alam Road,Gulberg-III, Lahore-54660.
I/We ______________________________________________________ of _________________being
member(s) of ELLCOT SPINNING MILLS LTD., and holder of ____________________ Ordinary
Shares as per Share Register Folio No. ________________ (In case of Central Depository System
Account Holder A/c No. _______________ Participant I.D. No. __________________________) hereby
appoint __________________________________________ of __________________ who is member of
the Company as per Register Folio No. _______________________ (In case of Central Depository
System Account Holder A/c No. _______________ Participant I.D. No. __________________________)
or failing him/her _____________________________________________ of __________________ who is
member of the Company as per Register Folio No. _____________________ (In case of Central
Depository System Account Holder A/c No. _______________ Participant I.D. No. ________________)
as my/our proxy to vote for me/us and on my/our behalf at the 24td Annual General Meeting of the
Company to be held on October 24, 2012 and at any adjournment thereof.
(Signature should agree with the Specimen signature registered with the Company)
Signed at ____________________ this the ______________ day of __________________ 2012
NOTE:
1. If a member is unable to attend the meeting, he/she may sign this form and send it to the Secretary so as to reach him not less than 48 hours before the time of holding the meeting.
2. Members through CDC appointing proxies must attach attested copy of their Computerized National Identity Card (CNIC) with the proxy form.
3. The Shareholders through CDC, who wish to attend the Annual General Meeting are requested to please bring, original CNIC with copy thereof duly attested by their Bankers, Account number and Participant I.D number for identification purpose.
4. In case of corporate entity, certified copy of the Board of Directors’ resolution / power of attorney with specimen signature shall be submitted (unless it has been provided earlier) along with proxy form of the Company.
Affix
Rs. 5/=
Revenue
Stamp