Embed Size (px)
Citation preview

NAGINA GROUP
Ellcot Spinning Mills LimitedAn ISO 9001:2008 Certified Company
Annual Report | 2017

CONTENTS
NAGINA
NAGINA GROUP
ELLCOT SPINNING MILLS LIMITED
1
Auditors’ Report to the Members 31
32Balance Sheet
34Profit and Loss Account
35Statement of Profit or Loss and Other Comprehensive Income
36Cash Flow Statement
37Statement of Changes in Equity
38Notes to and Forming Part of Financial Statements
79Form of Proxy
Company Information 02
Notice of Annual General Meeting 03
Vision and Mission Statement 06
Directors’ Report to the Members 10
Statement of Compliance with the Code of Corporate Governance 20
Shareholders’ Information 22
Pattern of Shareholding 27
Key Financial Information 29
Auditor’s Review Report to the Members on Statement of Compliance withthe Code of Corporate Governance 30
Notice u/s 218 of the Companies Ordinance, 1984 26

COMPANY INFORMATION
NAGINA
NAGINA GROUP
ANNUAL REPORT 2017
2
NOTICE OF ANNUAL GENERAL MEETING
NAGINA
NAGINA GROUP
ELLCOT SPINNING MILLS LTD.
3
By Order of the Board
Syed Mohsin GilaniCorporate SecretaryLahore : September 28, 2017
Notice is hereby given that the 29th Annual General Meeting of members of ELLCOT SPINNING MILLS LTD. will be held at the Registered Office of the Company, situated at Nagina House, 91-B-1, M.M. Alam Road, Gulberg-III, Lahore-54660 on Friday, October 27, 2017 11:30 a.m. to transact the following business:-
1) To confirm minutes of the Extraordinary General Meeting held on January 26, 2017.
2) To receive, consider and adopt Audited Accounts of the Company for the year ended June 30, 2017 together with the Directors' and Auditors' reports thereon.
3) To approve and declare final dividend as recommended by the Board of Directors.
4) To appoint Auditors for the year ending June 30, 2018 and fix their remuneration.
5) To transact any other ordinary business with the permission of the Chair.
A statement required under the Companies (Investment in Associated Companies or Associated Undertakings) Regulations, 2012 is annexed.
BOARD OF DIRECTORS
MANAGING DIRECTOR (Chief Executive)
AUDIT COMMITTEE
HUMAN RESOURCE & REMUNERATION (HR & R) COMMITTEE
EXECUTIVE COMMITTEE
CORPORATE SECRETARY
CHIEF FINANCIAL OFFICER (CFO)
HEAD OF INTERNAL AUDIT
AUDITORS
LEGAL ADVISOR
LEAD BANKERS
REGISTERED OFFICE
WEB REFERENCE
SHARE REGISTRAR
MILLS
Mr. Shahzada Ellahi Shaikh Mr. Syed Moaz Mohiuddin Mr. Jamal Nasim (Nominee NIT)
Mr. Shaukat Ellahi Shaikh Mr. Raza Ellahi Shaikh
Mr. Amin Ellahi Shaikh
Mr. Shafqat Ellahi Shaikh
Non-Executive Director / Chairman Independent Non-Executive Director Non-Executive DirectorNon-Executive DirectorNon-Executive DirectorNon-Executive DirectorExecutive Director
Mr. Shafqat Ellahi Shaikh
Mr. Syed Moaz Mohiuddin
Mr. Shaukat Ellahi Shaikh
Mr. Amin Ellahi Shaikh
Mr. Syed Mohsin Gilani
ChairmanMemberMemberSecretary
Mr. Amin Ellahi Shaikh
Mr. Shaukat Ellahi Shaikh
Mr. Raza
Ellahi Shaikh
Mr. Muhammad Azam
ChairmanMemberMemberSecretary
Mr. Shaukat Ellahi Shaikh
Mr. Shahzada Ellahi Shaikh
Mr. Shafqat Ellahi Shaikh
Mr. Amin Ellahi Shaikh
Mr. Muhammad Azam
Chairman MemberMemberMemberSecretary
Mr. Syed Mohsin Gilani
Mr. Muhammad Ahmad
Mr. Kashif Saleem
Messrs Rahman Sarfraz Rahim Iqbal RafiqChartered Accountants
Bandial & Associates
Albaraka Bank (Pakistan) Ltd.
Allied Bank Ltd.
Askari Bank Ltd.
Bank Alfalah Ltd.
Faysal Bank Ltd.
Habib Bank Ltd.
Meezan Bank Ltd.
MCB Bank Ltd.
National Bank of Pakistan
Standard Chartered Bank (Pakistan) Ltd.The Bank of Punjab
United Bank Ltd.
Nagina House91-B-1, M.M. Alam RoadGulberg-III, Lahore-54660
www.nagina.com
M/s Hameed Majeed Associates (Pvt.) Ltd. 1
stFloor, H.M. House
7-Bank Square, Lahore Phone # 042-37235081-2 Fax # 042-37358817
6.3 K.M, Manga Mandi, Raiwind RoadMouza Rossa, Tehsil & District Kasur
NOTES:
1) The share transfer books for ordinary shares of the Company will be closed from Saturday, October 21, 2017 to Friday, October 27, 2017 (both days inclusive). Valid transfer(s) received in order by our Share Registrar, M/s Hameed Majeed Associates (Pvt.) Limited, H.M. House, 7-Bank Square, Lahore by the close of business on Friday, October 20, 2017 will be in time to be passed for payment of dividend to the transferee(s).
2) A member entitled to attend and vote at the General Meeting is entitled to appoint another member as proxy. Proxies, in order to be effective, must be received at the Company's registered office not less than forty eight (48) hours before the time of meeting. Members through CDC appointing proxies must attach attested copy of their Computerised National Identity Card (CNIC) with the proxy form.
3) The shareholders through CDC, who wish to attend the Annual General Meeting are requested to please bring, original CNIC with copy thereof duly attested by their bankers, account number and participant I.D number for identification purpose.
4) In case of corporate entity, certified copy of the Board of Directors' resolution / power of attorney with specimen signature shall be submitted (unless it has been provided earlier) along with proxy form of the Company.
5) Members who have not submitted copy of valid CNIC are once again advised to submit the same without further delay to ensure compliance with the Securities and Exchange Commission of Pakistan (SECP) Notification S.R.O. 275(i)/2016 dated March 31, 2016 read with Notification S.R.O. 19(I)/2014 dated January 10, 2014 and Notification S.R.O. 831(I)/2012 dated July 5, 2012.

NAGINA
NAGINA GROUP
4
NAGINA
NAGINA GROUP
ELLCOT SPINNING MILLS LTD.
5
Henceforth, issuance of dividend warrant(s) will be subject to submission of CNIC (individuals) / NTN (corporate entities) by shareholders.
6) In accordance with Section 242 of the Companies Act, 2017, any dividend payable in cash shall only be paid through electronic mode directly into the bank account designated by the entitled shareholder. Please note that given bank mandate for dividend payments is MANDATORY and in order to comply with this regulatory requirement and to avail the facility of direct credit of dividend amount in your bank account, you are requested to please provide the particulars relating to name, folio number, bank account number, IBAN Number, title of account and complete mailing address of the bank directly to the Company’s Share Registrar in case of physical shareholders and directly to the relevant Participant / CDC Investor Account Service in case of maintaining shareholding under Central Depository System (CDS).
In case of non-receipt of above information, the dividend shall be withheld.
7) The financial statements for the year ended June 30, 2017 shall be uploaded on the Company's website on or before October 06, 2017.
8) Pursuant to SECP Notification S.R.O. 787(I)/ 2014 dated September 8, 2014, members may inform the Company to receive the Audited Financial Statements and notices through e-mail by submitting Standard Request Form available on Company's website.
9) In terms of sub section 1(b) of Section 134 of the Companies Act, 2017, Members can also attend and participate in the AGM through video conference facility, if members residing the vicinity, collectively holding 10% or more shareholding, provide their consent in writing, to participate in the AGM through video conference at least ten (10) days prior to date of AGM.
After receiving the consent of the members in aggregate 10% or more shareholding, the Company will intimate members regarding venue of video conference facility at least five (5) days before the date of the AGM along with complete information necessary to enable them to access such facility.
10) Members are requested to promptly notify the Company of any change in their registered address.
11) IMPORTANT:
a) Pursuant to the provisions of the Finance Act, 2017, effective July 1, 2017, the rates of deduction of income tax from dividend payments under the income Tax Ordinance have been revised as follows:
i) Rate of tax deduction for filer of income tax return 15% ii) Rate of tax deduction for non-filers of income tax return 20%
To enable the company to make tax deduction on the amount of cash dividend @15% instead of 20%, shareholders whose names are not entered into the Active Tax-payers List (ATL) provided on the website of FBR, despite the fact that theyare filers, are advised to immediately make sure that their names are entered in ATL, otherwise tax on their cash dividend will be deducted @20% instead of 15%.
Further, according to clarification received from Federal Board of Revenue (FBR), withholding tax will be determined separately on “Filer/ Non-Filer” status of principal shareholder as well as joint-holders (s) based on their shareholding proportions, in case of joint accounts.
In this regard all shareholders who hold shares jointly are requested to provide shareholding proportions of principal shareholder and joint-holder(s) in respect of shares held by them to our Share Registrar, in writing, within 10 days of this notice, otherwise it will be assumed that the shares are equally held by principal shareholder and joint-holder(s).
b) Shareholders are requested to provide CNIC/NTN, e-Dividend information and change of address to (i) respective Central Depository System (CDS) Participant and (ii) in case of physical securities to the Company's Share Registrar M/s. Hameed Majeed Associates (Pvt) Ltd., H.M. House, 7-Bank Square, Lahore.
ANNUAL REPORT 2017
d. Mate r ia l change in Financial Statements of associated company or associated undertaking s i n c e d a t e o f t h e resolution passed for approval of investment in such company.
Nil
Rs.75,000,000/= (Rupees seventy five million only) to each of the following associated company: i) Nagina Cotton Mills Ltd. (NCML) ii) Prosperity Weaving Mills Ltd. (PWML)
a. Total investment approved.
b. Amount of investment made to date:
Members had approved a special resolution u/s 208 of the Companies Ordinance, 1984 on October 28, 2015. The Company has not made any investment under the resolution. Following is the status:
c. Reason for not having m a d e c o m p l e t e investment so far where resolution required it to be imp lemen ted i n specified time.
Due to better cash flows, the associated companies did not need funds envisaged u/s 208 of the Companies Ordinance, 1984. Therefore, no investment transaction took place during the year 2016-17.
STATEMENT AS REQUIRED UNDER THE COMPANIES(INVESTMENT IN ASSOCIATED COMPANIES OR ASSOCIATED UNDERTAKINGS)
REGULATIONS, 2012.
Present FinancialPosition as on June
30, 2017
NCML PWML NCML PWML Rupees in Millions
Net sales 4,267.869
Gross profit
151.481
Profit/(loss) before tax
(64.422)
Profit/(loss) after tax
(92.945)
Financial Position atthe time of approval as
on June 30, 2016
5,820.163
303.179
58.496
56.198
5,242.033
353.294
110.886
78.428
5,211.429
359.653
72.362
39.972

NAGINA
NAGINA GROUP
6
Vision:
To be a dynamic, profitable and growth oriented company.
Mission:
To be the leading producer of cotton and blended yarn for knitting and weaving for local and international customers manufacturing well-known textile brands.
To strive for excellence and sustain position as a preferred supplier for yarn with a customer focused strategy.
Continuous enhancement the quality objectives for customer satisfaction and operational efficiencies.
To achieve the comparative advantage by employing latest technologies for enhancing the efficiency and productivity.
To build enduring relationship with our suppliers by giving them fair return on their products and services.
To provide a professional, open and participative environment to our dedicated employees for developing their potential and team performance.
To give consistent financial returns to the shareholders on their investments.
To be responsible to the society, employees and communities in which we operate by initiating health care, education and social welfare activities.
ANNUAL REPORT 2017


NAGINA
NAGINA GROUP
ELLCOT SPINNING MILLS LTD.
11
DIRECTORS’ REPORT TO THE MEMBERS
The Directors have the honor to present 29th Annual Report of your Company together with Audited Financial Statements and Auditors' Report thereon for the year ended June 30, 2017. Figures for the last year ended June 30, 2016 are included for comparison.
Company Performance
Alhamdullilah, your company has managed to earn after tax profit of Rs.77,670,924 compared to Rs.71,164,545 of last year. Earning per share (EPS) for the year is Rs. 7.09 compared to EPS of Rs. 6.50 for last year.
Sales revenue stood at Rs. 4,868,596,391 compared to Rs. 4,227,909,980 during last year showing an increase of 15.15%. Cost of sales decreased from 94.20% of sales to 93.49%. Gross Profit (GP) for the current year is 6.51% of sales compared to 5.80% during the last financial year.
Distribution costs decreased from 0.89% of sales of last year to 0.66% of sales for current year. The decrease is mainly due to overall sales mix tilted to local market. Administrative expenses increased by 8.19% over the last year due to inflationary impact. Other expenses increased from 0.13% of sales of last year to 0.32% of sales. This is mainly due to higher provision of WPPF, workers welfare fund and accounting loss on disposal of old machinery.
The Company has been able to generate stable cash flows and discharged all its operating and financial liabilities in time. Due to efficient utilization of financial resources, repayment of long term loans and hard negotiations of pricing, the finance cost decreased from1.20% of sales to 1.19% of sales during current year.
Capital Assets Investment
During the year your Company invested Rs.93,685,911 in Expansion / Balancing, Modernization, Replacement (BMR) of building, plant and machinery and other assets. Your company is currently undergoing major BMR/ expansion. By virtue of this BMR/ expansion the company would be installing state of the art 25,200 spindles alongwith related machinery. Overall value of capital expenditure will be around Rs. 1.6 billion. This is in line with Company's strategic plans to continue to diversify its product line; addition of new qualities and blends of yarn and improvement in the production capacity of the plant to cater to the needs of both domestic and international markets.
Future Outlook
It is a matter of great satisfaction that your company has reported profit for the year ended June 30, 2017 inspite of the very difficult trading conditions prevailing in the textile markets. Demand for yarn was depressed in the export as well as local markets. Profits are partly attributed to the export package announced by the government. This step has helped in boosting exports of textiles from Pakistan and restoring profitability of the textile industry. It is hoped that the government will continue the export package for the current year 2017-18. The export package is essential to help the Pakistan textile industry to face the competition from regional countries.
Raw cotton arrivals in the ginning factories for the current year upto September 15, 2017 have been reported as 2,365,555 bales. The arrival to-date is encouraging and it is hoped that Pakistan will produce a bumper cotton crop this year. A large cotton crop in Pakistan is essential to maintain the competitiveness of the textile industry and sustain the export volumes. Exchange rate of Pak rupee showed stable trend against USD. Management is well aware of the challenges ahead and making all out efforts to control costs, finding ways to enter in new markets, diversification of its product range etc. We expect that Government of Pakistan will play its role by taking steps such as continuing the export package, zero rating of exports, allowing timely refunds of stuck up amounts under sales and income taxes, maintain uninterrupted energy supplies and achieve competitiveness in the exchange rate. Investment in new technology has enabled your company to be better equipped to produce variety of yarns in order to meet requirements of our quality conscious customers.
NAGINA
NAGINA GROUP
10
ANNUAL REPORT 2017
We expect that long awaited technology up-gradation fund (TUF) support would also be released during the FY 17/18.
Wages and salaries, administration and general costs are rising continuously. Therefore, we are foreseeing another challenging year ahead of us. However, management is cognizant of the situation and taking all measures to cope with these challenges.
Dividend
The Board of Directors have recommended cash dividend @ 35% i.e. Rs. 3.50 per ordinary share for the year ended June 30, 2017. The dividend will amount to Rs. 38,325,000.
ISO 9001: 2008 Certification
The Company continues to operate at high standards of quality and had obtained latest version of certification for the period from February 02, 2017 to September 15, 2018. The quality control certification helps to build up trust of new and old customers.
Corporate Social Responsibility
The Company strongly believes in the integration of Corporate Social Responsibility into its business, and has consistently endeavors to uplift communities that are influenced directly or indirectly by our business.
Environment, Health and Safety: The Company maintains safe working conditions avoiding the risk to the health of employees and public at large. The management has maintained safe environment in all its operations throughout the year and is constantly upgrading their safety and living facilities.
Safety is a matter of concern for machinery as well as the employees working at plant. Fire extinguishers and other fire safety equipments have been placed at sites as well as registered and head office of the Company. Regular drills are performed to ensure efficiency of fire safety equipments.
Compliance with the Code of Corporate Governance
The “Statement of Compliance with the Code of Corporate Governance (CCG)” is annexed.
Corporate Governance & Financial Reporting Framework
As required by the Code of Corporate Governance, Directors are pleased to report that:
i) The financial statements prepared by the management of the Company present fair state of Company's operations, cash flows and changes in equity.
ii) Proper books of account of the Company have been maintained.
iii) Appropriate accounting policies have been consistently applied in the preparation of financial statements and accounting estimates are based upon reasonable and prudent judgment.
iv) International Financial Reporting Standards (IFRS), as applicable in Pakistan, have been followed in the preparation of financial statements, and any departures therefrom has been adequately disclosed and explained.
v) The system of internal control is sound in design and has been effectively implemented and monitored.
vi) There are no doubts upon the Company's ability to continue as a going concern.
vii) Key operating and financial data for the last six years is annexed.

NAGINA
NAGINA GROUP
12
NAGINA
NAGINA GROUP
ELLCOT SPINNING MILLS LTD.
13
viii) There are no statutory payments on account of taxes, duties, levies and charges that are outstanding as on June 30, 2017 except for those disclosed in the financial statements.
ix) No adverse material changes and commitments affecting the financial position of the Company have occurred between the end of the financial year to which this balance sheet relates and the date of the Director's Report.
x) During 2016-2017, no trade in the shares of the Company carried out by the Directors, CEO, CFO, Company Secretary and their spouses and minor children except the following:
Transferor Transferee No. ofShares
Name Designation DesignationName
Nature ofTransaction
Mr. Jamal Nasim Director Through Broker -
-
29,000 Sold
Mr. Shahzada Ellahi Shaikh
Director Mr. Haroon Ellahi Shaikh
Executive 500,000
Transferred through gift
Mr. Shahzada Ellahi Shaikh
Director Mr. Omer Ellahi Shaikh
500,000
DirectorMr. Shaukat Ellahi Shaikh
Director Mr. Raza Ellahi Shaikh
1,000,000
DirectorMr. Shafqat Ellahi Shaikh
CEO / Director Mr. Amin Ellahi Shaikh
1,000,000
CEO / DirectorMr. Shaikh Enam Ellahi (Late)
Director Mr. Shafqat Ellahi Shaikh
79,051 Due to death of Joint Investor
Account holder, survivor received
the shares.
DirectorMr. Shafqat Ellahi Shaikh
CEO / Director Mr. Shaukat Ellahi Shaikh
26,350
DirectorMr. Shafqat Ellahi Shaikh
CEO / Director Mr. Shahzada Ellahi Shaikh
26,350
DirectorMr. Shaikh Enam Ellahi (Late)
Director / Chairman
Mr. Shahzada Ellahi Shaikh
43,783
Transferred through gift
DirectorMr. Shaikh Enam Ellahi (Late)
Director / Chairman
Mr. Shaukat Ellahi Shaikh
43,783
CEO / DirectorMr. Shaikh Enam Ellahi (Late)
Director / Chairman
Mr. Shafqat Ellahi Shaikh
43,784
Shares transferred under
inheritance
ANNUAL REPORT 2017
Sr. No. Name of Directors Attendance
1.
2.
3.
4.
5.
6.
7.
Mr. Jamal Nasim
Mr. Syed Moaz Mohiuddin
Mr. Shahzada Ellahi Shaikh
Mr. Shaukat Ellahi Shaikh
Mr. Shafqat Ellahi Shaikh
Mr. Raza Ellahi Shaikh
Mr. Amin Ellahi Shaikh
4
4
3
4
4
4
4
Leave of absence was granted to the Director who could not attend any of the Board meetings.
Audit Committee Meetings
During the year, four (4) meetings of Audit Committee of the Board were held. Attendance by each Director is as follows:
Related Parties
The transactions between the related parties were carried out at an arm's length basis. The Company has fully complied with the best practices of the transfer pricing as contained in the listing regulation of Pakistan Stock Exchange Ltd.
Financial Statements Audit
Financial statements of the Company have been audited without any qualification by Messrs Rahman Sarfraz Rahim Iqbal Rafiq, Chartered Accountants, the statutory external auditors of the Company.
Shareholding Pattern
The shareholding pattern as at June 30, 2017 including the information under the Code of Corporate Governance, for ordinary shares, is annexed.
Notice u/s 2018 of the Companies Ordinance, 1984
Notice u/s 218 of the Companies Ordinance 1984 is annexed.
Committees of the Board
In compliance with the Code of Corporate Governance and Articles of Association of the Company, the Board of Directors had formed following Committees.
• Audit Committee
• Human Resource and Remuneration (HR & R) Committee
• Executive Committee
The names of the members of above committees are given in the Company information.
Board of Directors' Meetings
During the year four (4) meetings of the Board of Directors were held. Attendance by each Director is as follows:

NAGINA
NAGINA GROUP
14
Lahore: September 28, 2017
On behalf of the Board
Shafqat Ellahi Shaikh
Mg. Director (Chief Executive)
Executive Committee Meetings
During the year two (2) meetings of Executive Committee were held. Attendance by each Director is as follows:
Human Resource & Remuneration (HR & R) Committee Meetings
During the year, three (3) meetings of HR & R Committee of the Board were held. Attendance by each Director is as follows:
Sr. No. Name of Directors Attendance
1.
2.
3.
Mr. Syed Moaz Mohiuddin
Mr. Shaukat Ellahi Shaikh
Mr. Amin Ellahi Shaikh
4
4
4
Sr. No. Name of Directors Attendance
1.
2.
3.
4.
Mr. Shahzada Ellahi Shaikh
Mr. Shaukat Ellahi Shaikh
Mr. Shafqat Ellahi Shaikh
Mr. Amin Ellahi Shaikh
2
2
2
2
Sr. No. Name of Directors Attendance
1.
2.
3.
Mr. Amin Ellahi Shaikh
Mr. Shaukat Ellahi Shaikh
Mr. Raza Ellahi Shaikh
3
3
3
Director's Training Program
The Company has complied with the requirements of regulation 5.19.7 of PSX Rule Book.
Appointment of Auditors
Messrs Rahman Sarfraz Rahim Iqbal Rafiq, Chartered Accountants, Lahore are due to retire and being eligible, offer themselves for re-appointment as auditors for the FY 17/18. The Audit Committee has recommended for re-appointment of present auditors.
Acknowledgment
Continued diligence and devotion of the staff and workers of the Company and good human relations at all levels deserve acknowledgement. The Directors also wish to place on record their thanks to the bankers and other stakeholders for their continued support to the Company.
NAGINA
NAGINA GROUP
ELLCOT SPINNING MILLS LTD.ANNUAL REPORT 2017

NAGINA
NAGINA GROUP
16
NAGINA
NAGINA GROUP
ELLCOT SPINNING MILLS LTD.
17
ANNUAL REPORT 2017

NAGINA
NAGINA GROUP
16
NAGINA
NAGINA GROUP
ELLCOT SPINNING MILLS LTD.
17
ANNUAL REPORT 2017

NAGINA
NAGINA GROUP
18
NAGINA
NAGINA GROUP
ELLCOT SPINNING MILLS LTD.
19
ANNUAL REPORT 2017

NAGINA
NAGINA GROUP
18
NAGINA
NAGINA GROUP
ELLCOT SPINNING MILLS LTD.
19
ANNUAL REPORT 2017

NAGINA
NAGINA GROUP
20
NAGINA
ELLCOT SPINNING MILLS LTD.
NAGINA GROUP
21
ANNUAL REPORT 2017
Mr. Amin Ellahi Shaikh
STATEMENT OF COMPLIANCE WITH THE CODE OF CORPORATE GOVERNANCEFOR THE YEAR ENDED JUNE 30, 2017
This statement is being presented to comply with the Code of Corporate Governance (CCG) contained in Chapter 5.19 of Rule Book of Pakistan Stock Exchange Limited for the purpose of establishing a framework of good governance, whereby a listed company is managed in compliance with the best practices of corporate governance.
The Company has applied the principles contained in the CCG in the following manner:
1. The Company encourages representation of Independent Non-Executive Directors and Directors representing minority interests on its Board of Directors. At present the Board includes:
The Independent Director meets the criteria of Independence under clause 5.19.1.(b) of the CCG
2. The Directors have confirmed that none of them is serving as a Director on more than seven listed companies, including this Company.
3. All the resident Directors of the Company are registered as taxpayers and none of them has defaulted in payment of any loan to a banking company, a DFI or an NBFI or, being a broker of a stock exchange, has been declared as a defaulter by that stock exchange.
4. During the financial year 2016-17, a casual vacancy occurred on the Board on September 20, 2016 and filled up by the board on September 29, 2016.
5. The Company has prepared a “Code of Conduct” and has ensured that appropriate steps have been taken to disseminate it throughout the Company along with its supporting policies and procedures.
6. The Board has developed a vision/mission statement, overall corporate strategy and significant policies of the Company. A complete record of particulars of significant policies along with the dates on which they were approved or amended has been maintained.
7. All the powers of the Board have been duly exercised and decisions on material transactions, including appointment and determination of remuneration and terms and conditions of employment of the CEO, other Executive and Non-Executive Directors, have been taken by the Board.
8. The meetings of the Board were presided over by the Chairman and, in his absence, by a Director elected by the Board for this purpose and the Board met at least once in every quarter. Written notices of the Board meetings, along with agenda and working papers, were circulated at least seven days before the meetings. The minutes of the meetings were appropriately recorded and circulated.
9. In accordance with the criteria specified in Code of Corporate Governance, six (6) Directors have obtained certification under Directors' Training Program (DTP) and one (1) Director' is exempted. All the Directors are fully conversant with their duties and responsibilities as Directors', they were further apprised through presentations during the year.
10. No new appointment of CFO and Company Secretary has been made during the year. However, head of internal auditor has been appointed and the remuneration and terms and conditions of his employment were approved by the Board.
Category Names
Independent Director Mr. Syed Moaz Mohiuddin
Executive Directors Mr. Shafqat Ellahi Shaikh
Non-Executive Directors Mr. Jamal Nasim (Nominee NIT) Mr. Shahzada Ellahi ShaikhMr. Shaukat Ellahi ShaikhMr. Raza Ellahi Shaikh
11. The Directors' Report for this year has been prepared in compliance with the requirements of the CCG and fully describes the salient matters required to be disclosed.
12. The financial statements of the Company were duly endorsed by CEO and CFO before approval of the Board.
13. The Directors, CEO and Executives do not hold any interest in the shares of the Company other than that disclosed in the pattern of shareholding.
14. The Company has complied with all the corporate and financial reporting requirements of the CCG.
15. The Board has formed an Audit Committee. It comprises three members, all members are Non-Executive Directors and the Chairman of the committee is an independent director.
16. The meetings of the Audit Committee were held at least once every quarter prior to approval of interim and final results of the Company and as required by the CCG. The terms of reference of the Committee have been formed and advised to the Committee for compliance.
17. The Board has formed an HR and Remuneration Committee. It comprises three members, all members are non-executive Directors including the Chairman.
18. The Board has set up an effective internal audit function. The staff is considered suitably qualified and experienced for the purpose and are conversant with the policies and procedures of the company.
19. The statutory auditors of the Company have confirmed that they have been given a satisfactory rating under the quality control review program of the ICAP, that they or any of the partners of the firm, their spouses and minor children do not hold shares of the Company and that the firm and all its partners are in compliance with International Federation of Accountants (IFAC) guidelines on code of ethics as adopted by the ICAP.
20. The statutory auditors or the persons associated with them have not been appointed to provide other services except in accordance with the listing regulations and the auditors have confirmed that they have observed IFAC guidelines in this regard.
21. The 'closed period', prior to the announcement of interim/final results, and business decisions, which may materially affect the market price of Company's securities, was determined and intimated to Directors, employees and stock exchange.
22. Material/price sensitive information has been disseminated among all market participants at once through stock exchange.
23. The company has complied with the requirements relating to maintenance of register of persons having access to inside information by designated senior management officer in a timely manner and maintained proper record including basis for inclusion or exclusion of names of persons from the said list.
24. We confirm that all other material principles enshrined in the CCG have been complied with.
Lahore: September 28, 2017
On behalf of the Board
Shafqat Ellahi Shaikh
Mg. Director (Chief Executive)

NAGINA
NAGINA GROUP
20
NAGINA
ELLCOT SPINNING MILLS LTD.
NAGINA GROUP
21
ANNUAL REPORT 2017
Mr. Amin Ellahi Shaikh
STATEMENT OF COMPLIANCE WITH THE CODE OF CORPORATE GOVERNANCEFOR THE YEAR ENDED JUNE 30, 2017
This statement is being presented to comply with the Code of Corporate Governance (CCG) contained in Chapter 5.19 of Rule Book of Pakistan Stock Exchange Limited for the purpose of establishing a framework of good governance, whereby a listed company is managed in compliance with the best practices of corporate governance.
The Company has applied the principles contained in the CCG in the following manner:
1. The Company encourages representation of Independent Non-Executive Directors and Directors representing minority interests on its Board of Directors. At present the Board includes:
The Independent Director meets the criteria of Independence under clause 5.19.1.(b) of the CCG
2. The Directors have confirmed that none of them is serving as a Director on more than seven listed companies, including this Company.
3. All the resident Directors of the Company are registered as taxpayers and none of them has defaulted in payment of any loan to a banking company, a DFI or an NBFI or, being a broker of a stock exchange, has been declared as a defaulter by that stock exchange.
4. During the financial year 2016-17, a casual vacancy occurred on the Board on September 20, 2016 and filled up by the board on September 29, 2016.
5. The Company has prepared a “Code of Conduct” and has ensured that appropriate steps have been taken to disseminate it throughout the Company along with its supporting policies and procedures.
6. The Board has developed a vision/mission statement, overall corporate strategy and significant policies of the Company. A complete record of particulars of significant policies along with the dates on which they were approved or amended has been maintained.
7. All the powers of the Board have been duly exercised and decisions on material transactions, including appointment and determination of remuneration and terms and conditions of employment of the CEO, other Executive and Non-Executive Directors, have been taken by the Board.
8. The meetings of the Board were presided over by the Chairman and, in his absence, by a Director elected by the Board for this purpose and the Board met at least once in every quarter. Written notices of the Board meetings, along with agenda and working papers, were circulated at least seven days before the meetings. The minutes of the meetings were appropriately recorded and circulated.
9. In accordance with the criteria specified in Code of Corporate Governance, six (6) Directors have obtained certification under Directors' Training Program (DTP) and one (1) Director' is exempted. All the Directors are fully conversant with their duties and responsibilities as Directors', they were further apprised through presentations during the year.
10. No new appointment of CFO and Company Secretary has been made during the year. However, head of internal auditor has been appointed and the remuneration and terms and conditions of his employment were approved by the Board.
Category Names
Independent Director Mr. Syed Moaz Mohiuddin
Executive Directors Mr. Shafqat Ellahi Shaikh
Non-Executive Directors Mr. Jamal Nasim (Nominee NIT) Mr. Shahzada Ellahi ShaikhMr. Shaukat Ellahi ShaikhMr. Raza Ellahi Shaikh
11. The Directors' Report for this year has been prepared in compliance with the requirements of the CCG and fully describes the salient matters required to be disclosed.
12. The financial statements of the Company were duly endorsed by CEO and CFO before approval of the Board.
13. The Directors, CEO and Executives do not hold any interest in the shares of the Company other than that disclosed in the pattern of shareholding.
14. The Company has complied with all the corporate and financial reporting requirements of the CCG.
15. The Board has formed an Audit Committee. It comprises three members, all members are Non-Executive Directors and the Chairman of the committee is an independent director.
16. The meetings of the Audit Committee were held at least once every quarter prior to approval of interim and final results of the Company and as required by the CCG. The terms of reference of the Committee have been formed and advised to the Committee for compliance.
17. The Board has formed an HR and Remuneration Committee. It comprises three members, all members are non-executive Directors including the Chairman.
18. The Board has set up an effective internal audit function. The staff is considered suitably qualified and experienced for the purpose and are conversant with the policies and procedures of the company.
19. The statutory auditors of the Company have confirmed that they have been given a satisfactory rating under the quality control review program of the ICAP, that they or any of the partners of the firm, their spouses and minor children do not hold shares of the Company and that the firm and all its partners are in compliance with International Federation of Accountants (IFAC) guidelines on code of ethics as adopted by the ICAP.
20. The statutory auditors or the persons associated with them have not been appointed to provide other services except in accordance with the listing regulations and the auditors have confirmed that they have observed IFAC guidelines in this regard.
21. The 'closed period', prior to the announcement of interim/final results, and business decisions, which may materially affect the market price of Company's securities, was determined and intimated to Directors, employees and stock exchange.
22. Material/price sensitive information has been disseminated among all market participants at once through stock exchange.
23. The company has complied with the requirements relating to maintenance of register of persons having access to inside information by designated senior management officer in a timely manner and maintained proper record including basis for inclusion or exclusion of names of persons from the said list.
24. We confirm that all other material principles enshrined in the CCG have been complied with.
Lahore: September 28, 2017
On behalf of the Board
Shafqat Ellahi Shaikh
Mg. Director (Chief Executive)

NAGINA
22
NAGINA GROUP
NAGINA
ELLCOT SPINNING MILLS LTD.
NAGINA GROUP
23
Annual General Meeting
The 29th Annual General Meeting of ELLCOT SPINNING MILLS LTD. will be held at the Registered Office of the Company, Nagina House, 91-B-1, M.M. Alam Road, Gulberg-III, Lahore-54660 on Friday, October 27, 2017 at 11:30 a.m.
Eligible shareholders are encouraged to participate and vote.
Ownership
On June 30, 2017, the Company has 497 Shareholders.
Web Reference
The Company maintains a functional website. Annual, half-yearly and quarterly reports are regularly posted at the Company's website: www.nagina.com
Dividend
The Board of Directors have recommended in their meeting held on September 28, 2017, payment of final cash dividend at the rate of Rs. 3.50 per share i.e. 35% for the year ended June 30, 2017.
MANDATORY PAYMENT OF CASH DIVIDEND THROUGH ELECTRONIC MODE:
In accordance with Section 242 of the Companies Act, 2017, any dividend payable in cash shall only be paid through electronic mode directly into the bank account designated by the entitled shareholder. Please note that given bank mandate for dividend payments is MANDATORY and in order to comply with this regulatory requirement and to avail the facility of direct credit of dividend amount in your bank account, you are requested to please provide the following particulars directly to the Company’s Share Registrar in case of physical shareholders and directly to the relevant Participant / CDC Investor Account Service in case of maintaining shareholding under Central Depository System (CDS).
In case of non-receipt of above information, the dividend shall be withheld.
SHAREHOLDERS’ INFORMATION
Signature of the Shareholder
It is stated that the above-mentioned information is correct, that I will intimate the changes in the above-mentioned information to the Company and the concerned Share Registrar as soon as these occur.
ANNUAL REPORT 2017
Detail of Bank Mandate
Name of Shareholder
Folio No. / CDC Account No.
Cell Number of Shareholder
Landline Number of Shareholder
E-mail address
Title of Bank Account of shareholder
International Bank Account Number (IBAN) “Mandatory”
PK _________________________ ( 24 digits)(kindly provide your accurate IBAN after consulting with your respective bank branch, in case of any error or omission in given IBAN, the company will not be held responsible in any manner for any loss or delay in your cash dividend payment).
Bank’s Name
Branch Name and Address
Branch Code
CNIC No. (copy attached)
NTN (in case of Corporate Entity)
In case of non-receipt of above information, the dividend shall be withheld.
Requirement of CNIC Number / National Tax Number (NTN) Certificate.
As has already notified from time to time, the Securities and Exchange Commission of Pakistan (SECP), vide Notification SRO 275(I)/2016 dated March 31, 2016 read with Notification SRO 19(I)/2014 dated January 10, 2014 and Notification SRO 831(I)2012 dated July 5, 2012 required that dividend warrants should bear Computerized National Identity Card (CNIC) number of the registered member.
Members who have not yet submitted copy of their valid Computerized National Identity Card (CNIC) / National Tax Number (NTN) Certificate (in case of Corporate Entity) are requested to submit the same at the earliest.
Copy of CNIC/NTN may be sent directly to the Share Registrar:
M/s Hameed Majeed Associates (Pvt.) Limited, 1st Floor, H.M. House, 7-Bank Square, Lahore. Ph # (+92-42) 37235081-82 Fax # (+92-42) 37358817
Henceforth, issuance of dividend warrant(s) will be subject to submission of CNIC (individuals) / NTN (corporate entities) by shareholders.
Deduction of Income Tax from Dividend under Section 150 of the Income Tax Ordinance, 2001 (“Income Tax Ordinance”).
Pursuant to the provisions of the Finance Act, 2017 with effect from July 1, 2017, the rates of deduction of income tax from dividend payments under the Income Tax Ordinance have been revised as follows:
(a) Rate of tax deduction for filer of income tax returns @15%
(b) Rate of tax deduction for non-filer of income tax returns @20%
All shareholders' of the Company who hold shares in physical form are therefore requested to send a valid copy of their CNIC (individuals) and NTN (Corporate entities) certificate to the Company's Share Registrar M/s. Hameed Majeed Associates (Pvt) Ltd. to allow the Company to ascertain the status of the shareholder.
Shareholders of the Company who hold shares in scrip-less form on Central Depository System (CDS) of Central Depository Company of Pakistan Ltd (CDC) are requested to send valid copies of their CNIC (individuals) and NTN (Corporate entities) certificate to their CDC Participants / CDC Investor Account Services.
Where the required documents are not submitted, the Company will be constrained to treat the non-complying shareholders as a non-filer thereby attracting a higher rate of withholding tax.
Further, according to clarification received from Federal Board of Revenue (FBR), with-holding tax will be determined separately on “Filer/ Non-Filer” status of Principal shareholder as well as joint-holder(s) based on their shareholding proportions, in case of joint accounts.
In this regard all shareholders who hold shares jointly are requested to provide shareholding proportions of principal shareholder and joint-holder(s) in respect of shares held by them to our Share Registrar, in writing, within 10 days of this notice, otherwise it will be assumed that the shares are equally held by principal shareholder and joint holder(s).

NAGINA
22
NAGINA GROUP
NAGINA
ELLCOT SPINNING MILLS LTD.
NAGINA GROUP
23
Annual General Meeting
The 29th Annual General Meeting of ELLCOT SPINNING MILLS LTD. will be held at the Registered Office of the Company, Nagina House, 91-B-1, M.M. Alam Road, Gulberg-III, Lahore-54660 on Friday, October 27, 2017 at 11:30 a.m.
Eligible shareholders are encouraged to participate and vote.
Ownership
On June 30, 2017, the Company has 497 Shareholders.
Web Reference
The Company maintains a functional website. Annual, half-yearly and quarterly reports are regularly posted at the Company's website: www.nagina.com
Dividend
The Board of Directors have recommended in their meeting held on September 28, 2017, payment of final cash dividend at the rate of Rs. 3.50 per share i.e. 35% for the year ended June 30, 2017.
MANDATORY PAYMENT OF CASH DIVIDEND THROUGH ELECTRONIC MODE:
In accordance with Section 242 of the Companies Act, 2017, any dividend payable in cash shall only be paid through electronic mode directly into the bank account designated by the entitled shareholder. Please note that given bank mandate for dividend payments is MANDATORY and in order to comply with this regulatory requirement and to avail the facility of direct credit of dividend amount in your bank account, you are requested to please provide the following particulars directly to the Company’s Share Registrar in case of physical shareholders and directly to the relevant Participant / CDC Investor Account Service in case of maintaining shareholding under Central Depository System (CDS).
In case of non-receipt of above information, the dividend shall be withheld.
SHAREHOLDERS’ INFORMATION
Signature of the Shareholder
It is stated that the above-mentioned information is correct, that I will intimate the changes in the above-mentioned information to the Company and the concerned Share Registrar as soon as these occur.
ANNUAL REPORT 2017
Detail of Bank Mandate
Name of Shareholder
Folio No. / CDC Account No.
Cell Number of Shareholder
Landline Number of Shareholder
E-mail address
Title of Bank Account of shareholder
International Bank Account Number (IBAN) “Mandatory”
PK _________________________ ( 24 digits)(kindly provide your accurate IBAN after consulting with your respective bank branch, in case of any error or omission in given IBAN, the company will not be held responsible in any manner for any loss or delay in your cash dividend payment).
Bank’s Name
Branch Name and Address
Branch Code
CNIC No. (copy attached)
NTN (in case of Corporate Entity)
In case of non-receipt of above information, the dividend shall be withheld.
Requirement of CNIC Number / National Tax Number (NTN) Certificate.
As has already notified from time to time, the Securities and Exchange Commission of Pakistan (SECP), vide Notification SRO 275(I)/2016 dated March 31, 2016 read with Notification SRO 19(I)/2014 dated January 10, 2014 and Notification SRO 831(I)2012 dated July 5, 2012 required that dividend warrants should bear Computerized National Identity Card (CNIC) number of the registered member.
Members who have not yet submitted copy of their valid Computerized National Identity Card (CNIC) / National Tax Number (NTN) Certificate (in case of Corporate Entity) are requested to submit the same at the earliest.
Copy of CNIC/NTN may be sent directly to the Share Registrar:
M/s Hameed Majeed Associates (Pvt.) Limited, 1st Floor, H.M. House, 7-Bank Square, Lahore. Ph # (+92-42) 37235081-82 Fax # (+92-42) 37358817
Henceforth, issuance of dividend warrant(s) will be subject to submission of CNIC (individuals) / NTN (corporate entities) by shareholders.
Deduction of Income Tax from Dividend under Section 150 of the Income Tax Ordinance, 2001 (“Income Tax Ordinance”).
Pursuant to the provisions of the Finance Act, 2017 with effect from July 1, 2017, the rates of deduction of income tax from dividend payments under the Income Tax Ordinance have been revised as follows:
(a) Rate of tax deduction for filer of income tax returns @15%
(b) Rate of tax deduction for non-filer of income tax returns @20%
All shareholders' of the Company who hold shares in physical form are therefore requested to send a valid copy of their CNIC (individuals) and NTN (Corporate entities) certificate to the Company's Share Registrar M/s. Hameed Majeed Associates (Pvt) Ltd. to allow the Company to ascertain the status of the shareholder.
Shareholders of the Company who hold shares in scrip-less form on Central Depository System (CDS) of Central Depository Company of Pakistan Ltd (CDC) are requested to send valid copies of their CNIC (individuals) and NTN (Corporate entities) certificate to their CDC Participants / CDC Investor Account Services.
Where the required documents are not submitted, the Company will be constrained to treat the non-complying shareholders as a non-filer thereby attracting a higher rate of withholding tax.
Further, according to clarification received from Federal Board of Revenue (FBR), with-holding tax will be determined separately on “Filer/ Non-Filer” status of Principal shareholder as well as joint-holder(s) based on their shareholding proportions, in case of joint accounts.
In this regard all shareholders who hold shares jointly are requested to provide shareholding proportions of principal shareholder and joint-holder(s) in respect of shares held by them to our Share Registrar, in writing, within 10 days of this notice, otherwise it will be assumed that the shares are equally held by principal shareholder and joint holder(s).

Requirement of Valid Tax Exemption Certificate for Claiming Exemption from Withholding Tax.
As per FBR Circulars C.No.1(29)WHT/2006 dated 30 June 2010 and C.No. 1(43)DG(WHT)/2008-VoI.II-66417-R dated 12 May 2015, the valid exemption certificate is mandatory to claim exemption of withholding tax U/S 150 of the Income Tax Ordinance, 2001 (tax on dividend amount) where the statutory exemption under Clause 47B of Part-IV of Second Schedule is available. The shareholders who fall in the category mentioned in above clause and want to avail exemption U/S 150 of the Ordinance, must provide valid Tax Exemption Certificate to our Share Registrar before book closure otherwise tax will be deducted on dividend as per applicable rates.
Zakat Declaration (Form CZ-50)
The Shareholders claiming exemption from deduction of Zakat are advised to submit their Zakat Declaration Form CZ-50 under Zakat and Usher Ordinance, 1980 & Rule 4 of Zakat (Deduction & Refund Rules), 1981 to our Share Registrar, M/s Hameed Majeed Associates (Pvt.) Limited, 1st Floor, H.M. House, 7-Bank Square, Lahore. The Shareholders while sending the Zakat Declarations must quote company name and their respective Folio Nos and /or CDC A/c Nos.
Electronic Transmission of Audited Financial Statements and Notice of Annual General Meeting (Notice) Through E-Mail (Optional)
Pursuant to SECP notification S.R.O 787(I)/ 2014 dated September 8, 2014, members, who hold shares in physical form, may inform the Company or Company's Share Registrar M/s. Hameed Majeed Associates (Pvt) Ltd., and who hold shares in scrip-less form on Central Depository System (CDS) of Central Depository Company of Pakistan Ltd (CDC) may inform their CDC Participants / CDC Investor Account Services, to receive the Audited Financial Statements and notices through e-mail by submitting Standard Request Form as given below:
REQUEST FORM FOR ELECTRONIC TRANSMISSION OFAUDITED FINANCIAL STATEMENTS AND NOTICE THROUGH E-MAIL
I n t e r m s o f S E C P n o t i f i c a t i o n S R O 7 8 7 ( I ) / 2 0 1 4 d a t e d S e p t e m b e r 8 , 2 0 1 4 , I , ________________________________________ hereby give my consent for electronic transmission of A u d i t e d F i n a n c i a l S t a t e m e n t s a n d N o t i c e t h r o u g h e - m a i l . M y e - m a i l a d d r e s s i s _____________________________.
I undertake that by sending the Audited Financial Statements and Notice through e-mail, by the Company, the Company shall be considered compliant with relevant requirements of sections 50, 158 and 233 of the Companies Ordinance, 1984.
It is stated that the above mentioned e-mail address is correct, that I will intimate the changes in the above mentioned e-mail address to the Company and the Share Registrar as soon as these occur.
_________________________________
Signature of the Shareholder.
Please send the above request form at the following address:
The Secretary,Ellcot Spinning Mills Ltd., Nagina House, 91-B-1, M.M. Alam Road, Gulberg-III, Lahore-54660.e-mail address: [email protected] M/s. Hameed Majeed Associates (Pvt.) Ltd.1st Floor, H.M. House, 7-Bank Square, Lahore.e-mail address: [email protected]
NAGINA
24
NAGINA GROUP
NAGINA
ELLCOT SPINNING MILLS LTD.
25
NAGINA GROUP
Investor Relations Contact
Mr. Syed Mohsin Gilani, Corporate SecretaryEmail: [email protected], Ph # (+92-42) 35756270, Fax: (+92-42) 35711856
Delivery of the Unclaimed / Undelivered Shares & Dividend
Members are requested to contact the Registered Office of the Company or the Share Registrar, M/s. Hameed Majeed Associates (Pvt) Ltd., 1st Floor, H.M. House, 7-Bank Square, Lahore, for collection of their unclaimed shares / unpaid dividend which they have not received due to any reasons.
ANNUAL REPORT 2017

NAGINA
26
NAGINA GROUP
Description Present Remuneration Remuneration After Increase
Remuneration Rs.497,462/= per month inclusive of 10% medical allowance.
Rs.572,081/= per Month inclusive of 10% medical allowance.
Other Benefits
Transport Two company maintained cars with drivers
No Change
Utilities Actual cost of utilities, i.e. gas, electricity and water at his residence and telecommunication facilities
No Change
Leave Fare Assistance (LFA)
Leave passage for self and family. No Change
Syed Mohsin GilaniCorporate SecretaryLahore : September 28, 2017
To: All members of the Company
NOTICE UNDER SECTION 218 OF THE COMPANIES ORDINANCE, 1984
In pursuance of Section 218 of the Companies Ordinance, 1984, the members of the Company are hereby informed that upon recommendation of Human Resource and Remuneration (HR&R) Committee, Board of Directors in their meeting held on September 28, 2017 has approved the increase in remuneration of Mr. Shafqat Ellahi Shaikh, Mg. Director (Chief Executive) effective from July 1, 2017 as under:
Remuneration of Mr. Shafqat Ellahi Shaikh, Mg. Director (Chief Executive)
NAGINA
ELLCOT SPINNING MILLS LTD.
NAGINA GROUP
27
PATTERN OF SHAREHOLDINGAS AT JUNE 30, 2017
CUIN (INCORPORATION NUMBER) 0018985
Total
From To Shares Held
223
1
100
7,123114
101
500
36,12558
501
1,000
47,17565
1,001
5,000
163,25316
5,001
10,000
114,5162
10,001
15,000
25,475-
15,001
20,000
-1
20,001
25,000
23,900-
25,001
40,000
-1
40,001
45,000
41,345-
45,001
60,000
-1
60,001
65,000
64,626-
65,001
190,000
-1
190,001
195,000
191,878-
195,001
215,000
-1
215,001
220,000
219,359-
220,001
240,000
-1
240,001
245,000
242,735-
245,001
280,000
-1
280,001
285,000
284,335-
285,001
370,000
-1
370,001
375,000
371,7431
625,001
630,000
628,4001
630,001
635,000
634,638-
635,001
660,000
-3
660,001
665,000
1,993,716-
665,001
695,000
-2
695,001
700,000
1,400,0001
700,001
705,000
704,380-
705,001
880,000
-1
880,001
885,000
883,554-
885,001
1,395,000
-1
1,395,001
1,400,000
1,400,0001
1,400,001
1,405,000
1,400,50071,224
497 Total:- 10,950,000
Categories of Shareholders Shares Held Percentage
Directors, Chief Executive Officer, and their Spouse
3,705,124 39.57
Associated Companies, Undertakings and Related Parties 2,663,461 24.33
NIT and ICP - 0.00
Banks, Development Finance Institutions, Non Banking
Finance Institutions 4,900 0.04
Insurance Companies 191,878 1.75
Modarabas and Mutual Funds 2,222,572 20.30
Shareholders Holding 10% or More 2,800,500 25.58
General Public
a. Local 2,087,366 19.06b. Foreign - 0.00
Others (Joint Stock Companies etc.) 74,699 0.68
Note:-
No. of
Shareholders
Shareholding
and Minor Children
M/s. Nagina Cotton Mils Ltd., had distributed 6,545,000 ordinary shares of M/s. Ellcot Spinning Mills Ltd., among its members, out of which 71,224 ordinary shares have yet to be transferred by the members of M/s. Nagina Cotton Mills Ltd., These shares have been shown under the head of "General Public".
ANNUAL REPORT 2017

28
NAGINA
NAGINA GROUP
INFORMATION UNDER CLAUSE XVI (J) OF THE CODE OF CORPORATEGOVERNANCE AS AT JUNE 30, 2017
Shares S # Name Held Percentage
1) Associated Companies, Undertaking and Related Parties
i) ELLAHI INTERNATIONAL (PVT) LTD. 41,345
0.38
ii) HAROON OMER (PVT) LTD. 664,572
6.07
iii) MONELL (PVT) LTD. 664,572
6.07
iv) ICARO (PVT) LTD. 664,572
6.07
v) ARH (PVT) LTD. 628,400 5.74
2,663,461 24.33
2) Mutual Fundsi) CDC - TRUSTEE AKD OPPORTUNITY FUND 634,638
5.80
ii) CDC - TRUSTEE NATIONAL INVESTMENT (UNIT) TRUST 704,380
6.43
iii) GOLDEN ARROW SELECTED STOCKS FUND LIMITED 883,554
8.07
2,222,572
20.30
3) Directors, Chief Executive Officer and their Spouse and Minor
Children
i) MR. SHAHZADA ELLAHI SHAIKH 242,735
2.22
ii) MR. SHAUKAT ELLAHI SHAIKH 371,743
3.39
iii) MR. SHAFQAT ELLAHI SHAIKH 284,335
2.60
iv) MR. RAZA ELLAHI SHAIKH 1,400,000
12.79
v) MR. AMIN ELLAHI SHAIKH 1,400,500
12.79
vi) MRS. HUMERA SHAHZADA ELLAHI SHEIKH 1,437
0.01
vii) MRS. MONA SHAUKAT SHAIKH 1,437
0.01
viii) MRS. SHAISTA SHAFQAT SHAIKH 1,437
0.01
ix) MR. JAMAL NASIM 1,000
0.01
x) MR. SYED MOAZ MOHIUDDIN 500
-
3,705,124
33.83
4) Executives 700,627
1.83
5) Public Sector Companies and Corporations Nil Nil
6)
196,778 1.80
7) Shareholders Holding Five Percent or More Voting Rights
i) MR. AMIN ELLAHI SHAIKH 1,400,500
12.79
ii) MR. RAZA ELLAHI SHAIKH 1,400,000
12.79
iii) GOLDEN ARROW SELECTED STOCKS FUND LIMITED 883,554
8.07
iv) CDC - TRUSTEE NATIONAL INVESTMENT (UNIT) TRUST 704,380
6.43
v) HAROON SHAHZADA ELLAHI SHAIKH 700,000
6.39
vi) OMER ELLAHI SHAIKH 700,000
6.39
vii) HAROON OMER (PVT) LTD. 664,572
6.07
viii) MONELL (PVT) LTD. 664,572
6.07
ix) ICARO (PVT) LTD. 664,572 6.07x) CDC - TRUSTEE AKD OPPORTUNITY FUND 634,638 5.80xi) ARH (PVT) LTD. 628,400 5.74
Banks, Development Financial Institutions, Non Banking Financial
Institutions, Insurance Companies, Takaful, Modarabas and Pension
Funds.
29
NAGINA
ELLCOT SPINNING MILLS LTD.
NAGINA GROUP
KEY FINANCIAL INFORMATION
ANNUAL REPORT 2017
2017 2016 20152014
restated
2013
restated
2012
restated
Sales Rs.'000
Gross profit Rs.'000
Operating profit Rs.'000
Profit before tax Rs.'000
Profit after tax Rs.'000
Share capital - paid up Rs.'000
Shareholders' equity Rs.'000
Total assets Rs.'000
Earning per share - pre tax Rs.
Earnings per share - after tax Rs.
Dividend per share Rs.
Market value per share as on 30 June Rs.
Gross profit to sales %
Operating profit to sales %
Profit before tax to sales %
Profit after tax to sales %
Current ratio
Total debt to total assets ratio %
Debt equity ratio %
4,868,596
316,950
178,853
121,013
77,671
109,500
1,449,024
3,353,777
11.05
7.09
3.50
103.40
6.51
3.67
2.49
1.60
1.69:1
56.79
28.12
4,227,910
245,286
110,353
59,490
71,165
109,500
1,418,482
2,870,296
5.43
6.50
3.50
73.39
5.80
2.61
1.41
1.68
2.08:1
50.58
30.72
4,588,788
291,992
150,505
90,206
54,299
109,500
1,384,687
2,377,522
8.24
4.96
3.50
65.00
6.36
3.28
1.97
1.18
2.68:1
41.76
23.80
5,709,484
594,188
445,410
361,435
297,571
109,500
1,407,543
2,366,450
33.01
27.18
7.00
73.95
10.41
7.80
6.33
5.21
2.66:1
40.52
22.07
4,858,426
654,883
503,634
422,423
350,335
109,500
1,251,396
2,185,275
38.58
31.99
10.00
64.89
13.48
10.37
8.69
7.21
2.27:1
42.74
24.47
4,025,287
432,740
329,154
200,010
146,404
109,500
969,180
1,852,202
18.27
13.37
5.00
26.00
10.75
8.18
4.97
3.64
1.67:1
47.67
26.61
YEAR ENDED 30TH JUNE

31
Russell Bedford
Rahman Sarfaraz Rahim Iqbal Rafiq, Chartered Accountants, is apartnership firm registered in Pakistan and a member of Russell Bedford International, a global network of independent accounting firms and consultants with affiliated offices worldwide.
Rahman Sarfaraz Rahim Iqbal Rafiq Chartered Accountants
72-A, Faisal Town, Lahore.
T:
F:
+92 42 35160431 - 35160432
+92 42 35160433
Auditors' Report to the Members
We have audited the annexed balance sheet of ELLCOT SPINNING MILLS LIMITED (“the Company”) as at June 30, 2017 and the related profit and loss account, statement of profit or loss and other comprehensive income, cash flow statement and statement of changes in equity together with the notes forming part thereof, for the year then ended and we state that we have obtained all the information and explanations which, to the best of our knowledge and belief, were necessary for the purpose of our audit.
It is the responsibility of the Company's management to establish and maintain a system of internal control, and prepare and present the above said statements in conformity with the approved accounting standards and the requirements of the Repealed Companies Ordinance, 1984. Our responsibility is to express an opinion on these statements based on our audit.
We conducted our audit in accordance with the auditing standards as applicable in Pakistan. These standards require that we plan and perform the audit to obtain reasonable assurance about whether the above said statements are free of any material misstatement. An audit includes examining on a test basis, evidence supporting the amounts and disclosures in the above said statements. An audit also includes assessing the accounting policies and significant estimates made by management, as well as, evaluating the overall presentation of the above said statements. We believe that our audit provides a reasonable basis for our opinion and, after due verification, we report that-
a) in our opinion, proper books of accounts have been kept by the Company as required by the Repealed Companies Ordinance, 1984;
b) in our opinion-
i. the balance sheet and profit and loss account together with the notes thereon have been drawn up in conformity with the Repealed Companies Ordinance, 1984, and are in agreement with the books of accounts and are further in accordance with accounting policies consistently applied;
ii. the expenditure incurred during the year was for the purpose of the Company's business; and
iii. the business conducted, investments made and the expenditure incurred during the year were in accordance with the objects of the Company;
c) in our opinion and to the best of our information and according to the explanations given to us, the balance sheet, profit and loss account, statement of profit or loss and other comprehensive income, cash flow statement and statement of changes in equity together with the notes forming part thereof conform with approved accounting standards as applicable in Pakistan, and, give the information required by the Repealed Companies Ordinance, 1984, in the manner so required and respectively give a true and fair view of the state of the Company's affairs as at June 30, 2017 and of the profit, other comprehensive income, its cash flows and changes in equity for the year then ended; and
d) in our opinion, Zakat deductible at source under the Zakat and Ushr Ordinance, 1980 (XVIII of 1980.), was deducted by the Company and deposited in the Central Zakat Fund established under section 7 of that ordinance.
RZ AA H
RIM
AF
I
R
Q
A
B
S
A
L
N
A
RA
M
F
H
I
AQ
R
CHARTERED
ACCOUNTANTSRAHMAN SARFARAZ RAHIM IQBAL RAFIQChartered Accountants
Engagement Partner: IRFAN RAHMAN MALIK
Lahore: September 28, 2017
30
Russell Bedford
Rahman Sarfaraz Rahim Iqbal Rafiq, Chartered Accountants, is apartnership firm registered in Pakistan and a member of Russell Bedford International, a global network of independent accounting firms and consultants with affiliated offices worldwide.
Rahman Sarfaraz Rahim Iqbal Rafiq Chartered Accountants
72-A, Faisal Town, Lahore.
T:
F:
+92 42 35160431 - 35160432
+92 42 35160433
Review Report on Statement of Compliance with Best practices of Code of Corporate Governance
We have reviewed the enclosed Statement of Compliance with the best practices contained in the Code of Corporate Governance ('the Code') prepared by the Board of Directors of ELLCOT SPINNING MILLS LIMITED for the year ended June 30, 2017 to comply with the requirements of Regulation No 5.19 of the Rule Book of Pakistan Stock Exchange Limited where the Company is listed.
The responsibility for compliance with the Code is that of the Board of Directors of the Company. Our responsibility is to review, to the extent where such compliance can be objectively verified, whether the Statement of Compliance reflects the status of the Company's compliance with the provisions of the Code and report if it does not and to highlight any non-compliance with the requirements of the Code. A review is limited primarily to inquiries of the Company's personnel and review of various documents prepared by the Company to comply with the Code.
As a part of our audit of the financial statements we are required to obtain an understanding of the accounting and internal control systems sufficient to plan the audit and develop an effective audit approach. We are not required to consider whether the Board of Directors' statement on internal control covers all risks and controls or to form an opinion on the effectiveness of such internal controls, the Company's corporate governance procedures and risks.
The Code requires the Company to place before the Audit Committee, and upon recommendation of the Audit Committee, place before the Board of Directors for their review and approval its related party transactions distinguishing between transactions carried out on terms equivalent to those that prevail in arm's length transactions and transactions which are not executed at arm's length price and recording proper justification for using such alternate pricing mechanism. We are only required and have ensured compliance of this requirement to the extent of the approval of the related party transactions by the Board of Directors upon recommendation of the Audit Committee. We have not carried out any procedures to determine whether the related party transactions were undertaken at arm's length price or not.
Based on our review, nothing has come to our attention which causes us to believe that the Statement of Compliance does not appropriately reflect the Company's compliance, in all material respects, with best practices contained in the Code as applicable to the Company for the year ended June 30, 2017.
RZ AA H
RIM
AF
I
R
Q
A
B
S
A
L
N
A
RA
M
F
H
I
AQ
R
CHARTERED
ACCOUNTANTSRAHMAN SARFARAZ RAHIM IQBAL RAFIQChartered Accountants
Engagement Partner: IRFAN RAHMAN MALIK
Lahore: September 28, 2017

NAGINA
NAGINA GROUP
ELLCOT SPINNING MILLS LTD.
33
NAGINA GROUP
Mg. Director (Chief Executive)
Shafqat Ellahi Shaikh
ASSETS
NON-CURRENT ASSETS
Fixed assets 17 1,172,920,884 1,213,576,874
Long term deposits 18 7,090,700 7,090,700
1,180,011,584 1,220,667,574
CURRENT ASSETS
Stores, spares and loose tools 19 38,689,803
43,623,721
Stock in trade 20 850,294,545 738,170,879
Trade debts 21 390,184,845 281,423,824
Advances, prepayments and other receivables 22 260,170,428 206,010,087
Short term investments 23 546,042,499 119,964,290
Advance income tax 24 72,443,909
84,239,692
Cash and bank balances 25 15,939,035
176,195,561
2,173,765,064 1,649,628,054
TOTAL ASSETS 3,353,776,648 2,870,295,628
The annexed notes from 1 to 52 form an integral part of these financial statements.
Note 2017 2016
Rupees Rupees
BALANCE SHEETAS AT JUNE 30, 2017
NAGINA
32
NAGINA GROUP
BALANCE SHEETAS AT JUNE 30, 2017
Lahore: September 28, 2017
ANNUAL REPORT 2017
EQUITY AND LIABILITIES
SHARE CAPITAL AND RESERVES
Authorized capital
20,000,000 (2016: 20,000,000) ordinary shares of Rs. 10 each
Issued, subscribed and paid-up capital
Capital reserve
Accumulated profit
TOTAL EQUITY
LIABILITIES
NON-CURRENT LIABILITIES
Long term finances
Liabilities against assets subject to finance lease
Employees retirement benefits
Deferred taxation
CURRENT LIABILTIES
Trade and other payables
Accrued interest/markup
Short term borrowings
Current portion of non-current liabilities
TOTAL LIABILITIES
CONTINGENCIES AND COMMITMENTS
TOTAL EQUITY AND LIABILITIES
The annexed notes from 1 to 52 form an integral part of these financial statements.
Note 2017 2016
Rupees Rupees
200,000,000 200,000,000
6 109,500,000 109,500,000
7 (2,744,398)
8,212,161
1,342,268,486 1,300,769,538
1,449,024,088 1,418,481,699
8 494,645,971 539,712,204
9 -
-
10 70,670,998 66,908,522
11 51,142,039 52,031,536
616,459,008 658,652,262
12 275,941,173 239,845,121
13 17,411,243 11,201,552
14 922,677,657 452,833,638
15 72,263,479 89,281,356
1,288,293,552 793,161,667
1,904,752,560 1,451,813,929
16
3,353,776,648 2,870,295,628
Director
Shahzada Ellahi Shaikh

NAGINA
NAGINA GROUP
ELLCOT SPINNING MILLS LTD.
33
NAGINA GROUP
Mg. Director (Chief Executive)
Shafqat Ellahi Shaikh
ASSETS
NON-CURRENT ASSETS
Fixed assets 17 1,172,920,884 1,213,576,874
Long term deposits 18 7,090,700 7,090,700
1,180,011,584 1,220,667,574
CURRENT ASSETS
Stores, spares and loose tools 19 38,689,803
43,623,721
Stock in trade 20 850,294,545 738,170,879
Trade debts 21 390,184,845 281,423,824
Advances, prepayments and other receivables 22 260,170,428 206,010,087
Short term investments 23 546,042,499 119,964,290
Advance income tax 24 72,443,909
84,239,692
Cash and bank balances 25 15,939,035
176,195,561
2,173,765,064 1,649,628,054
TOTAL ASSETS 3,353,776,648 2,870,295,628
The annexed notes from 1 to 52 form an integral part of these financial statements.
Note 2017 2016
Rupees Rupees
BALANCE SHEETAS AT JUNE 30, 2017
NAGINA
32
NAGINA GROUP
BALANCE SHEETAS AT JUNE 30, 2017
Lahore: September 28, 2017
ANNUAL REPORT 2017
EQUITY AND LIABILITIES
SHARE CAPITAL AND RESERVES
Authorized capital
20,000,000 (2016: 20,000,000) ordinary shares of Rs. 10 each
Issued, subscribed and paid-up capital
Capital reserve
Accumulated profit
TOTAL EQUITY
LIABILITIES
NON-CURRENT LIABILITIES
Long term finances
Liabilities against assets subject to finance lease
Employees retirement benefits
Deferred taxation
CURRENT LIABILTIES
Trade and other payables
Accrued interest/markup
Short term borrowings
Current portion of non-current liabilities
TOTAL LIABILITIES
CONTINGENCIES AND COMMITMENTS
TOTAL EQUITY AND LIABILITIES
The annexed notes from 1 to 52 form an integral part of these financial statements.
Note 2017 2016
Rupees Rupees
200,000,000 200,000,000
6 109,500,000 109,500,000
7 (2,744,398)
8,212,161
1,342,268,486 1,300,769,538
1,449,024,088 1,418,481,699
8 494,645,971 539,712,204
9 -
-
10 70,670,998 66,908,522
11 51,142,039 52,031,536
616,459,008 658,652,262
12 275,941,173 239,845,121
13 17,411,243 11,201,552
14 922,677,657 452,833,638
15 72,263,479 89,281,356
1,288,293,552 793,161,667
1,904,752,560 1,451,813,929
16
3,353,776,648 2,870,295,628
Director
Shahzada Ellahi Shaikh

NAGINA
34
NAGINA GROUP
PROFIT AND LOSS ACCOUNTFOR THE YEAR ENDED JUNE 30, 2017
Mg. Director (Chief Executive)
Shafqat Ellahi Shaikh
Lahore: September 28, 2017
ANNUAL REPORT 2017
Sales - net 26
Cost of sales 27 (4,551,646,739)
Gross profit
Distribution cost 28
Administrative expenses 29
Other expenses 30
(159,540,466)
Other income 31
Operating profit
Finance cost 32
Profit before taxation
Provision for taxation 33
Profit after taxation
Earnings per share - basic and diluted 34
4,868,596,391
316,949,652
(32,358,768)
(111,527,721)
(15,653,977)
157,409,186
21,444,276
178,853,462
(57,840,774)
121,012,688
(43,341,764)
77,670,924
7.09
The annexed notes from 1 to 52 form an integral part of these financial statements.
Note 2017
Rupees
2016
Rupees
4,227,909,980
(3,982,624,034)
245,285,946
(37,709,495)
(103,088,628)
(5,599,443)
(146,397,566)
98,888,380
11,464,254
110,352,634
(50,863,109)
59,489,525
11,675,020
71,164,545
6.50
Director
Shahzada Ellahi Shaikh
NAGINA
ELLCOT SPINNING MILLS LTD.
35
STATEMENT OF PROFIT OR LOSS AND OTHER COMPREHENSIVE INCOMEFOR THE YEAR ENDED JUNE 30, 2017
Mg. Director (Chief Executive)
Shafqat Ellahi Shaikh
Lahore: September 28, 2017
Items that may be reclassified subsequently to profit or loss
Changes in fair value of available for sale financial assets 23
Taxation relating to changes in fair value of available for sale financial assets 11.1
Items that will not be reclassified to profit or loss
Remeasurements of defined benefit obligation 10.1
Taxation relating to remeasurements of defined benefit obligation 11.1
Other comprehensive (loss)/income
Profit after taxation
Total comprehensive income
531,954
(79,793)
452,161
597,269
(94,194)
503,075
955,236
71,164,545
72,119,781
The annexed notes from 1 to 52 form an integral part of these financial statements.
Note 2017
Rupees
2016
Rupees
(12,890,069)
1,933,510
(10,956,559)
2,655,119
(502,095)
2,153,024
(8,803,535)
77,670,924
68,867,389
Shahzada Ellahi Shaikh
Director

NAGINA
NAGINA GROUP
36
NAGINA GROUP
CASH FLOW STATEMENTFOR THE YEAR ENDED JUNE 30, 2017
ANNUAL REPORT 2017
CASH FLOW FROM OPERATING ACTIVITIES
Cash generated/(used in) from operations
Payments for:
Employees retirement benefits
Interest/markup/profit on borrowings
Income tax
Net cash used in operating activities
CASH FLOW FROM INVESTING ACTIVITIES
Purchase of property, plant and equipment
Proceeds from disposal of property, plant and equipment
Purchase of short term investments
Proceeds from disposal of short term investments
Dividend received
Net cash used in investing activities
CASH FLOW FROM FINANCING ACTIVITIES
Long term finances obtained
Repayment of long term finances
Repayment of liabilities against assets subject to finance lease
Net increase in short term borrowings
Dividend paid
Net cash generated from financing activities
NET (DECREASE)/INCREASE IN CASH AND CASH EQUIVALENTS
EFFECT OF EXCHANGE RATE CHANGES ON CASH AND CASH EQUIVALENTS
CASH AND CASH EQUIVALENTS AT BEGINNING OF THE YEAR
CASH AND CASH EQUIVALENTS AT THE END OF THE YEAR
The annexed notes from 1 to 52 form an integral part of these financial statements.
Note 2017 2016
Rupees Rupees
35 79,153,429 (95,837,442)
(18,498,021) (11,927,226)
(48,483,867) (45,339,048)
(31,004,063)
(46,339,718)
(18,832,522)
(199,443,434)
(99,164,178)
(303,950,822)
6,908,001
4,715,959
(654,698,728)
(914,395,330)
218,545,684
973,404,637
17,808,798
1,742,500
(510,600,423)
(238,483,056)
52,148,841
272,476,463
(113,124,166)
(72,040,831)
(1,108,785)
(3,938,271)
469,217,314
306,980,355
(37,956,785)
(38,032,133)
369,176,419
465,445,583
(160,256,526)
27,519,093
-
1,864
176,195,561
148,674,604
36 15,939,035
176,195,561
Mg. Director (Chief Executive)
Shafqat Ellahi Shaikh
Lahore: September 28, 2017 Director
Shahzada Ellahi Shaikh
NAGINA
NAGINA GROUP
ELLCOT SPINNING MILLS LTD.
37
NAGINA GROUP
STATEMENT OF CHANGES IN EQUITYFOR THE YEAR ENDED JUNE 30, 2017
Share capital
Changes in
Issued fair value of
subscribed and available for sale Reserve on Accumulated Total
paid-up capital financial assets merger Total profit equity
Rupees Rupees Rupees Rupees Rupees Rupees
Balance as at July 01, 2015 109,500,000
-
7,760,000
7,760,000
1,267,426,918 1,384,686,918
Comprehensive income
Profit after taxation -
-
-
- 71,164,545 71,164,545
Other comprehensive lncome -
452,161
-
452,161
503,075 955,236
Total comprehensive income -
452,161
-
452,161
71,667,620 72,119,781
Transaction with owners
Final dividend @ 35% i.e. Rs. 3.5 per ordinary share -
-
-
- (38,325,000) (38,325,000)
Balance as at June 30, 2016 109,500,000
452,161
7,760,000
8,212,161
1,300,769,538 1,418,481,699
Balance as at July 01, 2016 109,500,000
452,161
7,760,000
8,212,161
1,300,769,538 1,418,481,699
Comprehensive income
Profit after taxation -
-
-
- 77,670,924 77,670,924
Other comprehensive income/(loss) -
(10,956,559)
-
(10,956,559)
2,153,024 (8,803,535)
Total comprehensive income/(loss) -
(10,956,559)
-
(10,956,559)
79,823,948 68,867,389
Transaction with owners
Final dividend @ 35% i.e. Rs. 3.5 per ordinary share -
-
-
-
(38,325,000) (38,325,000)
Balance as at June 30, 2017 109,500,000
(10,504,398)
7,760,000
(2,744,398)
1,342,268,486 1,449,024,088
The annexed notes from 1 to 52 form an integral part of these financial statements.
Capital reserves
Mg. Director (Chief Executive)
Shafqat Ellahi Shaikh
Lahore: September 28, 2017
Shahzada Ellahi Shaikh
Director

NAGINA
NAGINA GROUP
ELLCOT SPINNING MILLS LTD.
39
2.3.6 Provisions (see note 5.15)
Provisions are based on best estimate of the expenditure required to settle the present obligation at the reporting date, that is, the amount that the Company would rationally pay to settle the obligation at the reporting date or to transfer it to a third party.
2.3.7 Net realizable values of stock in trade (see note 5.5)
The company estimates net realizable values of its stock in trade as the estimated selling price in the ordinary course of business less estimated costs of completion and estimated costs necessary to make the sale.
2.4 Functional currency
These financial statements have been prepared in Pak Rupees which is the Company's functional currency.
3 NEW AND REVISED STANDARDS, INTERPRETATIONS AND AMENDMENTS EFFECTIVE DURING THE YEAR.
The following new and revised standards, interpretations and amendments are effective in the current year but are either not relevant to the Company or their application does not have any material impact on the financial statements of the Company other than presentation and disclosures.
IFRS 14 – Regulatory Deferral Accounts (2014)
The standard permits an entity which is a first-time adopter of International Financial Reporting Standards to continue to account, with some limited changes, for 'regulatory deferral account balances' in accordance with its previous GAAP, both on initial adoption of IFRS and in subsequent financial statements.
Equity Method in Separate Financial Statements (Amendments to IAS 27 - Separate Financial Statements)
IAS 27 - Separate Financial Statements has been amended to permit investments in subsidiaries, joint ventures and associates to be optionally accounted for using the equity method in separate financial statements.
Accounting for Acquisitions of Interests in Joint Operations (Amendments to IFRS 11 – Joint Arrangements)
IFRS 11 - Joint Arrangements has been amended to require an acquirer of an interest in a joint operation in which the activity constitutes a business (as defined in IFRS 3 Business Combinations) to:
- Apply all of the business combinations accounting principles in IFRS 3 - Business Combinations and other IFRSs, except for those principles that conflict with the guidance in IFRS 11.
- Disclose the information required by IFRS 3 - Business Combinations and other IFRSs for business combinations.
The amendments apply both to the initial acquisition of an interest in joint operation, and the acquisition of an additional interest in a joint operation (in the latter case, previously held interests are not remeasured).
Clarification of Acceptable Methods of Depreciation and Amortization (Amendments to IAS 16 – Property, Plant and Equipment and IAS 38 – Intangible Assets)
IAS 16 - Property, Plant and Equipment and IAS 38 - Intangible Assets have been amended to:
- Clarify that a depreciation method that is based on revenue that is generated by an activity that includes the use of an asset is not appropriate for property, plant and equipment.
- Introduce a rebuttable presumption that an amortisation method that is based on the revenue generated by an activity that includes the use of an intangible asset is inappropriate, which can only be overcome in limited circumstances where the intangible asset is expressed as a measure of revenue, or when it can be demonstrated that revenue and the consumption of the economic benefits of the intangible asset are highly correlated.
- Add guidance that expected future reductions in the selling price of an item that was produced using an asset could indicate the expectation of technological or commercial obsolescence of the asset, which, in turn, might reflect a reduction of the future economic benefits embodied in the asset.
Investment Entities: Applying the Consolidation Exception (Amendments to IFRS 10 - Consolidated Financial Statements, IFRS 12 - Disclosure of Interests in Other Entities, IAS 28 - Accounting for Investments in Associates and Joint Ventures)
The amendments address issues that have arisen in the context of applying the consolidation exception for investment entities.
Agriculture: Bearer Plants (Amendments to IAS 16 – Property, Plant and Equipment and IAS 41 – Agriculture)
IAS 16 - Property, Plant and Equipment and IAS 41 - Agriculture have been amended to:
- Include 'bearer plants' within the scope of IAS 16 rather than IAS 41, allowing such assets to be accounted for a property, plant and equipment and measured after initial recognition on a cost or revaluation basis in accordance with IAS 16.
- Introduce a definition of 'bearer plants' as a living plant that is used in the production or supply of agricultural produce, is expected to bear produce for more than one period and has a remote likelihood of being sold as agricultural produce, except for incidental scrap sales.
- Clarify that produce growing on bearer plants remains within the scope of IAS 41.
NAGINA
NAGINA GROUP
38
NOTES TO AND FORMING PART OF FINANCIAL STATEMENTSFOR THE YEAR ENDED JUNE 30, 2017
1 REPORTING ENTITY
Ellcot Spinning Mills Limited ('the Company') is incorporated in Pakistan as a Public Limited Company under the Companies Ordinance, 1984 and is listed on Pakistan Stock Exchange Limited. The Company is a spinning unit engaged in the manufacture and sale of yarn. The registered office of the Company is situated at Nagina House, 91-B-1, M.M. Alam Road, Gulberg III, Lahore. The manufacturing facility is located in District Kasur in the Province of Punjab.
2 BASIS OF PREPARATION
2.1 Statement of compliance
During the year, the Companies Act 2017 ('the Act') has been promulgated, however, Securities and Exchange Commission of Pakistan vide its circular no. 17 of 2017 dated July 20, 2017 communicated that the Commission has decided that the companies whose financial year closes on or before June 30, 2017 shall prepare their financial statements in accordance with the provisions of the repealed Companies Ordinance, 1984. Accordingly, these financial statements have been prepared in accordance with approved accounting standards as applicable in Pakistan. Approved accounting standards comprise of such International Financial Reporting Standards ('IFRSs') issued by the International Accounting Standards Board ('IASB') and Islamic Financial Accounting Standards ('IFASs') issued by the Institute of Chartered Accountants of Pakistan ('ICAP') as are notified under the repealed Companies Ordinance, 1984, provisions of and directives issued under the repealed Companies Ordinance, 1984. In case requirements differ, the provisions or directives of the repealed Companies Ordinance, 1984 shall prevail.
2.2 Basis of measurement
These financial statements have been prepared under the historical cost convention except for employees retirement benefits liabilities measured at present value and certain financial instruments measured at fair value/amortized cost. In these financial statements, except for the amounts reflected in the cash flow statement, all transactions have been accounted for on accrual basis.
2.3 Judgments, estimates and assumption
The preparation of financial statements requires management to make judgments, estimates and assumptions that affect the application of accounting policies and the reported amounts of assets, liabilities, income and expenses. The estimates and associated assumptions and judgments are based on historical experience and various other factors that are believed to be reasonable under the circumstances, the result of which forms the basis of making judgments about carrying values of assets and liabilities that are not readily apparent from other sources. Subsequently, actual results may differ from these estimates. Estimates and underlying assumptions are reviewed on an ongoing basis. Revisions to accounting estimates are recognized in the period in which the estimate is revised and in any future periods affected. There are no estimation uncertainties as at the reporting date. Judgments made by management in the application of approved accounting standards that have significant effect on the financial statements and estimates with a risk of material adjustment in subsequent years are as follows:
2.3.1 Depreciation method, rates and useful lives of operating fixed assets (see note 5.1.1)
The Company reassesses useful lives, depreciation method and rates for each item of operating fixed assets annually by considering expected pattern of economic benefits that the Company expects to derive from that item.
2.3.2 Amortization method, rates and useful lives of intangible assets (see note 5.2)
The Company reassesses useful lives, amortization method and rates for each intangible asset annually by considering expected pattern of economic benefits that the Company expects to derive from that asset.
2.3.3 Recoverable amount and impairment (see note 5.25)
The management of the Company reviews carrying amounts of its assets for possible impairment and makes formal estimates of recoverable amount if there is any such indication.
2.3.4 Obligation under defined benefit plan (see note 5.6.2)
The Company's obligation under the defined benefit plan is based on assumptions of future outcomes, the principal ones being in respect of increases in remuneration, remaining working lives of employees and discount rates to be used to determine present value of defined benefit obligation. These assumptions are determined periodically by independent actuaries.
2.3.5 Taxation (see note 5.20)
The Company takes into account the current income tax law and decisions taken by appellate and other relevant legal forums while estimating its provision for current tax. Provision for deferred tax is estimated after taking into account historical and expected future turnover and profit trends and their taxability under the current tax law.
ANNUAL REPORT 2017

NAGINA
NAGINA GROUP
40
Disclosure initiative (Amendments to IAS 1 - Presentation of Financial Statements)
IAS 1 Presentation of Financial Statements has been amended to address perceived impediments to preparers exercising their judgement in presenting their financial reports by making the following changes:
- Clarification that information should not be obscured by aggregating or by providing immaterial information, materiality considerations apply to the all parts of the financial statements, and even when a standard requires a specific disclosure, materiality considerations do apply;
- Clarification that the list of line items to be presented in these statements can be disaggregated and aggregated as relevant and additional guidance on subtotals in these statements and clarification that an entity's share of OCI of equity-accounted associates and joint ventures should be presented in aggregate as single line items based on whether or not it will subsequently be reclassified to profit or loss;
- Additional examples of possible ways of ordering the notes to clarify that understand ability and comparability should be considered when determining the order of the notes and to demonstrate that the notes need not be presented in the order so far listed in paragraph 114 of IAS 1.
4 NEW AND REVISED STANDARDS, INTERPRETATIONS AND AMENDMENTS NOT YET EFFECTIVE.
The following standards, interpretations and amendments are in issue which are not effective as at the reporting date and have not been early adopted by the Company.
ANNUAL REPORT 2017
Effective date
(annual periods beginning
on or after)
January 01, 2017
January 01, 2017
January 01, 2018
IFRS 15 – Revenue from Contracts with Customers (2014) January 01, 2018
IFRS 16 – Leases (2016) January 01, 2019
IFRS 17 – Insurance contracts (2017) January 01, 2021
Deferred Indefinitely
Clarifications to IFRS 15 - Revenue from Contracts with Customers January 01, 2018
January 01, 2018
January 01, 2019
January 01, 2018
January 01, 2018
January 01, 2018
January 01, 2018
July 01, 2017
Applying IFRS 9 'Financial Instruments' with IFRS 4 'Insurance Contracts'
(Amendments to IFRS 4 - Insurance Contracts)
Transfers of Investment Property (Amendments to IAS 40 - Investment Property)
Recognitionof Deferred Tax Assets for Unrealized Losses (Amendments to IAS 12 -
Income Taxes)
Disclosure initiative (Amendments to IAS 7 - Statement of Cash Flows)
IFRS 9 – Financial Instruments (2014)
Sale or contribution of assets between an Investor and its Associate or Joint Venture
(Amendments to IFRS 10 - Consolidated Financial Statements and IAS 28 -
Investments in Associates and Joint Ventures).
IFRIC 22 - Foreign Currency Transactions and Advances Consideration
IFRIC 23 - Uncertainty over Income Tax Treatments
Classification and Measurementof Share-based Payment Transactions (Amendments
to IFRS 2 - Share-based Payment)
Annual Improvements to IFRS 2014–2016 Cycle
Companies Act, 2017
The Company intends to adopt these new and revised standards, interpretations and amendments on their effective dates, subject to, where required, notification by Securities and Exchange Commission of Pakistan regarding their adoption. The management anticipates that, except as stated below, the adoption of the above standards, amendments and interpretations in future periods, will have no material impact on the Company's financial statements other than in presentation/disclosures.
IFRS 9 – Financial Instruments: Classification and Measurement (2014)
IFRS 9 replaces IAS 39 - Financial Instruments: Recognition and Measurement. The standard contains requirements in the following areas:
- Classification and measurement: Financial assets are classified by reference to the business model within which they are held and their cash flow characteristics. The standard introduces a 'fair value through comprehensive income' category for certain debt instruments. Financial liabilities are classified in a similar manner to under IAS 39, however there are differences in the requirements applying to measurement of entity's own credit risk.
NAGINA
NAGINA GROUP
ELLCOT SPINNING MILLS LTD.
41
- Impairment: IFRS 9 introduces an 'expected credit loss' model for the measurement of the impairment of financial assets, so it is no longer necessary for a credit loss to have occurred before a credit loss is recognized.
- Hedge accounting: IFRS 9 introduces a new hedge accounting model that is designed to be more closely aligned with how entities undertake risk management activities when hedging financial and non-financial risk exposure.
- Derecognition: The requirements for the derecognition of financial assets and liabilities are carried forward from IAS 39.
Adoption of this IFRS 9 may result in material adjustment to carrying amounts of financial assets and liabilities. However, the financial impact of the same cannot be estimated with reasonable certainty at this stage.
IFRS 15 – Revenue from Contracts with Customers (2014)
IFRS 15 provides a single, principles based five-step model to be applied to all contracts with customer.
- Identify the contract with customer.
- Identify the performance obligations in the contract.
- Determine the transaction price.
- Allocate the transaction price to the performance obligations in the contracts.
- Recognized revenue when or as the entity satisfies a performance obligation.
Adoption of this IFRS 15 may result in material adjustment to carrying amounts of contract revenue, expenses, assets and liabilities. However, the financial impact of the same cannot be estimated with reasonable certainty at this stage.
IFRS 16 – Leases (2016)
IFRS 16 specifies how an entity will recognize, measure, present and disclose leases. The standard provides a single lessee accounting model, requiring lessees to recognize assets and liabilities for all leases unless the leases term is twelve months or less or the underlying asset has low value.
Adoption of this IFRS 16 will result in recognition of assets and liabilities for all operating leases for which the lease terms is more than twelve months. However, the financial impact of the same cannot be estimated with reasonable certainty at this stage.
5 SIGNIFICANT ACCOUNTING POLICIES
The accounting policies set out below have been applied consistently to all periods presented in these financial statements.
5.1 Property, plant and equipment
5.1.1 Operating fixed assets
Operating fixed assets accounted for under the cost model and are measured at cost less accumulated depreciation and accumulated impairment losses with the exception of freehold land, which is stated at cost less accumulated impairment losses. Cost comprises purchase price, including import duties and non-refundable purchase taxes, after deducting trade discounts and rebates, and includes other costs directly attributable to the acquisition or construction, erection and installation.
Major renewals and improvements to operating fixed assets are recognized in the carrying amount of the item if it is probable that the embodied future economic benefits will flow to the Company and the cost of renewal or improvement can be measured reliably. The cost of the day-to-day servicing of operating fixed assets are recognized in profit or loss as incurred.`
The Company recognizes depreciation in profit or loss by applying reducing balance method over the useful life of each operating fixed asset using rates specified in note 17.1 to the financial statements. Depreciation on additions to operating fixed assets is charged from the month in which the item becomes available for use. Depreciation is discontinued from the month in which it is disposed or classified as held for disposal.
An operating fixed asset is de-recognized when permanently retired from use. Any gain or loss on disposal of operating fixed assets is recognized in profit or loss.
5.1.2 Capital work in progress
Capital work in progress is stated at cost less identified impairment loss, if any, and includes the cost of material, labour and appropriate overheads directly relating to the construction, erection or installation of an item of operating fixed assets. These costs are transferred to operating fixed assets as and when related items become available for intended use.
5.2 Intangible assets
An intangible asset is recognized when it is probable that the expected future economic benefits that are attributable to the asset will flow to the entity and the cost of the asset can be measured reliably.
In assessing the probability of expected future economic benefits the Company uses reasonable and supportable assumptions that represents management's best estimate of the set of economic conditions that will exist over the useful life of the asset.

NAGINA
NAGINA GROUP
42
An intangible asset is measured initially at cost. The cost of intangible asset acquired comprises its purchase price, including import duties and non-refundable purchase taxes, after deducting trade discounts and rebates, and includes other costs directly attributable to the acquisition. Costs incurred after the asset is in the condition necessary for it to operate in the manner intended by the management are recognized in profit or loss. Subsequent to initial recognition, intangible assets are measured at cost less accumulated amortization and accumulated impairment losses, if any.
Intangible assets are amortized over the estimated period over which the Company expects to obtain economic benefits, on a straight line basis. All intangible assets are tested for impairment at each reporting date.
5.3 Software
The cost of acquisition, development and installation of identifiable software products having finite useful lives of more than one year is recognized as an intangible asset at cost. Subsequent to initial recognition, it is measured at cost less accumulated amortization and accumulated impairment losses, if any.
5.4 Stores, spares and loose tools
These are generally held for internal use and are valued at cost. Cost is determined on the basis of weighted average except for items in transit, which are valued at invoice price plus related cost incurred up to the reporting date. For items which are considered obsolete, the carrying amount is written down to nil. Spare parts held exclusively for capitalization are classified as property, plant and equipment.
5.5 Stock in trade
These are valued at lower of cost and net realizable value, with the exception of stock of waste which is valued at net realizable value. Cost is determined using the following basis:
Raw materials Weighted average cost Work in process Average manufacturing cost Finished goods Average manufacturing cost Stock in transit Invoice price plus related cost incurred up to the reporting date
Average manufacturing cost in relation to work in process and finished goods consists of direct material, labour and an appropriate proportion of manufacturing overheads.
Net realizable value signifies the estimated selling price in the ordinary course of business less estimated costs of completion and estimated costs necessary to make the sale.
5.6 Employee benefits
5.6.1 Short-term employee benefits
The Company recognizes the undiscounted amount of short term employee benefits to be paid in exchange for services rendered by employees as a liability after deducting amount already paid and as an expense in profit or loss unless it is included in the cost of inventories or property, plant and equipment as permitted or required by the approved accounting standards. If the amount paid exceeds the undiscounted amount of benefits, the excess is recognized as an asset to the extent that the prepayment would lead to a reduction in future payments or cash refund.
5.6.2 Post-employment benefits
The Company operates an unfunded gratuity scheme (defined benefit plan) for all its employees who have completed the minimum qualifying service period. Liability is adjusted on each reporting date to cover the obligation and the adjustment is charged to profit or loss with the exception of remeasurements which are recognized in other comprehensive income. The amount recognized on balance sheet represents the present value of defined benefit obligation. The details of the scheme are referred to in note 10 to the financial statements.
5.7 Financial instruments
5.7.1 Recognition
A financial instrument is recognized when the Company becomes a party to the contractual provisions of the instrument.
5.7.2 Classification
The Company classifies its financial instruments into following classes depending on the purpose for which the financial assets and liabilities are acquired or incurred. The Company determines the classification of its financial assets and liabilities on initial recognition.
ANNUAL REPORT 2017
(a) Loans and receivables
Non-derivative financial assets with fixed or determinable payments that are not quoted in an active market are classified as loans and receivables. Assets in this category are presented as current assets except for maturities greater than twelve months from the reporting date, where these are presented as non-current assets.
(b) Financial assets at fair value through profit or loss
Financial assets at fair value through profit or loss are financial assets that are either designated as such on initial recognition or are classified as held for trading. Financial assets are designated as financial assets at fair value through profit or loss if the Company manages such assets and evaluates their performance based on their fair value in accordance with the Company’s risk management and investment strategy. Financial assets are classified as held for trading when these are acquired principally for the purpose of selling and repurchasing in the near term, or when these are part of a portfolio of identified financial instruments that are managed together and for which there is a recent actual pattern of profit taking, or where these are derivatives, excluding derivatives that are financial guarantee contracts or that are designated and effective hedging instruments. Financial assets in this category are presented as current assets.
(c) Available for sale financial assets
Available for sale financial assets are non-derivative financial assets that are designated as such on initial recognition or are not classified as loans and receivables, held-to-maturity investments or financial assets at fair value through profit or loss. Assets in this category are presented as non-current assets unless the management intends to dispose of the asset within twelve months from the reporting date.
(d) Financial liabilities at amortized cost
Non-derivative financial liabilities that are not financial liabilities at fair value through profit or loss are classified as financial liabilities at amortized cost. Financial liabilities in this category are presented as current liabilities except for maturities greater than twelve months from the reporting date where these are presented as non-current liabilities.
5.7.3 Measurement
The particular measurement methods adopted are disclosed in the individual policy statements associated with each instrument.
5.7.4 De-recognition
Financial assets are de-recognized if the Company's contractual rights to the cash flows from the financial assets expire or if the Company transfers the financial asset to another party without retaining control or substantially all risks and rewards of the asset. Financial liabilities are de-recognized if the Company's obligations specified in the contract expire or are discharged or cancelled. Any gain or loss on de-recognition of financial assets and financial liabilities is recognized in profit or loss.
5.7.5 Off-setting
A financial asset and a financial liability is offset and the net amount reported in the balance sheet if the Company has legally enforceable right to set-off the recognized amounts and intends either to settle on a net basis or to realize the asset and settle the liability simultaneously.
5.7.6 'Regular way' purchases and sales of financial assets
'Regular way' purchases and sales of financial assets are those contracts which require delivery of assets within the time frame generally established by the regulation or convention in the market. 'Regular way' purchases and sales of financial assets are recognized and derecognized on trade dates.
5.8 Ordinary share capital
Ordinary share capital is recognized as equity. Transaction costs directly attributable to the issue of ordinary shares are recognized as deduction from equity.
5.9 Loans and borrowings
Loans and borrowings are classified as 'financial liabilities at amortized cost'. On initial recognition, these are measured at cost, being fair value at the date the liability is incurred, less attributable transaction costs. Subsequent to initial recognition, these are measured at amortized cost with any difference between cost and value at maturity recognized in the profit or loss over the period of the borrowings on an effective interest basis.
5.10 Investments in mutual funds
Investments in mutual funds units are designated as 'available for sale financial assets' on initial recognition. On initial recognition, these are measured at cost, being their fair value on the date of acquisition. Subsequent to initial recognition, these are measured at fair value. Changes in fair value are recognized in other comprehensive income. Gains and losses on de-recognition are recognized in profit or loss.
NAGINA
NAGINA GROUP
ELLCOT SPINNING MILLS LTD.
43
NAGINA
NAGINA GROUP
42
An intangible asset is measured initially at cost. The cost of intangible asset acquired comprises its purchase price, including import duties and non-refundable purchase taxes, after deducting trade discounts and rebates, and includes other costs directly attributable to the acquisition. Costs incurred after the asset is in the condition necessary for it to operate in the manner intended by the management are recognized in profit or loss. Subsequent to initial recognition, intangible assets are measured at cost less accumulated amortization and accumulated impairment losses, if any.
Intangible assets are amortized over the estimated period over which the Company expects to obtain economic benefits, on a straight line basis. All intangible assets are tested for impairment at each reporting date.
5.3 Software
The cost of acquisition, development and installation of identifiable software products having finite useful lives of more than one year is recognized as an intangible asset at cost. Subsequent to initial recognition, it is measured at cost less accumulated amortization and accumulated impairment losses, if any.
5.4 Stores, spares and loose tools
These are generally held for internal use and are valued at cost. Cost is determined on the basis of weighted average except for items in transit, which are valued at invoice price plus related cost incurred up to the reporting date. For items which are considered obsolete, the carrying amount is written down to nil. Spare parts held exclusively for capitalization are classified as property, plant and equipment.
5.5 Stock in trade
These are valued at lower of cost and net realizable value, with the exception of stock of waste which is valued at net realizable value. Cost is determined using the following basis:
Raw materials Weighted average cost Work in process Average manufacturing cost Finished goods Average manufacturing cost Stock in transit Invoice price plus related cost incurred up to the reporting date
Average manufacturing cost in relation to work in process and finished goods consists of direct material, labour and an appropriate proportion of manufacturing overheads.
Net realizable value signifies the estimated selling price in the ordinary course of business less estimated costs of completion and estimated costs necessary to make the sale.
5.6 Employee benefits
5.6.1 Short-term employee benefits
The Company recognizes the undiscounted amount of short term employee benefits to be paid in exchange for services rendered by employees as a liability after deducting amount already paid and as an expense in profit or loss unless it is included in the cost of inventories or property, plant and equipment as permitted or required by the approved accounting standards. If the amount paid exceeds the undiscounted amount of benefits, the excess is recognized as an asset to the extent that the prepayment would lead to a reduction in future payments or cash refund.
5.6.2 Post-employment benefits
The Company operates an unfunded gratuity scheme (defined benefit plan) for all its employees who have completed the minimum qualifying service period. Liability is adjusted on each reporting date to cover the obligation and the adjustment is charged to profit or loss with the exception of remeasurements which are recognized in other comprehensive income. The amount recognized on balance sheet represents the present value of defined benefit obligation. The details of the scheme are referred to in note 10 to the financial statements.
5.7 Financial instruments
5.7.1 Recognition
A financial instrument is recognized when the Company becomes a party to the contractual provisions of the instrument.
5.7.2 Classification
The Company classifies its financial instruments into following classes depending on the purpose for which the financial assets and liabilities are acquired or incurred. The Company determines the classification of its financial assets and liabilities on initial recognition.
ANNUAL REPORT 2017
(a) Loans and receivables
Non-derivative financial assets with fixed or determinable payments that are not quoted in an active market are classified as loans and receivables. Assets in this category are presented as current assets except for maturities greater than twelve months from the reporting date, where these are presented as non-current assets.
(b) Financial assets at fair value through profit or loss
Financial assets at fair value through profit or loss are financial assets that are either designated as such on initial recognition or are classified as held for trading. Financial assets are designated as financial assets at fair value through profit or loss if the Company manages such assets and evaluates their performance based on their fair value in accordance with the Company’s risk management and investment strategy. Financial assets are classified as held for trading when these are acquired principally for the purpose of selling and repurchasing in the near term, or when these are part of a portfolio of identified financial instruments that are managed together and for which there is a recent actual pattern of profit taking, or where these are derivatives, excluding derivatives that are financial guarantee contracts or that are designated and effective hedging instruments. Financial assets in this category are presented as current assets.
(c) Available for sale financial assets
Available for sale financial assets are non-derivative financial assets that are designated as such on initial recognition or are not classified as loans and receivables, held-to-maturity investments or financial assets at fair value through profit or loss. Assets in this category are presented as non-current assets unless the management intends to dispose of the asset within twelve months from the reporting date.
(d) Financial liabilities at amortized cost
Non-derivative financial liabilities that are not financial liabilities at fair value through profit or loss are classified as financial liabilities at amortized cost. Financial liabilities in this category are presented as current liabilities except for maturities greater than twelve months from the reporting date where these are presented as non-current liabilities.
5.7.3 Measurement
The particular measurement methods adopted are disclosed in the individual policy statements associated with each instrument.
5.7.4 De-recognition
Financial assets are de-recognized if the Company's contractual rights to the cash flows from the financial assets expire or if the Company transfers the financial asset to another party without retaining control or substantially all risks and rewards of the asset. Financial liabilities are de-recognized if the Company's obligations specified in the contract expire or are discharged or cancelled. Any gain or loss on de-recognition of financial assets and financial liabilities is recognized in profit or loss.
5.7.5 Off-setting
A financial asset and a financial liability is offset and the net amount reported in the balance sheet if the Company has legally enforceable right to set-off the recognized amounts and intends either to settle on a net basis or to realize the asset and settle the liability simultaneously.
5.7.6 'Regular way' purchases and sales of financial assets
'Regular way' purchases and sales of financial assets are those contracts which require delivery of assets within the time frame generally established by the regulation or convention in the market. 'Regular way' purchases and sales of financial assets are recognized and derecognized on trade dates.
5.8 Ordinary share capital
Ordinary share capital is recognized as equity. Transaction costs directly attributable to the issue of ordinary shares are recognized as deduction from equity.
5.9 Loans and borrowings
Loans and borrowings are classified as 'financial liabilities at amortized cost'. On initial recognition, these are measured at cost, being fair value at the date the liability is incurred, less attributable transaction costs. Subsequent to initial recognition, these are measured at amortized cost with any difference between cost and value at maturity recognized in the profit or loss over the period of the borrowings on an effective interest basis.
5.10 Investments in mutual funds
Investments in mutual funds units are designated as 'available for sale financial assets' on initial recognition. On initial recognition, these are measured at cost, being their fair value on the date of acquisition. Subsequent to initial recognition, these are measured at fair value. Changes in fair value are recognized in other comprehensive income. Gains and losses on de-recognition are recognized in profit or loss.
NAGINA
NAGINA GROUP
ELLCOT SPINNING MILLS LTD.
43

NAGINA
NAGINA GROUP
44
5.11 Investments in listed equity securities
Investments in listed equity securities are designated as 'available for sale financial assets' on initial recognition. On initial recognition, these are measured at cost, being their fair value on the date of acquisition. Subsequent to initial recognition, these are measured at fair value. Changes in fair value are recognized in other comprehensive income. Gains and losses on de-recognition are recognized in profit or loss.
5.12 Finance leases
Leases in terms of which the Company assumes substantially all risks and rewards of ownership are classified as finance leases. Assets subject to finance lease are classified as 'operating fixed assets'. On initial recognition, these are measured at cost, being an amount equal to the lower of its fair value and the present value of minimum lease payments. Subsequent to initial recognition, these are measured at cost less accumulated depreciation and accumulated impairment losses. Depreciation, subsequent expenditure, de-recognition, and gains and losses on de-recognition are accounted for in accordance with the respective policies for operating fixed assets. Liabilities against assets subject to finance lease and deposits against finance lease are classified as 'financial liabilities at amortized cost' and 'loans and receivables' respectively, however, since they fall outside the scope of measurement requirements of IAS 39 'Financial Instruments - Recognition and Measurement', these are measured in accordance with the requirements of IAS 17 'Leases'. On initial recognition, these are measured at cost, being their fair value at the date of commencement of lease, less attributable transaction costs. Subsequent to initial recognition, minimum lease payments made under finance leases are apportioned between the finance charge and the reduction of outstanding liability. The finance charge is allocated to each period during the lease term so as to produce a constant periodic rate of interest on the remaining balance of the liability. Deposits against finance leases, subsequent to initial recognition are carried at cost.
5.13 Operating leases
Leases that do not transfer substantially all risks and rewards of ownership are classified as operating leases. Payments made under operating leases are recognized in profit or loss on a straight line basis over the lease term.
5.14 Trade and other payables
5.14.1 Financial liabilities
These are classified as 'financial liabilities at amortized cost'. On initial recognition, these are measured at cost, being their fair value at the date the liability is incurred, less attributable transaction costs. Subsequent to initial recognition, these are measured at amortized cost using the effective interest method, with interest recognized in profit or loss.
5.14.2 Non-financial liabilities
These, both on initial recognition and subsequently, are measured at cost.
5.15 Provisions and contingencies
Provisions are recognized when the Company has a legal and constructive obligation as a result of past events and it is probable that outflow of resources embodying economic benefits will be required to settle the obligation and a reliable estimate can be made of the amount of obligation. Provision is recognized at an amount that is the best estimate of the expenditure required to settle the present obligation at the reporting date. Where outflow of resources embodying economic benefits is not probable, or where a reliable estimate of the amount of obligation cannot be made, a contingent liability is disclosed, unless the possibility of outflow is remote.
5.16 Trade and other receivables
5.16.1 Financial assets
These are classified as 'loans and receivables'. On initial recognition, these are measured at cost, being their fair value at the date of transaction, plus attributable transaction costs. Subsequent to initial recognition, these are measured at amortized cost using the effective interest method, with interest recognized in profit or loss.
5.16.2 Non-financial assets
These, both on initial recognition and subsequently, are measured at cost.
5.17 Revenue
Revenue is measured at the fair value of the consideration received or receivable, net of returns allowances, trade discounts and rebates, and represents amounts received or receivable for goods and services provided and other income earned in the normal course of business. Revenue is recognized when it is probable that the economic benefits associated with the transaction will flow to the Company, and the amount of revenue and the associated costs incurred or to be incurred can be measured reliably.
ANNUAL REPORT 2017
Revenue from different sources is recognized as follows:
Revenue from sale of goods is recognized when risks and rewards incidental to the ownership of goods are transferred to the buyer. Transfer of risks and rewards vary depending on the individual terms of the contract of sale. Transfer usually occurs on dispatch of goods to customers.
Export rebate is recognized at the same time when revenue from export sales is recognized.
Interest income is recognized using effective interest method.
Dividend income is recognized when the right to receive payment is established.
5.18 Comprehensive income
Comprehensive income is the change in equity resulting from transactions and other events, other than changes resulting from transactions with shareholders in their capacity as shareholders. Total comprehensive income comprises all components of profit or loss and other comprehensive income ('OCI'). OCI comprises items of income and expense, including reclassification adjustments, that are not recognized in profit or loss as required or permitted by approved accounting standards, and is presented in 'statement of profit or loss and other comprehensive income'.
5.19 Borrowing costs
Borrowing costs directly attributable to the acquisition, construction or production of qualifying assets, which are assets that necessarily take a substantial period of time to get ready for their intended use or sale, are added to the cost of those assets, until such time as the assets are substantially ready for their intended use or sale. Investment income earned on the temporary investment of specific borrowings pending their expenditure on qualifying asset is deducted from the borrowing costs eligible for capitalization. All other borrowing costs are recognized in profit or loss as incurred.
5.20 Income tax
Income tax expense comprises current tax and deferred tax. Income tax expense is recognized in profit or loss except to the extent that it relates to items recognized directly in other comprehensive income, in which case it is recognized in other comprehensive income.
5.20.1 Current taxation
Current tax is the amount of tax payable on taxable income for the year and any adjustment to the tax payable in respect of previous years. Provision for current tax is based on current rates of taxation in Pakistan after taking into account tax credits, rebates and exemptions available, if any. The amount of unpaid income tax in respect of the current or prior periods is recognized as a liability. Any excess paid over what is due in respect of the current or prior periods is recognized as an asset.
5.20.2 Deferred taxation
Deferred tax is accounted for using the' balance sheet approach' providing for temporary differences between the carrying amounts of assets and liabilities for financial reporting purposes and the amounts used for tax purposes. In this regard, the effects on deferred taxation of the portion of income that is subject to final tax regime is also considered in accordance with the treatment prescribed by The Institute of Chartered Accountants of Pakistan. Deferred tax is measured at rates that are expected to be applied to the temporary differences when they reverse, based on laws that have been enacted or substantively enacted by the reporting date. A deferred tax liability is recognized for all taxable temporary differences. A deferred tax asset is recognized for deductible temporary differences to the extent that future taxable profits will be available against which temporary differences can be utilized. Deferred tax assets are reviewed at each reporting date and are reduced to the extent that it is no longer probable that the related tax benefit will be realized.
5.21 Government grants
Government grants that compensate the Company for expenses or losses already incurred are recognized in profit or loss in the period in which these are received and are deducted in reporting the relevant expenses or losses.
5.22 Earnings per share ('EPS')
Basic EPS is calculated by dividing the profit or loss attributable to ordinary shareholders of the Company by the weighted average number of ordinary shares outstanding during the year.
Diluted EPS is calculated by adjusting basic EPS by the weighted average number of ordinary shares that would be issued on conversion of all dilutive potential ordinary shares into ordinary shares and post-tax effect of changes in profit or loss attributable to ordinary shareholders of the Company that would result from conversion of all dilutive potential ordinary shares into ordinary shares.
5.23 Cash and cash equivalents
Cash and cash equivalents for the purpose of cash flow statement comprise cash in hand and cash at banks. These, with the exception of cash in hand, are classified as 'loans and receivables' and are carried at amortized cost. Cash in hand is carried at cost.
NAGINA
NAGINA GROUP
ELLCOT SPINNING MILLS LTD.
45

NAGINA
NAGINA GROUP
46
5.24 Foreign currency transactions and balances
Transactions in foreign currency are translated to the functional currency of the Company using exchange rate prevailing at the date of transaction. Monetary assets and liabilities denominated in foreign currency are translated to the functional currency at exchange rate prevailing at the reporting date. Non-monetary assets and liabilities denominated in foreign currency that are measured at fair value are translated to the functional currency at exchange rate prevailing at the date the fair value is determined. Non-monetary assets and liabilities denominated in foreign currency that are measured at historical cost are translated to functional currency at exchange rate prevailing at the date of initial recognition. Any gain or loss arising on translation of foreign currency transactions and balances is recognized in profit or loss.
5.25 Impairment
5.25.1 Financial assets
A financial asset is assessed at each reporting date to determine whether there is any objective evidence that it is impaired. Individually significant financial assets are tested for impairment on an individual basis. The remaining financial assets are assessed collectively in groups that share similar credit risk characteristics. A financial asset is considered to be impaired if objective evidence indicates that one or more events have had a negative effect on the estimated future cash flows of the asset.
An impairment loss in respect of a financial asset measured at amortized cost is calculated as the difference between its carrying amount, and the present value of the estimated future cash flows discounted at the original effective interest rate. Impairment loss in respect of a financial asset measured at fair value is determined by reference to that fair value. All impairment losses are recognized in profit or loss. An impairment loss is reversed if the reversal can be related objectively to an event occurring after the impairment loss was recognized. An impairment loss is reversed only to the extent that the financial asset’s carrying amount after the reversal does not exceed the carrying amount that would have been determined, net of amortization, if no impairment loss had been recognized.
5.25.2 Non-financial assets
The carrying amount of the Company’s non-financial assets, other than inventories and deferred tax assets are reviewed at each reporting date to determine whether there is any indication of impairment. If any such indication exists, then the asset’s recoverable amount is estimated. The recoverable amount of an asset or cash generating unit is the greater of its value in use and its fair value less costs to sell. In assessing value in use, the estimated future cash flows are discounted to their present values using a pre-tax discount rate that reflects current market assessments of the time value of money and the risks specific to the asset or cash generating unit.
An impairment loss is recognized if the carrying amount of the asset or its cash generating unit exceeds its estimated recoverable amount. Impairment losses are recognized in profit or loss. Impairment losses recognized in respect of cash generating units are allocated to reduce the carrying amounts of the assets in a unit on a pro rata basis. Impairment losses recognized in prior periods are assessed at each reporting date for any indications that the loss has decreased or no longer exists. An impairment loss is reversed if there has been a change in the estimates used in determining the recoverable amount. An impairment loss is reversed only to that extent that the asset’s carrying amount after the reversal does not exceed the carrying amount that would have been determined, net of depreciation and amortization, if no impairment loss had been recognized.
5.26 Dividend distribution to ordinary shareholders
Dividend to ordinary shareholders is recognized as a deduction from accumulated profit in statement of changes in equity and as a liability, to the extent it is unclaimed/unpaid, in the Company’s financial statements in the year in which the dividends are approved by the Company’s shareholders.
ANNUAL REPORT 2017
6 ISSUED, SUBSCRIBED AND PAID-UP CAPITAL
Ordinary shares of Rs. 10 each
8,760,000 (2016: 8,760,000) shares issued for cash
2,190,000 (2016: 2,190,000) shares issued as fully paid bonus shares
7 CAPITAL RESERVES
Changes in fair value of available for sale financial assets
Reserve on merger 7.1
2017 2016
Rupees Rupees
87,600,000
87,600,000
21,900,000
21,900,000
109,500,000
109,500,000
(10,504,398)
452,161 7,760,000 7,760,000
(2,744,398) 8,212,161
Note
NAGINA
NAGINA GROUP
ELLCOT SPINNING MILLS LTD.
47
Note
8
8.1
8.2
8.3
8.4
8.5
8.6
8.7
8.8
LONG TERM FINANCES
These represent secured long term finances utilized under interest/markup
arrangements from banking companies
Term Finances ('TF')
TF - I
TF - II
TF - III
TF - IV
TF - V
TF - VI
TF - VII
TF - VIII
Current maturity presented under current liabilities 15
2017 2016
Rupees Rupees
- 25,000,000
120,000,000 160,000,000
56,326,650 70,408,312
90,909,090 100,000,000
- 24,951,594
199,953,389 199,953,389
47,571,480 47,571,480
52,148,841 -
566,909,450
627,884,775
(72,263,479)
(88,172,571)
494,645,971
539,712,204
7.1 On September 30, 2001, the net assets of Power Unit II of Ellahi Electric Company Limited were merged into the Company. The reserve represents the difference between the book value of shares held by the Company in Ellahi Electric Company Limited as on the date of merger and the value of net assets transferred to the Company.
8.1 The finance was obtained from United Bank Limited to finance capital expenditure and was secured by charge over operating fixed assets of the Company. The finance carried interest/markup at six months KIBOR plus 1.2% per annum payable semi-annually. The finance has been fully repaid during the year.
8.2 The finance has been obtained from Bank Alfalah Limited to finance capital expenditure and is secured by charge over operating fixed assets of the Company. The finance carries interest/markup at six months KIBOR plus 0.75% per annum (2016: six months KIBOR plus 1.35% per annum) payable quarterly. The finance is repayable in ten equal semi-annual installments with the first installment due in August 2015.
8.3 The finance has been obtained from United Bank Limited to finance capital expenditure and is secured by charge over operating fixed assets of the Company. The finance carries interest/markup at six months KIBOR plus 1% per annum (2016: six months KIBOR plus 1% per annum) payable semi annually. The finance is repayable in eleven equal semi-annual installments with the first installment due in January 2016.
8.4 The finance has been obtained from United Bank Limited to finance capital expenditure and is secured by charge over operating fixed assets of the Company. The finance carries interest/markup at three months KIBOR plus 1% per annum (2016: three months KIBOR plus 1% per annum) payable quarterly. The finance is repayable in twenty two equal quarterly installments with the first installment due in March 2017.
8.5 The finance was obtained from Bank Alfalah Limited to finance capital expenditure and was secured by charge over operating fixed assets of the Company. The finance carried interest/markup at six months KIBOR plus 0.75% per annum payable quarterly. The finance has been fully repaid during the year.
8.6 The finance has been obtained from Bank Alfalah Limited to finance capital expenditure and is secured by charge over operating fixed assets of the Company. The finance carries interest/markup at SBP base rate plus 0.5% per annum (2016: SBP base rate plus 0.5% per annum) payable quarterly. The finance is repayable in thirty two equal quarterly installments with the first installment due in August 2018.
8.7 The finance has been obtained from Bank Alfalah Limited to finance capital expenditure and is secured by charge over operating fixed assets of the Company. The finance carries interest/markup at SBP base rate plus 0.75% per annum (2016: SBP base rate plus 0.75% per annum) payable quarterly. The finance is repayable in thirty two equal quarterly installments with the first installment due in August 2018.
8.8 The finance has been obtained from Bank Alfalah Limited to finance capital expenditure and is secured by charge over operating fixed assets of the Company. The finance carries interest/markup at SBP base rate plus 0.75% per annum payable quarterly. The finance is repayable in thirty two equal quarterly installments with the first installment due in November 2018.
8.9 For mortgages and charges on assets as security for liabilities, refer to note 42 to the financial statements.

NAGINA
NAGINA GROUP
46
5.24 Foreign currency transactions and balances
Transactions in foreign currency are translated to the functional currency of the Company using exchange rate prevailing at the date of transaction. Monetary assets and liabilities denominated in foreign currency are translated to the functional currency at exchange rate prevailing at the reporting date. Non-monetary assets and liabilities denominated in foreign currency that are measured at fair value are translated to the functional currency at exchange rate prevailing at the date the fair value is determined. Non-monetary assets and liabilities denominated in foreign currency that are measured at historical cost are translated to functional currency at exchange rate prevailing at the date of initial recognition. Any gain or loss arising on translation of foreign currency transactions and balances is recognized in profit or loss.
5.25 Impairment
5.25.1 Financial assets
A financial asset is assessed at each reporting date to determine whether there is any objective evidence that it is impaired. Individually significant financial assets are tested for impairment on an individual basis. The remaining financial assets are assessed collectively in groups that share similar credit risk characteristics. A financial asset is considered to be impaired if objective evidence indicates that one or more events have had a negative effect on the estimated future cash flows of the asset.
An impairment loss in respect of a financial asset measured at amortized cost is calculated as the difference between its carrying amount, and the present value of the estimated future cash flows discounted at the original effective interest rate. Impairment loss in respect of a financial asset measured at fair value is determined by reference to that fair value. All impairment losses are recognized in profit or loss. An impairment loss is reversed if the reversal can be related objectively to an event occurring after the impairment loss was recognized. An impairment loss is reversed only to the extent that the financial asset’s carrying amount after the reversal does not exceed the carrying amount that would have been determined, net of amortization, if no impairment loss had been recognized.
5.25.2 Non-financial assets
The carrying amount of the Company’s non-financial assets, other than inventories and deferred tax assets are reviewed at each reporting date to determine whether there is any indication of impairment. If any such indication exists, then the asset’s recoverable amount is estimated. The recoverable amount of an asset or cash generating unit is the greater of its value in use and its fair value less costs to sell. In assessing value in use, the estimated future cash flows are discounted to their present values using a pre-tax discount rate that reflects current market assessments of the time value of money and the risks specific to the asset or cash generating unit.
An impairment loss is recognized if the carrying amount of the asset or its cash generating unit exceeds its estimated recoverable amount. Impairment losses are recognized in profit or loss. Impairment losses recognized in respect of cash generating units are allocated to reduce the carrying amounts of the assets in a unit on a pro rata basis. Impairment losses recognized in prior periods are assessed at each reporting date for any indications that the loss has decreased or no longer exists. An impairment loss is reversed if there has been a change in the estimates used in determining the recoverable amount. An impairment loss is reversed only to that extent that the asset’s carrying amount after the reversal does not exceed the carrying amount that would have been determined, net of depreciation and amortization, if no impairment loss had been recognized.
5.26 Dividend distribution to ordinary shareholders
Dividend to ordinary shareholders is recognized as a deduction from accumulated profit in statement of changes in equity and as a liability, to the extent it is unclaimed/unpaid, in the Company’s financial statements in the year in which the dividends are approved by the Company’s shareholders.
ANNUAL REPORT 2017
6 ISSUED, SUBSCRIBED AND PAID-UP CAPITAL
Ordinary shares of Rs. 10 each
8,760,000 (2016: 8,760,000) shares issued for cash
2,190,000 (2016: 2,190,000) shares issued as fully paid bonus shares
7 CAPITAL RESERVES
Changes in fair value of available for sale financial assets
Reserve on merger 7.1
2017 2016
Rupees Rupees
87,600,000
87,600,000
21,900,000
21,900,000
109,500,000
109,500,000
(10,504,398)
452,161 7,760,000 7,760,000
(2,744,398) 8,212,161
Note
NAGINA
NAGINA GROUP
ELLCOT SPINNING MILLS LTD.
47
Note
8
8.1
8.2
8.3
8.4
8.5
8.6
8.7
8.8
LONG TERM FINANCES
These represent secured long term finances utilized under interest/markup
arrangements from banking companies
Term Finances ('TF')
TF - I
TF - II
TF - III
TF - IV
TF - V
TF - VI
TF - VII
TF - VIII
Current maturity presented under current liabilities 15
2017 2016
Rupees Rupees
- 25,000,000
120,000,000 160,000,000
56,326,650 70,408,312
90,909,090 100,000,000
- 24,951,594
199,953,389 199,953,389
47,571,480 47,571,480
52,148,841 -
566,909,450
627,884,775
(72,263,479)
(88,172,571)
494,645,971
539,712,204
7.1 On September 30, 2001, the net assets of Power Unit II of Ellahi Electric Company Limited were merged into the Company. The reserve represents the difference between the book value of shares held by the Company in Ellahi Electric Company Limited as on the date of merger and the value of net assets transferred to the Company.
8.1 The finance was obtained from United Bank Limited to finance capital expenditure and was secured by charge over operating fixed assets of the Company. The finance carried interest/markup at six months KIBOR plus 1.2% per annum payable semi-annually. The finance has been fully repaid during the year.
8.2 The finance has been obtained from Bank Alfalah Limited to finance capital expenditure and is secured by charge over operating fixed assets of the Company. The finance carries interest/markup at six months KIBOR plus 0.75% per annum (2016: six months KIBOR plus 1.35% per annum) payable quarterly. The finance is repayable in ten equal semi-annual installments with the first installment due in August 2015.
8.3 The finance has been obtained from United Bank Limited to finance capital expenditure and is secured by charge over operating fixed assets of the Company. The finance carries interest/markup at six months KIBOR plus 1% per annum (2016: six months KIBOR plus 1% per annum) payable semi annually. The finance is repayable in eleven equal semi-annual installments with the first installment due in January 2016.
8.4 The finance has been obtained from United Bank Limited to finance capital expenditure and is secured by charge over operating fixed assets of the Company. The finance carries interest/markup at three months KIBOR plus 1% per annum (2016: three months KIBOR plus 1% per annum) payable quarterly. The finance is repayable in twenty two equal quarterly installments with the first installment due in March 2017.
8.5 The finance was obtained from Bank Alfalah Limited to finance capital expenditure and was secured by charge over operating fixed assets of the Company. The finance carried interest/markup at six months KIBOR plus 0.75% per annum payable quarterly. The finance has been fully repaid during the year.
8.6 The finance has been obtained from Bank Alfalah Limited to finance capital expenditure and is secured by charge over operating fixed assets of the Company. The finance carries interest/markup at SBP base rate plus 0.5% per annum (2016: SBP base rate plus 0.5% per annum) payable quarterly. The finance is repayable in thirty two equal quarterly installments with the first installment due in August 2018.
8.7 The finance has been obtained from Bank Alfalah Limited to finance capital expenditure and is secured by charge over operating fixed assets of the Company. The finance carries interest/markup at SBP base rate plus 0.75% per annum (2016: SBP base rate plus 0.75% per annum) payable quarterly. The finance is repayable in thirty two equal quarterly installments with the first installment due in August 2018.
8.8 The finance has been obtained from Bank Alfalah Limited to finance capital expenditure and is secured by charge over operating fixed assets of the Company. The finance carries interest/markup at SBP base rate plus 0.75% per annum payable quarterly. The finance is repayable in thirty two equal quarterly installments with the first installment due in November 2018.
8.9 For mortgages and charges on assets as security for liabilities, refer to note 42 to the financial statements.

10.1 Movement in present value of defined benefit obligation
As at beginning of the year
Charged to profit or loss for the year 10.2
Benefits paid during the year
Remeasurements recognized in other comprehensive income 10.4
As at end of the year
10.2 Charge to profit or loss
Current service cost
Interest cost
66,908,522
54,593,956
24,915,616
24,839,061
(18,498,021)
(11,927,226)
(2,655,119)
(597,269)
70,670,998
66,908,522
20,735,301
20,097,603
4,180,315
4,741,458
24,915,616 24,839,061
NAGINA
NAGINA GROUP
48
9.1 These represent plant and machinery acquired under finance lease arrangements. The leases are priced at six months KIBOR plus 1.75% per annum (2016: six months KIBOR plus 1.75% per annum). Lease rentals are payable quarterly over a tenor ranging from 4 to 5 years. Under the terms of agreement, taxes, repairs, replacements and insurance costs in respect of assets subject to finance lease are borne by the Company. The Company also has the option to acquire these assets at the end of their respective lease terms by adjusting the deposit amount against the residual value of the asset and intends to exercise the option.
9.2 The amount of future payments under the finance lease arrangements and the period in which these payments will become due are as follows:
ANNUAL REPORT 2017
Note
9 LIABILITIES AGAINST ASSETS SUBJECT TO FINANCE LEASE
Present value of minimum lease payments 9.1 & 9.2
Current maturity presented under current liabilities 9.1 & 9.2
2017 2016
Rupees Rupees
-
1,108,785
-
(1,108,785)
-
-
Not later than one year -
Later than one year but not later than five years -
Total future minimum lease payments -
Finance charge allocated to future periods -
Present value of future minimum lease payments -
Not later than one year 15 -
Later than one year but not later than five years -
1,131,218
-
1,131,218
(22,433)
1,108,785
(1,108,785)
-
Note 2017 2016
Rupees Rupees
10 EMPLOYEES RETIREMENT BENEFITS
The Company operates an unfunded gratuity scheme, a defined benefit plan, for all its employees who have completed the minimum qualifying service period. Under the scheme, the Company pays a lump-sum benefit equal to last drawn monthly gross salary for each year of service to scheme members whereas the members of the scheme are not required to make any contributions to the scheme. The scheme is administered by the management of the Company under the supervision and directions of the Board of Directors of the Company. The amount recognized on balance sheet represents present value of defined benefit obligation.
Note 2017 2016
Rupees Rupees
NAGINA
NAGINA GROUP
ELLCOT SPINNING MILLS LTD.
49
10.3 The charge to profit or loss has been allocated as follows
Cost of sales 27.2
Administrative and general expenses 29.1
10.4 Remeasurements recognized in other comprehensive income
Actuarial gain arising from:
Changes in demographic assumptions
Changes in financial assumptions
Experience adjustments
14,140,124
15,187,814
10,775,492
9,651,247
24,915,616
24,839,061
-
3,301,239
137,481
(658,879)
(2,792,600)
(3,239,629)
(2,655,119)
(597,269)
Note 2017 2016
Rupees Rupees
10.5 Principal actuarial assumptions
Present value of defined benefit obligation has been determined using projected unit credit method. The liability as at the reporting date is based on actuarial valuation carried out by independent actuaries. The principal assumptions used in determining present value of defined benefit obligation are:
Discount rate 7.75% 7.25%
Expected rate of increase in salary 5.75% 5.25%
Expected average remaining working lives 7 years 7 years
Change Defined
in actuarial benefit
assumption obligation
Rupees
Discount rate + 1% 66,338,894
- 1% 75,599,580
Expected rate of increase in salary + 1% 75,843,207
- 1% 66,042,010
2017
Change Defined
in actuarial benefit
assumption obligation
Rupees
+ 1% 62,688,012
- 1% 71,713,589
+ 1% 71,949,378
- 1% 62,400,039
2016
2017 2016
10.6 Average duration of the defined benefit obligation
The average duration of the defined benefit obligation is seven years.
10.7 Expected charge to profit or loss for the next financial year
The expected charge to profit or loss for the year ending June 30, 2018 amounts to Rs. 26.78 million.
10.8 Sensitivity analysis
An analysis of sensitivity for discount rate and expected rate of increase in salary used to determine the present value of defined benefit obligation as at the reporting date showing how the defined benefit obligation would have been affected by changes in relevant actuarial assumption that were reasonably possible at that date is as follows:
A change in expected remaining working lives of employees is not expected to have a material impact on the present value of defined benefit obligation. Accordingly, the sensitivity analysis for the same has not been carried out.
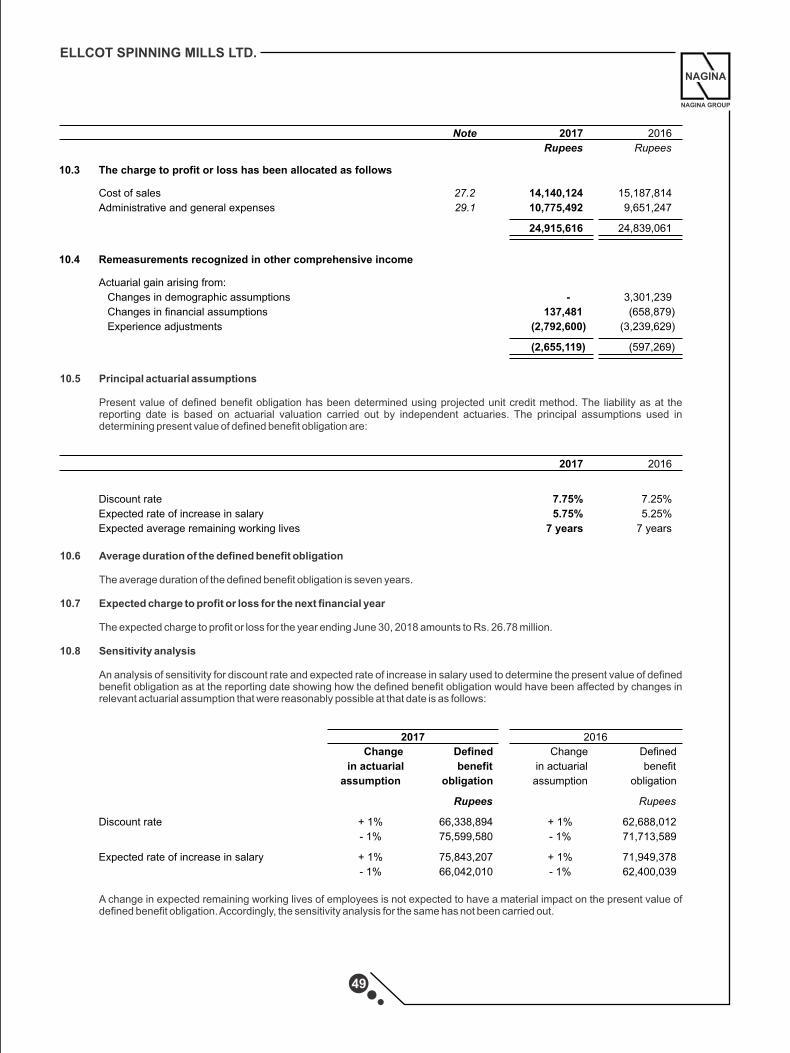
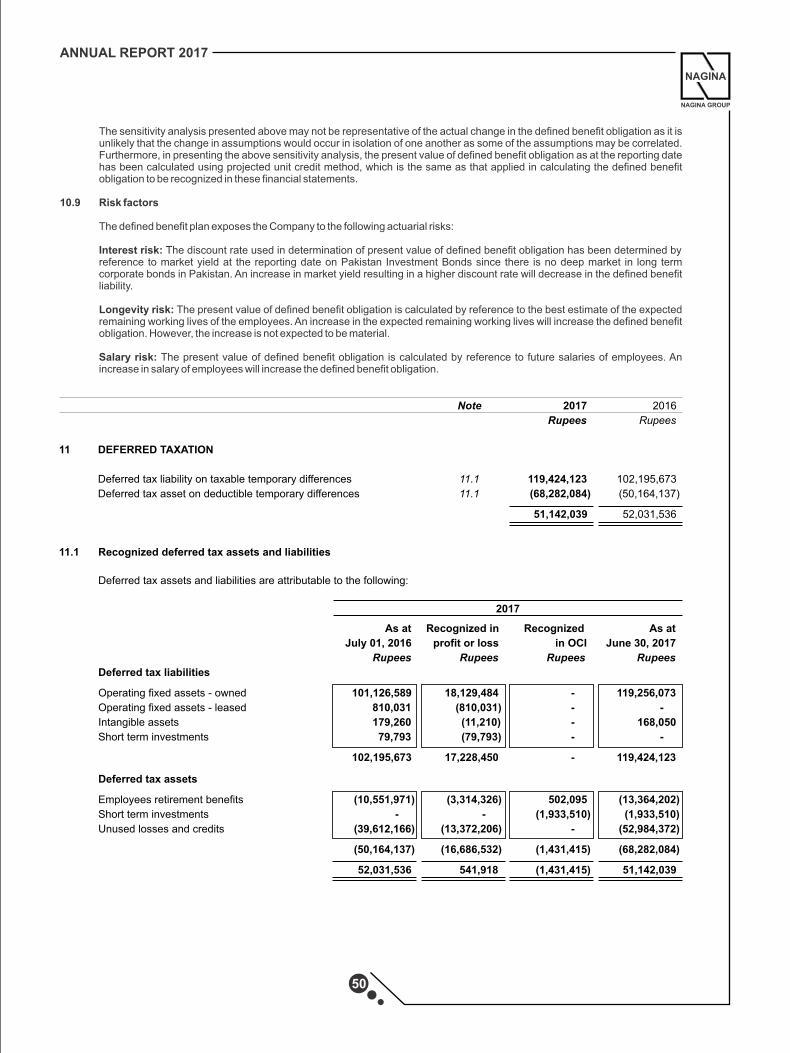
11.1 Recognized deferred tax assets and liabilities
Deferred tax assets and liabilities are attributable to the following:
Deferred tax liabilities
Operating fixed assets - owned
Operating fixed assets - leased
Intangible assets
Short term investments
Deferred tax assets
Employees retirement benefits
Short term investments
Unused losses and credits
As at Recognized in Recognized As at
July 01, 2016 profit or loss in OCI June 30, 2017
Rupees Rupees Rupees Rupees
101,126,589
18,129,484
-
119,256,073
810,031
(810,031)
-
-
179,260
(11,210)
-
168,050
79,793
(79,793)
-
-
102,195,673
17,228,450
-
119,424,123
(10,551,971) (3,314,326) 502,095 (13,364,202)
-
- (1,933,510) (1,933,510)
(39,612,166)
(13,372,206)
-
(52,984,372)
(50,164,137)
(16,686,532)
(1,431,415) (68,282,084)
52,031,536
541,918
(1,431,415)
51,142,039
2017
Note
11 DEFERRED TAXATION
Deferred tax liability on taxable temporary differences 11.1
Deferred tax asset on deductible temporary differences 11.1
2017 2016
Rupees Rupees
119,424,123 102,195,673
(68,282,084) (50,164,137)
51,142,039 52,031,536
NAGINA
NAGINA GROUP
50
The sensitivity analysis presented above may not be representative of the actual change in the defined benefit obligation as it is unlikely that the change in assumptions would occur in isolation of one another as some of the assumptions may be correlated. Furthermore, in presenting the above sensitivity analysis, the present value of defined benefit obligation as at the reporting date has been calculated using projected unit credit method, which is the same as that applied in calculating the defined benefit obligation to be recognized in these financial statements.
10.9 Risk factors
The defined benefit plan exposes the Company to the following actuarial risks:
Interest risk: The discount rate used in determination of present value of defined benefit obligation has been determined by reference to market yield at the reporting date on Pakistan Investment Bonds since there is no deep market in long term corporate bonds in Pakistan. An increase in market yield resulting in a higher discount rate will decrease in the defined benefit liability.
Longevity risk: The present value of defined benefit obligation is calculated by reference to the best estimate of the expected remaining working lives of the employees. An increase in the expected remaining working lives will increase the defined benefit obligation. However, the increase is not expected to be material.
Salary risk: The present value of defined benefit obligation is calculated by reference to future salaries of employees. An increase in salary of employees will increase the defined benefit obligation.
ANNUAL REPORT 2017
NAGINA
NAGINA GROUP
ELLCOT SPINNING MILLS LTD.
51
As at Recognized in Recognized As at
July 01, 2015 profit or loss in OCI June 30, 2016
Rupees Rupees Rupees Rupees
Deferred tax liabilities
Operating fixed assets - owned 85,939,354
15,187,235
-
101,126,589
Operating fixed assets - leased 674,373
135,658
-
810,031
Intangible assets -
179,260
-
179,260
Short term investments -
-
79,793
79,793
86,613,727
15,502,153
79,793
102,195,673
Deferred tax assets
Employees retirement benefits (7,711,987)
(2,934,178)
94,194
(10,551,971)
Short term investments -
-
-
-
Unused losses and credits -
(39,612,166) -
(39,612,166)
(7,711,987)
(42,546,344) 94,194
(50,164,137)
78,901,740
(27,044,191) 173,987
52,031,536
2016
11.2 Deferred tax arising from timing differences pertaining to income from business is provided for only that portion of timing differences that represent income taxable under normal provisions of the Income Tax Ordinance, 2001 ('the Ordinance') as revenue from export sales of the Company is subject to taxation under the final tax regime, while the remaining portion of revenue attracts assessment under normal provisions of the Ordinance. These differences are calculated at that proportion of total timing differences that the local sales, other than the indirect exports taxable under section 154 (3) of the Ordinance, bear to the total sales revenue based on historical and future trends. Deferred tax has been calculated at 30% (2016: 31%) of the timing differences so determined based on tax rates notified by the Government of Pakistan for future tax years.
Deferred tax arising from timing differences pertaining to income taxable as a separate block under the provisions of Income Tax Ordinance, 2001 has been calculated at 15% (2016: 15%) of the timing differences based on tax rates notified by the Government of Pakistan for future tax years for such income.
12 TRADE AND OTHER PAYABLES
Trade creditors - Unsecured
Accrued liabilities
Advances from customers - Unsecured
Infrastructure tax
Workers' Profit Participation Fund
Workers' Welfare Fund
Unclaimed dividend
Other payables - Unsecured
Note 2017 2016
Rupees Rupees
31,471,589
34,556,378
127,263,866
106,044,828
9,083,011
3,949,522
12.1 65,597,039
59,183,318
12.2 6,559,531
3,296,582
12.3 20,866,081
18,662,637
4,606,115
4,237,900 10,493,941
9,913,956
275,941,173
239,845,121
12.1 This represents tax levied by the Sindh Government on movement of imported goods entering the Sindh Province from outside Pakistan.

Note
12.2 Workers' Profit Participation Fund
As at beginning of the year
Interest on funds utilized by the Company 12.2.1
Charged to profit or loss for the year 30
Paid during the year
As at end of the year
12.2.1 Interest has been charged at 26.25% (2016: 26.25%) per annum.
12.3 Workers' Welfare Fund
As at beginning of the year
Charged to profit or loss for the year 30
Paid/adjusted during the year
As at end of the year
13 ACCRUED INTEREST/MARKUP
Long term finances
Liabilities against assets subject to finance lease
Short term borrowings
14 SHORT TERM BORROWINGS
Secured
These represent short term finances utilized under
interest/markup/profit arrangements from banking companies.
Running finances 14.1
Running musharakah 14.2
Term loans 14.3
Unsecured
Book overdraft 14.4
NAGINA
NAGINA GROUP
52
ANNUAL REPORT 2017
2017 2016
Rupees Rupees
3,296,582
4,895,355
450,525 947,682 6,508,771 3,245,822
(3,696,347) (5,792,277)
6,559,531 3,296,582
18,662,637
2,203,444
-
20,866,081
8,036,166
-
9,375,077
17,411,243
431,710,985
169,348,286
276,581,588
877,640,859
45,036,798
922,677,657
18,190,484
1,233,412
(761,259)
18,662,637
6,883,604
15,793
4,302,155
11,201,552
225,898,030
2,353
200,645,222
426,545,605
26,288,033
452,833,638
14.1 These facilities have been obtained from various banking companies for working capital requirements and are secured by charge over all present and future current assets of the Company and lien over export documents. These carry interest/markup at rates ranging from one to three months KIBOR plus 0.20% to 0.75% per annum (2016: one to three months KIBOR plus 0.20% to 0.75% per annum) payable quarterly.
14.2 The facility has been obtained from a Islamic banking company for working capital requirements and is secured by charge over all present and future current assets of the Company and lien over export documents. It carries profit at three months KIBOR plus 0.20% per annum (2016: three months KIBOR plus 0.20% per annum) payable quarterly.
14.3 These facilities have been obtained from various commercial banks for import of goods and are secured by charge over all present and future current assets of the Company, lien over documents of title of imported goods and trust receipts. These carry interest/markup at rates ranging from 1% to 2.25% per annum based on floating LIBOR.
14.4 These represent cheques issued by the Company in excess of balances at bank which have presented for payments after the reporting period.
14.5 The aggregate available short term funded facilities amounts to Rs. 2,212 million (2016: Rs. 2,212 million) out of which Rs. 1,289 million (2016: Rs. 1,785 million) remained unavailed as at the reporting date.
NAGINA
NAGINA GROUP
ELLCOT SPINNING MILLS LTD.
53
14.6 For mortgages and charges on assets as security for liabilities, refer to note 42 to the financial statements.
Note
15 CURRENT PORTION OF NON-CURRENT LIABILITIES
Long term finances 8
Liabilities against assets subject to finance lease 9
16 CONTINGENCIES AND COMMITMENTS
16.1 Contingencies
16.1.1 Guarantees issued by banks on behalf of the Company
16.1.2 Bills discounted/negotiated
2017 2016
Rupees Rupees
72,263,479
88,172,571 -
1,108,785
72,263,479
89,281,356
166,203,053
149,641,844
- 58,038,425
2017 2016
Rupees Rupees
16.2 Commitments
16.2.1 Commitments under irrevocable letters of credit for:
- purchase of property plant and equipment 1,165,518,505 27,164,549
- purchase of stores, spare and loose tools 18,434,649 2,444,050
- purchase of raw material 51,075,067 93,551,527
1,235,028,221 123,160,126
Note 2017 2016
Rupees Rupees
- payments not later than one year 396,000
360,000
- payments later than one year -
-
396,000
360,000
17 FIXED ASSETS
Property, plant and equipment
Operating fixed assets 17.1 1,162,585,962 1,207,480,222
Capital work in progress 17.2 5,478,267
-
1,168,064,229 1,207,480,222
Intangible assets 17.3 4,856,655
6,096,652
1,172,920,884 1,213,576,874
16.1.3 The Company may have to indemnify its Directors for any loss that may arise due to personal guarantees given by them for securing the debts of the Company, in case the Company defaults.
16.1.4 Contingencies related to tax matters are referred to in note 33 to the financial statements.
16.2.2 Commitments under operating leases
The Company has rented office premises from an associated company under operating lease arrangements. Lease agreement covers a period of one year and is renewable/extendable on mutual consent. Lease rentals are payable quarterly in advance. Commitments for payments in future periods under the lease agreement are as follows:

Note
12.2 Workers' Profit Participation Fund
As at beginning of the year
Interest on funds utilized by the Company 12.2.1
Charged to profit or loss for the year 30
Paid during the year
As at end of the year
12.2.1 Interest has been charged at 26.25% (2016: 26.25%) per annum.
12.3 Workers' Welfare Fund
As at beginning of the year
Charged to profit or loss for the year 30
Paid/adjusted during the year
As at end of the year
13 ACCRUED INTEREST/MARKUP
Long term finances
Liabilities against assets subject to finance lease
Short term borrowings
14 SHORT TERM BORROWINGS
Secured
These represent short term finances utilized under
interest/markup/profit arrangements from banking companies.
Running finances 14.1
Running musharakah 14.2
Term loans 14.3
Unsecured
Book overdraft 14.4
NAGINA
NAGINA GROUP
52
ANNUAL REPORT 2017
2017 2016
Rupees Rupees
3,296,582
4,895,355
450,525 947,682 6,508,771 3,245,822
(3,696,347) (5,792,277)
6,559,531 3,296,582
18,662,637
2,203,444
-
20,866,081
8,036,166
-
9,375,077
17,411,243
431,710,985
169,348,286
276,581,588
877,640,859
45,036,798
922,677,657
18,190,484
1,233,412
(761,259)
18,662,637
6,883,604
15,793
4,302,155
11,201,552
225,898,030
2,353
200,645,222
426,545,605
26,288,033
452,833,638
14.1 These facilities have been obtained from various banking companies for working capital requirements and are secured by charge over all present and future current assets of the Company and lien over export documents. These carry interest/markup at rates ranging from one to three months KIBOR plus 0.20% to 0.75% per annum (2016: one to three months KIBOR plus 0.20% to 0.75% per annum) payable quarterly.
14.2 The facility has been obtained from a Islamic banking company for working capital requirements and is secured by charge over all present and future current assets of the Company and lien over export documents. It carries profit at three months KIBOR plus 0.20% per annum (2016: three months KIBOR plus 0.20% per annum) payable quarterly.
14.3 These facilities have been obtained from various commercial banks for import of goods and are secured by charge over all present and future current assets of the Company, lien over documents of title of imported goods and trust receipts. These carry interest/markup at rates ranging from 1% to 2.25% per annum based on floating LIBOR.
14.4 These represent cheques issued by the Company in excess of balances at bank which have presented for payments after the reporting period.
14.5 The aggregate available short term funded facilities amounts to Rs. 2,212 million (2016: Rs. 2,212 million) out of which Rs. 1,289 million (2016: Rs. 1,785 million) remained unavailed as at the reporting date.
NAGINA
NAGINA GROUP
ELLCOT SPINNING MILLS LTD.
53
14.6 For mortgages and charges on assets as security for liabilities, refer to note 42 to the financial statements.
Note
15 CURRENT PORTION OF NON-CURRENT LIABILITIES
Long term finances 8
Liabilities against assets subject to finance lease 9
16 CONTINGENCIES AND COMMITMENTS
16.1 Contingencies
16.1.1 Guarantees issued by banks on behalf of the Company
16.1.2 Bills discounted/negotiated
2017 2016
Rupees Rupees
72,263,479
88,172,571 -
1,108,785
72,263,479
89,281,356
166,203,053
149,641,844
- 58,038,425
2017 2016
Rupees Rupees
16.2 Commitments
16.2.1 Commitments under irrevocable letters of credit for:
- purchase of property plant and equipment 1,165,518,505 27,164,549
- purchase of stores, spare and loose tools 18,434,649 2,444,050
- purchase of raw material 51,075,067 93,551,527
1,235,028,221 123,160,126
Note 2017 2016
Rupees Rupees
- payments not later than one year 396,000
360,000
- payments later than one year -
-
396,000
360,000
17 FIXED ASSETS
Property, plant and equipment
Operating fixed assets 17.1 1,162,585,962 1,207,480,222
Capital work in progress 17.2 5,478,267
-
1,168,064,229 1,207,480,222
Intangible assets 17.3 4,856,655
6,096,652
1,172,920,884 1,213,576,874
16.1.3 The Company may have to indemnify its Directors for any loss that may arise due to personal guarantees given by them for securing the debts of the Company, in case the Company defaults.
16.1.4 Contingencies related to tax matters are referred to in note 33 to the financial statements.
16.2.2 Commitments under operating leases
The Company has rented office premises from an associated company under operating lease arrangements. Lease agreement covers a period of one year and is renewable/extendable on mutual consent. Lease rentals are payable quarterly in advance. Commitments for payments in future periods under the lease agreement are as follows:

NAGINA
NAGINA GROUP
54
ANNUAL REPORT 2017
17
.1O
pe
rati
ng
fix
ed
as
se
ts
Net
bo
ok
As
atA
s at
As
atD
isp
osa
l/tr
ansf
erA
s at
val
ue
as a
t
July
01,
201
6A
dd
itio
ns
Dis
po
sals
Tran
sfer
sJu
ne
30, 2
017
Rat
eJu
ly 0
1, 2
016
Fo
r th
e ye
arad
just
men
tJu
ne
30, 2
017
Jun
e 30
, 201
7
Ru
pee
sR
up
ees
Ru
pee
sR
up
ees
Ru
pee
s%
Ru
pee
sR
up
ees
Ru
pee
sR
up
ees
Ru
pee
s
Ass
ets
ow
ned
by
the
Co
mp
any
Fre
ehol
d la
nd6,
093,
568
-
-
-
6,09
3,56
8
-
-
-
--
6,09
3,56
8
Bui
ldin
gs o
n fr
eeho
ld la
nd
Mill
s18
4,81
0,39
0
-
-
3,47
9,10
3
188,
289,
493
1013
4,20
3,08
4
5,16
8,28
0
-13
9,37
1,36
448
,918
,129
Oth
er fa
ctor
y bu
ildin
gs68
,841
,136
-
-
-
68,8
41,1
36
532
,080
,876
1,84
2,24
7
-33
,923
,123
34,9
18,0
13
253,
651,
526
-
-
3,47
9,10
3
257,
130,
629
166,
283,
960
7,01
0,52
7
-17
3,29
4,48
783
,836
,142
Pla
nt a
nd m
achi
nery
2,03
0,00
6,39
1
-
(32,
945,
732)
92,1
70,8
88
2,08
9,23
1,54
7
101,
000,
765,
583
107,
495,
343
(18,
975,
702)
1,08
9,28
5,22
499
9,94
6,32
3
Ele
ctric
inst
alla
tions
and
equ
ipm
ent
82,0
25,0
17
-
-
-
82,0
25,0
17
1054
,602
,942
2,74
2,20
7
-57
,345
,149
24,6
79,8
68
Fac
tory
equ
ipm
ent
19,5
95,7
87
-
-
-
19,5
95,7
87
1014
,001
,531
559,
425
-14
,560
,956
5,03
4,83
1
Offi
ce e
quip
men
t24
,202
,839
1,82
8,35
8
(86,
000)
-
25,9
45,1
97
1010
,525
,600
1,43
3,64
7
(20,
382)
11,9
38,8
6514
,006
,332
Fur
nitu
re a
nd fi
xtur
es7,
342,
103
212,
770
-
-
7,55
4,87
3
105,
114,
075
233,
054
-5,
347,
129
2,20
7,74
4
Arm
s an
d am
mun
ition
631,
513
-
-
-
631,
513
1049
8,74
0
13,2
78
-51
2,01
811
9,49
5
-V
ehic
les
58,0
26,4
61
6,29
4,49
9
(5,7
19,4
20)
-
58,6
01,5
40
2028
,570
,060
6,32
9,76
2
(2,9
59,9
41)
31,9
39,8
8126
,661
,659
2,48
1,57
5,20
58,
335,
627
(38,
751,
152)
95,6
49,9
912,
546,
809,
671
1,28
0,36
2,49
112
5,81
7,24
3(2
1,95
6,02
5)1,
384,
223,
709
1,16
2,58
5,96
2
Ass
ets
sub
ject
to
fin
ance
leas
e
Pla
nt a
nd m
achi
nery
10,2
99,7
07-
-(1
0,29
9,70
7)-
104,
032,
199
145,
060
(4,1
77,2
59)
--
2,49
1,87
4,91
28,
335,
627
(38,
751,
152)
85,3
50,2
842,
546,
809,
671
1,28
4,39
4,69
012
5,96
2,30
3(2
6,13
3,28
4)1,
384,
223,
709
1,16
2,58
5,96
2
2017
CO
ST
DE
PR
EC
IAT
ION
NAGINA
NAGINA GROUP
ELLCOT SPINNING MILLS LTD.
55
Ne
t b
oo
kA
s a
tA
s a
tA
s a
tD
isp
osa
l/t
ran
sfe
rA
s a
tva
lue
as
at
July
01
, 2
01
5A
dd
itio
ns
Dis
po
sals
Tra
nsf
ers
Jun
e 3
0,
20
16
Ra
teJu
ly 0
1,
20
15
Fo
r th
e y
ea
ra
dju
stm
en
tJu
ne
30
, 2
01
6Ju
ne
30
, 2
01
6
Ru
pe
es
Ru
pe
es
Ru
pe
es
Ru
pe
es
Ru
pe
es
%R
up
ee
sR
up
ee
sR
up
ee
sR
up
ee
sR
up
ee
s
As
se
ts o
wn
ed
by
th
e C
om
pa
ny
Fre
eh
old
lan
d6
,09
3,5
68
-
-
-
6,0
93
,56
8
-
-
-
-
-6
,09
3,5
68
Bu
ildin
gs
on
fre
eh
old
lan
d
Mill
s1
84
,81
0,3
90
-
-
-
18
4,8
10
,39
0
10
12
8,5
89
,46
55
,61
3,6
19
-1
34
,20
3,0
84
50
,60
7,3
06
Oth
er
fact
ory
bu
ildin
gs
68
,84
1,1
36
--
-6
8,8
41
,13
65
30
,14
1,6
69
1,9
39
,20
7-
32
,08
0,8
76
36
,76
0,2
60
25
3,6
51
,52
6-
-
-
25
3,6
51
,52
6
15
8,7
31
,13
4
7,5
52
,82
6
-
16
6,2
83
,96
08
7,3
67
,56
6
Pla
nt
an
d m
ach
ine
ry1
,73
5,9
97
,24
0-
(26
4,6
73
)
29
4,2
73
,82
4
2,0
30
,00
6,3
91
10
911
,58
7,8
88
87
,01
2,2
55
2,1
65
,44
0
1,0
00
,76
5,5
83
1,0
29
,24
0,8
08
Ele
ctric
inst
alla
tion
an
d e
qu
ipm
en
t7
9,9
75
,01
7
2,0
50
,00
0
-
-
82
,02
5,0
17
10
51
,72
6,8
78
2,8
76
,06
4
-
54
,60
2,9
42
27
,42
2,0
75
-
Fa
cto
ry e
qu
ipm
en
t1
9,5
95
,78
7
-
-
-
19
,59
5,7
87
10
13
,37
9,9
47
62
1,5
84
-
14
,00
1,5
31
5,5
94
,25
6
-
Offi
ce e
qu
ipm
en
t1
5,8
78
,60
3
70
0,7
95
-
7,6
23
,44
1
24
,20
2,8
39
10
9,8
23
,52
1
70
2,0
79
-
10
,52
5,6
00
13
,67
7,2
39
Fu
rnitu
re a
nd
fix
ture
s6
,92
2,6
03
41
9,5
00
-
-
7,3
42
,10
3
10
4,8
98
,44
7
21
5,6
28
-
5,1
14
,07
52
,22
8,0
28
-
Arm
s a
nd
am
mu
niti
on
63
1,5
13
-
-
-
63
1,5
13
10
48
3,9
87
14
,75
3
-
49
8,7
40
13
2,7
73
-
-
Ve
hic
les
55
,89
0,1
60
11,6
41
,00
0
(9,5
04
,69
9)
-
58
,02
6,4
61
20
27
,90
9,7
10
6,4
91
,42
9
(5,8
31
,07
9)
28
,57
0,0
60
29
,45
6,4
01
2,1
74
,63
6,0
17
14
,811
,29
5
(9,7
69
,37
2)
30
1,8
97
,26
5
2,4
81
,57
5,2
05
1,1
78
,54
1,5
12
10
5,4
86
,61
8
(3,6
65
,63
9)
1,2
80
,36
2,4
91
1,2
01
,21
2,7
14
As
se
ts s
ub
jec
t to
fin
an
ce
le
as
e
Pla
nt
an
d m
ach
ine
ry1
5,4
34
,00
4
-
-
(5,1
34
,29
7)
10
,29
9,7
07
10
5,1
83
,62
9
1,0
25
,03
8
(2,1
76
,46
8)
4,0
32
,19
96
,26
7,5
08
2,1
90
,07
0,0
21
14
,811
,29
5(9
,76
9,3
72
)2
96
,76
2,9
68
2,4
91
,87
4,9
12
1,1
83
,72
5,1
41
10
6,5
11,6
56
(5,8
42
,10
7)
1,2
84
,39
4,6
90
1,2
07
,48
0,2
22
17
.1.1
Tra
nsf
ers
re
pre
sen
t tr
an
sfe
rs f
rom
ca
pita
l wo
rk in
pro
gre
ss o
n r
ela
ted
ass
ets
be
com
ing
ava
ilab
le f
or
use
an
d t
ho
se f
rom
ass
ets
su
bje
ct t
o f
ina
nce
lea
se o
n t
ran
sfe
r o
f title
to
th
e C
om
pa
ny a
t th
e e
nd
of
lea
se
te
rm.
20
16
CO
ST
DE
PR
EC
IAT
ION

NAGINA
NAGINA GROUP
54
ANNUAL REPORT 2017
17
.1O
pe
rati
ng
fix
ed
as
se
ts
Net
bo
ok
As
atA
s at
As
atD
isp
osa
l/tr
ansf
erA
s at
val
ue
as a
t
July
01,
201
6A
dd
itio
ns
Dis
po
sals
Tran
sfer
sJu
ne
30, 2
017
Rat
eJu
ly 0
1, 2
016
Fo
r th
e ye
arad
just
men
tJu
ne
30, 2
017
Jun
e 30
, 201
7
Ru
pee
sR
up
ees
Ru
pee
sR
up
ees
Ru
pee
s%
Ru
pee
sR
up
ees
Ru
pee
sR
up
ees
Ru
pee
s
Ass
ets
ow
ned
by
the
Co
mp
any
Fre
ehol
d la
nd6,
093,
568
-
-
-
6,09
3,56
8
-
-
-
--
6,09
3,56
8
Bui
ldin
gs o
n fr
eeho
ld la
nd
Mill
s18
4,81
0,39
0
-
-
3,47
9,10
3
188,
289,
493
1013
4,20
3,08
4
5,16
8,28
0
-13
9,37
1,36
448
,918
,129
Oth
er fa
ctor
y bu
ildin
gs68
,841
,136
-
-
-
68,8
41,1
36
532
,080
,876
1,84
2,24
7
-33
,923
,123
34,9
18,0
13
253,
651,
526
-
-
3,47
9,10
3
257,
130,
629
166,
283,
960
7,01
0,52
7
-17
3,29
4,48
783
,836
,142
Pla
nt a
nd m
achi
nery
2,03
0,00
6,39
1
-
(32,
945,
732)
92,1
70,8
88
2,08
9,23
1,54
7
101,
000,
765,
583
107,
495,
343
(18,
975,
702)
1,08
9,28
5,22
499
9,94
6,32
3
Ele
ctric
inst
alla
tions
and
equ
ipm
ent
82,0
25,0
17
-
-
-
82,0
25,0
17
1054
,602
,942
2,74
2,20
7
-57
,345
,149
24,6
79,8
68
Fac
tory
equ
ipm
ent
19,5
95,7
87
-
-
-
19,5
95,7
87
1014
,001
,531
559,
425
-14
,560
,956
5,03
4,83
1
Offi
ce e
quip
men
t24
,202
,839
1,82
8,35
8
(86,
000)
-
25,9
45,1
97
1010
,525
,600
1,43
3,64
7
(20,
382)
11,9
38,8
6514
,006
,332
Fur
nitu
re a
nd fi
xtur
es7,
342,
103
212,
770
-
-
7,55
4,87
3
105,
114,
075
233,
054
-5,
347,
129
2,20
7,74
4
Arm
s an
d am
mun
ition
631,
513
-
-
-
631,
513
1049
8,74
0
13,2
78
-51
2,01
811
9,49
5
-V
ehic
les
58,0
26,4
61
6,29
4,49
9
(5,7
19,4
20)
-
58,6
01,5
40
2028
,570
,060
6,32
9,76
2
(2,9
59,9
41)
31,9
39,8
8126
,661
,659
2,48
1,57
5,20
58,
335,
627
(38,
751,
152)
95,6
49,9
912,
546,
809,
671
1,28
0,36
2,49
112
5,81
7,24
3(2
1,95
6,02
5)1,
384,
223,
709
1,16
2,58
5,96
2
Ass
ets
sub
ject
to
fin
ance
leas
e
Pla
nt a
nd m
achi
nery
10,2
99,7
07-
-(1
0,29
9,70
7)-
104,
032,
199
145,
060
(4,1
77,2
59)
--
2,49
1,87
4,91
28,
335,
627
(38,
751,
152)
85,3
50,2
842,
546,
809,
671
1,28
4,39
4,69
012
5,96
2,30
3(2
6,13
3,28
4)1,
384,
223,
709
1,16
2,58
5,96
2
2017
CO
ST
DE
PR
EC
IAT
ION
NAGINA
NAGINA GROUP
ELLCOT SPINNING MILLS LTD.
55
Ne
t b
oo
kA
s a
tA
s a
tA
s a
tD
isp
osa
l/t
ran
sfe
rA
s a
tva
lue
as
at
July
01
, 2
01
5A
dd
itio
ns
Dis
po
sals
Tra
nsf
ers
Jun
e 3
0,
20
16
Ra
teJu
ly 0
1,
20
15
Fo
r th
e y
ea
ra
dju
stm
en
tJu
ne
30
, 2
01
6Ju
ne
30
, 2
01
6
Ru
pe
es
Ru
pe
es
Ru
pe
es
Ru
pe
es
Ru
pe
es
%R
up
ee
sR
up
ee
sR
up
ee
sR
up
ee
sR
up
ee
s
As
se
ts o
wn
ed
by
th
e C
om
pa
ny
Fre
eh
old
lan
d6
,09
3,5
68
-
-
-
6,0
93
,56
8
-
-
-
-
-6
,09
3,5
68
Bu
ildin
gs
on
fre
eh
old
lan
d
Mill
s1
84
,81
0,3
90
-
-
-
18
4,8
10
,39
0
10
12
8,5
89
,46
55
,61
3,6
19
-1
34
,20
3,0
84
50
,60
7,3
06
Oth
er
fact
ory
bu
ildin
gs
68
,84
1,1
36
--
-6
8,8
41
,13
65
30
,14
1,6
69
1,9
39
,20
7-
32
,08
0,8
76
36
,76
0,2
60
25
3,6
51
,52
6-
-
-
25
3,6
51
,52
6
15
8,7
31
,13
4
7,5
52
,82
6
-
16
6,2
83
,96
08
7,3
67
,56
6
Pla
nt
an
d m
ach
ine
ry1
,73
5,9
97
,24
0-
(26
4,6
73
)
29
4,2
73
,82
4
2,0
30
,00
6,3
91
10
911
,58
7,8
88
87
,01
2,2
55
2,1
65
,44
0
1,0
00
,76
5,5
83
1,0
29
,24
0,8
08
Ele
ctric
inst
alla
tion
an
d e
qu
ipm
en
t7
9,9
75
,01
7
2,0
50
,00
0
-
-
82
,02
5,0
17
10
51
,72
6,8
78
2,8
76
,06
4
-
54
,60
2,9
42
27
,42
2,0
75
-
Fa
cto
ry e
qu
ipm
en
t1
9,5
95
,78
7
-
-
-
19
,59
5,7
87
10
13
,37
9,9
47
62
1,5
84
-
14
,00
1,5
31
5,5
94
,25
6
-
Offi
ce e
qu
ipm
en
t1
5,8
78
,60
3
70
0,7
95
-
7,6
23
,44
1
24
,20
2,8
39
10
9,8
23
,52
1
70
2,0
79
-
10
,52
5,6
00
13
,67
7,2
39
Fu
rnitu
re a
nd
fix
ture
s6
,92
2,6
03
41
9,5
00
-
-
7,3
42
,10
3
10
4,8
98
,44
7
21
5,6
28
-
5,1
14
,07
52
,22
8,0
28
-
Arm
s a
nd
am
mu
niti
on
63
1,5
13
-
-
-
63
1,5
13
10
48
3,9
87
14
,75
3
-
49
8,7
40
13
2,7
73
-
-
Ve
hic
les
55
,89
0,1
60
11,6
41
,00
0
(9,5
04
,69
9)
-
58
,02
6,4
61
20
27
,90
9,7
10
6,4
91
,42
9
(5,8
31
,07
9)
28
,57
0,0
60
29
,45
6,4
01
2,1
74
,63
6,0
17
14
,811
,29
5
(9,7
69
,37
2)
30
1,8
97
,26
5
2,4
81
,57
5,2
05
1,1
78
,54
1,5
12
10
5,4
86
,61
8
(3,6
65
,63
9)
1,2
80
,36
2,4
91
1,2
01
,21
2,7
14
As
se
ts s
ub
jec
t to
fin
an
ce
le
as
e
Pla
nt
an
d m
ach
ine
ry1
5,4
34
,00
4
-
-
(5,1
34
,29
7)
10
,29
9,7
07
10
5,1
83
,62
9
1,0
25
,03
8
(2,1
76
,46
8)
4,0
32
,19
96
,26
7,5
08
2,1
90
,07
0,0
21
14
,811
,29
5(9
,76
9,3
72
)2
96
,76
2,9
68
2,4
91
,87
4,9
12
1,1
83
,72
5,1
41
10
6,5
11,6
56
(5,8
42
,10
7)
1,2
84
,39
4,6
90
1,2
07
,48
0,2
22
17
.1.1
Tra
nsf
ers
re
pre
sen
t tr
an
sfe
rs f
rom
ca
pita
l wo
rk in
pro
gre
ss o
n r
ela
ted
ass
ets
be
com
ing
ava
ilab
le f
or
use
an
d t
ho
se f
rom
ass
ets
su
bje
ct t
o f
ina
nce
lea
se o
n t
ran
sfe
r o
f title
to
th
e C
om
pa
ny a
t th
e e
nd
of
lea
se
te
rm.
20
16
CO
ST
DE
PR
EC
IAT
ION

NAGINA
NAGINA GROUP
56
ANNUAL REPORT 201717.1
.2D
isp
osal o
f o
pera
tin
g f
ixed
assets
Accu
mu
late
dN
et
Dis
po
sal
Gain
/(lo
ss)
Mo
de o
f
Part
icu
lars
Co
st
dep
recia
tio
nb
oo
k v
alu
ep
roceed
so
n d
isp
osal
dis
po
sal
Part
icu
lars
of
bu
yer
Ru
pees
Ru
pees
Ru
pees
Ru
pees
Ru
pees
Pla
nt
an
d m
ach
inery
Savi
o A
uto
Coner
13,3
87,4
81
8,7
91,5
91
4,5
95,8
90
2,3
00,0
00
Neg
oti
ati
on
San
a In
du
str
ies L
imit
ed
Savi
o A
uto
Coner
11,9
84,5
70
8,5
68,4
33
3,4
16,1
37
830,0
01
Neg
oti
ati
on
San
a In
du
str
ies L
imit
ed
Fly
Fra
me
7,5
73,6
81
5,7
92,9
37
1,7
80,7
44
754,0
00
Neg
oti
ati
on
Ab
du
llah
Texti
le T
rad
er
32,9
45,7
32
23,1
52,9
61
9,7
92,7
71
3,8
84,0
01
O
ffic
e E
qu
ipm
en
t
Lapto
p86,0
00
20,3
82
65,6
18
23,0
00
Neg
oti
ati
on
Mr.
Waq
ar
Hu
ssain
Veh
icle
s
Moto
rcyc
le68,5
00
39,2
61
29,2
39
23,0
00
Neg
oti
ati
on
Mr.
Jam
il H
assan
Honda C
ity1,6
72,0
00
914,6
21
757,3
79
886,0
00
Neg
oti
ati
on
Mr.
Mah
ar
Asif
Yaar
Honda C
ity1,5
12,0
00
639,4
08
872,5
92
935,0
00
Neg
oti
ati
on
Mr.
Meh
ar
Asif
Yaar
Suzu
ki S
wift
1,2
33,4
60
702,9
73
530,4
87
575,0
00
Neg
oti
ati
on
Mr.
Irf
an
Suzu
ki S
wift
1,2
33,4
60
663,6
78
569,7
82
582,0
00
Neg
oti
ati
on
Mr.
Am
ir J
aveed
5,7
19,4
20
2,9
59,9
41
2,7
59,4
79
3,0
01,0
00
38,7
51,1
52
26,1
33,2
84
12,6
17,8
68
6,9
08,0
01
(2,2
95,8
90)
(2
,586,1
36)
(1
,026,7
44)
(5
,908,7
70)
(4
2,6
18)
(6
,239)
128,6
21
62,4
08
44,5
13
12,2
18
241,5
21
(5,7
09,8
67)
Acc
um
ula
ted
Net
Dis
posa
lG
ain
/(lo
ss)
Mode o
f
Cost
depre
ciatio
nbook
valu
epro
ceeds
on d
isposa
ldis
posa
lP
art
icula
rs o
f buye
r
Rupees
Rupees
Rupees
Rupees
Rupees
Pla
nt
an
d m
ach
inery
Silv
er
Cans
264,6
73
11,0
28
253,6
45
264,6
73
11,0
28
Negotia
tion
Nagin
a C
otton M
ills
Lim
ited
Veh
icle
s
Moto
rcyc
le64,7
29
44,5
67
20,1
62
28,0
00
7,8
38
Negotia
tion
Mr. M
uham
mad N
ave
ed
Moto
rcyc
le67,7
55
41,3
75
26,3
80
25,0
00
(1,3
80)
Negotia
tion
Mr. H
afiz
Ahm
ad
Moto
rcyc
le67,7
55
41,3
75
26,3
80
30,0
00
3,6
20
Negotia
tion
Mr. M
. K
han
Moto
rcyc
le67,7
55
41,3
75
26,3
80
28,0
00
1,6
20
Negotia
tion
Mr. M
unir
Mast
er
Hig
h L
and -
Loader
1,2
79,1
30
578,7
35
700,3
95
727,5
00
27,1
05
Negotia
tion
Mr. M
. S
hahbaz
Khan
Honda C
ity1,3
88,9
10
937,5
85
451,3
25
525,7
86
74,4
61
Negotia
tion
Mr. M
uham
mad W
aqas
Honda C
ity814,6
60
756,3
44
58,3
16
305,0
00
246,6
84
Negotia
tion
Mr. T
ariq M
ahm
ood
Suzu
ki C
ultu
s 1,0
07,3
17
559,8
00
447,5
17
452,0
00
4,4
83
Negotia
tion
Mr. S
haki
l Anw
ar
Honda C
ivic
2,3
97,9
10
1,2
23,8
93
1,1
74,0
17
1,2
50,0
00
75,9
83
Negotia
tion
Mr. M
. Ib
rar A
rshad
Suzu
ki C
ultu
s 959,8
68
612,0
29
347,8
39
455,0
00
107,1
61
Negotia
tion
Mr. N
oor
Zam
an K
han
Honda C
ity
1,3
88,9
10
994,0
01
394,9
09
625,0
00
230,0
91
Negotia
tion
Mr. M
uham
mad A
shra
f
9,5
04,6
99
5,8
31,0
79
3,6
73,6
20
4,4
51,2
86
777,6
66
9,7
69,3
72
5,8
42,1
07
3,9
27,2
65
4,7
15,9
59
788,6
94
2017
2016
NAGINA
NAGINA GROUP
ELLCOT SPINNING MILLS LTD.
57
17.1.3 The depreciation charge for the year has been allocated as follows:
Cost of sales
Administrative and general expenses
17.2 Capital work in progress
Building
Plant and machinery
Building
Plant and machinery
Note 2017 2016
Rupees Rupees
27 117,952,562
99,087,767
29 8,009,741
7,423,889
125,962,303 106,511,656
As at As at
July 01, 2016 Additions Transfers June 30, 2017
Rupees Rupees Rupees Rupees
-
3,479,103
(3,479,103)
-
- 87,349,448 (81,871,181) 5,478,267
- 90,828,551 (85,350,284) 5,478,267
As at As at
July 01, 2015 Additions Transfers June 30, 2016
Rupees Rupees Rupees Rupees
- - - - - 289,139,527 (289,139,527) -
- 289,139,527 (289,139,527) -
2017
2016

NAGINA
NAGINA GROUP
56
ANNUAL REPORT 2017
17.1
.2D
isp
osal o
f o
pera
tin
g f
ixed
assets
Accu
mu
late
dN
et
Dis
po
sal
Gain
/(lo
ss)
Mo
de o
f
Part
icu
lars
Co
st
dep
recia
tio
nb
oo
k v
alu
ep
roceed
so
n d
isp
osal
dis
po
sal
Part
icu
lars
of
bu
yer
Ru
pees
Ru
pees
Ru
pees
Ru
pees
Ru
pees
Pla
nt
an
d m
ach
inery
Savi
o A
uto
Coner
13,3
87,4
81
8,7
91,5
91
4,5
95,8
90
2,3
00,0
00
Neg
oti
ati
on
San
a In
du
str
ies L
imit
ed
Savi
o A
uto
Coner
11,9
84,5
70
8,5
68,4
33
3,4
16,1
37
830,0
01
Neg
oti
ati
on
San
a In
du
str
ies L
imit
ed
Fly
Fra
me
7,5
73,6
81
5,7
92,9
37
1,7
80,7
44
754,0
00
Neg
oti
ati
on
Ab
du
llah
Texti
le T
rad
er
32,9
45,7
32
23,1
52,9
61
9,7
92,7
71
3,8
84,0
01
O
ffic
e E
qu
ipm
en
t
Lapto
p86,0
00
20,3
82
65,6
18
23,0
00
Neg
oti
ati
on
Mr.
Waq
ar
Hu
ssain
Veh
icle
s
Moto
rcyc
le68,5
00
39,2
61
29,2
39
23,0
00
Neg
oti
ati
on
Mr.
Jam
il H
assan
Honda C
ity1,6
72,0
00
914,6
21
757,3
79
886,0
00
Neg
oti
ati
on
Mr.
Mah
ar
Asif
Yaar
Honda C
ity1,5
12,0
00
639,4
08
872,5
92
935,0
00
Neg
oti
ati
on
Mr.
Meh
ar
Asif
Yaar
Suzu
ki S
wift
1,2
33,4
60
702,9
73
530,4
87
575,0
00
Neg
oti
ati
on
Mr.
Irf
an
Suzu
ki S
wift
1,2
33,4
60
663,6
78
569,7
82
582,0
00
Neg
oti
ati
on
Mr.
Am
ir J
aveed
5,7
19,4
20
2,9
59,9
41
2,7
59,4
79
3,0
01,0
00
38,7
51,1
52
26,1
33,2
84
12,6
17,8
68
6,9
08,0
01
(2,2
95,8
90)
(2
,586,1
36)
(1
,026,7
44)
(5
,908,7
70)
(4
2,6
18)
(6
,239)
128,6
21
62,4
08
44,5
13
12,2
18
241,5
21
(5,7
09,8
67)
Acc
um
ula
ted
Net
Dis
posa
lG
ain
/(lo
ss)
Mode o
f
Cost
depre
ciatio
nbook
valu
epro
ceeds
on d
isposa
ldis
posa
lP
art
icula
rs o
f buye
r
Rupees
Rupees
Rupees
Rupees
Rupees
Pla
nt
an
d m
ach
inery
Silv
er
Cans
264,6
73
11,0
28
253,6
45
264,6
73
11,0
28
Negotia
tion
Nagin
a C
otton M
ills
Lim
ited
Veh
icle
s
Moto
rcyc
le64,7
29
44,5
67
20,1
62
28,0
00
7,8
38
Negotia
tion
Mr. M
uham
mad N
ave
ed
Moto
rcyc
le67,7
55
41,3
75
26,3
80
25,0
00
(1,3
80)
Negotia
tion
Mr. H
afiz
Ahm
ad
Moto
rcyc
le67,7
55
41,3
75
26,3
80
30,0
00
3,6
20
Negotia
tion
Mr. M
. K
han
Moto
rcyc
le67,7
55
41,3
75
26,3
80
28,0
00
1,6
20
Negotia
tion
Mr. M
unir
Mast
er
Hig
h L
and -
Loader
1,2
79,1
30
578,7
35
700,3
95
727,5
00
27,1
05
Negotia
tion
Mr. M
. S
hahbaz
Khan
Honda C
ity1,3
88,9
10
937,5
85
451,3
25
525,7
86
74,4
61
Negotia
tion
Mr. M
uham
mad W
aqas
Honda C
ity814,6
60
756,3
44
58,3
16
305,0
00
246,6
84
Negotia
tion
Mr. T
ariq M
ahm
ood
Suzu
ki C
ultu
s 1,0
07,3
17
559,8
00
447,5
17
452,0
00
4,4
83
Negotia
tion
Mr. S
haki
l Anw
ar
Honda C
ivic
2,3
97,9
10
1,2
23,8
93
1,1
74,0
17
1,2
50,0
00
75,9
83
Negotia
tion
Mr. M
. Ib
rar A
rshad
Suzu
ki C
ultu
s 959,8
68
612,0
29
347,8
39
455,0
00
107,1
61
Negotia
tion
Mr. N
oor
Zam
an K
han
Honda C
ity
1,3
88,9
10
994,0
01
394,9
09
625,0
00
230,0
91
Negotia
tion
Mr. M
uham
mad A
shra
f
9,5
04,6
99
5,8
31,0
79
3,6
73,6
20
4,4
51,2
86
777,6
66
9,7
69,3
72
5,8
42,1
07
3,9
27,2
65
4,7
15,9
59
788,6
94
2017
2016
NAGINA
NAGINA GROUP
ELLCOT SPINNING MILLS LTD.
57
17.1.3 The depreciation charge for the year has been allocated as follows:
Cost of sales
Administrative and general expenses
17.2 Capital work in progress
Building
Plant and machinery
Building
Plant and machinery
Note 2017 2016
Rupees Rupees
27 117,952,562
99,087,767
29 8,009,741
7,423,889
125,962,303 106,511,656
As at As at
July 01, 2016 Additions Transfers June 30, 2017
Rupees Rupees Rupees Rupees
-
3,479,103
(3,479,103)
-
- 87,349,448 (81,871,181) 5,478,267
- 90,828,551 (85,350,284) 5,478,267
As at As at
July 01, 2015 Additions Transfers June 30, 2016
Rupees Rupees Rupees Rupees
- - - - - 289,139,527 (289,139,527) -
- 289,139,527 (289,139,527) -
2017
2016

20.1 Stock of finished goods include stock of waste valued at Rs. 13,888,903 (2016: Rs. 4,286,806). The entire stock of waste is valued at net realizable value.
20.2 Entire stock in trade, with exception of stock of waste, is carried at cost being lower than net realizable value.
Note
21 TRADE DEBTS
Local - unsecured, considered good
Foreign - secured 21.1
21.1 These are secured through letters of credit.
22 ADVANCES, PREPAYMENTS AND OTHER RECEIVABLES
Advances to suppliers - unsecured, considered good
Advances to employees - unsecured, considered good 22.1
Prepayments
Export rebate receivable
Letters of credit
Sales tax refundable
Other receivables - unsecured, considered good
2017 2016
Rupees Rupees
375,448,860
263,025,667 14,735,985
18,398,157
390,184,845 281,423,824
63,777,331
60,176,224
885,379
946,220
1,593,731 8,791,646 1,949,596 534,403 4,661,477 4,642,496
182,119,692 125,965,595 5,183,222 4,953,503
260,170,428 206,010,087
NAGINA
NAGINA GROUP
58
ANNUAL REPORT 2017
18 LONG TERM DEPOSIT
These have been deposited with various utility companies and regulatory authorities. These are classified as 'loans and receivables' under IAS 39 'Financial Instruments - Recognition and Measurement' which are required to be carried at amortized cost. However, these, being held for an indefinite period with no fixed maturity date, are carried at cost as their amortized cost is impracticable to determine.
19 STORES, SPARES AND LOOSE TOOLS
Stores
Spares
Loose tools
19.1 There are no spare parts held exclusively for capitalization as at the reporting date.
2017 2016
Rupees Rupees
30,700,341
39,630,326
7,872,845
3,925,080
116,617
68,315
38,689,803
43,623,721
20 STOCK IN TRADE
Raw material
Work in process
Finished goods 20.1
751,263,154
587,424,897
46,147,798
53,273,667
52,883,593
97,472,315
850,294,545
738,170,879
Note 2017 2016
Rupees Rupees
NAGINA
NAGINA GROUP
ELLCOT SPINNING MILLS LTD.
59
17
.3IN
TA
NG
IBL
E A
SS
ET
S
So
ftw
are
So
ftw
are
Ne
t b
oo
k
As
at
As
at
As
at
Fo
r th
eA
s a
tv
alu
e a
s a
t
Ju
ly 0
1,
20
16
Ad
dit
ion
sTra
ns
fers
Ju
ne
30
, 2
01
7J
uly
01
, 2
01
6p
eri
od
Ju
ne
30
, 2
01
7J
un
e 3
0,
20
17
Ru
pe
es
Ru
pe
es
Ru
pe
es
Ru
pe
es
Ru
pe
es
Ru
pe
es
Ru
pe
es
Ru
pe
es
6,1
99
,98
5 -
- 6
,19
9,9
85
1
03
,33
3
1
,23
9,9
97
1
,34
3,3
30
4
,85
6,6
55
6,1
99
,98
5 -
- 6
,19
9,9
85
1
03
,33
3
1
,23
9,9
97
1
,34
3,3
30
4
,85
6,6
55
Ne
t b
oo
k
As
at
As
at
As
at
Fo
r th
eA
s a
tva
lue
as
at
July
01
, 2
01
5A
dd
itio
ns
Tra
nsf
ers
Jun
e 3
0,
20
16
July
01
, 2
01
5p
erio
dJu
ne
30
, 2
01
6Ju
ne
30
, 2
01
6
Ru
pe
es
Ru
pe
es
Ru
pe
es
Ru
pe
es
Ru
pe
es
Ru
pe
es
Ru
pe
es
Ru
pe
es
13
,82
3,4
26
-
(7
,62
3,4
41
) 6
,19
9,9
85
-
10
3,3
33
1
03
,33
3
6
,09
6,6
52
13
,82
3,4
26
-
(7
,62
3,4
41
) 6
,19
9,9
85
-
10
3,3
33
1
03
,33
3
6
,09
6,6
52
Co
stA
ccu
mu
late
d A
mo
rtiz
atio
n
20
17
Co
st
Ac
cu
mu
late
d A
mo
rtiz
ati
on
20
16
17.3
.1
Softw
are
repre
sents
cost
of O
racl
e F
inanci
als
Suite
acq
uired b
y th
e C
om
pany.
This
is b
ein
g a
mort
ized @
20%
per a
nnu
m u
sing s
traig
ht l
ine m
eth
od.
17.3
.2
Tra
nsf
ers
repre
sent r
ela
ted h
ard
ware
transf
err
ed to
opera
ting fi
xed a
ssets
.

2017 2016
Rupees Rupees
41,938,737 24,121,617
(2,681,637) (864,117)
39,257,100 23,257,500
3,451,750 4,206,258
65,500 (754,508)
3,517,250
3,451,750
47,657,187
14,560,218
7,218,973
3,131,782
54,876,160
17,692,000
11,743,965 3,894,261
Pakistan Petroleum Limited
265,000 ordinary shares of Rs. 10 each (2016: 150,000)
Market value: Rs. 148.14 (2016: Rs. 155.05) per share
Cost of investment
Changes in fair value
Oil and Gas Development Company Limited
25,000 ordinary shares of Rs. 10 each (2016: 25,000)
Market value per share: Rs. 140.69 (2016: Rs. 138.07)
Cost of investment
Changes in fair value
United Bank Limited
233,000 ordinary shares of Rs. 10 each (2016: 100,000)
Market value per share: Rs. 235.52 (2016: Rs. 176.92)
Cost of investment
Changes in fair value
Fatima Fertilizer Company Limited
370,000 ordinary shares of Rs. 10 each (2016: 100,000 )
Market value per share: Rs. 33.69 (2016: Rs. 33.94)
Cost of investment
Changes in fair value 721,336
(500,261)
12,465,301 3,394,000
23 SHORT TERM INVESTMENTS
Investments in mutual fund units
Cost of investment
Changes in fair value
Investments in listed equity securities
Cost of investment
Changes in fair value
Note 2017 2016
Rupees Rupees
23.1
31,740,304
-
(4,096,219)
-
27,644,085
-
23.2
527,192,264
119,432,336
(8,793,850)
531,954
518,398,414
119,964,290
546,042,499
119,964,290
22.1 These represent advances to employees for purchases and expenses on behalf of the Company and those against future salaries and post employment benefits in accordance with the Company policy. No advances have been given to any of the directors or executives of the Company.
23.1 These represent investments in mutual fund units have been designated as 'available for sale financial assets' on initial recognition. The details are as follows.
NAGINA
NAGINA GROUP
60
ANNUAL REPORT 2017
NAFA Islamic Energy Fund
1,040,543 units (2016: nil units)
Market value per unit: Rs. 13.0957 (2016: Rs. nil)
Cost of investment
Changes in fair value
NAFA Stock Fund
864,538 units (2016: nil units)
Market value per unit: Rs. 16.2138 (2016: Rs. nil)
Cost of investment
Changes in fair value
2017 2016
Rupees Rupees
15,716,230
-
(2,089,590)
-
13,626,640
-
16,024,074
- (2,006,629)
-
14,017,445
-
27,644,085
-
23.2 These represent investments in listed equity securities and have been designated as 'available for sale financial assets' on initial recognition. The details are as follows.
NAGINA
NAGINA GROUP
ELLCOT SPINNING MILLS LTD.
61
Bank Al Habib Limited
483,000 ordinary shares of Rs. 10 each (2016: 200,000)
Market value per share: Rs. 56.75 (2016: Rs. 43.12)
Cost of investment 25,543,606
8,012,520
Changes in fair value 1,866,645
611,480
27,410,251 8,624,000
Engro Fertilizers Limited
1,335,500 ordinary shares of Rs. 10 each (2016: 985,500)
Market value per share: Rs. 55.24 (2016: Rs. 64.48)
Cost of investment 86,302,597
64,637,462
Changes in fair value (12,529,577)
(1,092,422)
73,773,020
63,545,040
Fauji Cement Company Limited
1,250,000 ordinary shares of Rs. 10 each (2016: nil)
Market value per share: Rs. 41.03 (2016: Rs. nil)
Cost of investment 48,737,299
-
Changes in fair value 2,550,201 -
51,287,500 -

2017 2016
Rupees Rupees
41,938,737 24,121,617
(2,681,637) (864,117)
39,257,100 23,257,500
3,451,750 4,206,258
65,500 (754,508)
3,517,250
3,451,750
47,657,187
14,560,218
7,218,973
3,131,782
54,876,160
17,692,000
11,743,965 3,894,261
Pakistan Petroleum Limited
265,000 ordinary shares of Rs. 10 each (2016: 150,000)
Market value: Rs. 148.14 (2016: Rs. 155.05) per share
Cost of investment
Changes in fair value
Oil and Gas Development Company Limited
25,000 ordinary shares of Rs. 10 each (2016: 25,000)
Market value per share: Rs. 140.69 (2016: Rs. 138.07)
Cost of investment
Changes in fair value
United Bank Limited
233,000 ordinary shares of Rs. 10 each (2016: 100,000)
Market value per share: Rs. 235.52 (2016: Rs. 176.92)
Cost of investment
Changes in fair value
Fatima Fertilizer Company Limited
370,000 ordinary shares of Rs. 10 each (2016: 100,000 )
Market value per share: Rs. 33.69 (2016: Rs. 33.94)
Cost of investment
Changes in fair value 721,336
(500,261)
12,465,301 3,394,000
23 SHORT TERM INVESTMENTS
Investments in mutual fund units
Cost of investment
Changes in fair value
Investments in listed equity securities
Cost of investment
Changes in fair value
Note 2017 2016
Rupees Rupees
23.1
31,740,304
-
(4,096,219)
-
27,644,085
-
23.2
527,192,264
119,432,336
(8,793,850)
531,954
518,398,414
119,964,290
546,042,499
119,964,290
22.1 These represent advances to employees for purchases and expenses on behalf of the Company and those against future salaries and post employment benefits in accordance with the Company policy. No advances have been given to any of the directors or executives of the Company.
23.1 These represent investments in mutual fund units have been designated as 'available for sale financial assets' on initial recognition. The details are as follows.
NAGINA
NAGINA GROUP
60
ANNUAL REPORT 2017
NAFA Islamic Energy Fund
1,040,543 units (2016: nil units)
Market value per unit: Rs. 13.0957 (2016: Rs. nil)
Cost of investment
Changes in fair value
NAFA Stock Fund
864,538 units (2016: nil units)
Market value per unit: Rs. 16.2138 (2016: Rs. nil)
Cost of investment
Changes in fair value
2017 2016
Rupees Rupees
15,716,230
-
(2,089,590)
-
13,626,640
-
16,024,074
- (2,006,629)
-
14,017,445
-
27,644,085
-
23.2 These represent investments in listed equity securities and have been designated as 'available for sale financial assets' on initial recognition. The details are as follows.
NAGINA
NAGINA GROUP
ELLCOT SPINNING MILLS LTD.
61
Bank Al Habib Limited
483,000 ordinary shares of Rs. 10 each (2016: 200,000)
Market value per share: Rs. 56.75 (2016: Rs. 43.12)
Cost of investment 25,543,606
8,012,520
Changes in fair value 1,866,645
611,480
27,410,251 8,624,000
Engro Fertilizers Limited
1,335,500 ordinary shares of Rs. 10 each (2016: 985,500)
Market value per share: Rs. 55.24 (2016: Rs. 64.48)
Cost of investment 86,302,597
64,637,462
Changes in fair value (12,529,577)
(1,092,422)
73,773,020
63,545,040
Fauji Cement Company Limited
1,250,000 ordinary shares of Rs. 10 each (2016: nil)
Market value per share: Rs. 41.03 (2016: Rs. nil)
Cost of investment 48,737,299
-
Changes in fair value 2,550,201 -
51,287,500 -
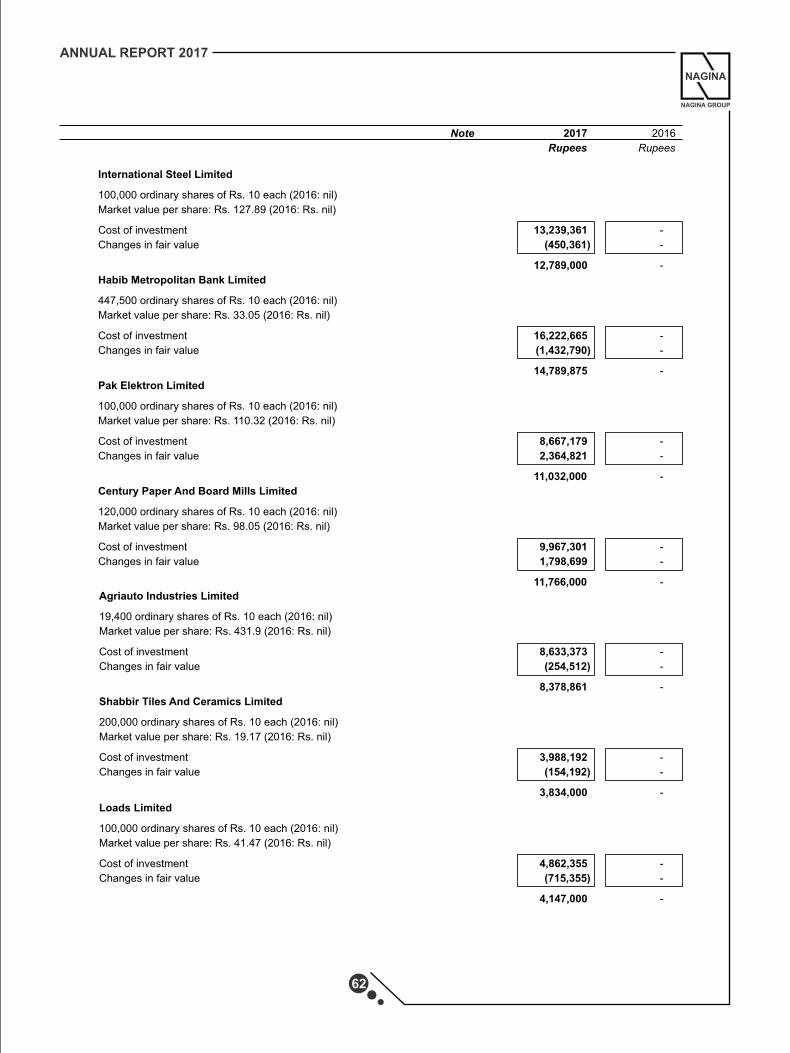
24 ADVANCE INCOME TAX
Advance income tax/income tax refundable
Provision for taxation 33
25 CASH AND BANK BALANCES
Cash in hand
Cash at bank:
Current accounts - local currency
Deposit/saving accounts - local currency
Deposit/saving accounts - foreign currency
115,288,755
99,140,123 (42,844,846)
(14,900,431)
72,443,909
84,239,692
-
2,565,443
15,939,035
73,525,863
-
100,071,233
-
33,022
15,939,035 173,630,118
15,939,035 176,195,561
NAGINA
NAGINA GROUP
62
ANNUAL REPORT 2017
2017 2016
Rupees Rupees
Note
Bank Alfalah Limited
333,000 ordinary shares of Rs. 10 each (2016: nil)
Market value per share: Rs. 40.2 (2016: Rs. nil)
Cost of investment 13,758,810 -
Changes in fair value (372,209) -
13,386,601 -
Mari Petroleum Company Limited
10,000 ordinary shares of Rs. 10 each (2016: nil)
Market value per share: Rs. 1575.64 (2016: Rs. nil)
Cost of investment 15,416,807 -
Changes in fair value 339,593
-
15,756,400 -
MCB Bank Limited
100,000 ordinary shares of Rs. 10 each (2016: nil)
Market value per share: Rs. 210.43 (2016: Rs. nil)
Cost of investment 21,037,695 -
Changes in fair value 5,305
-
21,043,000
-
Separately Managed Account 23.2.1
Cost of investment 146,023,385 -
Changes in fair value (7,134,290)
-
138,889,095 -
518,398,414
119,964,290
Habib Metropolitan Bank Limited
447,500 ordinary shares of Rs. 10 each (2016: nil)
Market value per share: Rs. 33.05 (2016: Rs. nil)
Cost of investment 16,222,665 -
Changes in fair value (1,432,790) -
14,789,875
-
Pak Elektron Limited
100,000 ordinary shares of Rs. 10 each (2016: nil)
Market value per share: Rs. 110.32 (2016: Rs. nil)
Cost of investment 8,667,179 -
Changes in fair value 2,364,821
-
11,032,000
-
Century Paper And Board Mills Limited
120,000 ordinary shares of Rs. 10 each (2016: nil)
Market value per share: Rs. 98.05 (2016: Rs. nil)
Cost of investment 9,967,301
-
Changes in fair value 1,798,699
-
11,766,000
-
100,000 ordinary shares of Rs. 10 each (2016: nil)
Market value per share: Rs. 127.89 (2016: Rs. nil)
Cost of investment 13,239,361 -
Changes in fair value (450,361) -
12,789,000 -
International Steel Limited
Agriauto Industries Limited
19,400 ordinary shares of Rs. 10 each (2016: nil)
Market value per share: Rs. 431.9 (2016: Rs. nil)
Cost of investment 8,633,373
-
Changes in fair value (254,512)
-
8,378,861
-
Shabbir Tiles And Ceramics Limited
200,000 ordinary shares of Rs. 10 each (2016: nil)
Market value per share: Rs. 19.17 (2016: Rs. nil)
Cost of investment 3,988,192
- Changes in fair value (154,192)
-
3,834,000 -
Loads Limited
100,000 ordinary shares of Rs. 10 each (2016: nil)
Market value per share: Rs. 41.47 (2016: Rs. nil)
Cost of investment 4,862,355 - Changes in fair value (715,355) -
4,147,000 -
23.2.1 These represent investments in listed equity securities through a separately managed account with Alfalah GHP Investment Management Limited.
NAGINA
NAGINA GROUP
ELLCOT SPINNING MILLS LTD.
63
Note 2017 2016
Rupees Rupees
Note 2017 2016
Rupees Rupees

27.1 Raw material consumed
As at beginning of the year
Purchased during the year
Sold during the year
As at end of the year
27.2 These include charge in respect of employees retirement benefits amounting to Rs. 14,140,124 (2016: Rs. 15,187,814).
587,424,897 582,447,109
3,522,762,626 2,856,137,382
(116,016,721) (72,796,120)
(751,263,154) (587,424,897)
3,242,907,648 2,778,363,474
Note
27 COST OF SALES
Raw material consumed 27.1
Stores, spares and loose tools consumed
Salaries, wages and benefits 27.2
Insurance
Power and fuel
Repair and maintenance
Depreciation 17.1.3
Others
Manufacturing cost
Work in process
As at beginning of the year
As at end of the year
Cost of goods manufactured
Finished goods
As at beginning of the year
Purchased during the year
As at end of the year
2017 2016
Rupees Rupees
3,242,907,648
2,778,363,474
183,739,667
167,607,732
375,180,996
309,650,214
9,973,044
8,463,882
466,731,742
372,951,188
11,562,480
10,690,226 117,952,562
99,087,767
13,822,259
13,318,650
4,421,870,398
3,760,133,133
53,273,667
46,147,113 (46,147,798)
(53,273,667)
7,125,869
(7,126,554)
4,428,996,267
3,753,006,579
97,472,315
40,271,540
78,061,750 286,818,230 (52,883,593) (97,472,315)
122,650,472 229,617,455
4,551,646,739 3,982,624,034
Note
Local
Export 26.1
Gross sales
Export rebate
Sales tax
Local
Export 26.1
Gross sales
Export rebate
Sales tax
26.1 Yarn export sales include indirect exports amounting to Rs.157,507,040 (2016: Rs.524,151,801).
2016
2017
Raw cotton,
Yarn polyester etc. Waste Total
Rupees Rupees Rupees Rupees
4,389,103,957 132,123,687 106,661,420 4,627,889,064
221,057,666 - 19,603,769 240,661,435
4,610,161,623 132,123,687 126,265,189 4,868,550,499
1,415,193 - - 1,415,193
- - (1,369,301) (1,369,301)
4,611,576,816 132,123,687 124,895,888 4,868,596,391
Raw cotton,
Yarn polyester etc. Waste Total
Rupees Rupees Rupees Rupees
3,279,360,747
88,755,911
56,896,586
3,425,013,244
851,619,057
-
42,241,015
893,860,072
4,130,979,804
88,755,911
99,137,601
4,318,873,316
-
-
-
-
(87,811,098)
(1,394,734)
(1,757,504)
(90,963,336)
4,043,168,706
87,361,177
97,380,097
4,227,909,980
26 SALES - NET
NAGINA
NAGINA GROUP
64
ANNUAL REPORT 2017
NAGINA
NAGINA GROUP
ELLCOT SPINNING MILLS LTD.
65

NAGINA
NAGINA GROUP
66
ANNUAL REPORT 2017
NAGINA
NAGINA GROUP
ELLCOT SPINNING MILLS LTD.
67
28 DISTRIBUTION COST
Export
Ocean freight and forwarding
Commission
Export development surcharge
Local
Inland transportation
Commission
Others
29 ADMINISTRATIVE EXPENSES
Directors' remuneration
Directors' meeting fee
Salaries and benefits
Rent, rates and taxes
Printing and stationery
Communication
Electricity
Repair and maintenance
Vehicles running and maintenance
Traveling and conveyance
Legal and professional charges
Auditors' remuneration
Fee and subscription
Entertainment
Insurance
Depreciation
Amortization of intangible assets
Others
29.1
29.2 Auditor's remuneration
Annual statutory audit
Half yearly review
Review report under Code of Corporate Governance
Out of pocket expenses
These include charge in respect of employees retirement benefits amounting to Rs. 10,775,492 (2016: Rs. 9,651,247).
Note 2017 2016
Rupees Rupees
7,135,458
9,408,437
1,253,396
7,053,858 195,446
907,099
8,584,300
17,369,394
12,537,690
11,512,069
10,864,470
8,257,936
372,308
570,096
23,774,468
20,340,101
32,358,768
37,709,495
43 8,344,279 13,950,394 43 420,000 340,000
29.1 65,472,195 55,124,035 756,000 690,000
880,843 975,296
2,012,886 2,117,580
2,634,179 2,444,436
379,904 562,794
4,265,341 3,972,056
6,135,629 7,563,273
2,581,994 1,845,168
29.2 776,500 776,500
2,718,940 1,252,866
576,080 452,999
3,886,742
3,207,605
17.1.3 8,009,741
7,423,889
17.3 1,239,997
103,333
436,471
286,404
111,527,721
103,088,628
577,500
577,500
136,500
136,500
52,500
52,500
10,000
10,000
776,500
776,500
Note 2017 2016
Rupees Rupees
30 OTHER EXPENSES
Loss on financial instruments
Foreign exchange loss
Other expenses
Loss on disposal of property, plant and equipment 17.1.2
Workers' Profit Participation Fund 12.2
Workers' Welfare Fund 12.3
Donations 30.1
30.1 None of the directors or their spouses had any interest in donations made by the Company.
31 OTHER INCOME
Gain on financial instruments
Gain on disposal of short term investments
Return on term deposits
Dividend income
Other income
Gain on disposal of property, plant and equipment 17.1.2
Scrap sale
32 FINANCE COST
Interest/markup/profit on borrowings:
long term finances
liabilities against assets subject to finance lease
short term borrowings
Interest on workers' profit participation fund 12.2
Bank charges and commission
Note
631,895
620,209
5,709,867
- 6,508,771
3,245,822
2,203,444
1,233,412 600,000
500,000
15,022,082
4,979,234
15,653,977
5,599,443
2,815,234 7,947,604 53,425 265,318
17,808,798 1,742,500
20,677,457 9,955,422
- 788,694
766,819 720,138
766,819 1,508,832
21,444,276 11,464,254
30,026,147
33,345,498
27,589
475,399
24,639,822
12,276,846
54,693,558
46,097,743
450,525
947,682
2,696,691
3,817,684
57,840,774
50,863,109
2017 2016
Rupees Rupees
Note 2017 2016
Rupees Rupees

NAGINA
NAGINA GROUP
66
ANNUAL REPORT 2017
NAGINA
NAGINA GROUP
ELLCOT SPINNING MILLS LTD.
67
28 DISTRIBUTION COST
Export
Ocean freight and forwarding
Commission
Export development surcharge
Local
Inland transportation
Commission
Others
29 ADMINISTRATIVE EXPENSES
Directors' remuneration
Directors' meeting fee
Salaries and benefits
Rent, rates and taxes
Printing and stationery
Communication
Electricity
Repair and maintenance
Vehicles running and maintenance
Traveling and conveyance
Legal and professional charges
Auditors' remuneration
Fee and subscription
Entertainment
Insurance
Depreciation
Amortization of intangible assets
Others
29.1
29.2 Auditor's remuneration
Annual statutory audit
Half yearly review
Review report under Code of Corporate Governance
Out of pocket expenses
These include charge in respect of employees retirement benefits amounting to Rs. 10,775,492 (2016: Rs. 9,651,247).
Note 2017 2016
Rupees Rupees
7,135,458
9,408,437
1,253,396
7,053,858 195,446
907,099
8,584,300
17,369,394
12,537,690
11,512,069
10,864,470
8,257,936
372,308
570,096
23,774,468
20,340,101
32,358,768
37,709,495
43 8,344,279 13,950,394 43 420,000 340,000
29.1 65,472,195 55,124,035 756,000 690,000
880,843 975,296
2,012,886 2,117,580
2,634,179 2,444,436
379,904 562,794
4,265,341 3,972,056
6,135,629 7,563,273
2,581,994 1,845,168
29.2 776,500 776,500
2,718,940 1,252,866
576,080 452,999
3,886,742
3,207,605
17.1.3 8,009,741
7,423,889
17.3 1,239,997
103,333
436,471
286,404
111,527,721
103,088,628
577,500
577,500
136,500
136,500
52,500
52,500
10,000
10,000
776,500
776,500
Note 2017 2016
Rupees Rupees
30 OTHER EXPENSES
Loss on financial instruments
Foreign exchange loss
Other expenses
Loss on disposal of property, plant and equipment 17.1.2
Workers' Profit Participation Fund 12.2
Workers' Welfare Fund 12.3
Donations 30.1
30.1 None of the directors or their spouses had any interest in donations made by the Company.
31 OTHER INCOME
Gain on financial instruments
Gain on disposal of short term investments
Return on term deposits
Dividend income
Other income
Gain on disposal of property, plant and equipment 17.1.2
Scrap sale
32 FINANCE COST
Interest/markup/profit on borrowings:
long term finances
liabilities against assets subject to finance lease
short term borrowings
Interest on workers' profit participation fund 12.2
Bank charges and commission
Note
631,895
620,209
5,709,867
- 6,508,771
3,245,822
2,203,444
1,233,412 600,000
500,000
15,022,082
4,979,234
15,653,977
5,599,443
2,815,234 7,947,604 53,425 265,318
17,808,798 1,742,500
20,677,457 9,955,422
- 788,694
766,819 720,138
766,819 1,508,832
21,444,276 11,464,254
30,026,147
33,345,498
27,589
475,399
24,639,822
12,276,846
54,693,558
46,097,743
450,525
947,682
2,696,691
3,817,684
57,840,774
50,863,109
2017 2016
Rupees Rupees
Note 2017 2016
Rupees Rupees
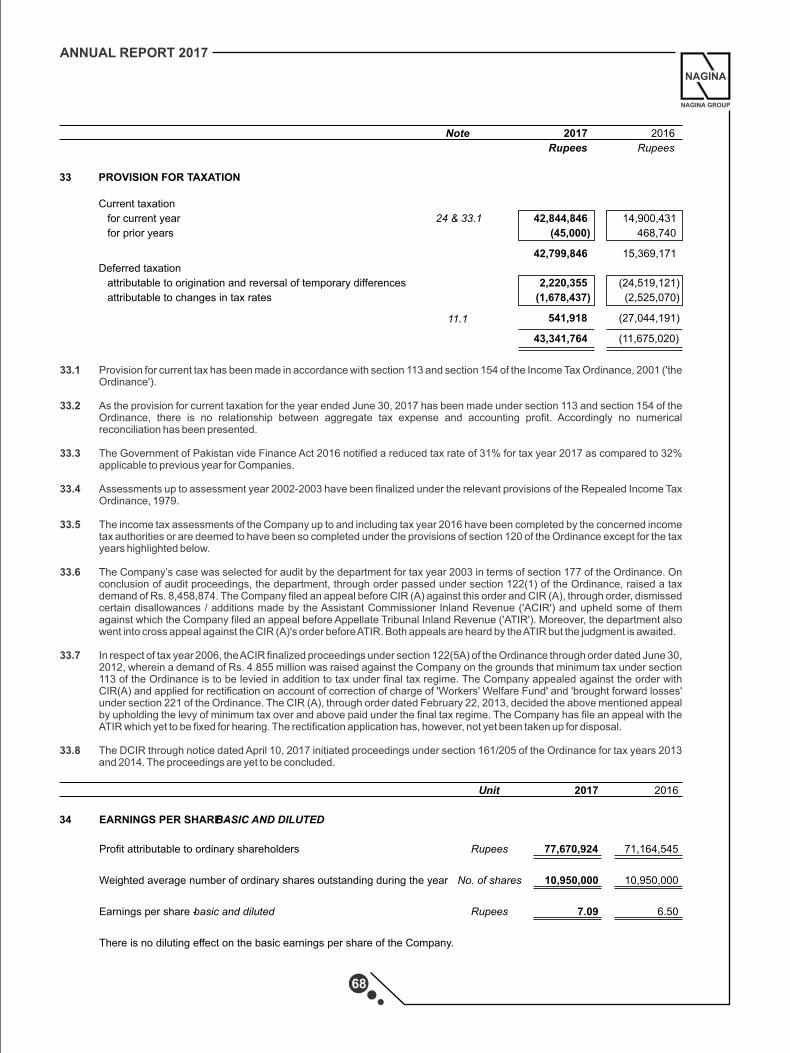
NAGINA
NAGINA GROUP
ELLCOT SPINNING MILLS LTD.
69
Unit 2017 2016
34 EARNINGS PER SHARE - BASIC AND DILUTED
Profit attributable to ordinary shareholders Rupees 77,670,924
71,164,545
Weighted average number of ordinary shares outstanding during the year No. of shares 10,950,000
10,950,000
Earnings per share - basic and diluted Rupees 7.09
6.50
There is no diluting effect on the basic earnings per share of the Company.
Note
33 PROVISION FOR TAXATION
Current taxation
for current year 24 & 33.1
for prior years
Deferred taxation
11.1
attributable to origination and reversal of temporary differences
attributable to changes in tax rates
2017 2016
Rupees Rupees
42,844,846
14,900,431
(45,000)
468,740
42,799,846
15,369,171
2,220,355
(24,519,121)
(1,678,437)
(2,525,070)
541,918
(27,044,191)
43,341,764
(11,675,020)
33.1 Provision for current tax has been made in accordance with section 113 and section 154 of the Income Tax Ordinance, 2001 ('the Ordinance').
33.2 As the provision for current taxation for the year ended June 30, 2017 has been made under section 113 and section 154 of the Ordinance, there is no relationship between aggregate tax expense and accounting profit. Accordingly no numerical reconciliation has been presented.
33.3 The Government of Pakistan vide Finance Act 2016 notified a reduced tax rate of 31% for tax year 2017 as compared to 32% applicable to previous year for Companies.
33.4 Assessments up to assessment year 2002-2003 have been finalized under the relevant provisions of the Repealed Income Tax Ordinance, 1979.
33.5 The income tax assessments of the Company up to and including tax year 2016 have been completed by the concerned income tax authorities or are deemed to have been so completed under the provisions of section 120 of the Ordinance except for the tax years highlighted below.
33.6 The Company’s case was selected for audit by the department for tax year 2003 in terms of section 177 of the Ordinance. On conclusion of audit proceedings, the department, through order passed under section 122(1) of the Ordinance, raised a tax demand of Rs. 8,458,874. The Company filed an appeal before CIR (A) against this order and CIR (A), through order, dismissed certain disallowances / additions made by the Assistant Commissioner Inland Revenue ('ACIR') and upheld some of them against which the Company filed an appeal before Appellate Tribunal Inland Revenue ('ATIR'). Moreover, the department also went into cross appeal against the CIR (A)'s order before ATIR. Both appeals are heard by the ATIR but the judgment is awaited.
33.7 In respect of tax year 2006, the ACIR finalized proceedings under section 122(5A) of the Ordinance through order dated June 30, 2012, wherein a demand of Rs. 4.855 million was raised against the Company on the grounds that minimum tax under section 113 of the Ordinance is to be levied in addition to tax under final tax regime. The Company appealed against the order with CIR(A) and applied for rectification on account of correction of charge of 'Workers' Welfare Fund' and 'brought forward losses' under section 221 of the Ordinance. The CIR (A), through order dated February 22, 2013, decided the above mentioned appeal by upholding the levy of minimum tax over and above paid under the final tax regime. The Company has file an appeal with the ATIR which yet to be fixed for hearing. The rectification application has, however, not yet been taken up for disposal.
33.8 The DCIR through notice dated April 10, 2017 initiated proceedings under section 161/205 of the Ordinance for tax years 2013 and 2014. The proceedings are yet to be concluded.
NAGINA
NAGINA GROUP
68
ANNUAL REPORT 2017
37 TRANSACTIONS AND BALANCES WITH RELATED PARTIES
Related parties from the Company's perspective comprise associated companies and key management personnel. Key management personnel are those persons having authority and responsibility for planning, directing and controlling the activities of the Company, directly or indirectly, and includes the Chief Executive and Directors of the Company
Transactions with key management personnel are limited to payment of short term employee benefits and dividend on ordinary shares. The Company in the normal course of business carries out various transactions with associated companies and continues to have a policy whereby all such transactions are carried out on commercial terms and conditions which are equivalent to those prevailing in an orderly transaction between market participants at the date of transaction.
There are no balances outstanding with related parties as at the reporting date. Detail of transactions with related parties is as follows:
35 CASH GENERATED FROM OPERATIONS
Profit before taxation
Adjustments for non-cash and other items
Interest/markup/profit on borrowings
Loss/(gain) on disposal of property, plant and equipment
Foreign exchange loss
Dividend income
Gain on disposal of short term investments
Provision for employees retirement benefits
Depreciation
Amortization of intangible asset
Changes in working capital
Stores, spares and loose tools
Stock in trade
Trade debts
Advances, prepayments and other receivables
Trade and other payables
Cash generated from/(used in) operations
36 CASH AND CASH EQUIVALENTS
Cash and bank balances
2017 2016
Rupees Rupees
121,012,688
59,489,525
54,693,558
46,097,743
5,709,867
(788,694)
631,895
620,209
(17,808,798)
(1,742,500) (2,815,234)
(7,947,604)
24,915,616
24,839,061 125,962,303
106,511,656
1,239,997
103,333
192,529,204
167,693,204
313,541,892
227,182,729
4,933,918
6,190,866
(112,123,666)
(69,305,117)
(108,766,211)
(65,381,144)
(54,160,341) (163,767,755)
35,727,837 (30,757,021)
(234,388,463) (323,020,171)
79,153,429 (95,837,442)
15,939,035 176,195,561
15,939,035 176,195,561
2017 2016
Rupees Rupees
37.1 Transactions with related parties
Nature of relationship Nature of transactions
Associated companies Purchases 12,202,250
76,637,954
Sales 741,435,524
1,145,617,237
Dividend paid 9,322,114
9,322,114
Key management personnel Short term employee benefits 8,764,279 14,290,394
Dividend paid to directors and their family members 17,131,531
17,969,434

NAGINA
NAGINA GROUP
ELLCOT SPINNING MILLS LTD.
71
39 FINANCIAL RISK EXPOSURE AND MANAGEMENT
The Company’s activities expose it to a variety of financial risks: credit risk, liquidity risk and market risk (including currency risk, interest rate risk and price risk). These risks affect revenues, expenses and assets and liabilities of the Company.
The Board of Directors has the overall responsibility for establishment and oversight of risk management framework. The Board of Directors has developed a risk policy that sets out fundamentals of risk management framework. The risk policy focuses on unpredictability of financial markets, the Company's exposure to risk of adverse effects thereof and objectives, policies and processes for measuring and managing such risks. The management team of the Company is responsible for administering and monitoring the financial and operational financial risk management throughout the company in accordance with the risk management framework.
The Company’s exposure to financial risks, the way these risks affect the financial position and performance, and forecast transactions of the Company and the manner in which such risks are managed is as follows:
39.1 Credit risk
Credit risk is the risk of financial loss to the Company, if the counterparty to a financial instrument fails to meet its obligations.
39.1.1 Maximum exposure to credit risk
Credit risk principally arises from the Company's loans and receivables and investment in separately managed accounts with asset management companies. The maximum exposure to credit risk as at the reporting date is as follows:
38 FINANCIAL INSTRUMENTS
The carrying amounts of the Company's financial instruments by class and category are as follows:
Note
38.1 Financial assets
Cash in hand 25
Loans and receivables
Long term deposits 18
Trade debts 21
Cash at bank 25
Available for sale financial assets
Investments in mutual fund units 23.1
Investments in listed equity securities 23.2
38.2 Financial liabilities
Financial liabilities at amortized cost
Long term finances 8
Liabilities against assets subject to finance lease 9
Short term borrowings 14
Accrued interest/markup 13
Trade creditors 12
Accrued liabilities 12
Unclaimed dividend 12
2017 2016
Rupees Rupees
-
2,565,443
7,090,700
7,090,700 390,184,845
281,423,824
15,939,035
173,630,118
413,214,580
462,144,642
27,644,085
-
518,398,414
119,964,290
546,042,499 119,964,290
959,257,079 584,674,375
566,909,450 627,884,775
- 1,108,785
922,677,657 452,833,638
17,411,243 11,201,552
31,471,589 34,556,378
127,263,866 106,044,828
4,606,115 4,237,900
1,670,339,920 1,237,867,856
NAGINA
NAGINA GROUP
70
ANNUAL REPORT 2017
Note
Loans and receivables
Long term deposits 18
Trade debts 21
Cash at bank 25
Available for sale financial assets
Separately managed account 23.2
39.1.2 Concentrations of credit risk
2017 2016
Rupees Rupees
Customers 390,184,845 281,423,824
Utility companies and regulatory authorities 7,090,700 7,090,700
Banking companies and financial institutions 154,828,130 173,630,118
552,103,675 462,144,642
The Company's maximum exposure to credit risk, as at the reporting date, by type of counterparty is as follows:
2017 2016
Rupees Rupees
7,090,700 7,090,700
390,184,845 281,423,824
15,939,035 173,630,118
413,214,580 462,144,642
138,889,095 -
552,103,675 462,144,642
39.1.3 Credit quality and impairment
Credit quality of financial assets is assessed by reference to external credit ratings, where available, or to historical information about counterparty default rates.
(a) Counterparties with external credit ratings
These include banking companies and financial institutions, which are counterparties to 'cash at bank' and 'separately managed account'. These counterparties have reasonably high credit ratings as determined by various credit rating agencies. Due to long standing business relationships with these counterparties and considering their strong financial standing, management does not expect non-performance by these counterparties on their obligations to the Company.
(b) Counterparties without external credit ratings
These include customers which are counter parties to 'trade debts' and utility companies and regulatory authorities which are counter parties to 'long term deposits'. Credit risk in respect of long term deposits is considered to be insignificant as non-performance by these parties is not expected. The Company is exposed to credit risk in respect of trade debts. The analysis of ages of trade debts as at the reporting date is as follows:
Gross Accumulated Gross Accumulated
carrying amount Impairment carrying amount Impairment
Rupees Rupees Rupees Rupees
Neither past due nor impaired 216,206,358
-
124,000,123
-
Past due by 0 to 12 months 165,853,747
-
148,692,778
-
Past due by more than 12 months 8,124,740
-
8,730,923
-
390,184,845
-
281,423,824
-
2017 2016
The Company's two (2016: two) significant customers account for Rs. 152.29 million (2016: Rs. 88.34 million) of trade debts as at the reporting date, apart from which, exposure to any single customer does not exceed 10% (2016: 10%) of trade debts as at the reporting date. These significant customers have long standing business relationships with the Company and have a good payment record and accordingly non-performance by these customers is not expected. Further, trade debts amounting to Rs. 14.74 million (2016: Rs. 18.40 million) are secured through letters of credit and thus do not carry any significant credit risk. Management believes that trade debts that are past due are collectible in full, based on historical payment behavior and extensive analysis of customer credit risk.

NAGINA
NAGINA GROUP
ELLCOT SPINNING MILLS LTD.
73
Long term finances
Liabilities against assets
subject to finance lease
Short term borrowings
Accrued interest/markup
Trade creditors
Accrued liabilities
Unclaimed dividend
Long term finances
Liabilities against assets
subject to finance lease
Short term borrowings
Accrued interest/markup
Trade creditors
Accrued liabilities
Unclaimed dividend
Carrying Contractual One year One to More than
amount cash flows or less three years three years
Rupees Rupees Rupees Rupees Rupees
566,909,450
641,173,470
95,745,463
247,806,074
297,621,933
-
-
-
-
-
922,677,657
924,397,662
924,397,662
-
-
17,411,243
17,411,243
17,411,243
-
-
31,471,589
31,471,589
31,471,589
-
-
127,263,866
127,263,866
127,263,866
-
-
4,606,115
4,606,115
4,606,115
-
-
1,670,339,920
1,746,323,945
1,200,895,938
247,806,074
297,621,933
Carrying Contractual One year One to More than
amount cash flows or less three years three years
Rupees Rupees Rupees Rupees Rupees
627,884,775
735,193,619
120,050,417
224,564,331
390,578,871
1,108,785
1,131,218
1,131,218
-
-
452,833,638
453,753,218
453,753,218
-
-
11,201,552
11,201,552
11,201,552
-
-
34,556,378
34,556,378
34,556,378
-
-
106,044,828
106,044,828
106,044,828
-
-
4,237,900
4,237,900
4,237,900
-
-
1,237,867,856 1,346,118,713
730,975,511
224,564,331
390,578,871
2017
2016
39.1.4 Collateral held
The Company does not hold any collateral to secure its financial assets with the exception of trade debts, which are partially secured through letters of credit.
39.1.5 Credit risk management
As mentioned in note 39.1.3 to the financial statements, the Company's financial assets do not carry significant credit risk, with the exception of trade debts, which are exposed to losses arising from any non-performance by customers. In respect of trade debts, the Company manages credit risk by limiting significant exposure to any single customer. Formal policies and procedures of credit management and administration of trade debts are established and executed. In monitoring customer credit risk, the ageing profile of trade debts and individually significant balances, along with collection activities are reviewed on a regular basis. High risk customers are identified and restrictions are placed on future trading, including suspending future shipments and administering dispatches on a prepayment basis or confirmed letters of credit.
39.2 Liquidity risk
Liquidity risk is the risk that the Company will not be able to meet its financial obligations as they fall due.
39.2.1 Exposure to liquidity risk
The following is the analysis of contractual maturities of financial liabilities, including estimated interest/markup/profit payments.
NAGINA
NAGINA GROUP
72
ANNUAL REPORT 2017
CHF JPY Euro USD Total
Rupees Rupees Rupees Rupees Rupees
Financial assets
Trade debts -
-
-
14,735,985
14,735,985
Cash at bank -
-
-
-
-
-
-
-
14,735,985
14,735,985
Financial liabilities
Short term borrowings -
-
-
(276,581,588) (276,581,588)
Accrued interest/markup -
-
-
(719,304)
(719,304)
-
-
-
(277,300,892) (277,300,892)
Net balance sheet exposure -
-
-
(262,564,907) (262,564,907)
Foreign currency commitments (223,656,395)
(4,167,925)
(254,995,370)
(752,208,531) (1,235,028,221)
Net exposure (223,656,395)
(4,167,925)
(254,995,370)
(1,014,773,438) (1,497,593,128)
CHF JPY Euro USD Total
Rupees Rupees Rupees Rupees Rupees
Financial assets
Trade debts -
-
-
18,398,157
18,398,157
Cash at bank -
-
-
33,022
33,022
-
-
-
18,431,179
18,431,179
Financial liabilities
Short term borrowings -
-
-
(200,645,222) (200,645,222)
Accrued interest/markup -
-
-
(308,591)
(308,591)
-
-
-
(200,953,813) (200,953,813)
Net balance sheet exposure - - - (182,522,634) (182,522,634)
Foreign currency commitments - (424,771) (27,164,550) (95,570,805) (123,160,126)
Net exposure - (424,771) (27,164,550) (278,093,439) (305,682,760)
2017
2016
39.2.2 Liquidity risk management
The Company's approach to managing liquidity risk is to ensure, as far as possible, that it will always have sufficient liquidity to meet its liabilities when due, under both normal and stressed conditions, without incurring unacceptable losses or risking damage to the Company's reputation. The Company monitors cash flow requirements and produces cash flow projections for the short and long term. Typically, the Company ensures that it has sufficient cash on demand to meet expected operational cash flows, including servicing of financial obligations. This includes maintenance of balance sheet liquidity ratios, debtors and creditors concentration both in terms of overall funding mix and avoidance of undue reliance on large individual customer. The Company also maintains various lines of credit with banking companies.
39.3 Market risk
39.3.1 Currency risk
Currency risk is the risk that fair values or future cash flows of a financial instrument will fluctuate because of changes in foreign exchange rates. Currency risk arises from transactions and resulting balances that are denominated in a currency other than functional currency.
(a) Exposure to currency risk
The Company's exposure to currency risk as at the reporting date is as follows:

NAGINA
NAGINA GROUP
ELLCOT SPINNING MILLS LTD.
75
(b) Exchange rates applied as at the reporting date
CHF
JPY
Euro
USD
The following spot exchange rates were applied as at the reporting date.
Assets Liabilities Assets Liabilities
Rupees Rupees Rupees Rupees
-
109.7500
-
-
-
0.9392
-
1.0186
-
120.1400
-
116.3100
104.8000
105.0000
104.5000
104.7000
2017 2016
(c) Sensitivity analysis
A five percent appreciation in Pak Rupee against foreign currencies would have increased profit for the year and equity as at the reporting date by Rs. 13.13 million (2016: Rs. 9.13 million). A five percent depreciation in Pak Rupee would have had an equal but opposite effect on profit and equity. The analysis assumes that all other variables, in particular interest rates, remain constant and ignores the impact, if any, on provision for taxation for the year.
(d) Currency risk management
The Company manages its exposure to currency risk through continuous monitoring of expected/forecast committed and non-committed foreign currency payments and receipts. Reports on forecast foreign currency transactions, receipts and payments are prepared on monthly basis, exposure to currency risk is measured and appropriate steps are taken to ensure that such exposure is minimized while optimizing return. This includes matching of foreign currency liabilities/payments to assets/receipts and using source inputs in foreign currency.
39.3.2 Interest rate risk
Interest rate risk is the risk that fair values or future cash flows of a financial instrument will fluctuate because of changes in interest rates.
(a) Interest/markup/profit bearing financial instruments
The effective interest/markup rates for interest/markup/profit bearing financial instruments are mentioned in relevant notes to the financial statements. The Company's interest/markup/profit bearing financial instruments as at the reporting date are as follows:
2017 2016
Rupees Rupees
Fixed rate instruments
Financial assets -
100,071,233
Financial liabilities -
-
Variable rate instruments
Financial assets -
-
Financial liabilities 1,444,550,309 1,055,539,165
(b) Fair value sensitivity analysis for fixed rate instruments
The Company does not account for its fixed rate instruments at fair value through profit or loss.
(c) Cash flow sensitivity analysis for variable rate instruments
An increase of 100 basis points in interest rates as at the reporting date would have decreased profit for the year and equity as at the reporting date by Rs. 14.45 million (2016: Rs. 10.56 million). A decrease of 100 basis points would have had an equal but opposite effect on profit and equity. The analysis assumes that all other variables, in particular foreign exchange rates, remain constant and ignores the impact, if any, on provision for taxation for the year.
(d) Interest rate risk management
The Company manages interest rate risk by analysing its interest rate exposure on a dynamic basis. Cash flow interest rate risk is managed by simulating various scenarios taking into consideration refinancing, renewal of existing positions and alternative financing. Based on these scenarios, the Company calculates impact on profit after taxation and equity of defined interest rate shift, mostly 100 basis points.
NAGINA
NAGINA GROUP
74
ANNUAL REPORT 2017
a) Recurring fair value measurements
Nature of asset Hierarchy 2017 2016
Rupees Rupees
Available for sale financial assets
Investments in mutual Level 1 21,043,000 -
fund units
Investments in equity Level 1 518,398,414 119,964,290
securities
Valuation techniques/Key inputs
Quoted prices in an active market
Quoted prices in an active market
Unit 2017
Total debt Rupees 566,909,450
Total equity Rupees 1,449,024,088
Total capital employed 2,015,933,538
Gearing % age 28.12
2016
628,993,560
1,418,481,699
2,047,475,259
30.72
There were no changes in the Company's approach to capital management during the year. The Company is not subject to externally imposed capital requirements, except those related to maintenance of debt covenants, commonly imposed by the providers of debt finance.
41 FAIR VALUE MEASUREMENTS
41.1 Financial Instruments
41.1.1 Financial instruments measured at fair value
The Company measures some of its assets at fair value at the end of each reporting period. Fair value measurements are classified using a fair value hierarchy that reflects the significance of the inputs used in making the measurements and has the following levels.
Level 1 Quoted prices (unadjusted) in active markets for identical assets or liabilities.
Level 2 Inputs other than quoted prices included within Level 1 that are observable for the asset or liability, either directly (that is, as prices) or indirectly (that is, derived from prices).
Level 3 Inputs for the asset or liability that are not based on observable market data (that is, unobservable inputs).
The fair value hierarchy of assets measured at fair value and the information about how the fair values of these financial instruments are determined are as follows:
39.3.3 Price risk
Price risk represents the risk that the fair value or future cash flows of financial instrument will fluctuate because of changes in market prices, other than those arising from interest rate risk or currency risk, whether those changes are caused by factors specific to the individual financial instrument or its issuer, or factors affecting all similar financial instruments. The Company is exposed to price risk in respect of its investments in equity securities and mutual fund units.
A one percent appreciation in prices of equity securities and mutual fund units as at reporting date would have increased equity as at the reporting date by Rs 5.46 million (2016: 1.2 million) and profit for the year by nil (2016: nil). A one percent diminution in prices of equity securities and mutual fund units as at the reporting date would have had equal but opposite effect on profit and equity. The analysis assumes that all other variables remain constant and ignores the impact, if any, on provision for taxation for the year.
40 CAPITAL MANAGEMENT
The Company's policy is to maintain a strong capital base so as to maintain investor, creditor and market confidence and to sustain future development of the business. The Board of Directors monitors the return on capital and level of dividends to ordinary shareholders. The Company seeks to keep a balance between the higher return that might be possible with higher level of borrowings and the advantages and security afforded by a sound capital position. The Company monitors capital using the gearing ratio which is debt divided by total capital employed. Debt comprises long term finances and liabilities against assets subject to finances lease, including current maturity. Total capital employed includes total equity as shown in the balance sheet plus debt. The Company's strategy is to maintain an optimal capital structure in order to minimize cost of capital. Gearing ratio of the Company as at the reporting date is as follows:

NAGINA
NAGINA GROUP
ELLCOT SPINNING MILLS LTD.
77
2017 2016
Rupees Rupees
42 RESTRICTION ON TITLE AND ASSETS PLEDGED/MORTGAGED AS SECURITY
Mortgages and charges
Charge over current assets 2,926,000,000
6,051,095,898
Charge over fixed assets 934,000,000
1,161,000,000
b) Non-recurring fair value measurements
There are no non-recurring fair value measurements as at the reporting date.
41.1.2 Financial instruments not measured at fair value
The management considers the carrying amount of all financial instruments not measured at fair value to approximate their carrying values.
41.2 Assets and liabilities other than financial instruments.
None of the assets and liabilities other than financial instruments are measured at fair value.
43 REMUNERATION OF CHIEF EXECUTIVE, DIRECTORS AND EXECUTIVES
The aggregate amount charged to profit or loss in respect of chief executive, directors and executives on account of managerial remuneration, allowances and perquisites, post employment benefits and the number of such directors and executives is as follows:
Managerial remuneration
Allowances and perquisites
Meeting fee
Post employment benefits
Number of persons
Managerial remuneration
Allowances and perquisites
Meeting fee
Post employment benefits
Number of persons
Chief Executive
Rupees
3,614,400
2,839,852
-
-
6,454,252
Chief Executive Directors Executives
Rupees Rupees Rupees
3,979,200
788,400
12,606,900
3,074,529
502,150
6,301,056
-
420,000
-
-
-
1,829,830
7,053,729 1,710,550 20,737,786
1 2 11
Directors Executives
Rupees Rupees
4,731,600 12,507,000
2,764,542 6,248,200
340,000 -
- 3,763,980
7,836,142 22,519,180
1 3 11
2017
2016
43.1 Remuneration, allowances and meeting fee include Rs. 1,710,550 (2016: Rs. 7,836,142) paid to non-executive directors of the Company.
43.2 Chief Executive, Directors and Executives are provided with free use of company maintained vehicles.
NAGINA
NAGINA GROUP
76
ANNUAL REPORT 2017
2017 2016
No of shares No of shares
44 SHARES IN THE COMPANY HELD BY ASSOCIATED COMPANIES
Ordinary shares in the Company held by associated companies are as follows:
Haroon Omer (Private) Limited 664,572
664,572
Monell (Private) Limited 664,572
664,572
Icaro (Private) Limited 664,572
664,572
ARH (Private) Limited 628,400
628,400
Ellahi International (Private) Limited 41,345
41,345
2,663,461
2,663,461
45 SEGMENT INFORMATION
45.1 The Company is a single operating segment.
45.2 All non-current assets of the Company are situated in Pakistan.
45.3 All sales of the Company have originated from Pakistan.
45.4 Sales include Rs. 1,984 million (2016: Rs. 1,762 million) of revenue derived from sales to three (2016: two) customers. There is no other single significant external customer to whom sales in excess of 10% of the Company's total sales were made during the year.
46 EVENTS AFTER THE REPORTING PERIOD
The Board of Directors in their meeting held on September 28, 2017 has proposed dividend on ordinary shares at Rs. 3.50 per ordinary share of Rs. 10 each. The proposed dividend is subject to approval of the Company's shareholders in the forthcoming annual general meeting and has not been included as a liability in the financial statements.
47 PLANT CAPACITY AND ACTUAL PRODUCTION
Unit 2017 2016
Number of spindles installed No. 61,728 61,728 Plant capacity on the basis of utilization converted into 30s count Kgs 13,030,213 11,635,279 Actual production converted into 30s count Kgs 12,332,907 11,267,568
It is difficult to precisely compare production capacity and the resultant production converted into base count in the textile industry since it fluctuates widely depending on various factors such as count of yarn spun, raw materials used, spindle speed and twist etc. It would also vary according to pattern of production adopted in a particular year.
48 DATE OF AUTHORIZATION FOR ISSUE
These financial statements were authorized for issue on September 28, 2017 by the Board of Directors of the Company
49 NUMBER OF EMPLOYEES
Total number of employees of the Company as at the reporting date are 827 (2016: 1,040). Average number of persons employed by the Company during the year are 885 (2016: 1,027).
50 RECOVERABLE AMOUNTS AND IMPAIRMENT
As at the reporting date, recoverable amounts of all assets/cash generating units are equal to or exceed their carrying amounts, unless stated otherwise in these financial statements.
51 EVENTS AFTER THE REPORTING PERIOD
There are no significant events after the reporting period which may require adjustment and/or disclosure in these financial statements.
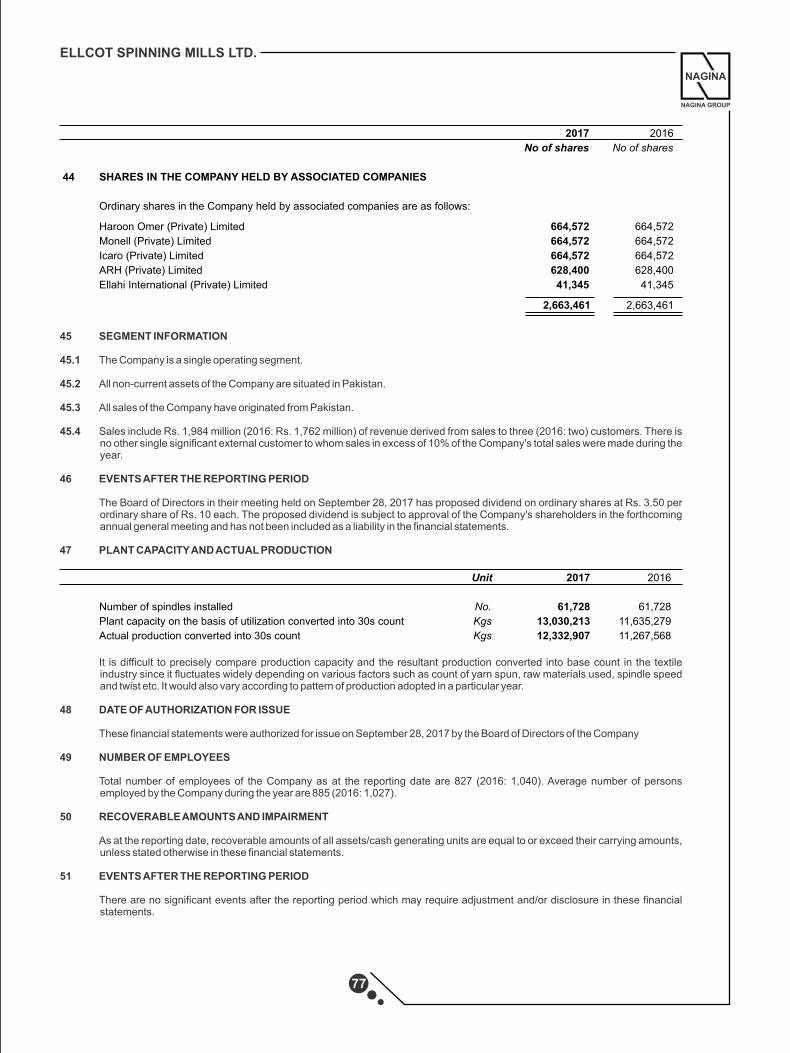
NAGINA
NAGINA GROUP
ELLCOT SPINNING MILLS LTD.
77
2017 2016
Rupees Rupees
42 RESTRICTION ON TITLE AND ASSETS PLEDGED/MORTGAGED AS SECURITY
Mortgages and charges
Charge over current assets 2,926,000,000
6,051,095,898
Charge over fixed assets 934,000,000
1,161,000,000
b) Non-recurring fair value measurements
There are no non-recurring fair value measurements as at the reporting date.
41.1.2 Financial instruments not measured at fair value
The management considers the carrying amount of all financial instruments not measured at fair value to approximate their carrying values.
41.2 Assets and liabilities other than financial instruments.
None of the assets and liabilities other than financial instruments are measured at fair value.
43 REMUNERATION OF CHIEF EXECUTIVE, DIRECTORS AND EXECUTIVES
The aggregate amount charged to profit or loss in respect of chief executive, directors and executives on account of managerial remuneration, allowances and perquisites, post employment benefits and the number of such directors and executives is as follows:
Managerial remuneration
Allowances and perquisites
Meeting fee
Post employment benefits
Number of persons
Managerial remuneration
Allowances and perquisites
Meeting fee
Post employment benefits
Number of persons
Chief Executive
Rupees
3,614,400
2,839,852
-
-
6,454,252
Chief Executive Directors Executives
Rupees Rupees Rupees
3,979,200
788,400
12,606,900
3,074,529
502,150
6,301,056
-
420,000
-
-
-
1,829,830
7,053,729 1,710,550 20,737,786
1 2 11
Directors Executives
Rupees Rupees
4,731,600 12,507,000
2,764,542 6,248,200
340,000 -
- 3,763,980
7,836,142 22,519,180
1 3 11
2017
2016
43.1 Remuneration, allowances and meeting fee include Rs. 1,710,550 (2016: Rs. 7,836,142) paid to non-executive directors of the Company.
43.2 Chief Executive, Directors and Executives are provided with free use of company maintained vehicles.
NAGINA
NAGINA GROUP
76
ANNUAL REPORT 2017
2017 2016
No of shares No of shares
44 SHARES IN THE COMPANY HELD BY ASSOCIATED COMPANIES
Ordinary shares in the Company held by associated companies are as follows:
Haroon Omer (Private) Limited 664,572
664,572
Monell (Private) Limited 664,572
664,572
Icaro (Private) Limited 664,572
664,572
ARH (Private) Limited 628,400
628,400
Ellahi International (Private) Limited 41,345
41,345
2,663,461
2,663,461
45 SEGMENT INFORMATION
45.1 The Company is a single operating segment.
45.2 All non-current assets of the Company are situated in Pakistan.
45.3 All sales of the Company have originated from Pakistan.
45.4 Sales include Rs. 1,984 million (2016: Rs. 1,762 million) of revenue derived from sales to three (2016: two) customers. There is no other single significant external customer to whom sales in excess of 10% of the Company's total sales were made during the year.
46 EVENTS AFTER THE REPORTING PERIOD
The Board of Directors in their meeting held on September 28, 2017 has proposed dividend on ordinary shares at Rs. 3.50 per ordinary share of Rs. 10 each. The proposed dividend is subject to approval of the Company's shareholders in the forthcoming annual general meeting and has not been included as a liability in the financial statements.
47 PLANT CAPACITY AND ACTUAL PRODUCTION
Unit 2017 2016
Number of spindles installed No. 61,728 61,728 Plant capacity on the basis of utilization converted into 30s count Kgs 13,030,213 11,635,279 Actual production converted into 30s count Kgs 12,332,907 11,267,568
It is difficult to precisely compare production capacity and the resultant production converted into base count in the textile industry since it fluctuates widely depending on various factors such as count of yarn spun, raw materials used, spindle speed and twist etc. It would also vary according to pattern of production adopted in a particular year.
48 DATE OF AUTHORIZATION FOR ISSUE
These financial statements were authorized for issue on September 28, 2017 by the Board of Directors of the Company
49 NUMBER OF EMPLOYEES
Total number of employees of the Company as at the reporting date are 827 (2016: 1,040). Average number of persons employed by the Company during the year are 885 (2016: 1,027).
50 RECOVERABLE AMOUNTS AND IMPAIRMENT
As at the reporting date, recoverable amounts of all assets/cash generating units are equal to or exceed their carrying amounts, unless stated otherwise in these financial statements.
51 EVENTS AFTER THE REPORTING PERIOD
There are no significant events after the reporting period which may require adjustment and/or disclosure in these financial statements.

52 GENERAL
52.1 Figures have been rounded off to the nearest rupee.
52.2 Comparative figures have been rearranged and reclassified, where necessary, for the purpose of comparison. However, there were no significant reclassifications during the year.
Mg. Director (Chief Executive)
Shafqat Ellahi Shaikh
Lahore: September 28, 2017
Shahzada Ellahi Shaikh
Director
NAGINA
NAGINA GROUP
78
ANNUAL REPORT 2017
1. If a member is unable to attend the meeting, he/she may sign this form and send it to the Secretary so as to reach him not less than 48 hours before the time of holding the meeting.
2. Members through CDC appointing proxies must attach attested copy of their Computerized National Identity Card with the proxy form.
3. The Shareholders through CDC, who wish to attend the Annual General Meeting are requested to please bring, original Computerized National Identity Card with copy thereof duly attested by their Bankers, Account number and Participant I.D number for identification purpose.
4. In case of corporate entity, certified copy of the Board of Directors resolution / power of attorney with specimen signature shall be submitted (unless it has been provided earlier) along with proxy form of the Company.
NAGINA
NAGINA GROUP
ELLCOT SPINNING MILLS LTD.
79
FORM OF PROXY
The Secretary,ELLCOT SPINNING MILLS LTD.Nagina House,91-B-1, M.M. Alam Road,Gulberg-III,Lahore-54660.
AffixRs. 5/=
RevenueStamp
(Signature should agree with theSpecimen signature registered
with the Company)
Signed at
NOTES:
this the day of 2017
I/We ______________________________________________________ of _________________
being member(s) of ELLCOT SPINNING MILLS LTD., and holder of ____________________
Ordinary Shares as per Share Register Folio No. ________________ (In case of Central Depository
System Account Holder A/c No. _______________ Participant I.D. No. _____________-
_____________) hereby appoint __________________________________________ of
__________________ who is member of the company as per Register Folio No. -
_______________________ (In case of Central Depository System Account Holder A/c No.
_______________ Participant I.D. No. __________________________) or failing him/her
______________________________________________ of __________________ who is
member of the Company as per Register Folio No. _____________________ (In case of Central
Depository System Account Holder A/c No. _______________ Participant I.D. No. th________________) as my/our proxy to vote for me/us and on my/our behalf at the 29 Annual
General Meeting of the Company to be held on October 27, 2017 and at any adjournment thereof.

NAGINA
NAGINA GROUP
ELLCOT SPINNING MILLS LTD.
81
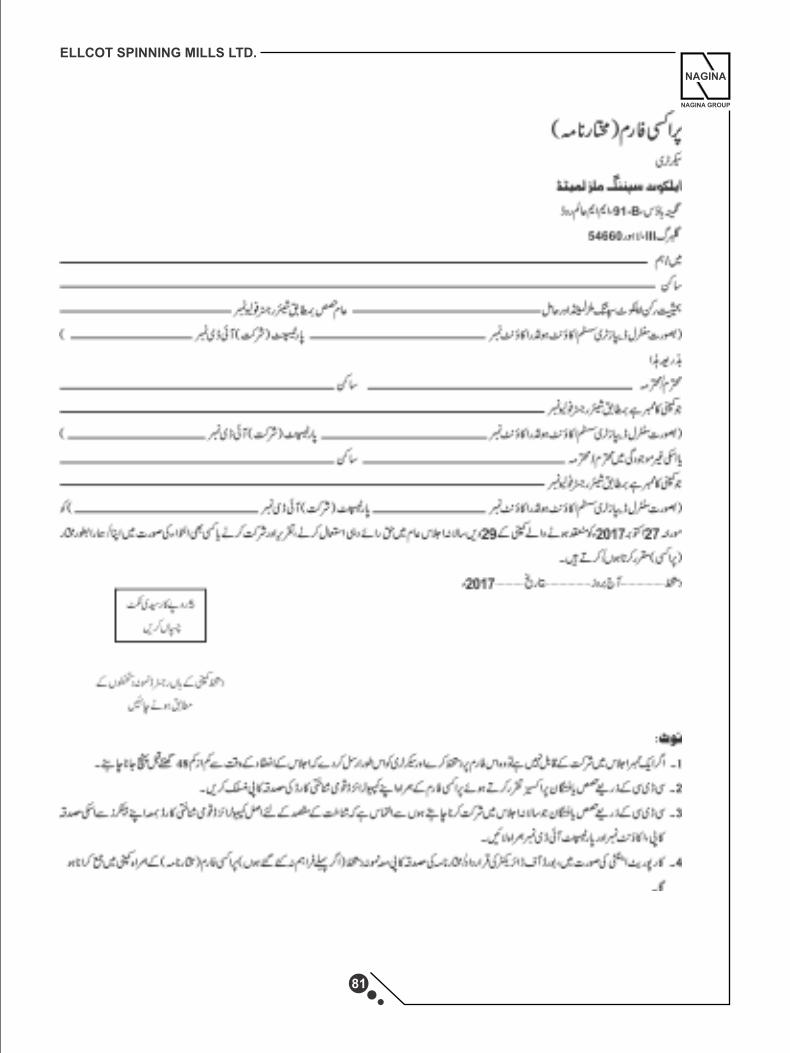
NAGINA
NAGINA GROUP
ELLCOT SPINNING MILLS LTD.
81

Nagina House, 91-B-1, M.M. Alam Road,
Gulberg-III Lahore-54660
www.nagina.com
Ellcot Spinning Mills Limited

Nagina House, 91-B-1, M.M. Alam Road,
Gulberg-III Lahore-54660
www.nagina.com
Ellcot Spinning Mills Limited