Embed Size (px)
Citation preview
www.genesta-finance.com
G G E N E S T A Equity & Bond Research
1
Quantel 19 March 2018
Genesta is registered as a Financial Investment Advisor and is a member of ACIFTE (ORIAS Number: 13000591). Refer to important warnings at the end of the document. For additional information on Genesta and its internal procedures, please consult the website www.genesta-finance.com.
Recommendation 1. Strong Buy
Closing Price on 16 March 2018 €7,40
Target price €10,35 (+39,9%)
Market data
Reuters / Bloomberg ticker QUTL.PA / QUA:FP
Market capitalisation (€m) 116,71
Enterprise value (€m) 126,19
Free Float €m 39,7 (30,1%)
Number of shares 15 771 457
Daily volume 112 513
Capital turnover rate (1 year) 25,26%
High (52 weeks) €8,01
Low (52 weeks) €4,50
Performances
Absolute perf. 1 month 6 months 12 months
4,5% +13,8% +51%
Current shareholding structure
Agenda
2017 earnings on Thursday 29 March before market
Key figures Ratios
2015 2016 2017E PF 2018E 2019E 2015 2016 2017E PF 2018E 2019E
Sales (€m) 62,1 63,3 85,1 95,3 109,6 EV / Sales 0,5 0,6 1,2 1,3 1,1
Change (%) 21,1% 1,8% 34,5% 15,1% EV / EBITDA* 5,7 8,1 9,4 8,0 5,4
EBITDA (€m)* 5,9 4,9 10,7 15,7 21,7 EV / EBIT* 14,6 35,7 14,9 12,3 8,0
EBIT (€m)* 2,3 1,1 6,8 10,2 14,7 P / E 11,5 50,0 21,1 16,3 11,0
Ebit margin (%) 3,8% 1,7% 8,0% 13,5%
Net profit gp sh. (€m) 2,1 0,6 4,1 7,2 10,6 Gearing (%) 35% 24% 21% 12% 1%
Net margin (%) 3,4% 1,0% 4,8% 7,5% 9,7% Net debt / EBITDA* 1,6 1,5 1,4 0,6 0,1
EPS 0,26 0,07 0,26 0,45 0,67 ROCE (%) 6% 2% 5% 8% 11%* : EBITDA & EBIT under IFRS, ie t aking int o account R&D act ivat ion
10,8%
11,9%
Esira : 44% ; Eurodyne : 10,7% ; Amiral Gestion : 6,9% ;
Cogefi : 4,8% ; Keren : 3,5% ; Free Float : 30,1%
3,0
4,0
5,0
6,0
7,0
8,0
9,0
03-17 05-17 07-17 09-17 11-17 01-18
Quantel CAC All-Tradable (rebasé)
INIT
IATI
ON
OF
CO
VER
AG
E
Electronics Equipments
Date de première diffusion : 19 March 2018
Quantel
Creation of a laser champion in Europe
Critical mass in the laser market The October 2017 business combination between Quantel and Keopsys created a European specialist in the high value-added lasers. The new entity is actually a reverse take-over of Quantel by Keopsys. The new group generated €85,1m of sales in 2017 Pro Forma, an Ebit margin estimated at 8.0% of sales and a net margin of 4.8%. Over the last years, Keopsys was significantly more profitable than Quantel thanks to a better product positioning (fast growing fiber lasers technology) and a business model focused on high volume production lines.
Excellent coverage of the various laser technologies The new entity covers now virtually all the modern laser technologies: fiber lasers (the most promising market), solid-state lasers, semiconductor lasers and dye lasers. The global lasers market was estimated at around $4.8bn in 2015 by Laser Focus World, with a growth estimated to $6.8bn by 2020 (+7% CAGR). Specific laser technologies will grow by double digit figures by the end of the decade. Another positive point about lasers is the extremely large number of applications in various fields: medicine, industry, science/research, military, space, communications and commercial products.
Promising new applications for Quantel/Keopsys In addition to all the products and costs synergetic gains made possible by the business combination, the company indicates that the main growth drivers in the next few years will be the Lidar sensors, the military and the medical sector. The Lidar (Light Detection and Ranging) sensors are the most promising. They enable to detect obstacles extremely rapidly and precisely, which is of prime importance for the development of the potentially huge unmanned vehicles market.
2017 earnings to confirm positive earnings trend The new entity full 2017 Pro Forma earnings will be published on March 29th. They will already show a significant improvement compared to the Pro Forma 2016 earnings. For 2018 and beyond, the combination of the merger synergies and growing volumes should result in a large expansion of the EBIT margin (13.5% of sales in 2019E vs 1.7% in 2016).
These results should also generate high cashflow and deliver a strong balance sheet to the structure, with a net cash position from 2020E.
Valuation Based on our valuation calculation built on conservative metrics and two methods (DCF and comparables), we get to a €10.35 price target.
François COLLI Financial Analyst
[email protected] +33 1 45 63 68 88
www.genesta-finance.com
G G E N E S T A Equity & Bond Research
2
19 March 2018 Quantel
Company profile
A new laser champion in Europe Quantel and Keopsys merger enables to combine two complementary companies. Quantel was mainly focused on small series and in particular scientific lasers while Keopsys had been able to move from small to large series, thus generating economies of scale and a better profitability. The new merged company masters all modern lasers techniques and addresses a large number of applications. The strong position on various sensors like wind turbines or Lidar shows a capacity to address tomorrow’s markets. The new company CEO, coming from the Keopsys side, makes us also confident that the winning strategy will be continued and extended to the new group.
A company facing large competitors
Quantel is active in a field where a multitude of different types and sizes of companies operates. A minority of competitors are small size entities ie LPKF Laser & Electronics AG, Ellex Medical Lasers Ltd or Iridex, but there are also industrial giants like Coherent Inc., IPG Photonics Corporation, Topcon Corp., Carl Zeiss Meditec AG, Han’s Laser Technology Industry and even General Dynamics or Lockheed Martin. This implies in our view that Quantel must stay focus on specific high valued technologies. In addition, it means that Quantel could be bought in the future by one of its larger competitors.
The short term is bright
Whatever the current competitive environment, we see the short term prospects of Quantel as bright: new CEO, better coverage of product panel, reinforced marketing efficiency and internationalization, strong position on growing markets, general cost synergies, gradual move from small to large production series and strong balance sheet and cashflow generation.
Valuation Method
DCF
Our DCF is built into three stages. Stage 1 results from our detailed Quantel earnings calculation until 2026E (10 years). The operating FCF increases rapidly over there thanks mainly to the EBITDA growth. Stage 2 sets the operating FCF at +3.0% annually. Stage 3 sets the FCF growth to +2.0% annually to infinity. The key trend in our view for the new group will be the EBIT margin improvement brought by the Keopsys deal. Keopsys brings new management and industrial processes to Quantel which should deliver better profitability and cashflow gradually in the next few years. After discounting the free cashflow at a WACC of 10.80% (detail of the WACC calculation later in this research note), we get to a DCF valuation of €9.98 per share.
Comparables
As indicated above, there is a large number of comparables showing various sizes sometimes with much larger market capitalisations than for Quantel. We have decided to select a panel of five companies evolving in the laser industry, excluding biggest companies or ones showing operating margin ratios much more different than those of Quantel. The comparables valuation for Quantel delivers a €10.73 per share result, after taking into account a 18.4% size discount. The average of the two methods shows a fair value estimated at €10.35 .
Investment case We believe that the business combination created by Quantel/Keopsys offers a great opportunity for investors willing to participate to the development of this new company. In particular, we note:
- A growing laser market with more and more applications;
- A new management with an excellent track record;
- The synergies offered by the two companies, in terms of costs as well as top line;
- A valuation still reasonable and the possibility of a future acquisition of the company by a larger player.
Pro Forma 2016 Earnings
The group combination was consummated in October 2017. Pro Forma 2016 accounts (non audited) were then established to give an idea of the main size and ratios of the new group. They show a 2016 Pro Forma revenue of €80.5m and an EBIT of €3.7m (4.6% of revenues).
FY 2017 to be released end of March should deliver a significant improvement.
The management is confident that 2017 figures will be of good quality. This is encouraging and showing an improvement even before the synergies between Quantel and Keopsys are clicking on a full year. The 2007 revenues have recently been published: €85.1m Pro Forma revenues (to be compared to €80.5m for 2016). The Pro Forma growth compared to the previous year is then at +5.7% and +9.8% excluding the large India contract invoiced in H1 2016.
Valuation upside: 39.9%
We have used two valuation methods for the company: DCF and comparables. With solid earnings growth (in line with this industry), as well as reasonable multiples, we estimate a price target of €10.35, representing a +39.9% upside. We believe that investors seeking good fundamental business models with a reasonable future visibility should take a look at Quantel.
SWOT
Strengths Weaknesses
- Excellent technical position on the promising fiber laser
technology
- Quasi-majority of laser techniques mastered
- Synergies generated by the Quantel/Keopsys business
combination
- New CEO
- Markets growing in many applications
- Small size compared to leading producers
- The group is still too active on some non-profitable
scientific lasers
Opportunities Threats
- Considerable market growth prospect for the Lidar (Light Detection and Ranging)
sensors
- Critical mass of the new group enabling access to new military markets
- New medical applications
- Development of mass production in the new group
- Commercial and cost synergies in the new group
- Aggressive attack of foreign competitors on the French market
- Major new technology displacing laser

www.genesta-finance.com
G G E N E S T A Equity & Bond Research
3
19 March 2018 Quantel
Table of contents
1 Laser technologies and applications ............................................................................................................. 4
1.1 Quick presentation of laser technologies ................................................................................................. 4
1.2 Lasers uses and market size ..................................................................................................................... 5
2 Quantel and Keopsys group business combination....................................................................................... 6
2.1 Quantel history ........................................................................................................................................ 7
2.2 Keopsys history ........................................................................................................................................ 7
2.3 Quantel and Keopsys group business combination ................................................................................... 8
3 Rationale behind the business combination ............................................................................................... 10
4 Forecasts ................................................................................................................................................... 13
4.1 2017 – 2020: Profitable growth prospects .............................................................................................. 13
4.2 Consolidated casflow statement ............................................................................................................ 14
4.3 Consolidated Balance Sheet ................................................................................................................... 14
5 Valuation ................................................................................................................................................... 15
5.1 DCF ........................................................................................................................................................ 15
5.1.1 Discount rate calculation ................................................................................................................ 15
5.1.2 Enterprise value calculation ........................................................................................................... 16
5.1.3 Price per share calculation ............................................................................................................. 16
5.2 Comparables Valuation .......................................................................................................................... 17
5.2.1 Comparables selection ................................................................................................................... 17
5.2.2 Valuation ....................................................................................................................................... 18
5.2.3 Size discount / premium methodology ........................................................................................... 18
5.3 Estimated weighted valuation of Quantel .............................................................................................. 19
6 Summary of financial statements ............................................................................................................... 20
6.1 Simplified Income Statement ................................................................................................................. 20
6.2 Balance Sheet – Main items ................................................................................................................... 20
6.3 Cash Flows Statement – Main items ....................................................................................................... 20
6.4 Ratios .................................................................................................................................................... 21
7 Important disclosure.................................................................................................................................. 22
7.1 Genesta Equity Research ratings and target prices definition ................................................................. 22
7.2 Detection of potential conflicts of interest ............................................................................................. 22
7.3 Rating and target price evolution throughout the last 12 months .......................................................... 22
7.4 Ratings distribution ................................................................................................................................ 22
7.5 Additional disclosures ............................................................................................................................ 23
www.genesta-finance.com
G G E N E S T A Equity & Bond Research
4
Quantel 19 March 2018
1 Laser technologies and applications
Quantel is a now one of the European leaders in the growing lasers market. The global lasers market was estimated at around $4.8bn in 2015 by Laser Focus World, with a growth estimated to $6.8bn by 2020 (+7% CAGR – Compounded Average Growth rate). This +7% growth rate stands below double digit annual rates seen in other technology markets but it is steady and should remain about the same in the long term. This gives a good visibility to the laser business for fundamental long term investors. Following its business combination with Keopsys in October 2017, which was actually a reverse take-over of Quantel by Keopsys, the new group is mastering the most important and innovative laser technologies available on the market.
1.1 Quick presentation of laser technologies
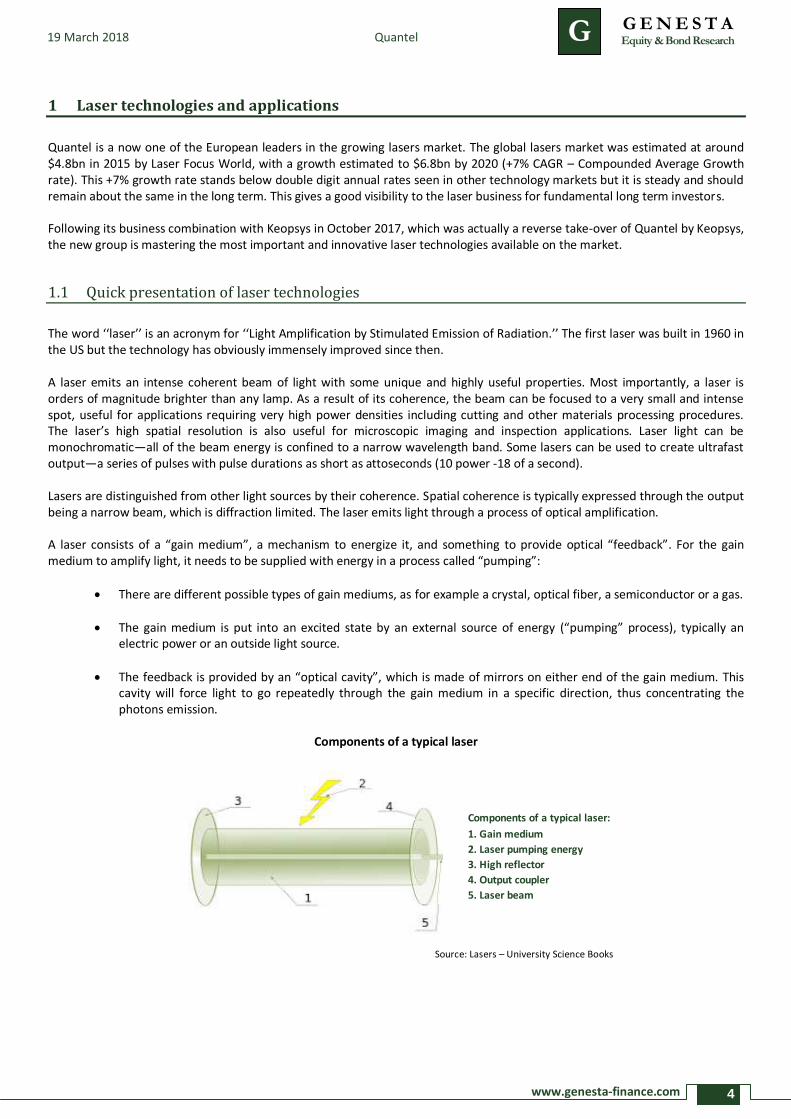
The word ‘‘laser’’ is an acronym for ‘‘Light Amplification by Stimulated Emission of Radiation.’’ The first laser was built in 1960 in the US but the technology has obviously immensely improved since then. A laser emits an intense coherent beam of light with some unique and highly useful properties. Most importantly, a laser is orders of magnitude brighter than any lamp. As a result of its coherence, the beam can be focused to a very small and intense spot, useful for applications requiring very high power densities including cutting and other materials processing procedures. The laser’s high spatial resolution is also useful for microscopic imaging and inspection applications. Laser light can be monochromatic—all of the beam energy is confined to a narrow wavelength band. Some lasers can be used to create ultrafast output—a series of pulses with pulse durations as short as attoseconds (10 power -18 of a second). Lasers are distinguished from other light sources by their coherence. Spatial coherence is typically expressed through the output being a narrow beam, which is diffraction limited. The laser emits light through a process of optical amplification. A laser consists of a “gain medium”, a mechanism to energize it, and something to provide optical “feedback”. For the gain medium to amplify light, it needs to be supplied with energy in a process called “pumping”:
There are different possible types of gain mediums, as for example a crystal, optical fiber, a semiconductor or a gas.
The gain medium is put into an excited state by an external source of energy (“pumping” process), typically an electric power or an outside light source.
The feedback is provided by an “optical cavity”, which is made of mirrors on either end of the gain medium. This cavity will force light to go repeatedly through the gain medium in a specific direction, thus concentrating the photons emission.
Components of a typical laser
Source: Lasers – University Science Books
Components of a typical laser:
1. Gain medium
2. Laser pumping energy
3. High reflector
4. Output coupler
5. Laser beam
www.genesta-finance.com
G G E N E S T A Equity & Bond Research
5
19 March 2018 Quantel
Lasers can be classified into five main technologies, corresponding to the type of gain medium used.
Fiber lasers: modern and fast growing technology where the gain medium is optical fiber. An advantage of this technique is that fibers have high surface area to volume ratio, which enables efficient cooling.
Solid-state lasers: they use a crystalline or glass rod which is “doped” with ions that provide the required energy states. There are however limitations in solid-state lasers due to heating that can reduce their efficiency.
Semiconductor lasers (or laser diodes): here, the gain medium is made of diodes (a type of semiconductors) which are electrically pumped.
Dye lasers: they use an organic dye as the gain medium. The wide gain spectrum of available dyes allows these lasers to be highly tunable.
Gas lasers: the gain medium is a gas. Many types of gases can be used to amplify light coherently, helium-neon or CO² among others. Note that gas lasers are an old technology being gradually replaced by fiber lasers.
Quantel masters all the laser technologies except for the declining gas technology. The table below sums up the various laser types, the Quantel presence on these products and their market growth trend.
Laser types and markets
Source: Quantel, Keopsys and Genesta
1.2 Lasers uses and market size
Lasers are widely used in thousands of applications including science, medicine and industry. As an indication, lasers for industrial applications are sold in a €3,000 - €50,000 range per unit while medical lasers (mainly for ophthalmology) can see their price vary from €40,000 to €70,000 per machine. For scientific applications, prices are set in a €30,000 - €100,000 range. We give below a few examples of actual applications:
Science/Research: spectroscopy, fluorescence microscopy, metrology, high energy scientific lasers, atoms and molecular samples cooling.
Medicine: laser surgery (in particular eye surgery), kidney stone treatment, cancer tumors, blood analysis.
Industry: LIDAR civil (Light Detection and Ranging), obstacle detection, scan 3D, mapping 2D/3D, wind speed measurement, cutting, welding, marking parts.
Military: telemetry, guiding munitions, missile defence, electro-optical countermeasures.
Space: laser communication in space, space vessels docking systems.
Communications: optical amplifier for fiber-optic communication.
Law enforcement: Lidar traffic enforcement (Light Detection and Ranging), fingerprint detection.
Commercial products: laser printers, barcode scanners, holograms.
Laser types Presence of Quantel Market trend
Dye lasers Yes
Gas lasers No
Solid-state lasers Yes
Semiconductor lasers Yes
Fiber lasers Yes
A very large panel of applications…

www.genesta-finance.com
G G E N E S T A Equity & Bond Research
6
19 March 2018 Quantel
Quantel is a now one of the European leaders in the growing lasers market. The industrial laser industry is seen as vibrant, robust and growing. It has even grown during years when the global economy has not. The global lasers market was estimated at around $4.8bn in 2015 by Laser Focus World, and is expected to grow to $6.8bn by 2020, reflecting a five-year compounded annual growth rate of +7%. This +7% growth rate stands below double digit annual rates seen in other technology markets but it is steady and should remain about the same in the long term. This gives a good visibility to the laser business for fundamental long term investors. Moreover, market trends are good, and evolving technology should continue to drive this global market, especially within fiber laser submarkets. A report from BCC Research stands that the fiber lasers market should see impressive growth, spurred by demand for its high-output power, compact size, and reliability.
Source: Laser Focus World
Source: Laser Focus World
More recent estimates on the market size (Optech Consulting) show a global market size of $6.5bn in 2017 (including $2.6bn for industrial lasers and $3.9bn for new laser applications) and an expected market of more than $9.0bn in 2023. Following its business combination with Keopsys in October 2017, the new group is mastering the most important and innovative laser technologies available on the market, including booming fiber lasers.
2 Quantel and Keopsys group business combination
As indicated above, Quantel merged with Keopsys in October 2017 (reverse take-over of Quantel by Keopsys). The deal was confirmed by a Quantel shareholders’ meeting on 6 October 2017. The Quantel group recorded 2016 revenues of €63.2m and net income of €0.6m (0.9% net margin to sales). The Keopsys group was smaller (€17.2m revenues in 2016) but much more profitable (2016 net income of €2.2m or a net margin of 12.8%). In addition, the sales growth of Keopsys from 2014 to 2016 was much more aggressive at 107.2% (including M&A deals) while the organic Quantel group growth stood significantly below at +23.2%.
Fiber 31%
Other Lasers69%
Fiber 39%
Other Lasers61%
2015
2020
Estimated growth of global lasers market
Evolution of the fiber laser share in the global lasers market

www.genesta-finance.com
G G E N E S T A Equity & Bond Research
7
19 March 2018 Quantel
2.1 Quantel history
1970: Creation of Quantel to design and manufacture lasers for use in scientific instrumentation 1994: Creation of Quantel Medical, specialized in lasers products designed for ophthalmology 1997: Quantel listing on the Nouveau Marché of the Paris stock exchange 1998: Acquisition of Big Sky Laser in the US. Agreement signed with the CEA (French Nuclear Energy Research
Division) to participate to the megajoule program, aiming at replacing nuclear tests. 2006: Research launched to develop fiber lasers. 2007: Acquisition de Nuvonyx Europe which takes the name of Quantel Laser Diodes. Acquisition of Wavelight
Aesthetic which takes the name of Quantel Derma. 2012: Disposal of the dermatological division to Alma Lasers. 2016: Esira (holding of the Keopsys group) becomes the main shareholder of Quantel (14.6% of capital and 21.3% of
voting rights) at an estimated price of €5.55 per Quantel share October 2017: Esira brings the Keopsys group and other subsidiaries to Quantel. Reverse take-over of Quantel by Keopsys. The table below shows data about the historical Quantel group perimeter.
Quantel 2012-2017
Source: Quantel
2.2 Keopsys history
1997: Start-up founded in 1997 in Lannion (Brittany) by Marc Le Flohic (controlling shareholder and CEO of the new
Quantel/Keopsys group). Fiber lasers and amplifiers specialist. Keopsys develops a new “pumping” process (see above the signification of “pumping”) coupling several light sources into a fiber. This unique technology is called VSP – V rainure Side Pumping.
2013: Creation of Sensup (electro-optical systems based on the fiber lasers technology) 2014: Acquisition of LEA Photonics (fiber lasers) 2016: Esira (holding of the Keopsys group) becomes the main shareholder of Quantel (14.6% of capital and 21.3% of
voting rights) at an estimated price of €5.55 per Quantel share October 2017: Esira brings the Keopsys group and other subsidiaries to Quantel. Reverse take-over of Quantel by Keopsys
in € million 2012 2013 2014 2015 2016 2017
Sales 50,0 53,9 51,3 62,1 63,2 65,4
EBIT -0,3 1,2 -0,3 2,3 1,1 na
EBIT margin (%) -0,6% 2,2% -0,6% 3,7% 1,7% na
Net earnings -6,8 -0,3 -1,1 2,1 0,6 na
Earnings margin (%) -13,6% -0,6% -2,1% 3,4% 0,9% na
www.genesta-finance.com
G G E N E S T A Equity & Bond Research
8
19 March 2018 Quantel
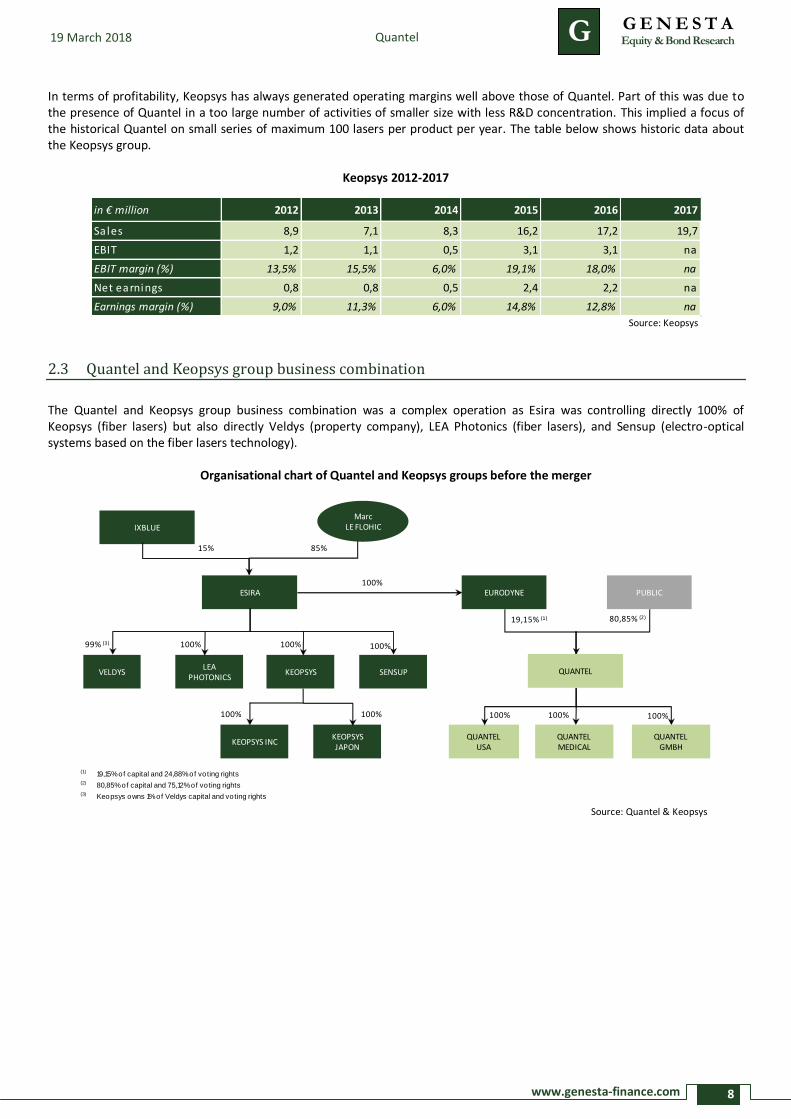
In terms of profitability, Keopsys has always generated operating margins well above those of Quantel. Part of this was due to the presence of Quantel in a too large number of activities of smaller size with less R&D concentration. This implied a focus of the historical Quantel on small series of maximum 100 lasers per product per year. The table below shows historic data about the Keopsys group.
Keopsys 2012-2017
Source: Keopsys
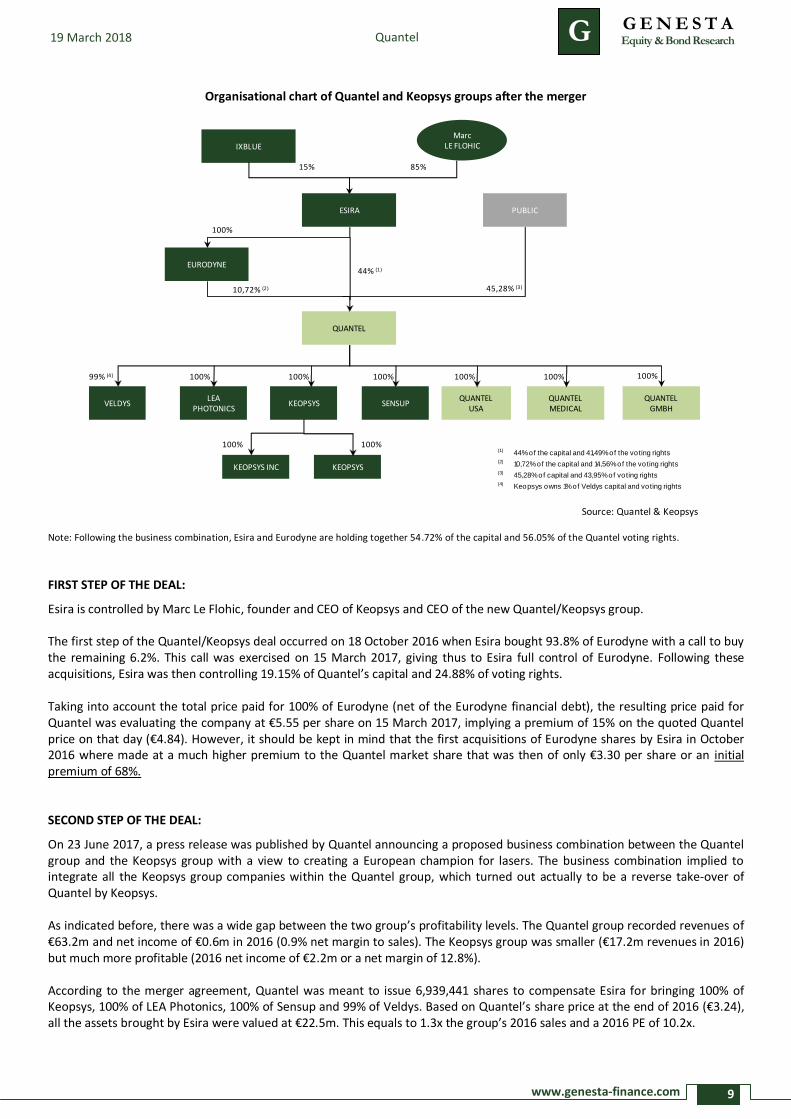
2.3 Quantel and Keopsys group business combination
The Quantel and Keopsys group business combination was a complex operation as Esira was controlling directly 100% of Keopsys (fiber lasers) but also directly Veldys (property company), LEA Photonics (fiber lasers), and Sensup (electro-optical systems based on the fiber lasers technology).
Organisational chart of Quantel and Keopsys groups before the merger
Source: Quantel & Keopsys
in € million 2012 2013 2014 2015 2016 2017
Sales 8,9 7,1 8,3 16,2 17,2 19,7
EBIT 1,2 1,1 0,5 3,1 3,1 na
EBIT margin (%) 13,5% 15,5% 6,0% 19,1% 18,0% na
Net earnings 0,8 0,8 0,5 2,4 2,2 na
Earnings margin (%) 9,0% 11,3% 6,0% 14,8% 12,8% na
(1) 19,15% of capital and 24,88% of voting rights(2) 80,85% of capital and 75,12% of voting rights(3) Keopsys owns 1% of Veldys capital and voting rights
IXBLUE
ESIRA EURODYNE PUBLIC
MarcLE FLOHIC
85%15%
100%
VELDYSLEA
PHOTONICSKEOPSYS SENSUP
99% (3)
KEOPSYS INCKEOPSYS JAPON
19,15% (1)
100% 100% 100%
100%100%
QUANTEL
80,85% (2)
QUANTELMEDICAL
QUANTELGMBH
QUANTELUSA
100%100% 100%
www.genesta-finance.com
G G E N E S T A Equity & Bond Research
9
19 March 2018 Quantel
Organisational chart of Quantel and Keopsys groups after the merger
Source: Quantel & Keopsys
Note: Following the business combination, Esira and Eurodyne are holding together 54.72% of the capital and 56.05% of the Quantel voting rights.
FIRST STEP OF THE DEAL:
Esira is controlled by Marc Le Flohic, founder and CEO of Keopsys and CEO of the new Quantel/Keopsys group. The first step of the Quantel/Keopsys deal occurred on 18 October 2016 when Esira bought 93.8% of Eurodyne with a call to buy the remaining 6.2%. This call was exercised on 15 March 2017, giving thus to Esira full control of Eurodyne. Following these acquisitions, Esira was then controlling 19.15% of Quantel’s capital and 24.88% of voting rights. Taking into account the total price paid for 100% of Eurodyne (net of the Eurodyne financial debt), the resulting price paid for Quantel was evaluating the company at €5.55 per share on 15 March 2017, implying a premium of 15% on the quoted Quantel price on that day (€4.84). However, it should be kept in mind that the first acquisitions of Eurodyne shares by Esira in October 2016 where made at a much higher premium to the Quantel market share that was then of only €3.30 per share or an initial premium of 68%. SECOND STEP OF THE DEAL:
On 23 June 2017, a press release was published by Quantel announcing a proposed business combination between the Quantel group and the Keopsys group with a view to creating a European champion for lasers. The business combination implied to integrate all the Keopsys group companies within the Quantel group, which turned out actually to be a reverse take-over of Quantel by Keopsys. As indicated before, there was a wide gap between the two group’s profitability levels. The Quantel group recorded revenues of €63.2m and net income of €0.6m in 2016 (0.9% net margin to sales). The Keopsys group was smaller (€17.2m revenues in 2016) but much more profitable (2016 net income of €2.2m or a net margin of 12.8%). According to the merger agreement, Quantel was meant to issue 6,939,441 shares to compensate Esira for bringing 100% of Keopsys, 100% of LEA Photonics, 100% of Sensup and 99% of Veldys. Based on Quantel’s share price at the end of 2016 (€3.24), all the assets brought by Esira were valued at €22.5m. This equals to 1.3x the group’s 2016 sales and a 2016 PE of 10.2x.
(1) 44% of the capital and 41,49% of the voting rights(2) 10,72% of the capital and 14,56% of the voting rights(3) 45,28% of capital and 43,95% of voting rights(4) Keopsys owns 1% of Veldys capital and voting rights
IXBLUE
MarcLE FLOHIC
85%15%
ESIRA
EURODYNE
QUANTEL
PUBLIC
100%
10,72% (2)
44% (1)
45,28% (3)
VELDYSLEA
PHOTONICSKEOPSYS SENSUP
QUANTELMEDICAL
QUANTELGMBH
QUANTELUSA
KEOPSYS INC KEOPSYS
100%100%
100% 100%99% (4) 100% 100% 100% 100%
www.genesta-finance.com
G G E N E S T A Equity & Bond Research
10
19 March 2018 Quantel
Mr Marc Le Flohic becomes the majority shareholder of the new group, via Esira and Eurodyne, by owning 54.72% of the capital and 56.05% of the Quantel voting rights. After the business combination, the total value breakdown of the new group stands at 44% for the Keopsys group (Keopsys, LEA Photonics, Sensup and Veldys) and 56% for the Quantel group. A fair value was established for Quantel and the Keopsys group. Assets were valued by independent accountants and auditors using usual techniques: DCF and listed comparables. Note that only Quantel was publishing consolidated accounts but not Keopsys. For Keopsys, it was therefore necessary to calculate a separate value for each subsidiary.
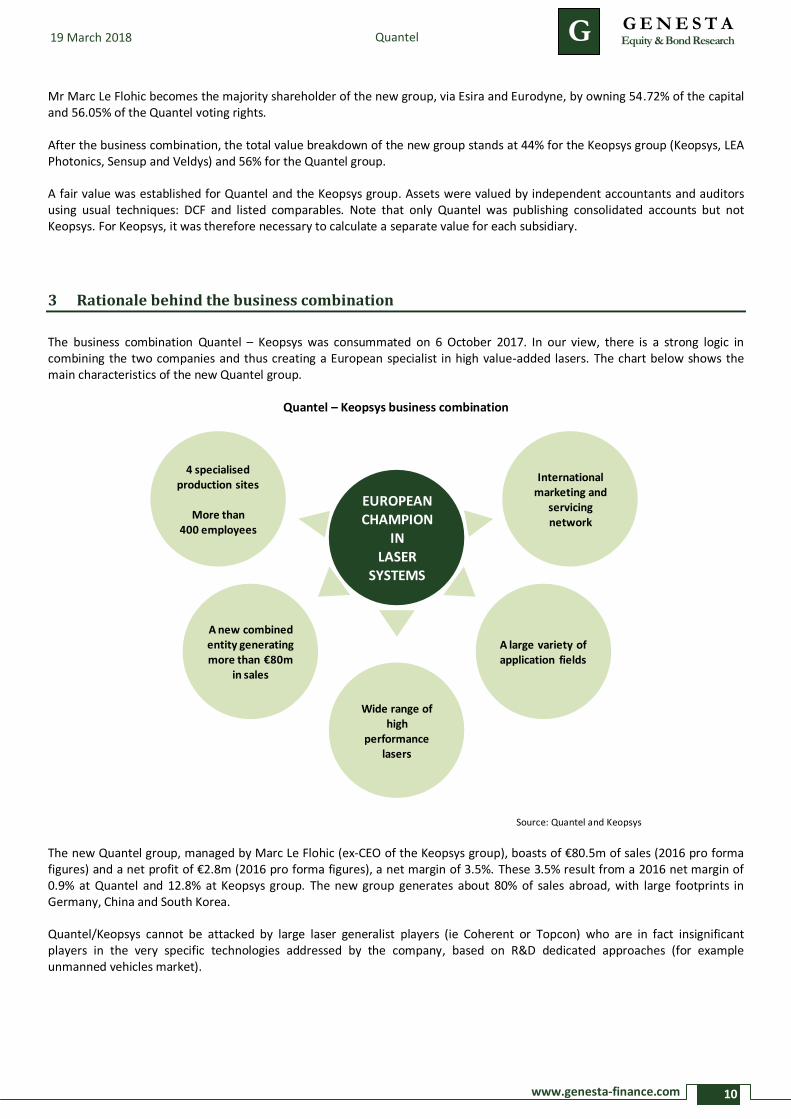
3 Rationale behind the business combination
The business combination Quantel – Keopsys was consummated on 6 October 2017. In our view, there is a strong logic in combining the two companies and thus creating a European specialist in high value-added lasers. The chart below shows the main characteristics of the new Quantel group.
Quantel – Keopsys business combination
Source: Quantel and Keopsys
The new Quantel group, managed by Marc Le Flohic (ex-CEO of the Keopsys group), boasts of €80.5m of sales (2016 pro forma figures) and a net profit of €2.8m (2016 pro forma figures), a net margin of 3.5%. These 3.5% result from a 2016 net margin of 0.9% at Quantel and 12.8% at Keopsys group. The new group generates about 80% of sales abroad, with large footprints in Germany, China and South Korea. Quantel/Keopsys cannot be attacked by large laser generalist players (ie Coherent or Topcon) who are in fact insignificant players in the very specific technologies addressed by the company, based on R&D dedicated approaches (for example unmanned vehicles market).
EUROPEANCHAMPION
INLASER
SYSTEMS
A new combined entity generating more than €80m
in sales
Wide range of high
performance lasers
A large variety of application fields
International marketing and
servicing network
4 specialisedproduction sites
More than400 employees
www.genesta-finance.com
G G E N E S T A Equity & Bond Research
11
19 March 2018 Quantel
IN OUR VIEW, THE MAIN TWO ADVANTAGES OF THE BUSINESS COMBINATION ARE:
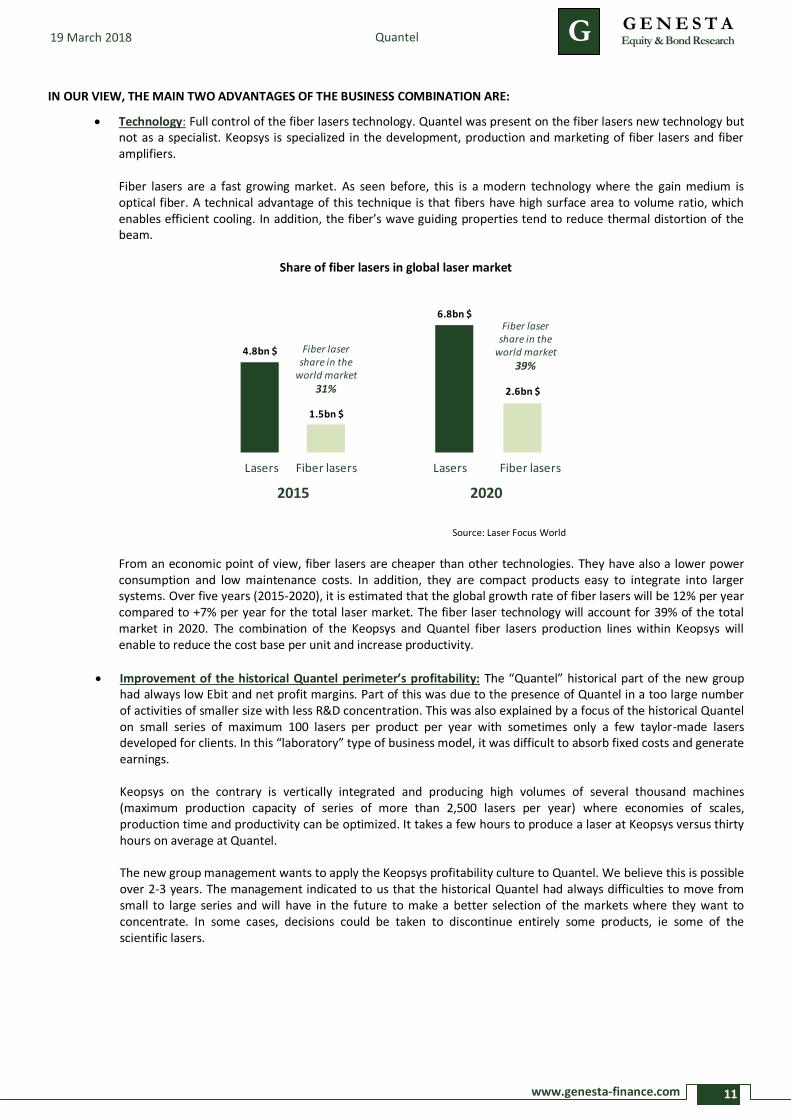
Technology: Full control of the fiber lasers technology. Quantel was present on the fiber lasers new technology but not as a specialist. Keopsys is specialized in the development, production and marketing of fiber lasers and fiber amplifiers. Fiber lasers are a fast growing market. As seen before, this is a modern technology where the gain medium is optical fiber. A technical advantage of this technique is that fibers have high surface area to volume ratio, which enables efficient cooling. In addition, the fiber’s wave guiding properties tend to reduce thermal distortion of the beam.
Share of fiber lasers in global laser market
Source: Laser Focus World
From an economic point of view, fiber lasers are cheaper than other technologies. They have also a lower power consumption and low maintenance costs. In addition, they are compact products easy to integrate into larger systems. Over five years (2015-2020), it is estimated that the global growth rate of fiber lasers will be 12% per year compared to +7% per year for the total laser market. The fiber laser technology will account for 39% of the total market in 2020. The combination of the Keopsys and Quantel fiber lasers production lines within Keopsys will enable to reduce the cost base per unit and increase productivity.
Improvement of the historical Quantel perimeter’s profitability: The “Quantel” historical part of the new group had always low Ebit and net profit margins. Part of this was due to the presence of Quantel in a too large number of activities of smaller size with less R&D concentration. This was also explained by a focus of the historical Quantel on small series of maximum 100 lasers per product per year with sometimes only a few taylor-made lasers developed for clients. In this “laboratory” type of business model, it was difficult to absorb fixed costs and generate earnings. Keopsys on the contrary is vertically integrated and producing high volumes of several thousand machines (maximum production capacity of series of more than 2,500 lasers per year) where economies of scales, production time and productivity can be optimized. It takes a few hours to produce a laser at Keopsys versus thirty hours on average at Quantel. The new group management wants to apply the Keopsys profitability culture to Quantel. We believe this is possible over 2-3 years. The management indicated to us that the historical Quantel had always difficulties to move from small to large series and will have in the future to make a better selection of the markets where they want to concentrate. In some cases, decisions could be taken to discontinue entirely some products, ie some of the scientific lasers.
2015 2020
Lasers Fiber lasers Lasers Fiber lasers
4.8bn $
1.5bn $
2.6bn $
6.8bn $
Fiber laser share in the
world market
31%
Fiber laser share in the
world market
39%

www.genesta-finance.com
G G E N E S T A Equity & Bond Research
12
19 March 2018 Quantel
Other gains generated by the combination are experienced in many acquisitions or mergers and are more common. They include:
Critical size reached with €85.1m sales for the new group in 2017 Pro Forma and 400 employees. This will enable to generate economies of scales and address larger tender offers in particular in defense.
Capacity to accelerate or develop new mass market laser applications ie unmanned terrestrial vehicles, wind power, real time 2D/3D mapping, medical.
Rationalized systems offers to common clients.
Potential merger of marketing teams and commercial networks but with no urge to move in this direction. In Medical, there are dedicated marketing teams in France and the US. For all other activities, they use exclusive distributors in about 90 countries.
Optimized level of capital expenditure and R&D. In terms of R&D, the two companies Quantel and Keopsys invest roughly 10% of their sales per year. They have three R&D sites and no plan to merge them.
Merger of central functions: Quality, procurement, IT, finance.
Larger size and higher profitability opening the door to better financing conditions.
The company should take very limited restructuring charges in their 2017 P&L accounts, implying that no significant staff reduction is planned at this stage. There are only three main production sites (two in France and one in the US) and therefore no need for large rationalization.
Taking all this into account, we believe that the business combination should be able to deliver a cost base reduction of around 2%-3% of sales over two years, that is to say from 2017 to 2019, as it is usually witnessed in this type of operation.
The company indicates that the main growth drivers in the next few years will be the Lidar sensors, the military and the medical sectors. The Lidar (Light Detection and Ranging) sensors are the most promising. They enable to detect obstacles extremely rapidly and precisely, which is of prime importance for the development of the potentially huge unmanned vehicles market. They are also already used in drones, military and railways applications.
In the automotive industry, Quantel sells to suppliers specialized in electronics applications for OEMs (Original Equipment Manufacturers) and is one of the only specialists in the world for Lidars applied to unmanned vehicles. Lidars sold to the automotive industry will see their volume grow rapidly and should represent several millions of euros of sales in the pre-series. However, the large volume production of unmanned vehicles should not occur before 2050.
In the military sector, the market itself is not growing rapidly but the new Quantel/Keopsys combination should offer the required critical mass to bid on new markets like portable telemeters or gyroscopes. Here, Quantel expects growth through market share gains mainly in France. In the US, they are facing huge competitors like General Dynamics or Lockheed Martin.
The company targets to double its sales within four years to around €200m, including acquisitions. We believe this is achievable and we give in the table below an estimate for 2018-2020 (without M&A deals).
Quantel – Estimated sales by division
Sales (in € million) 2016 2017PF 2018E 2019E 2020E
Industrial and Scientific 18,9 32,3 37,3 42,7 46,6
% change 70,9% 15,5% 14,5% 9,0%
% of revenues 29,9% 38,0% 39,2% 39,0% 38,6%
Lidar Sensors 1,9 10,7 13,4 18,1 22,9
% change 463,2% 25,0% 35,0% 27,0%
% of revenues 3,0% 12,6% 14,0% 16,5% 19,0%
Defence 12,0 10,4 10,1 10,6 11,0
% change -13,3% -3,0% 5,0% 4,0%
% of revenues 19,0% 12,2% 10,6% 9,7% 9,1%
Medical 30,5 31,7 34,5 38,3 40,1
% change 3,9% 8,8% 11,0% 4,9%
% of revenues 48,2% 37,3% 36,2% 34,9% 33,2%
TOTAL 63,3 85,1 95,3 109,6 120,6
% change 34,4% 11,9% 15,1% 10,0%
Source: Genesta estimates

www.genesta-finance.com
G G E N E S T A Equity & Bond Research
13
Quantel 19 March 2018
4 Forecasts
4.1 2017 – 2020: Profitable growth prospects
Based on our sales estimates, growth will generate mechanically a margin expansion through a better absorption of the company fixed costs. In addition, the various benefits described above of the business combination should in our view deliver, everything being equal, a cost base reduction of around 2%-3% of sales over two years, that is to say from 2017 to 2019. We have built our P&L estimates on this assumption, and then added the additional benefit created by the top line growth.
Quantel – Overview of earnings estimates 2015-2020E
31/12 (€m) 2015 2016 2017E PF 2018E 2019E 2020E
Revenues 62,1 63,3 85,1 95,3 109,6 120,6
% change 1,8% 34,5% 11,9% 15,1% 10,0%
Procurements -27,6 -27,2 -35,7 -39,1 -44,7 -48,2
% of revenues 44,5% 43,0% 42,0% 41,0% 40,8% 40,0%
Staff costs -18,7 -19,6 -23,9 -25,1 -25,4 -27,2
% of revenues 30,1% 31,0% 28,1% 26,4% 23,2% 22,5%
Other costs -10,9 -12,3 -15,4 -16,0 -18,7 -20,2
% of revenues 17,6% 19,4% 18,1% 16,8% 17,0% 16,7%
Ebitda 5,9 4,9 10,7 15,7 21,7 25,9
% of sales 9,6% 7,7% 12,6% 16,5% 19,8% 21,5%
Depreciations & Provisions -3,6 -3,8 -3,9 -5,5 -7,0 -7,7
% of revenues 5,8% 6,0% 4,6% 5,8% 6,4% 6,4%
Ebit 2,3 1,1 6,8 10,2 14,7 18,2
% of revenues 3,8% 1,7% 8,0% 10,8% 13,5% 15,1%
Financial income & charges -0,5 -0,5 -0,4 -0,3 0,0 0,0
% of revenues -0,9% -0,7% -0,5% -0,3% 0,0% 0,0%
Earnings before tax 1,8 0,6 5,7 9,9 14,7 18,2
% of revenues 2,9% 1,0% 6,7% 10,4% 13,5% 15,1%
Income tax 0,3 0,0 -1,6 -2,8 -4,1 -5,1
Tax rate (%) -18,6% 0,6% 28,0% 28,0% 28,0% 28,0%
Net earnings 2,1 0,6 4,1 7,2 10,6 13,1
% change 538,4% 74,0% 48,2% 23,4%
% of revenues 3,4% 1,0% 4,8% 7,5% 9,7% 10,9%
Number of shares (in thousands) 8,18 9,23 15,77 15,77 15,77 15,77
EPS (EUR per share) 0,26 0,07 0,26 0,45 0,67 0,83
Source: Quantel, Keopsys, Genesta estimates
In our estimates, we have not charged any provisions relative to the recent Iridex law suit against Quantel as we believe that Quantel will obviously avoid to take any charge. Quantel and Iridex (laser-based ophthalmology specialist) had an agreement for a common use of the Iridex’s MicroPulse® trademark which was terminated in early 2017. Iridex announced on 9 January 2018 a lawsuit in California against Quantel alleging that Quantel products infringe a US patent and that Quantel has infringed Iridex’s MicroPulse® trademark. Quantel responded that these allegations are unfounded and will defend itself vigorously against them. This legal action will generate some legal costs but we believe that Quantel and Iridex will seek an out of court settlement with a limited financial impact for the French group.
www.genesta-finance.com
G G E N E S T A Equity & Bond Research
14
19 March 2018 Quantel
4.2 Consolidated casflow statement
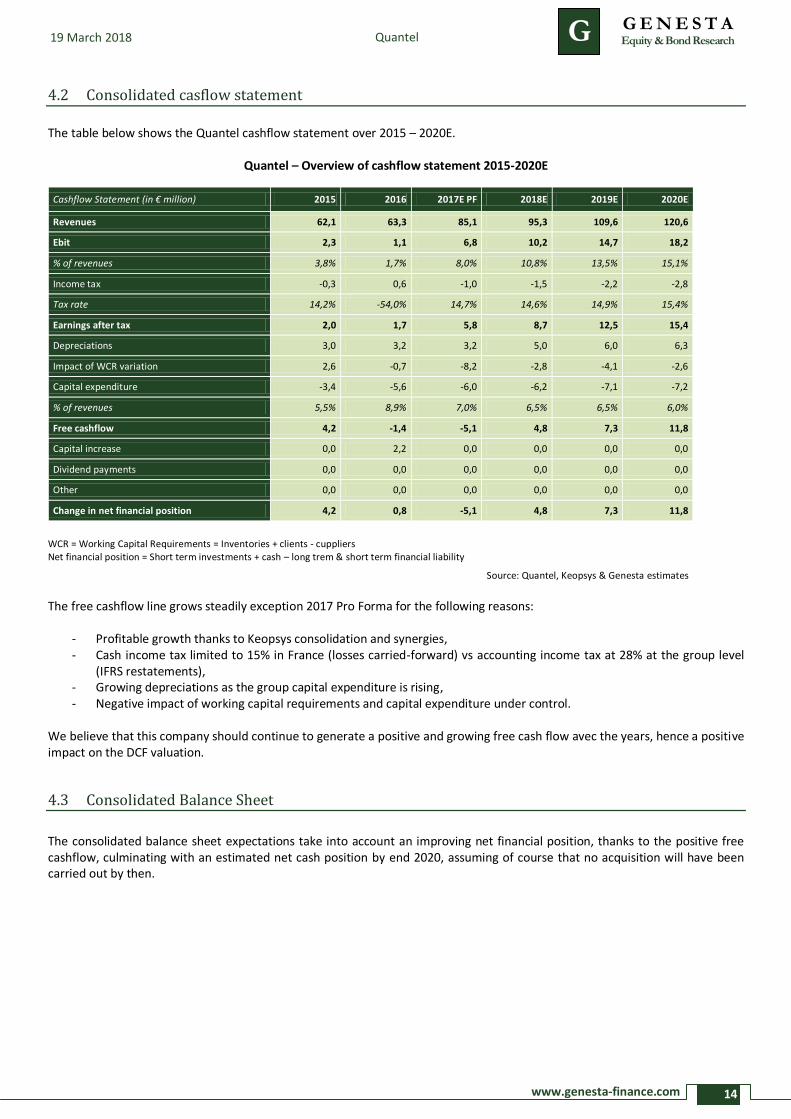
The table below shows the Quantel cashflow statement over 2015 – 2020E.
Quantel – Overview of cashflow statement 2015-2020E
Cashflow Statement (in € million) 2015 2016 2017E PF 2018E 2019E 2020E
Revenues 62,1 63,3 85,1 95,3 109,6 120,6
Ebit 2,3 1,1 6,8 10,2 14,7 18,2
% of revenues 3,8% 1,7% 8,0% 10,8% 13,5% 15,1%
Income tax -0,3 0,6 -1,0 -1,5 -2,2 -2,8
Tax rate 14,2% -54,0% 14,7% 14,6% 14,9% 15,4%
Earnings after tax 2,0 1,7 5,8 8,7 12,5 15,4
Depreciations 3,0 3,2 3,2 5,0 6,0 6,3
Impact of WCR variation 2,6 -0,7 -8,2 -2,8 -4,1 -2,6
Capital expenditure -3,4 -5,6 -6,0 -6,2 -7,1 -7,2
% of revenues 5,5% 8,9% 7,0% 6,5% 6,5% 6,0%
Free cashflow 4,2 -1,4 -5,1 4,8 7,3 11,8
Capital increase 0,0 2,2 0,0 0,0 0,0 0,0
Dividend payments 0,0 0,0 0,0 0,0 0,0 0,0
Other 0,0 0,0 0,0 0,0 0,0 0,0
Change in net financial position 4,2 0,8 -5,1 4,8 7,3 11,8
WCR = Working Capital Requirements = Inventories + clients - cuppliers Net financial position = Short term investments + cash – long trem & short term financial liability
Source: Quantel, Keopsys & Genesta estimates
The free cashflow line grows steadily exception 2017 Pro Forma for the following reasons:
- Profitable growth thanks to Keopsys consolidation and synergies, - Cash income tax limited to 15% in France (losses carried-forward) vs accounting income tax at 28% at the group level
(IFRS restatements), - Growing depreciations as the group capital expenditure is rising, - Negative impact of working capital requirements and capital expenditure under control.
We believe that this company should continue to generate a positive and growing free cash flow avec the years, hence a positive impact on the DCF valuation.
4.3 Consolidated Balance Sheet
The consolidated balance sheet expectations take into account an improving net financial position, thanks to the positive free cashflow, culminating with an estimated net cash position by end 2020, assuming of course that no acquisition will have been carried out by then.

www.genesta-finance.com
G G E N E S T A Equity & Bond Research
15
Quantel 19 March 2018
5 Valuation
5.1 DCF
5.1.1 Discount rate calculation
The discount rate results from the weighted average rate between the capital cost and the cost of financial debt. The cost of capital is calculated based on the CAPM model to which is added a Small Cap risk premium according to the following formula:
Cost of capital = Rf +beta * (Rm-Rf) + Small Caps risk premium
Rf: risk free rate (Rm-Rf): stock market risk premium
Depending on the company size, we add a Small Caps premium to the cost of capital. The Small Caps premium is calculated according to six criteria which are objectively evaluated. For each criterium, there are five increments from – de ++. Each move upwards adds 20 basis points to the cost of capital. Please find below the criteria table:
Criterium Notation scale
++ + = - --
Company governance 1 4 3 2 1 0
Liquidity2 [66 % ; 100 %] [33 % ; 66 %[ [15 % ; 33 %[ [5 % ; 15 %[ [0 % ; 5 %[
Revenues size (€m) [150 ; +∞[ [100 ; 150[ [50 ; 100[ [25 ; 50[ [0 ; 25[
Operating profitability [25 % ; 100 %] [15 % ; 25 %[ [8 % ; 15 %[ [3 % ; 8 %[ [0 % ; 3 %[
Gearing ]-∞ % ; -15 %] ]-15 % ; 15 %] ]15 % ; 50 %] ]50 % ; 80 %] ]80 % ; +∞[
Clients risks 3 [0 % ; 10 %] ]10 % ; 20 %] ]20 % ; 30 %] ]30 % ; 40 %] ]40 % ; 100 %]
In the case of Quantel, we obtain the following matrix:
++ + = - --
Small Caps
Premium
Company governance
0,80%
Liquidity
0,60%
Revenues size
0,60%
Operating profitability
0,60%
Gearing
0,40%
Client risk
0,80%
TOTAL
3,80%
Based on the prevalent risk free, a market risk premium of 6.5% (source: Fairness Finance, Market Risk Premia), an unlevered 3 years beta of 1.05, a Small Caps risk premium of 3.8% and a weighted taxed debt cost, we get to a discount rate of 10.8%.
Risk Free Rate Risk premium Beta Small Caps risk
premium Cost of capital
Cost of debt
Financial leverage
Tax rate WACC
0,9% 6,5% 1,05 3,8% 11,5% 3,5% 8,1% 28,0% 10,8%
Source: Agence France Trésor, Fairness Finance, Market Risk Premia, Damodaran, Genesta estimates
1 Company’s governance is evaluated through the 4 following criterions: separation of functions between president and top management or functioning as a
supervisory board and a board of directors; presence of independent members in the board of trustees or in the supervisory board; presence of censors or control board; existence of specialized committees. 2 Percentage of capital exchanged in the last 12 months
3 Sales parts represented since by the 5 most important clients.
www.genesta-finance.com
G G E N E S T A Equity & Bond Research
16
Quantel 19 March 2018
5.1.2 Enterprise value calculation
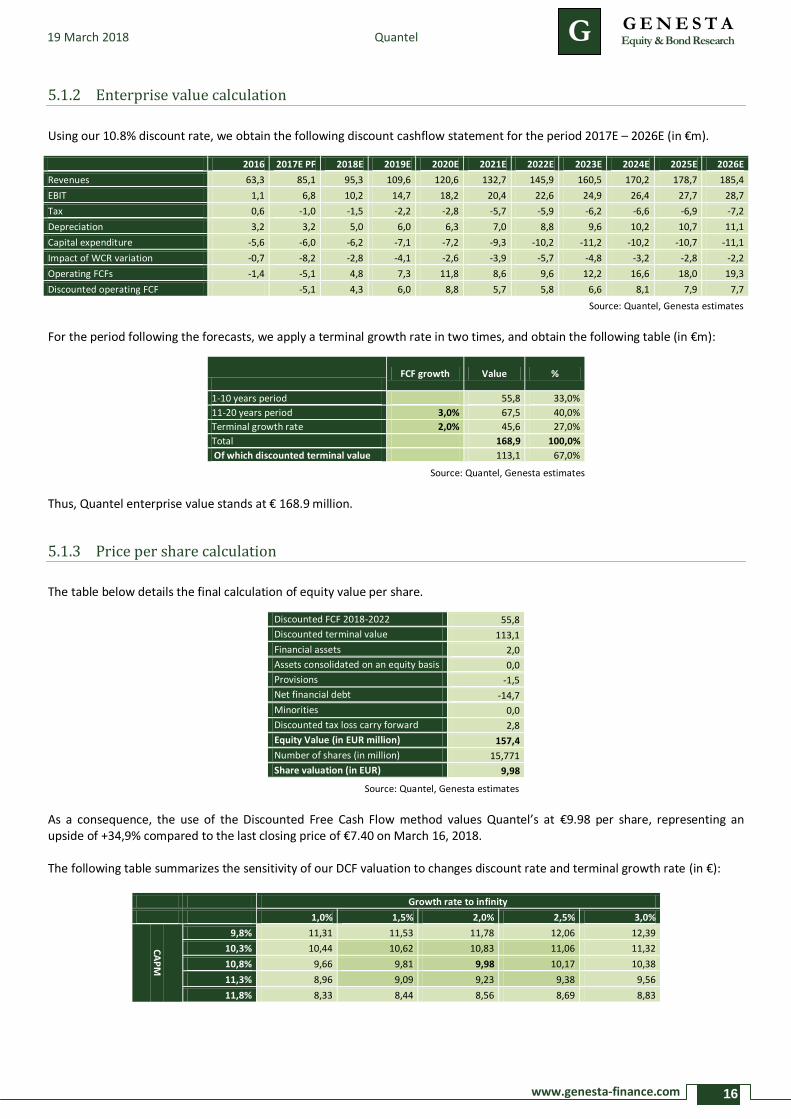
Using our 10.8% discount rate, we obtain the following discount cashflow statement for the period 2017E – 2026E (in €m).
2016 2017E PF 2018E 2019E 2020E 2021E 2022E 2023E 2024E 2025E 2026E
Revenues 63,3 85,1 95,3 109,6 120,6 132,7 145,9 160,5 170,2 178,7 185,4
EBIT 1,1 6,8 10,2 14,7 18,2 20,4 22,6 24,9 26,4 27,7 28,7
Tax 0,6 -1,0 -1,5 -2,2 -2,8 -5,7 -5,9 -6,2 -6,6 -6,9 -7,2
Depreciation 3,2 3,2 5,0 6,0 6,3 7,0 8,8 9,6 10,2 10,7 11,1
Capital expenditure -5,6 -6,0 -6,2 -7,1 -7,2 -9,3 -10,2 -11,2 -10,2 -10,7 -11,1
Impact of WCR variation -0,7 -8,2 -2,8 -4,1 -2,6 -3,9 -5,7 -4,8 -3,2 -2,8 -2,2
Operating FCFs -1,4 -5,1 4,8 7,3 11,8 8,6 9,6 12,2 16,6 18,0 19,3
Discounted operating FCF -5,1 4,3 6,0 8,8 5,7 5,8 6,6 8,1 7,9 7,7
Source: Quantel, Genesta estimates
For the period following the forecasts, we apply a terminal growth rate in two times, and obtain the following table (in €m):
FCF growth Value %
1-10 years period 55,8 33,0%
11-20 years period 3,0% 67,5 40,0%
Terminal growth rate 2,0% 45,6 27,0%
Total 168,9 100,0%
Of which discounted terminal value 113,1 67,0%
Source: Quantel, Genesta estimates
Thus, Quantel enterprise value stands at € 168.9 million.
5.1.3 Price per share calculation
The table below details the final calculation of equity value per share.
Discounted FCF 2018-2022 55,8
Discounted terminal value 113,1
Financial assets 2,0
Assets consolidated on an equity basis 0,0
Provisions -1,5
Net financial debt -14,7
Minorities 0,0
Discounted tax loss carry forward 2,8
Equity Value (in EUR million) 157,4
Number of shares (in million) 15,771
Share valuation (in EUR) 9,98
Source: Quantel, Genesta estimates
As a consequence, the use of the Discounted Free Cash Flow method values Quantel’s at €9.98 per share, representing an upside of +34,9% compared to the last closing price of €7.40 on March 16, 2018. The following table summarizes the sensitivity of our DCF valuation to changes discount rate and terminal growth rate (in €):
Growth rate to infinity
9,991927697 1,0% 1,5% 2,0% 2,5% 3,0%
CA
PM
9,8% 11,31 11,53 11,78 12,06 12,39
10,3% 10,44 10,62 10,83 11,06 11,32
10,8% 9,66 9,81 9,98 10,17 10,38
11,3% 8,96 9,09 9,23 9,38 9,56
11,8% 8,33 8,44 8,56 8,69 8,83
www.genesta-finance.com
G G E N E S T A Equity & Bond Research
17
19 March 2018 Quantel
5.2 Comparables Valuation
5.2.1 Comparables selection
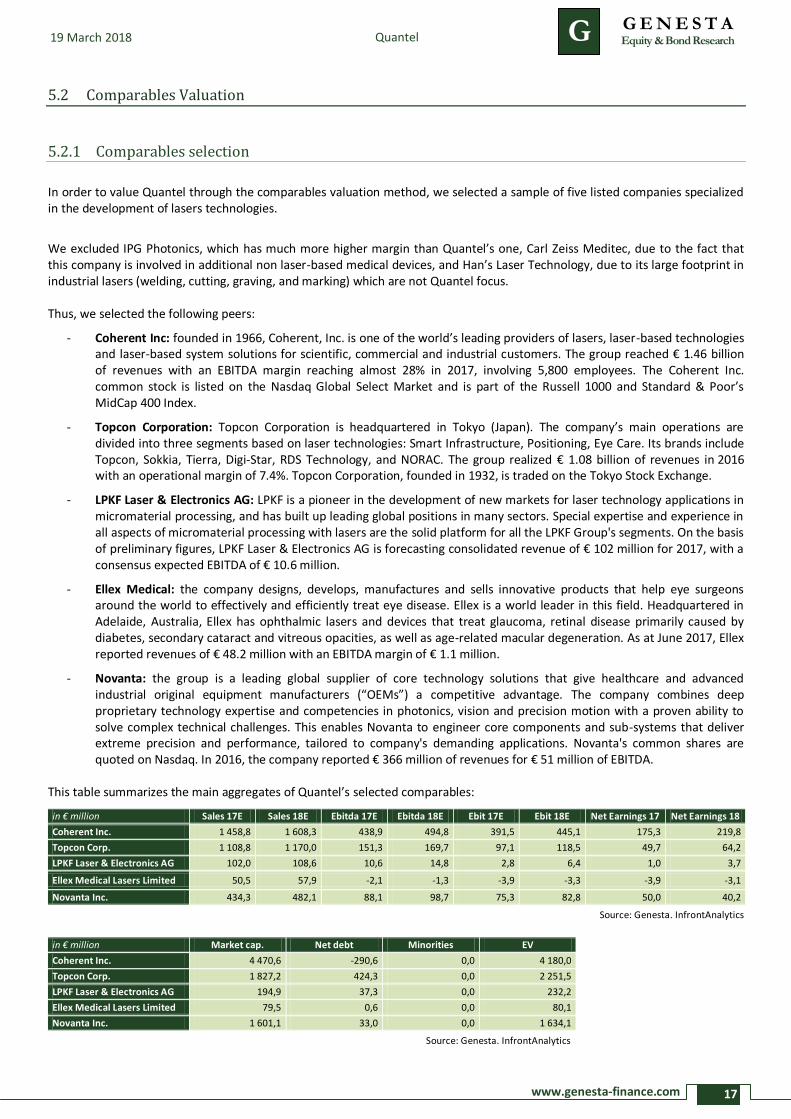
In order to value Quantel through the comparables valuation method, we selected a sample of five listed companies specialized in the development of lasers technologies.
We excluded IPG Photonics, which has much more higher margin than Quantel’s one, Carl Zeiss Meditec, due to the fact that this company is involved in additional non laser-based medical devices, and Han’s Laser Technology, due to its large footprint in industrial lasers (welding, cutting, graving, and marking) which are not Quantel focus. Thus, we selected the following peers:
- Coherent Inc: founded in 1966, Coherent, Inc. is one of the world’s leading providers of lasers, laser-based technologies and laser-based system solutions for scientific, commercial and industrial customers. The group reached € 1.46 billion of revenues with an EBITDA margin reaching almost 28% in 2017, involving 5,800 employees. The Coherent Inc. common stock is listed on the Nasdaq Global Select Market and is part of the Russell 1000 and Standard & Poor’s MidCap 400 Index.
- Topcon Corporation: Topcon Corporation is headquartered in Tokyo (Japan). The company’s main operations are divided into three segments based on laser technologies: Smart Infrastructure, Positioning, Eye Care. Its brands include Topcon, Sokkia, Tierra, Digi-Star, RDS Technology, and NORAC. The group realized € 1.08 billion of revenues in 2016 with an operational margin of 7.4%. Topcon Corporation, founded in 1932, is traded on the Tokyo Stock Exchange.
- LPKF Laser & Electronics AG: LPKF is a pioneer in the development of new markets for laser technology applications in micromaterial processing, and has built up leading global positions in many sectors. Special expertise and experience in all aspects of micromaterial processing with lasers are the solid platform for all the LPKF Group's segments. On the basis of preliminary figures, LPKF Laser & Electronics AG is forecasting consolidated revenue of € 102 million for 2017, with a consensus expected EBITDA of € 10.6 million.
- Ellex Medical: the company designs, develops, manufactures and sells innovative products that help eye surgeons around the world to effectively and efficiently treat eye disease. Ellex is a world leader in this field. Headquartered in Adelaide, Australia, Ellex has ophthalmic lasers and devices that treat glaucoma, retinal disease primarily caused by diabetes, secondary cataract and vitreous opacities, as well as age-related macular degeneration. As at June 2017, Ellex reported revenues of € 48.2 million with an EBITDA margin of € 1.1 million.
- Novanta: the group is a leading global supplier of core technology solutions that give healthcare and advanced industrial original equipment manufacturers (“OEMs”) a competitive advantage. The company combines deep proprietary technology expertise and competencies in photonics, vision and precision motion with a proven ability to solve complex technical challenges. This enables Novanta to engineer core components and sub-systems that deliver extreme precision and performance, tailored to company's demanding applications. Novanta's common shares are quoted on Nasdaq. In 2016, the company reported € 366 million of revenues for € 51 million of EBITDA.
This table summarizes the main aggregates of Quantel’s selected comparables:
in € million Sales 17E Sales 18E Ebitda 17E Ebitda 18E Ebit 17E Ebit 18E Net Earnings 17 Net Earnings 18
Coherent Inc. 1 458,8 1 608,3 438,9 494,8 391,5 445,1 175,3 219,8
Topcon Corp. 1 108,8 1 170,0 151,3 169,7 97,1 118,5 49,7 64,2
LPKF Laser & Electronics AG 102,0 108,6 10,6 14,8 2,8 6,4 1,0 3,7
Ellex Medical Lasers Limited 50,5 57,9 -2,1 -1,3 -3,9 -3,3 -3,9 -3,1
Novanta Inc. 434,3 482,1 88,1 98,7 75,3 82,8 50,0 40,2
Source: Genesta. InfrontAnalytics
in € million Market cap. Net debt Minorities EV
Coherent Inc. 4 470,6 -290,6 0,0 4 180,0
Topcon Corp. 1 827,2 424,3 0,0 2 251,5
LPKF Laser & Electronics AG 194,9 37,3 0,0 232,2
Ellex Medical Lasers Limited 79,5 0,6 0,0 80,1
Novanta Inc. 1 601,1 33,0 0,0 1 634,1
Source: Genesta. InfrontAnalytics

www.genesta-finance.com
G G E N E S T A Equity & Bond Research
18
19 March 2018 Quantel
5.2.2 Valuation
This table summarizes the ratios of comparable companies:
EV/Sales 17 EV/Sales 18 EV/Ebitda 17 EV/Ebitda 18 EV/Ebit 17 EV/Ebit 18 PE 17 PE 18
Coherent Inc. 2,9 2,6 9,5 8,4 10,7 9,4 23,8 19,0
Topcon Corp. 2,0 1,9 14,9 13,3 23,2 19,0 45,3 35,1
LPKF Laser & Electronics AG 2,3 2,1 22,0 15,7 na 36,3 na 62,7
Ellex Medical Lasers Limited 1,6 1,4 na na na na na na
Novanta Inc. 3,8 3,4 18,6 16,6 21,7 19,7 32,7 40,7
Average 2,5 2,3 16,2 13,5 18,5 21,1 33,9 39,4
Median 2,3 2,1 16,7 14,5 21,7 19,4 32,7 37,9
Source: Genesta. InfrontAnalytis
This table displays the implied valuations of Quantel according to the current valuation multiples of the comparables companies:
Sales 17E Sales 18E Ebitda 17E Ebitda 18E Ebit 17E Ebit 18E Net earn. 17E Net earn. 18E
Quantel 85,1 95,3 10,7 15,7 6,8 10,2 4,1 7,2
Resulting valuation 227,9 232,6 189,3 227,2 141,0 231,0 139,7 282,0
208,4 218,5 194,4 242,8 162,7 213,2 134,5 271,2
Average valuation / share 14,07 13,53 11,86 13,12
Source: Genesta. InfrontAnalytis
Given the difference between the average market capitalisation of the selected comparables companies and the calculated capitalisation of Quantel, we apply a discount based on the approach established through a model developed by Eric-Eugène Grena. This approach is introduced hereafter in a methodological note. In the case of Quantel, this method leads us up to apply a discount of -18.4 % to the previous result.
Average capitalisation of comparables companies € 1,634.7 million
Company capitalisation (not adjusted) € 207.3 million
Capitalisation ratio 12.7%
Applied discount -18.4%
After the application of this discount, we obtain the following valuation:
Average valuation per share 11.48 11.04 9.68 10.70
Average 10.73
By deduction, using the comparable method, we obtain the following valuation of €10.73 for Quantel, representing an upside of 44.9% compared to the last closing price of €7.40 on March 16, 2018.
5.2.3 Size discount / premium methodology
Considering the possible gap between the peers’ average market capitalization and the company’s, Genesta implements a discount, or a premium, inspired by the Eric-Eugène Grena’s model, in order to obtain a more relevant valuation of the company. Works led by Eric-Eugène Grena – SFAF member, former director of BNP Paribas Equity Research and former partner at Clinvest – showed that there exists a risk to implement peers valuation approach without taking into account the existence of large gaps between the size of the valuated company and the one of its peers. Thus, it seems important to make a correction by calculating a discount or a premium applied to the estimated company if necessary. The study, which has been made on a conclusive sample, revealed a decrease in the PE ratios regarding the peers’ size and that the correction should be of the same order of extent.

www.genesta-finance.com
G G E N E S T A Equity & Bond Research
19
19 March 2018 Quantel
The approach followed by Genesta consists in:
1) Calculating the ratio between the estimated company’s market capitalization and the one of its peers;
2) Implementing, as stated by the previously calculated ratio, a discount or a premium according to the abacus defined by Eric-Eugène Grena while taking care of using a linear regression between each increment ;
3) Applying this discount or premium to the estimated market capitalization of the valuated company and thus refining the peers estimation’s relevance.
Capitalization ratio Adjustment applied
<2% -40%
2% -34%
5% -26%
10% -20%
20% -14%
30% -10%
40% -7%
50% -5%
60% -4%
80% -2%
100% 0%
120% 2%
140% 4%
150% 5%
160% 7%
170% 10%
180% 14%
190% 20%
195% 26%
198% 34%
>198% 40%
5.3 Estimated weighted valuation of Quantel
The average of the two methods used (DCF and comparables) gives a fair valuation of €10.35 for Quantel.
Discount
Premium

www.genesta-finance.com
G G E N E S T A Equity & Bond Research
20
Quantel 19 March 2018
6 Summary of financial statements
6.1 Simplified Income Statement
6.2 Balance Sheet – Main items
6.3 Cash Flows Statement – Main items
31/12 (€m) 2015 2016 2017E PF 2018E 2019E 2020E
Revenues 62,1 63,3 85,1 95,3 109,6 120,6
% change 1,8 % 3 4 ,5% 11,9 % 15,1% 10 ,0 %
Procurements -27,6 -27,2 -35,7 -39,1 -44,7 -48,2
% of revenues 44,5% 43,0% 42,0% 41,0% 40,8% 40,0%
Staff costs -18,7 -19,6 -23,9 -25,1 -25,4 -27,2
% of revenues 30,1% 31,0% 28,1% 26,4% 23,2% 22,5%
Other costs -10,9 -12,3 -15,4 -16,0 -18,7 -20,2
% of revenues 17,6% 19,4% 18,1% 16,8% 17,0% 16,7%
Ebitda 5,9 4,9 10,7 15,7 21,7 25,9
% of sales 9 ,6 % 7,7% 12 ,6 % 16 ,5% 19 ,8 % 2 1,5%
Depreciations & Provisions -3,6 -3,8 -3,9 -5,5 -7,0 -7,7
% of revenues 5,8% 6,0% 4,6% 5,8% 6,4% 6,4%
Ebit 2,3 1,1 6,8 10,2 14,7 18,2
% of revenues 3 ,8 % 1,7% 8 ,0 % 10 ,8 % 13 ,5% 15,1%
Financial income & charges -0,5 -0,5 -0,4 -0,3 0,0 0,0
% of revenues -0,9% -0,7% -0,5% -0,3% 0,0% 0,0%
Earnings before tax 1,8 0,6 5,7 9,9 14,7 18,2
% of revenues 2 ,9 % 1,0 % 6 ,7% 10 ,4 % 13 ,5% 15,1%
Income tax 0,3 0,0 -1,6 -2,8 -4,1 -5,1
Tax rate (%) -18,6% 0,6% 28,0% 28,0% 28,0% 28,0%
Net earnings 2,1 0,6 4,1 7,2 10,6 13,1
% change 53 8 ,4 % 74 ,0 % 4 8 ,2 % 2 3 ,4 %
% of revenues 3 ,4 % 1,0 % 4 ,8 % 7,5% 9 ,7% 10 ,9 %
Number of shares (in million) 8,18 9,23 15,77 15,77 15,77 15,77
EPS ( EU R per share) 0 ,2 6 0 ,0 7 0 ,2 6 0 ,4 5 0 ,6 7 0 ,8 3
31/12 (€m) 2015 2016 2017E PF 2018E 2019E 2020E
Goodwill 3,8 4,0 30,4 30,4 30,4 30,4
Intangible assets 9,9 10,4 15,9 17,0 17,8 19,8
Tangible assets 1,4 1,9 4,7 5,9 7,5 8,4
Financial fixed assets 1,4 1,0 2,0 2,3 3,0 3,5
Working Capital Requirements (WCR) 20,4 20,8 29,0 31,8 36,0 38,6
% of revenues 32,9% 32,9% 34,1% 33,4% 32,8% 32,0%
Gross financial debts -14,4 -11,9 -21,7 -16,5 -8,2 -7,6
Cash and short term investments 4,8 4,7 7,0 7,0 7,0 18,8
Net financial position (net financial debt if a minus) -9,6 -7,2 -14,7 -9,5 -1,2 11,2
31/12 (m€) 2015 2016 2017E PF 2018E 2019E 2020E
Cashflow 5,0 4,9 9,0 13,7 18,5 21,7
Capital expenditure -3,4 -5,6 -6,0 -6,2 -7,1 -7,2
% of revenues 5,5% 8,9% 7,0% 6,5% 6,5% 6,0%
Impact of working capital requirements variation 2,6 -0,7 -8,2 -2,8 -4,1 -2,6
Free cashflow 4,2 -1,4 -5,1 4,8 7,3 11,8
www.genesta-finance.com
G G E N E S T A Equity & Bond Research
21
19 March 2018 Quantel
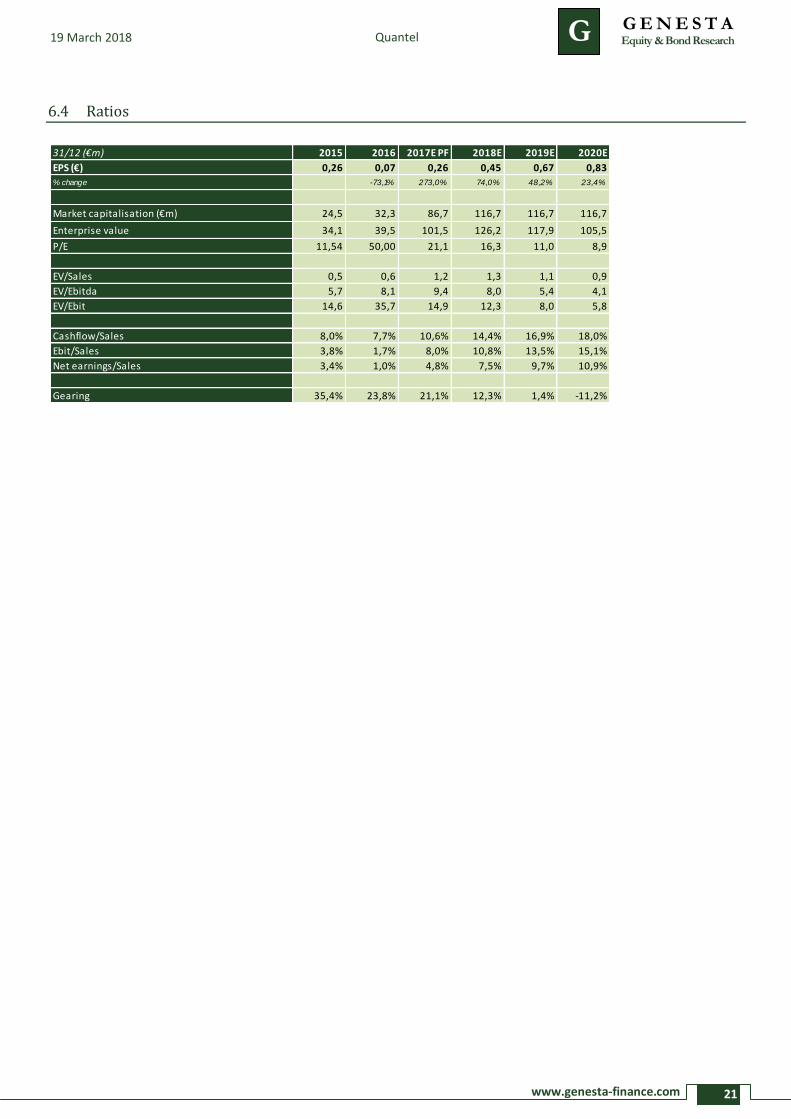
6.4 Ratios
31/12 (€m) 2015 2016 2017E PF 2018E 2019E 2020E
EPS (€) 0,26 0,07 0,26 0,45 0,67 0,83
% change -73,1% 273,0% 74,0% 48,2% 23,4%
Market capitalisation (€m) 24,5 32,3 86,7 116,7 116,7 116,7
Enterprise value 34,1 39,5 101,5 126,2 117,9 105,5
P/E 11,54 50,00 21,1 16,3 11,0 8,9
EV/Sales 0,5 0,6 1,2 1,3 1,1 0,9
EV/Ebitda 5,7 8,1 9,4 8,0 5,4 4,1
EV/Ebit 14,6 35,7 14,9 12,3 8,0 5,8
Cashflow/Sales 8,0% 7,7% 10,6% 14,4% 16,9% 18,0%
Ebit/Sales 3,8% 1,7% 8,0% 10,8% 13,5% 15,1%
Net earnings/Sales 3,4% 1,0% 4,8% 7,5% 9,7% 10,9%
Gearing 35,4% 23,8% 21,1% 12,3% 1,4% -11,2%
www.genesta-finance.com
G G E N E S T A Equity & Bond Research
22
Quantel 19 March 2018
7 Important disclosure
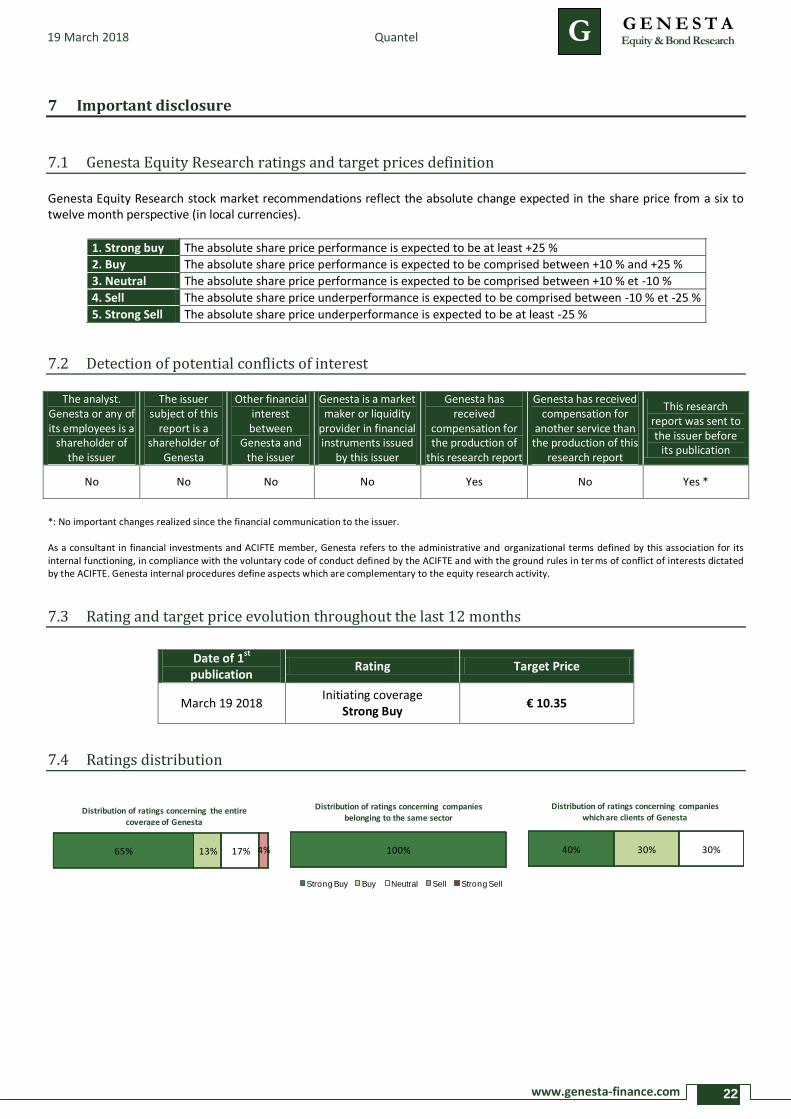
7.1 Genesta Equity Research ratings and target prices definition Genesta Equity Research stock market recommendations reflect the absolute change expected in the share price from a six to twelve month perspective (in local currencies).
7.2 Detection of potential conflicts of interest
The analyst. Genesta or any of its employees is a
shareholder of the issuer
The issuer subject of this
report is a shareholder of
Genesta
Other financial interest between
Genesta and the issuer
Genesta is a market maker or liquidity
provider in financial instruments issued
by this issuer
Genesta has received
compensation for the production of
this research report
Genesta has received compensation for
another service than the production of this
research report
This research report was sent to the issuer before
its publication
No No No No Yes No Yes *
*: No important changes realized since the financial communication to the issuer. As a consultant in financial investments and ACIFTE member, Genesta refers to the administrative and organizational terms defined by this association for its internal functioning, in compliance with the voluntary code of conduct defined by the ACIFTE and with the ground rules in ter ms of conflict of interests dictated by the ACIFTE. Genesta internal procedures define aspects which are complementary to the equity research activity.
7.3 Rating and target price evolution throughout the last 12 months
Date of 1st publication
Rating Target Price
March 19 2018 Initiating coverage
Strong Buy € 10.35
7.4 Ratings distribution
1. Strong buy The absolute share price performance is expected to be at least +25 %
2. Buy The absolute share price performance is expected to be comprised between +10 % and +25 %
3. Neutral The absolute share price performance is expected to be comprised between +10 % et -10 %
4. Sell The absolute share price underperformance is expected to be comprised between -10 % et -25 %
5. Strong Sell The absolute share price underperformance is expected to be at least -25 %
36% 23% 41%
Distribution of ratings concerning the entire
coverage of Genesta
100%
Distribution of ratings concerning companies
belonging to the same sector
Strong Buy Buy Neutral Sell Strong Sell
57% 29% 14%
Distribution of ratings concerning companies
which are clients of Genesta
100%
Répartition des opinionssur les valeurs suivies par Genesta au sein
d'un même secteur d'activité
Achat Fort Achat Neutre Vente Vente Fort
40% 30% 30%
Répartition des opinions sur les
valeurs pour lesquelles Genesta a fourni desprestations de services
Achat Fort Achat Neutre Vente Vente Fort
65% 13% 17% 4%
Répartition des opinions
sur l'ensemble des valeurs suivies par Genesta
Achat Fort Achat Neutre Vente Vente Fort
36% 23% 41%
Distribution of ratings concerning the entire
coverage of Genesta
100%
Distribution of ratings concerning companies
belonging to the same sector
Strong Buy Buy Neutral Sell Strong Sell
57% 29% 14%
Distribution of ratings concerning companies
which are clients of Genesta
www.genesta-finance.com
G G E N E S T A Equity & Bond Research
23
19 March 2018 Quantel
7.5 Additional disclosures
The information herein is not complete and therefore cannot be considered as contractual.
This document is not and should not be construed as an offer to sell or the solicitation of an offer to purchase or subscribe for any investment. Only investors with sufficient knowledge and experience in financial and business matters to evaluate the relevant merits and risks should consider an investment in any issuer or market discussed herein. Neither Genesta nor any officer or employee of Genesta accepts any liability whatsoever for any direct or consequential loss arising from any use of this publication or its contents. The information herein has been obtained from, and any opinions herein are based upon, sources believed reliable, but Genesta makes no representation as to its accuracy or completeness and it should not be relied upon as such. All opinions and estimates herein reflect the judgment of Genesta on the date of this report and are subject to change without notice. This report is not directed to, or intended for distribution to or use by, any person or entity who is a citizen or resident of or located in any locality, state, country or other jurisdiction where such distribution, publication, availability or use would be contrary to law or regulation or which would subject Genesta to any registration or licensing requirement within such jurisdiction. In particular, in the United Kingdom, Genesta further advises that this Research is solely intended to be delivered persons who qualify as defined in Rule 11 (3) du ‘Financial Services Act 1986 (Investment Advertisement) (Exemption) order 1997’. The distribution of this research report in the United States or its distribution to any citizen of the United States is forbidden. Genesta may have concluded a contract with the issuer subject of this report in order to produce one or several research reports which were previously sent to the issuer. However, Genesta may produce research reports concerning this issuer in an independent way. Copyright 2010 Genesta. All rights reserved.

![Finance islamique [Mode de compatibilité]rationnel-finance.com/Files/finance_islamique__mode_de... · Source: Banque Centrale Européenne ... -L’amélioration de la gouvernance,](https://img.dokumen.tips/doc/110x75/5b96491409d3f2de4a8d1844/finance-islamique-mode-de-compatibiliterationnel-source-banque-centrale.jpg)