Embed Size (px)
Citation preview

AD-A123 025 A STD TJO 0 E OMONF R ATE THE APPLICATION OF A GRAPHICAL /3METHOD To DETERMINE.(U) A IR FORCE INST OF TECHWRIGHT-PATTERSON AFB OH SCHOOL OF SYST..
U14CLASSIFIED D C BECKWITH ET AL. SEP 82 AFIT-LSSR-60-82 F/ 5/1 NLI
IIIIIIIIIIIIIIlfflfflfIIIIIIIIIIIIIIfllfllfIIIIIIIIIIIIIIlEIIIIIIIIIIIIlIIIIIIIIIIIIIIfllfllfIEIIIIIIIEEII

II J fI2 111.4~ 1.16
MtCROCOPY RESLUTION TEST CHART

___DTICELECTE
JAN6 1983
DEPARTMENT OF THE AIR FORCE D
AIR UNIVERSITY (ATC)
AIR FORCE INSTITUTE OF TECHNOLOGYLAJ...
Lo.d Wright-Patterson Air Force Base, Ohio
I ISUTErn.lON STATEME A S 1 5 058I ftibutimo Unimited
Aooesslon For
NT -IS -GRA&IDTIC TABUnanounced LJustification-
By --
Distribution/
Availability CodesAvail and/or
Dist I Special
A STUDY TO DEMONSTRATE THEAPPLICATION OF A GRAPHICAL METHOD
TO DETERMINE AN OPTIMALMAIN.ENANCE TASK INTERVAL
FOR AN ITEM IN AIR FORCE INVENTORY
Douglas C. Beckwith, Captain, USAFAnthony R. Roclevitch, Captain, USAF
LSSR 60-82
j1 -'~

The contents of the document are technically accurate, andno sensitive items, detrimental ideas, or deleteriousinformation are contained therein. Furth rmore, the viewsexpressed in the document are those of the author(s) and donot necessarily reflect the views of the School of Systemsand Logistics, the Air University, the Air Training Command,the United States Air Force, or the Department of Defense.
II
AFIT Control Number LSSR 60-82
AFIT RESEARCH ASSESSMENT
The purpose of this questionnaire is to determine the potential for currentand future applications of AFIT thesis research. Please return completedquestionnaires to: AFIT/LSH, Wright-Patterson AFB, Ohio 45433.
1. Did this research contribute to a current Air Force project?
a. Yes b. No
2. Do you believe this research topic is significant enough that it wouldhave been researched (or contracted) by your organization or another agencyif AFIT had not researched it?
a. Yes b. No
3. The benefits of AFIT research can often be expressed by the equivalentvalue that your agency received by virtue of AFIT performing the research.Can you estimate what this research would have cost if it had beenaccomplished under contract or if it had been done in-house in terms of
manpower and/or dollars?
a. Man-years $ (Contract).
b. Man-years $ (In-house).
4. Often it is not possible to attach equivalent dollar values to research,although the results of the research may, in fact, be important. Whetheror not you were able to establish an equivalent value for this research(3 above), what is your estimate of its significance?
a. Highly b. Significant c. Slightly d. Of NoSignificant Significant Significance
a
5. Comments:
Name and Grade Position
Organization Location

FOLD DOWN ON OUTSIDE -SEAL WITH TAPE
AFIT/ULHWrNWNTPATflNUS AM ON 4M43 111111AG
_____________________NECESSARY
OGFIFCIAL muuml FMIPKKALTT Von PUV*TI VOL pwf IN THE
UNITED STATES
BUSINESS REPLY MAIL I_ _ _ _
MS LI P NIT .I 7=106 EASNiNGON D.C.
OSMANE ILL Ul PAD IT ADDRESSEE
Wrikt-P&Mtrun AnE OH 45433______
FOLtD IN

tJI T.ARR TII'nI
SECURITY CLASSIFICATION OF THIS PAGE (Menli D £nlS _ereO
READ INSTRUCTIONS8REPORT DOCUMENTATION PAGE BEFORE COMPLETING FORM
1. REPORT NUMBER 2. GOVT ACCCSSION NO. 3. RECIPIENT*S CATALOG NUMMER
LSSR 60-824. TITLE (and Subtitle) S. TYPE OF REPORT & PERI"'# COVERED
A STUDY TO DEMONSTRATE THE APPLICATION OFA GRAPHICAL METHOD TO DETERMINE AN OPTIMAL Master's ThesisMAINTENANCE TASK INTERVAL FOR AN ITEM IN 6. PERFORMING ORG. REPORT NUMBER
AIR FORCE INVENTORY7. AUTHOR(e) S. CONTRACT OR GRANT NUM8E9We)
Douglas C. Beckwith, Captain, USAFAnthony R. Roclevitch, Captain, USAF
S. PERFORMING ORGANIZATION NAME AND ADDRESS 10. PROGRAM ELEMENT. PROJECT. TASK
School of Systems and Logistics AREA & WORK UNIT NUMBERS
Air Force Institute of Technology, WPAFB O
II. CONTROLLING OFFICE NAME ANO ADDRESS 12. REPORT DATE
Department of Communication and September 1982Humanities 13. NUMEER OF PAGES
AFIT/LSH, WPA.SB"OH 45433 20914. MONITORING AGENCY NAME • ADORESS(ii different Ihor Controlling Office) 2S. SECURITY CLASS. (of tis rpot)
UNCLASSIFIED
IS&. DECL ASSI FICATION/ DOWNGRADINGSCHEDUL.E
IS. OISTRIlUTION STATEMENT (of d1.1 Report)
Approved for public release; distribution unlimited
17. DISTRIBUTION STATEMENT (of the abette entered In block 20, it different hrn Report)
II PPEENTARY NOTES )AW MV fO 'D1 ~~ AW AMIR JYU.17• AIR FORCE INSTITUTE OF TECHNOLOGY TC)
1! KW o tnecesary and idetity by block nimbe)RelcmnScheduled Maintenance Age Replacement
Reliability-Centered Maintenance Interval DeterminationInertial Measurement Units Failure Data AnalysisOptimal Maintenance Policies
20. ABSTRACT (Coantlnue, an revere Side If neoomy and Idetif y bp bloek num•bf)
Thesis Chairman: Arthur L. Rastetter, Major, USAF
DD ,*M 1473 EOITON OF I NOV65 IS OSOLETE UNCLASSIFIEDSECURITY CLASSIFICATION OF THIS PAGE (When Date Entered)

rNT.ARATPTxDSECURITY CLASSIFICATION OF THIS PAGIt(Whe Dele nmf,")
-Detjermining maintenance task intervals is an important part ofany scheduled maintenance program. Criteria for determiningoptimal intervals is usually based on an objective functiondesigned to minimize average long-term (expected) cost. Thisstudy demonstrates a graphical method, developed by Bergman in1977, for determining a maintenance task interval using the KT-73Inertial Measurement Unit installed on the A7-D. The methodestablishes intervals on a ehard time" replacement policy, butcan also be used under an kon-condition" maintenance policy. Theauthors sought to discuss this study within the context of theReliability-Centered Maintenance Program, but to deviate from thetraditional age exploration concept and cost-benefit analyses.Instead, Bergman's simple, but rigorous, method is employed tofind a task interval based on a control strategy which balancescost of replacement with cost of failure and results in a minimumtotal long-run average cost per unit time. Among the advantagesof Bergman's method are that the underlying failure distributionneed not be known and that a sensitivity analysis can be performedto examine the effects of cost uncertainty with regard to changesin the optimal interval.
I.
UNCLASSIFIEDSECUNITY CLASSIFICATION OF THIS PAGE(Wh.E Dine Intered)

LSSR 60-82
A STUDY TO DEMONSTRATE THE APPLICATION OF A GRAPHICAL
METHOD TO DETERMINE AN OPTIMAL MAINTENANCE
TASK INTERVAL FOR AN ITEM IN
AIR FORCE INVENTORY
A Thesis
Presented to the Faculty of the School of Systems and Logistics
of the Air Force Institute of Technology
Air University
In Partial Fulfillment of the Requirement for the
Degree of Master of Science in Logistics Management
By
Douglas C. Beckwith, BS Anthony R. Roclevitch, BSCaptain, USAF Captain, USAF
September 1982
Approved for public release;distribution unlimited

This thesis, written by
Captain Douglas C. Beckwith
and
Captain Anthony R. Roclevitch
has been accepted by the undersigned on behalf of thefaculty of the School of Systems and Logistics in partialfulfillment of the requirements for the degree of
MASTER OF SCIENCE IN LOGISTICS MANAGEMENT
DATE: 29 September 1982
COMMITTEE CHAIRMAN
READER
ii

ACKNOWLEDGEMENTS
We gratefully acknowledge the guidance and coopera-
tion of our advisor, Major Art Rastetter; of our reader,
Mr. Ernie Spitzer; and of our technical advisor, Major Carl
Talbott, Jr., whose combined efforts made this study
possible. We also thank Mr. Jim Hitchcock and Captain John
Griffin from the Aerospace Guidance and Metrology Center;
Mr. Vern McAlpin and Mr. Bob Newman from the HQ AFLC
Engineering Analysis and Support Division; and Ms. Connie
Pavliga, our typist.
Captain Beckwith: I wish to express loving
gratitude to my wife, Cindy, and daughter, Sarah, for their
patience, understanding and selfless cooperation through
the graduate program.
Captain Roclevitch: I dedicate my work to my wife,
Sylvia, and son, Tony, whose love I could not do without,
and for whom, I do everything.
iii
TABLE OF CONTENTS
Page
ACKNOWLEDGEMENTS.......................iii
LIST OF TABLES........................vii
LIST OF FIGURES. ...................... viii
CHAPTER
1. INTRODUCTION ............ .......... 1
Terminology ......................2
Background. ........... ....... 4
Justification for Research .. .......... 9
Problem Statement .. .............. 12
Research Objective. .............. 12
Research Question .. .............. 12
Scope and Limitations .. ............ 13
Methodology. .................. 18
Research Assumptions. ............... 19
II. LITERATURE REVIEW . . . . . .. .. .. .. ... 21
Introduction....................21
Discussion .. .. .. .. .. .. .. .... 22
Optimal Replacement Policies .......... 22
Age Exploration .. ................ 28
Computer-Assisted Maintenance Programs 29
Su~imary. .. .................. 30
iv
CHAPTER Page
III. METHODOLOGY....................33
Cost Measurement. ................ 34
Total Time on Test-plot: Analysisof Failures ................. 35
Nonparametric Age Replacement. ........ 36
Sensitivity Analysis. .............. 44
The Sample .................... 46
Data Collection ................ 51
Answering the Research Question. ........ 55
IV. APPLICATION AND ANALYSIS .. ............ 59
The Failure Data. ................ 59
Total Time on Test-plot ............. 61
Cost Data....................70
Graphical Solution. ............... 75
Sensitivity Analysis. .............. 83
Summary.....................87
V. CONCLUSIONS, IMPLICATIONS ANDRECOMMENDATIONS ................ 92
Conclusions .................. 92
Research Question ............... 92
Secondary Research Question "a'. .. ...... 93
Secondary Research Question "b'. .. ...... 93
Implications. ................. 95
Managerial Tool ................ 95
Opportunistic Maintenance Policy . . . . . 95
v

CHAPTER Page
Recommendations....................97
General ..................... 97
Recommendations for Future Research .. . . 98
APPENDICES........................100
A. FUNCTIONAL DESCRIPTION AND INSPECTIONCHECKLIST--KT-73IMU..............101
B. G078C REPORTS - "AIRCRAFT LISTING" AND"FIELD OPERATING HOURS (FOH) BY CYCLE -
QUARTERLY.........................131
C. K051 LOGISTIC SUPPORT COST BREAKDOWN. ...... 153
SELECTED BIBLIOGRAPHY.......................193
A. REFERENCES CITED.....................194
B. RELATED SOURCES....................197
BIOGRAPHICAL SKETCHES OF THE AUTHORS...........199
vi

LIST OF TABLES
Table Page
3-1 Program Output ..... ............... ... 38
4-1 Times to Failure by Serial Number ...... 60
4-2 Scaled Times to Failure .. ........... .67
4-3 Average Cost to Repair KT-73 IMU ...... .71
4-4 Trouble-shooting and TransportationCosts Quarterly Totals ............. .73
vii

LIST OF FIGURES
Figure Page
3-1 Program for Scaling Observed Data ...... 37
3-2 TTT-plot ....... .................. .39
3-3 Examples of Empirical Distributions ..... 40
3-4 Graphical Solution .... .............. .45
3-5 Sensitivity Analysis .... ............ .. 47
3-6 Effects of Shape of Failure Curve onSensitivity ..... ................ .48
4-1 TAPE 11: Raw Failure Data . ......... 62
4-2 Program to Order Failure Data ......... .64
4-3 TAPE 12: Ordered Failure Data ....... 65
4-4 Program to Scale Total Time on Test ..... 66
4-5 TAPE 13: Calculated Ui's ........... . ..68
4-6 Total Time on Test-plot .. ........... .69
4-7 Program to Calculate Cost "C" ........... ... 76
4-8 TAPE 20: Average Cost to Repair and TotalNumber of Units Repaired ............ .77
4-9 TAPE 21: Costs of Trouble-shooting andTransportation ..... ............... .78
4-10 TAPE 22: Standardized Cost of Replacement
"C" ........ .................... .79
4-11 SPSS Condescriptive Routine and Results . . . 80
4-12 Graphical Solution .... .............. .. 81
4-13 Sensitivity Analysis .... ............. .. 85
viii

CHAPTER I
INTRODUCTION
Determining maintenance task intervals is an impor-
tant part of any scheduled maintenance program. Criteria
for determining optimal intervals are usually based on an
objective function designed to minimize average long-term
(expected) cost. Cost can be expressed in terms of dollars,
availability, or readiness, to name a few. This study will
demonstrate a graphical method developed by Bo Bergman in
1977 to determine an optimal maintenance task interval for
an item in Air Force inventory.
A maintenance task is categorized into one of three
recognized maintenance processes: hard time replacement,
on-condition, or condition monitoring.
A "hard time" maintenance policy consists of estab-
lishing interval time periods of constant "T" at the end of
which a unit is replaced, regardless of condition, as a
means of precluding failure (1:5; 26:A2-3).
An "on-condition" maintenance policy consists of
establishing interval time periods to inspect a unit for
measurable wear with a decision to replace based on exceed-
ing set limits (1:6; 22:51).
A "condition monitoring" maintenance policy does
not require maintenance tasks. Under this policy, units
1

not safety or economically significant are permitted to fail
and are replaced when discovered (1:7; 22:66).
Bergman's method will be used in this study to
determine an optimal task interval based on the hard time
concept. The chief advantages of Bergman's method are that
the method is simple, the underlying failure distribution
need not be known, and the method can be used to analyze any
maintenance item for which failure and cost data are avail-
able.
A great deal of theory exists on the subject of
optimal maintenance policies (see Chapter II). This study
attempts to apply some of that theory within the context of
an existing maintenance program.
Terminology
Any discussion of maintenance task interval deter-
mination in the Air Force is fundamentally tied to Relia-
bility-Centered Maintenance (RCM) concepts. Therefore, the
following terms, used throughout this paper, are defined:
Actuarial Analysis: "Statistical analysis of
failure data to determine the age-reliability characteristics
of an item [22:453]."
Age Exploration: "The process of collecting and
analyzing information from in-service equipment to determine
the reliability characteristics of each item under actual
operating conditions [22:453]."
2
Age Replacement: Replacement of a unit at failure
or some specified age, whichever occurs first (25:139).
Decision Diagram: "In RCM analysis, a graphic dis-
play of the decision process in which the answers to an
ordered sequence of yes/no questions lead to an identifica-
tion of the appropriate maintenance action for an item with-
out regard to appropriate level (22:455]."
Failure Modes and Effects Analysis (FMEA): "An
analysis, initially performed by the equipment (aircraft)
manufacturer, on all the major assemblies, subsystems and
systems to demonstrate how the equipment will perform when
various items fail [22:80]."
Failure Cycle: The time from renewal to failure of
an item.
Item: "Any level of the equipment or its sets of
parts isolated as an entity for study (22:459]."
Reliability-Centered Maintenance: "A logical
discipline for developing a scheduled maintenance program
that will realize the inherent reliability levels of complex
equipment at minimum cost [22:463]."
Renewal: Restoring an item to a "good-as-new"
condition.
Significant Item: "An item whose functional
failures have safety or significant economic consequences
(22:4641." The term "significant" is a subjective value
3

assignment made through decision processes which are outside
the scope of this study.
Task Interval: "The task interval assigned in a
maintenance program, subject to adjustment on the basis of
findings from actual operating experience through a process
called age exploration [22:459]."
AFLC: Air Force Logistics Command
AFSC: Air Force Systems Command
AGMC: Aerospace Guidance and Metrology Center
DOD: Department of Defense
MDS: Mission-Design-Series
WUC: Work Unit Code
Background
Early aircraft were primitive, and redundancy was
practically absent in aircraft design due to weight penalties.
Consequently, maintenance programs attempted to preclude the
failure of every part. The idea that a direct relationship
existed between reliability and safety led to the belief
that the more scheduled maintenance, the more reliable the
aircraft. Thus, "hard time" replacement policy drove early
maintenance programs (1:1-2). Aircraft components were
replaced after a specified time which, by best estimates,
would be before failure (22:51,65,370).
After World War II, advances in design, materials
and manufacturing of aircraft began to erode traditional
4

beliefs about the relationship between reliability and
safety. The airline industry, during the 1950s, introduced
new alternatives to "hard time" concepts. Eventually the
process of inspecting against measurable standards became a
second maintenance process. It would later be referred to
as the "on-condition" process (22:383; 1:2).
During the 1960s, studies conducted by the airlines,
technological advances, complexity of design, and the need
to maintain more efficient and cost-effective maintenance
programs eventually led to the recognition that certain
items do not benefit from scheduled maintenance. This dis-
covery resulted in the advent of a third maintenance process
called "condition monitoring." Under this process, items are
permitted to operate until failure. Maintenance tasks do
not exist under this process (22:66; 1:7).
The introduction of the Boeing 747 aircraft with
all of its complexities reinforced the need for new approaches
to maintenance. Major airline operators and Federal Avia-
tion Agency representatives formed a maintenance steering
group (MSG-1) which developed a decision tree technique for
determining maintenance requirements. The technique was
refined, expanded, and published in a universal document
called Airline/Manufacturer Maintenance Program Planning
Document: MSG-2 in 1970. The fundamental concept behind
the program was that maintenance actions can only prevent
deterioration of the inherent design levels of equipment
reliability (1:10; 22:Preface).
The objective of MSG-2 was to outline the organiza-
tion and decision processes for determining scheduled
maintenance requirements for new aircraft. In other words,
the MSG-2 document would facilitate the development of
initial scheduled maintenance programs (1:9).
As new airline programs based on MSG-2 decision
logic began to grow, the Department of Defense (DOD) experi-
mented with the program, beginning with the Navy P-3 air-
craft. Believing that benefits could be derived from the
MSG-2 program, especially in terms of manhour savings and
increased equipment availability, the DOD between 1974 and
1978 issued several directives and memorandums to implement
the "Reliability-Centered Maintenance Program (RCMP)" across
all services (1:22-88).
Initially, the program did not address the problems
of establishing task intervals, consolidating tasks into
work packages, or making decisions where no information is
available. These areas were addressed, but not resolved,
later in an authoritative text by Nowlan and Heap entitled,
Reliability-Centered Maintenance (22:Preface).
Nowlan and Heap wrote their text (1978) under
contract to the Office of Assistant Secretary of Defense
for Manpower, Reserve Affairs and Logistics. The text was
intended to provide the necessary information to understand,
6

develop and implement RCM programs (22:DD Form 1473). In
general, RCM implementation for a given aircraft system
consists of an initial failure modes and effects analysis
(FMEA) for significant items, identification of tasks via
use of the decision logic diagram, and determination of
task intervals (22:7).
The first requirement above is satisfied initially
by the builder of the airframe through Government contract.
The second requirement is fulfilled on a continuing basis
by the armed services (AFSC, AFLC in the Air Force) by
modifying task requirements based on engineering analysis.
The third requirement is discussed by Nowlan and Heap under
the general heading of age exploration, but no method for
determining optimal task intervals has been developed and
published by the Air Force. Currently, Air Force engineers
are using the Mean Time Between Failure (MTBF) and Incipiency
methods. The MTBF method is
based on a 70 to 90 percent probability ofdetecting a pending failure. This is equivalent toinspection at 10 to 30 percent of the MTBF. Analternative method called the Incipiency Concept holdsthat the inspection interval should be a function ofthe time between first discernible degradation inperformance and loss of the function [28:12].
There are also two computerized programs available (dis-
cussed in Chapter II), but they are designed primarily as
program management tools.
The Army has published an Appendix C to DARCOM-P
750-16, DARCOM Guide to Logistic Support Analysis,
7
which defines a general methodology for determining main-
tenance task intervals based on replacement cost, safety
and readiness criteria, and equipment failure rates. The
method uses age exploration and seeks to minimize cost, but
it involves subjective trade-off considerations (33:Cl-C44).
Frick and Sasser (1979) investigated a method to
improve the preventive maintenance checks an3 services pro-
gram for the M60Al main battle tank. In the study, Frick
and Sasser developed a questionnaire sent to operating units.
Each question represented a variable, such as technician
skill level, which was analyzed using multiple regression
to establish correlations between type and time interval
estimates for individual maintenance tasks. The results
were subjected to network analysis to produce a preventive
maintenance checks and services schedule (14:72-73). The
research was extremely subjective since it sought opinions
rather than substantive data.
Thus far, the Air Force has successfully integrated
the majority, but not all, of its aircraft inventory into
the RCM program through contract with the airframe builders.
System Managers monitor and update programs using the deci-
sion logic criteria outlined in MIL-M-5096D and AFLCP 66-35.
(A proposed AFSC/AFLC combined regulation is being drafted
which will greatly expand AFLCP 66-35.) However, maintenance
8

task interval determination remains an area without a proven
applicable analytical technique.
Although RCM is a DOD program, each service is pur-
suing the program objectives individually. There is no
apparent consistency of effort. The major problem seems to
be lack of guidance from DOD which can best be characterized
by the fact that DOD, despite its emphasis on implementing
the RCMP within the services, has yet to define the program
(1:84-85).
Justification for Research
The Air Force recently experienced a large incidence
of failure of the fifth stage compressor disc for the J-85
engine (20:3). Attention to the problem was brought about
by an aircraft accident. The aircraft accident board
attributed the accident to failure of the disc and also dis-
covered that the replacement interval for the disc had been
changed by AFLC from the 3200 hours recommended by General
Electric to 4000 hours. The disc failed less than 100 hours
from replacement and resulted in the loss of the aircraft.
Consequently, the replacement interval has been changed to
3600 hours (20:1-3). The board findings illustrate the need
to develop a methodology for determining optimal maintenance
intervals.
An excerpt from a HQ USAF Reliability-Centered
Maintenance PrograuL Status Report dated 29 May 1981,
identifies an Air Force Logistics Management Center (AFLMC)
9

tasking to pursue a means of improving the analytical process
for determining scheduled maintenance task intervals during
FY 82 and the outyears (19:4).
The latest effort by AFLMC was a contract study
which resulted in a report authored by Singpurwalla and
Talbott and published in January 1981. The report reviewed
key ideas in the area of preventive maintenance replacement
policies, and concluded that sufficient theory exists for
practical applications (26:A2-16,17).
There is, indeed, much theory (see Chapter II) con-
cerning optimal maintenance policies used to determine task
intervals. The policies are typically based on the objective
of finding the interval which minimizes cost. Bergman's
method, the subject of this study, also seeks to minimize
cost. However, as these methods are presented in theoretical
form, application of the theory needs to be explored.
The MSG-2 maintenance concept did not address the
problem of establishing task intervals (22:Preface). Any
maintenance task can be made effective in terms of failure
prevention if the intervals are made short enough, but this
ignores, among other things, the opportunity cost of being
unable to operate the equipment during maintenance (22:91,95).
Nowlan and Heap discuss maintenance task interval
determination in terms of age exploration and actuarial
analysis. Basically, intervals are established at an age
when a large number of failures begin to occur, but before
10

which very few failures occur (22:390). Approaching the
problem of cost-effectiveness, they employ a decision logic
technique. Specifically, they recommend at least four pro-
posed intervals be examined to determine whether a cost-
effective interval does exist, based on the most favorable
cost-benefit ratio (22:102).
Their approach tends to chboptimize the last of the
four objectives of an operator's maintenance program. Those
objectives are
- To ensure realization of the inherent safety andreliability levels of the equipment.
- To restore safety and reliability to their inherentlevels when deterioration has occurred.
- To obtain the information necessary for designimprovement of those items whose inherent reliabilityproves inadequate.
- To accomplish these goals at a minimum total cost,including maintenance costs and the costs of residualfailures [22:Preface].
Nowlan and Heap do not approach the problem of determining
"optimal" intervals by balancing the cost of replacement and
the cost of failure.
Perhaps a key word is "costs." Concerted efforts
to assess benefits derived from implementation of RCM pro-
grams in DOD have generated controversy because of the
difficulty in delineating cost-savings directly attributable
to RCM and in quantifying benefits such as increased equip-
ment availability (1:68-69).
An unending cycle exists in which appropriate cost
data is not available to fully test new methods for deter-
mining maintenance task intervals, while on the other hand,
11
II I I I ll II• - iii

the adoption of an acceptable methodology might warrant
changes in data systems to facilitate collection of needed
cost information.
Nevertheless, a need exists to begin bridging the
gap between theoretical and practical application of method-
ology to determine maintenance task intervals.
Problem Statement
DODD 4151.16, AFR 66-14, AFR 66-30, AFLCP 66-35 and
MIL-M-5096D provide definitions, outline responsibilities
and explain the use of reliability data as applied to equip-
ment maintenance, but the Air Force does not present a
standard analytical approach for determining maintenance
task intervals in published form.
Research Objective
The objective of this study is to demonstrate the
feasibility of applying a new and simple graphical method
for determining optimal maintenance task intervals using
actual field data for equipment used on aircraft. The method
is based on a control strategy which balances cost of replace-
ment with the cost of failure resulting in a minimum total
long-run average cost per unit time.
Research Question
Can Bergman's graphical method be applied in deter-
mining an optimal maintenance task interval based on the
12

objective of minimizing total long-run average cost per
unit time using actual field data?
Since the research question involves application of
actual field data for an existing item in Air Force
inventory, two questions secondary to the research question
are
1. How does the calculated optimal interval for
the units tested compare with the current interval for that
item?
2. How sensitive is the calculated optimal interval
to the uncertainty of cost?
Scope and Limitations
The Reliability-Centered Maintenance Program is a
DOD program and applies to all military services. There
are three basic steps for incorporating a major equipment
end item into the program: (1) a failure modes and effects
analysis (FMEA) for all significant items, (2) identifica-
tion of maintenance tasks based on the decision logic and
(3) dk.termination of maintenance task intervals. This study
is concerned with the third requirement and is limited to
its application in the Air Force, though results could be
generalized to any equipment maintenance program. Bergman's
graphical technique was chosen among the many available
theoretical models because it is a simple, but rigorous
method.
13

The units selected for the study were taken from
the Air Force aircraft inventory of equipment primarily to
facilitate data collection.
The unit selected for study was by no means an ideal
one. The KT-73 Inertial Measurement Unit (IMU) is used on
the A7-D and AC-130A aircraft. This study collected data
for only those units installed on the A7-D. A complete
description of the unit is contained in Appendix A. As an
electronic component, the KT-73 IMU currently does not have
a maintenance task interval assigned to it. Like other
electronic units, the KT-73 is assumed to have an exponential
failure distribution (16). Thus, the item is maintained
under a condition monitoring or "fly-to-failure" policy. A
hard time replacement policy is appropriate for those items
which exhibit wearout characteristics for which an economic
life-limit can be identified. A unit which is already main-
tained under a hard time replacement policy would better
illustrate the application of Bergman's graphical method.
Availability of failure data dictated the choice
of unit for study. Bergman's method requires the use of
observational data. The KT-73 is repaired by the Aerospace
Guidance and Metrology Center (AGMC) and tracked by serial
number and field operating hours on the G078C Maintenance
Data Collection System. Since no other data collection
system could be found which provided the same type of
14

nonaggregated data, the C078C was the logical choice. The
KT-73 was selected among other IMUs because of early acquisi-
tion.
The greatest limitation on this study centers around
the availability of appropriate cost data. In order to find
an optimal replacement interval which minimizes cost, the
cost to replace an item (scheduled maintenance) as well as
the cost of an in-service failure (unscheduled maintenance)
must be known. These costs are actually random variables,
not constants. Since Bergman's method treats these costs
as constants, an expected value for each cost will be used
in lieu of a probability distribution description. Further-
more, since the cost data covers several years, it is assumed
that these historical costs are representative of actual
costs.
The cost of in-service failure can be obtained from
data collected by the Resources Division at AGMC and is
expressed in terms of the actual dollar amount required to
repair each failed unit. Adding to this, the cost of trans-
porting units to and from depot and the cost of labor to
trouble-shoot failed units gives the total cost of failure.
Replacement cost is the cost of transporting units
to and from depot plus the cost that would be incurred to
renew a nonfailed unit which is removed after a specified
interval of time, presumably before failure. This entails
repair or replacement of unit subcomponents which are
15
approaching failure, thus, restoring the unit to a "good-as-
new" condition (renewal) (24:53). Since the KT-73 IMU is a
hermetically-sealed unit, any unit received by AGMC, whether
failed or nonfailed, is subjected to the same test and repair
procedures (Appendix A contains a checklist used for testing
units) (16). Consequently, the same cost is incurred to
repair a nonfailed unit as a failed unit.
The difference between cost of replacement and cost
of failure is the cost of trouble-shooting. Other costs
which could be considered are the loss of equipment avail-
ability or readiness. But these costs are much too difficult
to quantify.
Actual cost to repair a failed unit is documented
as an annual average for each fiscal year. Transportation
costs are documented quarterly by WUC 73FAO in the K051
system. By adding the repair cost, transportation cost and
trouble-shooting cost, a total cost of in-service failure
can be assigned to each unit in the sample. The range of
these values can be evaluated for parameters and used for
sensitivity analysis under Bergman's method. A limitation
exists in that individual trouble-shooting costs cannot be
linked to individual unit failures by serial number. Cost
data provided by AGMC and the K051 data collection system
is presented in aggregated form from which averages (expected
costs) must be derived.
16

It should be noted that a unit might have failed in
a quarter previous to the one in which it arrived at and
was repaired by AGMC. In cases where this is true, the
costs of transportation and trouble-shooting for a unit may
be included in a different quarter than the quarter in which
the repair cost for the same unit is recorded. However,
since expected per unit costs in this study are computed
based on annual averages, the problem is limited to when the
discrepancy occurs between the last quarter of a given year
and the first quarter of the following year. Hence, the
use of annual averages tends to smooth or reduce the scope
of the mismatch problem.
Since in-service failure of the KT-73 will not
cause a mission abort or damage to other components in the
system, an attempt will not be made here to quantify the
effects of aircraft Not-Mission-Capable (NMC) time generated
by failure of the KT-73 unit. This kind of opportunity cost
(the cost of being unable to operate the aircraft) is con-
tingent on too many variables to attempt an adequate measure.
To illustrate this difficulty, a Government Accounting
Office (GAO) study in November 1976, an Air Force Audit
Agency (AFAA) audit in April 1977, and an Air Force study
in November 1977 sought to measure benefits derived from
RCM using the same kind of variables. General comments
from these reports concluded that ". . . RCM appeared to
have had an effect that could not be quantified [1:68]."
17

The validity of the findings of this study is
dependent on the accuracy of the data contained in the
G078C and K051 systems. Inaccuracies in the data are
probably the most often cited shortcoming of the entire
range of maintenance data collection systems (3:12).
Badalamente and Clark (1978) discuss these and other prob-
lems in their technical report. The advantage in using data
collected from the G078C is that operating hours are tracked
by a mechanical time indicator as opposed to being tracked
by manual observation.
Methodology
The objective of this study is to demonstrate the
application of Bergman's graphical method for determining
optimal maintenance task intervals. To accomplish this,
field data for the KT-73 Inertial Measurement Unit represent-
ing operating time to failure, replacement cost, and cost
of in-service failure will be collected from the G078C and
K051 Maintenance Data Collection Systems. The failure data
will be scaled and used to construct a Total Time on Test
(TTT)-plot representing a transform of the empirical failure
distribution for the unit. The cost data will be scaled and
used to plot a point, which represents the cost of replace-
ment, through which a line can be drawn tangent to the
TTT-plot. The abscissa of the tangent point denotes the
index for the optimal replacement interval.
18

The function that Bergman's method performs is to
minimize total long-run average cost per unit time, C(T),
by maximizing the reciprocal of the objective function,-l
(C(T)] .
The calculated interval can be compared to the
existing interval, which is infinite (fly-to-failure), and
a sensitivity analysis performed using a range of values
for cost of replacement to observe their effect on changes
in the optimal interval.
Research Assumptions
1. Units upon which data are collected are subjected
to identical and constant maintenance policy.
2. Field data was accurately entered into the
G078C and K051 Maintenance Data Collection Systems.
3. The replacement cost provided by AGMC is a valid
estimate of long-run average cost to replace.
4. The item used in this study is not safety-
critical.
5. Organizations operating the units under study
consider the effect of a unit's failure on mission in the
same way. Essentially, the effect which the unit has on
aircraft status in the Mission Essential Subsystems List
(MESL) is the same. For example, if the anti-skid system on
a T-39 aircraft is not operational, all units would record
the aircraft status as Partial-Mission-Capable (PMC). This
19

assumption is necessary since the priority given to failure
of a KT-73 unit could affect base labor costs.
20

CHAPTER II
LITERATURE REVIEW
Introduction
For over two decades, there has been a large andcontinuing interest in the field of reliability andmaintainability concerning maintenance models foritems with stochastic failures. This interest has itsroots in many military and industrial applications[23:3531.
As Pierskalla and Voelker point out in their survey
paper, there are a number of maintenance models. This review
is concerned with those models which pertain to the main-
tenance of simple (i.e., single component) equipment and
which involve an optimal decision to replace a unit in
service (scheduled, hard time maintenance). These types of
maintenance policies are known as "Replacement Policies" and
involve the single uncertainty of when a failure will occur
(26:A2-1).
The maintenance models presented here address
objective of minimizing total cost or maximizing availability.
In addition to the optimal concepts presented, the U.S. Army's
use of age exploration (in determining hard time replacement
intervals) as well as two computer-assisted maintenance pro-
grams are discussed. The literature has been divided into
the three sections indicated in Figure 2-1.
21

I. Optimal Replacement Policies
A. Age replacement
B. Block replacement
C. Periodic replacement with minimum repair at failure
D. Sequential replacement over a finite time span
E. Optimal replacement under damage accumulation model
II. Age Exploration
III. Computer Assisted Maintenance Programs
Fig. 2-1. Summary of Preventive Maintenance Literature
Discussion
Optimal Replacement Policies
This section considers policies pertaining to
scheduled maintenance actions on a hard time replacement
basis so as to preclude failure during operation. These
policies specify a replacement interval, T, which minimizes
total long-run average cost per unit of time,C(T).
Age Replacement. In general, an age replacement
policy is in effect when a part is replaced at failure or at
some specified age, whichever occurs first (6:85; 18:213;
7:751). This policy makes intuitive sense only if the cost
of replacement is less than the cost of an in-service failure
and only if all costs are nonnegative (6:85; 18:213; 7:751).
According to Barlow and Proschan, the specified
decision variable, age of replacement (i.e., T), can be ran-
dom (for a finite time span) or fixed (for an infinite time
22

span) (6:72,86). Most of the age replacement literature is
for an infinite time span, whereby, the underlying failure
distribution is assumed to be known and continuous, the
optimum age replacement interval is a constant, a replacement
restores the system to a good-as-new condition, and the
restoration process goes on indefinitely (6:86).
Ingram and Scheaffer assert that if the underlying
failure distribution is completely known, then finding the
optimum replacement interval is simply an analysis problem
(18:213). However, if the underlying distribution is not
completely known, they show that an estimate of the optimum
interval, T, can be found by minimizing a consistent estimator,
Cn (T), of the objective function C(T). The consistent estima-
tor, Cn (T), assumes a form or property of the failure distribu-
tion. They treat four cases: (1) a Weibull distribution with
unknown scale parameter, (2) a gamma distribution with unknown
scale parameter, (3) an empirical distribution, and (4) a
distribution specified only as having an increasing failure
rate (18:213). They conclude that the empirical estimator of
the optimum replacement interval is close to the estimators
of the cases in which the distribution is known (18:219).
Berg notes that previous authors have assumed that
an age replacement policy is appropi -te for a replacement
scenario. In his paper (7:751-759), he proves that an age
replacement policy is the optimal procedure among a range of
replacement policies for which a replacement time can be
23

well-defined (7:752). He accomplishes this by showing that
the expected long-run cost per unit time for an optimal age
replacement policy is less than or equal to the expected cost
associated with other common replacement policies (7:758).
Scheaffer introduces an optimal age replacement
policy with an increasing cost factor for an infinite time
horizon. Specifically, he addresses the exponential life
distribution with an exponential cost factor (25:142), i.e.,
the cost of replacing a unit increases with age. For example,
the trade-in value of a rubber tire may decrease with wear.
This has the effect of increasing the cost of replacement
with age. Using numerical illustrations, he shows that when
the objective function includes an increasing cost factor,
the optimum replacement interval yields a smaller average
cost per unit time than the interval found under a replace-
ment policy whose objective function does not include an
increasing cost factor (25:144).
According to Glasser, the analytical solution for
finding the optimal age replacement interval is generally
known (15:83). In his paper, he asserts that the optimal
interval depends upon: (1) the ratio of cost of failure to
cost of replacement, and (2) the average service life in
standard deviation units (15:86). For the truncated normal,
the gamma and the Weibull distributions, he charts cost ratio
versus service life for each case to obtain a graphical
24
means for locating the optimal replacement interval based
on changing values for the two variables (15:87-89).
Fox considers a discounted cost criterion when
determining an optimal age for replacement. Assuming a
continuous IFR failure distribution, he shows that for each
stage (replacement to replacement) on an infinite time
span, there is an optimal replacement interval which mini-
mizes loss (12:534). For example, if a replacement interval
is fixed at age T and afailure occurs before age T, then a
loss is incurred. Fox seeks to find an optimal interval
which minimizes this loss (12:534-535).
Block Replacement. Barlow and Proschan define a
block replacement policy as one in which an item is replaced
at equal time intervals independent of age and at failure
(6:67). This policy has the practical advantage of not
having to maintain records of failure times or age. When
compared to an age replacement policy, block replacement
results in a greater number of total removals. However, the
expected number of failures is fewer under block replacement,
provided failure increases with age (6:67). The objective
is to minimize average cost per unit of time.
Berg and Epstein acknowledge that block replacement
policies (BRPs) result in the replacement of fairly new
items. Some modifications to the BRP have been made to avoid
this drawback. One model allows minimal repair of a failed
25

item which is equivalent to replacing the item with a working
one of the same age (8:15). Another model permits a failed
item to remain idle until scheduled block replacement occurs
(8:16). They propose a third model called a Modified BRP.
In Berg and Epstein's Modified BRP, failed items are
still replaced immediately, but items of age "b" or less are
permitted to remain in service when a scheduled block replace-
ment point arrives. Within the interval (O,t), there is an
age b such that O<b<t. The objective function, C(b,t).is
then minimized for values of b and t (8:16-17).
Singpurwalla and Talbott point out that, although
the problem of replacing relatively new items is overcome,
an additional problem is created by requiring knowledge of
an item's age (26:A2-13).
Periodic Replacement with Minimum Repair at Failure.
Barlow and Hunter developed Policy II, a variation of the
block replacement concept. Under this policy, system replace-
ment occurs at a fixed time, regardless of the number of
previous failures. For failures which occur prior to
planned replacement, only minimal repairs are made so that
the system failure rate is unchanged (5:92). "This repair
action is mathematically equivalent to replacing the failed
item by another working item of the same age [8:15]." Under
this policy, complex systems appear to be single units aging
over time.
26

Sequential Replacement Over a Finite Time Span. In
a sequential replacement policy where an item has a finite
life, replacements are scheduled only for the next interval
such that the next planned replacement time is found which
minimizes expected cost over the remaining life of the system
(6:98). Hence, a new optimal replacement time is computed
after each replacement rather than at fixed time intervals.
Barlow and Proschan compared the results of a sequential
policy versus an age replacement policy and found that the
difference was quite small (about one percent of expected
cost) (6:105). Their work was reviewed by Singpurwalla and
Talbott who stated, "Only in cases of very high maintenance
costs should sequential replacement policies be considered
[26:A2-15] ."
Optimal Replacement Under Damage Accumulation Model.
Taylor presents an optimal replacement policy based on
additive damage which seeks to balance the cost of replace-
ment with the cost of failure, and which results in minimum
total long-run average cost per unit time (29:1). The damage
accumulation model uses a shock failure model in which shocks
to the system occur in a Poisson fashion and accumulate
additively. The total accumulated damage dictates the
probability of system failure (29:4). Assuming that the
accumulated damage can be continually observed by a controller,
a decision to replace can be made based on the current
27

value of total damage (29:2). Taylor shows that an optimal
policy exists which enables the controller to replace the
system upon reaching a critical damage threshold. Replace-
ment also occurs upon failure, regardless of the amount of
damage, and a penalty cost is incurred (29:5).
Singpurwalla and Talbott conclude that models of
this type have limited usefulness because they are highly
structured and require a great deal of user information
(26:A2-15).
Age Exploration
Nowlan and Heap's concept of age exploration (dis-
cussed in Chapter I) considers cost measurement subjectively
without giving a truly optimal method for determining main-
tenance task intervals. Although the U.S. Army uses this
concept for determining hard time replacement intervals,
the procedure below must be considered outside the context of
"optimal" age replacement policies.
Essentially, the Army establishes two types of hard
time limits: safety and readiness. In each case, a cumula-
tive failure distribution is first established (or assumed)
for the item under study. For safety limits, replacement
intervals are established based on extremely low probabilities
of failure. Readiness hard time intervals are established
for items which affect mission success. The readiness
interval is identified through a trade-off process involving
the cost of replacement, the cost of failure and the28

readiness requirement of the equipment under consideration
(33:C6-C19). Although an objective function is formulated,
the trade-off process actually represents a "search" process
for an acceptable, rather than an optimal, solution.
Computer-Assisted Maintenance Programs
The Computer Monitored Inspection Program (CMIP:
developed by Lockheed, and the Vought RCM Update System
developed by LTV Corporation are designed to help managers
keep scheduled maintenance programs current and cost-effective
while maintaining design levels of safety and reliability.
They are similar in that both programs use a series of computer
routines to reduce data collected by the Air Force. These
programs are currently in limited use by the Air Force for
determining intervals for scheduled maintenance programs and
are projected for widespread use on many MDS aircraft.
Essentially, the program outputs are designed to
provide analysts and decision makers with the information
necessary to evaluate maintenance task requirements.
Decisions can be made whether to add or drop certain mainte-
nance tasks and whether or not to change task intervals.
Additionally, information is provided concerning the effects
of these changes on associated manhours (17:29; 19:4).
The programs differ primarily in output. The CMIP
output is more condensed than the Vought output and was
designed as an exception report which makes recommendations
29

to the manager about changing requirements. The Vought
program output provides considerably more information designed
for the analyst's use. It does make recommendations, but
it provides enough information to permit in-depth analysis
for trends in changing requirements. For this reason, the
CMIP is more applicable to aircraft with well-screened
maintenance programs; i.e., multi-engine aircraft with
numerous redundant systems. On the other hand, the Vought
program is more applicable to fighter-type aircraft
(17:17).
Both programs recommend changes in maintenance task
intervals based on a "target probability" of having no mal-
functions occur between scheduled maintenance for the item
being considered. Once the target probability is established,
an exponential failure distribution is assumed and an interval
is calculated. The Vought program uses a fixed 85 percent
target probability while the CMIP permits input of user-
controlled target probabilities (17:31; 19:12). Although
the programs refer to calculated intervals as "optimum"
ones, the objective is not that of minimum cost or maximum
availability. Cost considerations are treated separately
from intervals and are limited only to evaluation of
associated manhour requirements.
Summary
This chapter has examined the literature on mainte-
nance policies designed to establish hard time replacement
30

intervals. Pertinent information was provided concerning
optimum replacement policies, Nowlan and Heap's notion of
age exploration and computer-assisted maintenance programs
to lay a basic framework for the research project.
The literature authored by Berg, Ingram and Scheaffer;
Barlow and Campo; Bergman; and Singpurwalla and Talbott
greatly influenced the direction of this project. Berg's
paper shows that an age replacement policy is the optimal
decision rule among all reasonable replacement policies.
Research conducted by Ingram and Scheaffer presents a method
of determining an estimate of the optimum age replacement
interval where an empirical distribution function may be
used with no serious loss of information. Barlow and Campo
originally introduced the TTT-plot technique that Bergman
later uses.
Bergman's research adds to the efforts of Ingram
and Scheaffer, and Barlow and Campo, and derives a graphical
technique used to obtain an estimate of the optimum age
replacement interval. This technique provides an easy
method to perform sensitivity analysis with respect to often
uncertain cost. It has advantages in application in that
it uses an empirical failure distribution versus an assumed/
heoretical failure distribution, and provides some intui-
tive feeling for the uncertainties involved in the estima-
tion. Singpurwalla and Talbott concluded that among the
age replacement policies, Bergman's graphical technique was
31

the most promising because of its ease of application and
theoretical correctness.
However, they cautioned that ". . . data over a
limited time span, may not adequately represent the true
failure distribution thereby introducing sampling error
[26:A2-lO]." Large samples are necessary for application
of the method.
Because of the above stated reasons, it was decided
that this research project would focus on Bergman's graphical
technique.
32

CHAPTER III
METHODOLOGY
The objective of this research is to demonstrate
that Bergman's method can be used to determine optimal main-
tenance task intervals based on a control strategy which
balances cost of replacement with the cost of failure and
results in a minimum total long-run average cost per unit
time. To accomplish this objective, field data for a given
piece of equipment will be analyzed using a Total Time on
Test (TTT)-plot originally introduced by Barlow and Campo
(1975) and presented in simple form by Bergman. Under this
method, the life distribution is assumed to be unknown and
observational data are provided (9:468). Once the data is
analyzed, a graphical method is applied to obtain a reason-
able nonparametric age replacement policy.
It should be noted that Bergman's method to obtain
an optimal age replacement policy provides "hard time"
intervals for scheduled rework or discard tasks.
The explanation of the methodology used in this
research involves a discussion of cost measurement, TTT-
plot, graphical solution, sensitivity analysis, sample
space and data collection.
33
L ...... ...... , -i .. ., ,

Cost Measurement
For any unit which is believed to be more prone to
failure with age, it may be beneficial to replace the old
unit with a new one at some point in time. Under an age
replacement policy, maintenance tasks are scheduled at
intervals. To find the optimal interval requires balancing
cost of replacement (scheduled maintenance) with cost of
failure (unscheduled maintenance).
For any age replacement policy, there is a cost of
replacement (nonfailed item), Co, and cost of in-service
failure, Co+k, where k represents the difference between the
cost of replacement and the cost of failure. Therefore, an
age replacement policy is advantageous when (Co+k) > Co .
Bergman expresses cost, C, as a constant which is
equal to the cost of replacement standardized to units of k
dollars. Thus, if
CO = actual cost of replacement in dollars
Co+k = actual cost of failure in dollars
Then for all positive CO and k,
C = Co/k, the standardized cost of replacement
C+I = C o/k + k/k, the standardized cost of failure
To illustrate, let C = $100, and k = $200, then
Co+k = $300. Since C = Co /k, then C = 100/200 = 0.5 is the
cost of replacement in terms of k dollars. C+l = 1.5 is the
cost of failure.
34

In terms of Bergman's graphical technique, the cost
of replacement, C, is a fixed value.
Total Time on Test-plot: Analysis of Failures
In arriving at an optimum age replacement policy,
the underlying failure distribution, F(T), must be known and
often, when the distribution is unknown, assumptions are made.
Arunkumar (1972) attempted to resolve this problem by estimat-
ing the distribution using ordered failure time data (26:A2-5):
X <X 2 < ... < X1-2- - n
Bergman simplifies Arunkumar's procedure and applies
it to the TTT-plot technique. Given n lifetime observations
(tl,...,tn), which are ordered according to size, the ith
observation, ti, represents the operating life for the ith
unit. Then, total time on test through the ith failure
time is calculated as
iT. = = (n-j+l) (t(j)-t(j- 1 )), i = 1,...,n
j=l
where t (0) = 0. Ti is the total time generated by
the n units before age t i)
The ratio Ti/Tn, i = l,...,n is the scaled total
time on test at age T. denoted by U., i.e., U. = T./T
The TTT-plot is obtained by plotting Ui against i/n. The
result is a function of an empirical cumulative distribution
function, F n(T).
35

The following example illustrates the process for
constructing a TTT-plot. Given that 10 units are observed
to failure, the life times (t ) are scaled as follows:
i t(i Ti Ui
1 10.8 108.0 .33972 18.5 177.3 .55773 27.9 252.5 .79434 30.0 267.2 .84055 31.1 273.8 .86136 35.1 293.8 .92427 40.2 314.2 .98848 40.6 315.4 .99219 41.7 317.6 .9991
10 42.0 317.9 1.0000
A FORTRAN Program (Figure 3-1) will calculatevalues for Ti and Ui reading from the data tape (identified
as Tape 11), and will output results in tabular form
(Table 3-1).
Figure 3-2 shows the TTT-plot for the sample data.
If the failure rate is an increasing function of age (IFR),
the plot is concave. If the failure rate is decreasing, the
plot is convex. If the failure rate is constant, the plot
is a 45-degree slope. Figure 3-3 illustrates the three
possibilities.
Nonparametric Age Replacement
Bergman's method is a mathematical representation of
a stochastic process known as a renewal process (when an
36

.*,--' -**,X
1 :C SEVAT:13.S S3ALL T71
-M-ERV" -ARE FL*
Mz-: Yj:AU
4~ V-' :
Fig. 3-1. Program for Scaling observed Data
37

TABLE 3-1
PROGRAM OUTPUT
OS'EcV TO74; SC4LEDNO. TIE' TINE TImE
1 19.8 108.6 .3372 18.5 177.3 .5=773 27.9 -52.5 .7943
33.0 Z67./ .8455 31.1 273.6 .86436 33.! i 93.8 X9427 40.Z 314.2 .9884
8 49.6 3i7.4 .991!9 41.7 317.6 .9991
to 4Z.,0 317.9 1,113z
END TTTF L-)-
38

1 .0
65-
02/10 4/10 6/i0 8/10
Fig. 3-2. TTT-pIot
39

4- CO
0>
4--I
LA
00
N-
NI 1
00

item is failed or replaced, the cycle starts over again).
When rewards or costs (negative rewards) apply, the renewal
reward theorem (24:53) states:
average long-term cost = expected cost in a cycle
expected cycle length
In order to minimize average long-run cost, the objective
is then,
MIN [expected cost/cycle[expected cycle length]
This can be expressed as follows (9:467) (for T > 0):
MIN C(T) =[T4C+F(T) dt]
f(l-F(t)) dt
Thus, in finding an estimate of the optimal age replacement
interval, a value for T must be found which minimizes cost
C(T). Using the empirical life distribution,
F (t) = (i/n)n
that is, substituting F n(T) for F(T) in Equation (1), then:
C n (T) = [T C+F (T) d (2)
f(l-F (t)) d
Relying on a proof presented by Ingram and Scheaffer (18:216),
Bergman states that to estimate the optimal age replacement
41

interval, it is enough to find the index for t, call it j,
with minimizes
C n(tn)=F C+Fn(ti) 1(3)f(l-Fn (t)) dt
Using the definition of the empirical distribution function
TF n(t) = j/n and the fact that f (1-F n(t))dt =/n(T
j =
then, Equation (3) becomes
Ct C+-j/n (4)Cn(tj) I/n(TT
By manipulation,
C+/ C+j/n C+/ni/(j 1 /n(T n ) (Tji/T n ) 1/n(T n ) (Uj
Thus,
1 ( [+j/n]Cn (tj) = T n
where Tn and Uj, j = l,...,n, are defined under the TTT-plot.
One way to minimize the discrete function C n(t) is
by complete enumeration, but with large numbers of failures,
enumeration is tedious. Bergman's graphical approach seeks
-1to minimize C(T) by maximizing its reciprocal [C(T)]
42
Therefore,
n (j
Since (1/n(Tn)) is a constant determined from the discrete
sample, to maximize l/Cn (tj) is to maximize (Uj/(C+j/n)).
Moreover,
1 is proportional to 1 which isC n ( t ji ) i/n(T n ) (Cn ( t ji ) )
equal to the slope of any line passing through the point
(-c,O) and some point on the TTT-plot (Figure 3-3). Recall
from earlier discussion that C is a calculated, fixed, scaled
value for cost, and that
U"
is proportional to I(C n(tji)) ;+ /
So to maximize (1/C (tj)) is to maximize (Uj/C+j/n) and is ton j
maximize slope [l/(l/n(T)) (C (t.)) ] . More specifically
(refer to Figure 3-4), in order to maximize
U"
U. in the numerator must be made as large as possible (Y-
axis on the graph) and j/n in the denominator must be made
as small as possible (X-axis on the graph). Cost C in the
denominator is a fixed value. By constructing the line
through the point (-c,O) tangent to the TTT-plot, the
reciprocal (C n(tj)] of the objective function is maximized
43

and the objective function C n(tj) is minimized. The value
jo/n is the abscissa of the tangent point and jodenotes the
index of the optimal age replacement interval.
Using earlier cost and TTT-plot examples, a graphical
solution for an optimal replacement interval is in Figure
3-4. For this example, the abscissa of the tangent point
is jo/n = 3/10. Hence, the optimal index, jo, for the
replacement interval is 3. Referring to Table 3-1, the
value of ti (observed time) for the third interval is 27.9
hours. The optimal replacement interval for this example
is 27.9 hours. Again, the preciseness of this estimate
improves with larger samples. It becomes evident that a
finite replacement interval can only be obtained with an
IFR distribution since a tangent drawn to a DFR or exponential
distribution results in an infinite interval. The decision
in the latter two cases would be not to replace.
Sensitivity Analysis
Though Bergman's method is based on calculation of
a fixed cost C, a sensitivity analysis on cost can be per-
formed.
A researcher may consider a range of values for C,
for example, c+e, where c is an estimate of cost and e
represents error within a specified interval. By locating
the points (-c,O), (-(c-e),O), (-(c+e),0) and drawing lines
through these points tangent to the TTT-plot, a range is
44

o1
1 54
00
N
0 . .fI0
43I
45
o
45

constructed about the optimal replacement interval index
(Jl- O ->2 ) shown in Figure 3-5. In this example, jl=Jo=J2.
To illustrate further, for an IFR distribution, if
(-(c+e),0) is close to (0,0), then the optimal index, j,
will be small. This suggests that units should be replaced
more often when the difference between cost of replacement
and cost of failure is large (c is small). The difference
then, must grow smaller as (-(c-e),0) moves away from the
origin. But the effect of cost on changes in the index j
is also dependent upon the shape of the TTT-plot. Figure
3-6 shows that as an IFR distribution becomes more concave,
the optimal index j becomes less sensitive to cost. As an
IFR distribution becomes less concave, the optimal replace-
ment interval becomes more sensitive to cost.
Performing sensitivity analysis with actual data
requires collecting cost data as described in a later sec-
tion for each in-service failure used in this study. The
data will be analyzed using the Statistical Package for the
Social Sciences (SPSS) condescriptive computer routine to
identify the cost estimates from the sample. The objective
of the analysis is to examine the effects of changes in
cost C with regard to the index j for the optimal replace-
ment interval.
The Sample
Selection of a piece of equipment to use was a
difficult choice. The KT-73 Inertial Measurement Unit
46

~1
I- .1-4N~
U-'N >1
4, I'o
r4
\ \ CM'p
47

co!
4J
4.4
484

used on the A-7D aircraft was chosen based on the following
considerations:
Consideration A: In Chapter I, attention was given
to expectations concerning available cost data. This study
requires data for cost of replacement and cost of in-service
failure. Since the cost to remove and replace a KT-73 IMU
from an aircraft would be the same for both failure and non-
failure, this cost is ignored.
The cost of in-service failure must be the sum of
the trouble-shooting costs, the cost of transportation to
and from depot, and the cost of repair. Since the units are
hermetically sealed, repair is made only at the Aerospace
Guidance and Metrology Center (AGMC). Thus, repair costs
can be retrieved from a single source. Trouble-shooting
costs are the costs incurred on the flight line to identify
the IMU as having failed.
The cost of replacement must include the cost to
transport a unit to and from depot and the cost to renew a
nonfailed unit which is removed after a specified interval
of time, presumably before failure. This entails repair or
replacement of subcomponents from the unit which are
approaching failure, thus, restoring the unit to a "good-as-
new" condition (renewal). Costs which could be included
are labor, materials, laboratory testing, setup costs and
opportunity costs.
49

Consideration B: An in-service failure of the
unit must not cause damage to other equipment in the system
since this would create an additional variable cost of
failure.
Consideration C: The unit must not be safety-
critical.
Consideration D: The unit must fail often enough
to provide adequate sample failure data.
Consideration E: The units must be traceable by
some means of identification and field operating times
specified so that failure cycles can be established.
The population of elements for this research study
includes all KT-73 Inertial Measurement Units purchased by
the Air Force and used on the A-7D aircraft. The sample
includes all serial-numbered units beginninq with an alpha
prefix of "AF" ordered by the Air Force as spares prior to
19 April 1978. The purpose in limiting the sample space is
to avoid the complications involving truncation of data.
Truncation occurs when units which are not accounted for are
removed from the sample. This destroys the validity of the
life test.
Cost data for KT-73 in-service failures is available
as a cost to repair through the AGMC Resources Division and
is added to a cost of trouble-shooting and a cost of trans-
portation, which are available through the K051 Maintenance
Data Collection System. The cost to repair will be provided
50

by AGMC as an actual cost to repair based on averages for
each fiscal year. This same cost to repair and cost of
transportation will represent the cost of replacement so
that the difference, k, will be the cost of trouble-shooting.
In-service failure of the unit does not cause damage
to other equipment and the unit is not critical to safe
operation of the aircraft. Failure does occur often enough
to provide adequate data and units can be traced by serial
number, cycle number, and field operating hours. A functional
description of the KT-73 IMU is contained in Appendix A.
While Bergman's method may be used to analyze any
maintenance item where the objective is to minimize cost,
inferences made from this study are applicable only to the
sample space.
Data Collection
Using data collection methods of Crowe and Loman
(11:31-38), actual failure data for the KT-73 units will be
collected from the G078C Maintenance Data Collection System.
Data from the G078C includes an elapsed time
indicator, a cycle number, and an identification serial
number. The elapsed time indicator ensures that the time a
unit is awaiting repair and in supply channels is not added
to the operating time of the units. The identification
serial number is necessary to identify the failure cycles
associated with a particular unit. A failure cycle is
51

defined as the operating time of a unit between renewal and
failure.
Using both the "Aircraft Listing" and the "Field
Operating Hours (FOH) by Cycle-Quarterly" G078C reports,
failure Cycle 1 for each serial number included in the
sample is identified. The field operating hours for each
unit in Cycle 1 is then recorded and the times ordered from
the smallest to largest. This can be accomplished through
a simple FORTRAN program. The failure times are transferred
to a data tape for use in calculating values for the TTT-
plot (Figure 3-1).
According to MIL-STD-785B, Requirements for Military
Programs (for Systems and Equipment/Development and Produc-
tion); MIL-STD-781B, Reliability Tests: Exponential
Distribution; and MIL-STD-756A, Reliability Prediction, the
military services apply the basic assumption that failures
are exponentially distributed; and, in fact, MIL-STD-785B
permits a contractor to assume that equipment failures
follow an exponential distribution whenever the standard is
specified in the contract. The Computer Monitored Inspection
Program uses this assumption (17:30). Herein lies one of
the advantages of using the TTT-plot to analyze failure data.
The TTT-plot method assumes that the life time distribution
is unknown and analysis is based purely on observational
data.
52

Since some units are expected to survive for a long
period of time (calendar years), only old spares buys coded
by "AF" serial numbers for the KT-73 IMU will be collected
from the G078C Data Collection System.
The sample will be limited to those KT-73 IMU spares
ordered by the Air Force prior to 19 April 1978 to ensure
that a record of at least one failure for each unit has been
recorded or that the unit is accounted for. The cutoff date
is a convenient point between procurement packages in which
large quantities of spares were ordered. A unit can be
accounted for as not having been operated (on a supply
shelf), discarded, or lost prior to normal failure (aircraft
attrition). Units which are accounted for can be removed
from the sample without bias. The period of time from
which the data is drawn will depend upon the time the last
unit in the sample fails. Conclusions from this study are
limited to the data window.
Part of the cost of replacement is provided by AGMC
and is the actual average cost to repair a unit for each
fiscal year. Transportation costs are added to the cost to
repair to arrive at the total cost of replacement, C0 . The
cost to repair is obtained from data collected by the
Resources Division (MAW) at AGMC in terms of dollar amount
and is presented as an average actual cost to repair by
fiscal year. Transportation costs are provided by the K051
datasystem at Headquarters AFLC. Data is extracted by the
53

Mission-Design-Series (MDS) of A-7D and by Work Unit Code
(WUC) 73FAO for the KT-73 IMU. Under the WUC, a transporta-
tion cost in terms of dollar amount is recorded.
The cost of in-service failure, C +k, will consist
of three parts: (1) the cost to repair, (2) the cost of
transportation to and from depot, and (3) trouble-shooting
cost. The preceding paragraph described how values for C0
(cost to repair plus cost of transportation) are found. The
remaining element, trouble-shooting cost, is provided by the
K051 data system under the same MDS, WUC and format as
transportation cost. However, trouble-shooting costs are
listed as quarterly totals under a separate column labeled
"field maintenance" (base labor).
These three costs (repair, transportation, trouble-
shooting) cannot be directly matched to the serial-numbered
units in the sample, but they are presented as annual averages
(for repair), and quarterly totals (for transportation and
trouble-shooting), the latter of which can be summed over
each fiscal year and averaged using the number of units
repaired for each fiscal year, as provided by AGMC. This
limitation was discussed in Chapter I.
To arrive at values for k, the difference between
the cost of replacement and the cost of failure, CO is sub-
tracted from Co+k for each fiscal year. The value of "k"
in this study is the cost to trouble-shoot. Dividing each
C0 by each k, then, provides a range of cost values,
54

standardized to units of k dollars, which can be used to
calculate an expected value for cost, C. The necessary
calculations can be accomplished by a simple FORTRAN program.
The validity of the TTT-plot and graphical solution
are dependent on the accuracy of the data collected from
the G078C and K051 files. Limitations in this area were
addressed in Chapter I. Additionally, a consistent mainte-
nance policy must be assumed and care will be taken to ensure
that either none or all of the KT-73 units included in the
sample have undergone modification.
Answering the Research Question
Before proceeding to the actual experiment, the
research question should be readdressed within the context
of the methodology.
The Research Question asks if Bergman's method can
be applied in determining an optimal maintenance task
interval based on the objective of minimizing total long-
run average cost per unit time using actual field data. An
optimal maintenance interval can be determined for the item
used in this study by collecting data, as discussed in the
previous section, for the cost of replacement and cost of
failure, and by collecting failure data for the item. Based
on the cost data, a value for C can be calculated and plotted.
The observed failures collected from the G078C can be scaled
and a TTT-plot constructed. Using Bergman's graphical
technique, a tangent can be drawn from the point (-c,O) to
55
the failure curve, and the index of the optimal replacement
interval can be located at the abscissa (jo/n). If the
following specific criteria are met, the research question
can be answered in the affirmative.
Must know:
1. Cost of replacement
2. Cost of failure
3. Time from renewal to failure (cycle) for all
units in the sample
Must have:
A large sample of life times (greater than 30),
since the estimate of the optimal interval improves with
larger samples.
Must be able to:
1. Standardize cost of replacement and cost of
failure to "k" units of dollars
2. Scale observed life times to Bergman's
TTT-plot
3. Construct a graph of the scaled empirical
life distribution
4. Construct a tangent to the failure curve
with the greatest slope passing through the point plotted
for replacement cost
5. Identify the index for the optimal interval
using Bergman's graphical technique
56

If the research question can be answered in the
affirmative, there are two secondary questions. Secondary
Question "a" asks if the calculated interval for the units
tested compares with the existing interval for the item.
Since the KT-73 IMU has never had a maintenance interval
assigned to it, its current interval is infinite. This
study would recommend an infinite interval (fly-to-failure)
if the empirical life distribution constructed on the TTT-
plot from actual failure data is a 45-degree line (exponen-
tial) or convex (DFR). Figure 3-3 illustrates these possi-
bilities. If the following required knowledge and procedures
can be satisfied, secondary question "a" can be evaluated.
1. Know the current interval
2. Identify the distribution of observed failure
data
3. Identify the index for the optimal interval
using Bergman's graphical technique
4. Compare the current and calculated optimal
intervals
5. Explain or reconcile differences, if any, between
the current and calculated optimal intervals
Secondary Question "b" asks how sensitive the
calculated optimal interval is to the uncertainty of cost.
Based on individual cost data collected, a range of values
for "C" can be calculated and analyzed using the Statistical
Package for the Social Sciences (SPSS) Condescriptive
57

computer program to identify the mean and standard deviation
for C. Using values for C of plus and minus a given standard
deviation from the mean, new tangents can be drawn to the
failure curve and observations can be made concerning the
effects of changes in C on the optimal replacement interval
index. If the following required procedures can be satis-
fied, secondary question "b" can be evaluated.
1. Identify the mean and standard deviation of
standardized cost values
2. Designate values for "C" above and below the
mean, based on the mean and standard deviation
3. Identify the index for the optimal interval
using Bergman's graphical technique for new values of "C,"
based on the standard deviation
4. Draw conclusions about the sensitivity of the
optimal interval to uncertainty in cost
58

CHAPTER IV
APPLICATION AND ANALYSIS
Demonstrating Bergman's graphical method to deter-
mine an optimal maintenance task interval for an item in
Air Force inventory requires application of the methodology
described in Chapter III.
The Failure Data
Failure data for all KT-73 Inertial Measurement
Units were collected for all units with serial numbers coded
with an alpha prefix of "AF" ordered prior to 19 April 1978.
This includes data on units coded AFORSSG, AFOTST1 and
AF00001 through AF00094 for the first failure cycle (acqui-
sition to first failure). The data was retrieved by cross-
referenc ..g both the "Aircraft Listing" and the "Field
Operating Hours (FOH) by Cycle-Quarterly" reports from the
G078C Data Collection System. Excerpts containing data from
these reports are contained in Appendix B. Table 4-1 lists
the units in the sample by serial number and corresponding
times to failure for Cycle 1. The times to failure are
listed in G078C reports under Cycle 1 of each serial number
and denoted by "ETI IN," the elapsed time indicator reading
(actual operating hours) upon arrival at AGMC. There are
59

TABLE 4-1
TIMES TO FAILURE BY SERIAL NUMBER
AFPRSSG 0855 AF00044 0285AFOTST1 1111 AF00045 0426AF00001 0099 AF00046 0490AF00002 0229 AF00047 0180AF00003 0615 AF00048 0211AF00004 0127 AF00049 0161AF00005 0121 AF00050 2764AF00006 0853 AF00051 0434AF00007 0349 AF00052 0150AF00008 0487 AF00053 0109AF00009 0558 AF00054 1001AF00010 0852 AF00055 3007AF00011 0260 AF00056 0183AF00012 0181 AF00057 0217AF00013 Attrited AF00058 0701AF00014 0932 AF00059 0240AF00015 1837 AF00060 0164AF00016 0182 AF00061 0101AF00017 0508 AF00062 0565AF00018 0107 AF00063 0120AF00019 Attrited AF00064 0222AF00020 0498 AF00065 0122AF00021 0492 AF00066 0299AF00022 1081 AF00067 0212AF00023 1408 AF00068 0377AF00024 1099 AF00069 AttritedAF00025 0828 AF00070 AttritedAF00026 0164 AF00071 0129AF00027 0388 AF00072 AttritedAF00028 0414 AF00073 0645AF00029 0417 AF00074 0122AF00030 0103 AF00075 0764AF00031 4126 AF00076 Attrited
AF00032 0334 AF00077 0292AF00033 0109 AF00078 0365AF00034 0153 AF00079 0454AF00035 0163 AF00080 0897AF00036 0093 AF00081 2132AF00037 0483 AF00082 0347AF00038 0414 AF00083 1081AF00039 0451 AF00084 0873AF00040 0095 AF00085 0220AF00041 2045 AF00086 AttritedAF00042 0254 AF00087 0332AF00043 0141 AF00088 0163
60

TABLE 4-1 -Continued
AF00089 0814 AF00092 0154AF00090 0436 AF00093 1765AF00091 0121 AF00094 1560
eighty-nine units in the sample and times to failure were
recorded on a raw data file called "TAPE 11" (Figure 4-1).
During collection of the failure data, it was noted
that seven serial numbers could not be located: AF00013,
AF00019, AF00069, AF00070, AF00072, AF00076 and AF00086.
According to information received from AGMC, the KT-73 IMU
Item Manager and Singer-Kearfott (manufacturer) any units
that are lost to the system, that is, lost, stolen or demol-
ished in an aircraft accident, are no longer tracked and
the serial numbers are dropped from the rolls (2;10;16).
Since the units contained in the sample used for this study
are among the oldest spares buys made by the Air Force
(circa 1970), the seven units for which serial numbers are
missing are said to have attrited (2;10;16). A zero con-
demnation rate for the KT-73 IMU makes this the only
reasonable conclusion. Hence, the seven units were removed
from the sample without bias.
Total Time on Test-plot
Once the raw data was recorded on TAPE 11, it was
necessary to order the failure times from smallest to
largest. This was accomplished using the simple FORTRAN
61

130=983! 4;Jm41Z6 70021teJ:UU J43S34 71:461
439=0153 744 I
119=6127 4'19?7!3=6299
170:9!3 V11:9414 779:6177
1964V7 430:0094. 79:1I6432304,4156 !v(o:z345 M20122ZIO:B852 51;=073 ?10:3764
&UZZOZ-60 5U4141 K73=0212
2904:@48 59@:Z7676M-44 ^M~:Z3
3140108' 610421910433Z^26=14;8 6OZO? 92:16-3330Z1399 63U^003-'9VZ 640--1,17
'2v0=041; 7! 970=1763
Fig. 4-1. TAPE 11: Raw Failure Data
62
program shown in Figure 4-2. The output, TAPE 12, from the
program contains eighty-nine ordered failure times (Figure 4-3).
Having ordered the observed life time, t(i), the
times were scaled to the total time on test, Ti, denoted by
Ui. This was accomplished by inputting TAPE 12 to the
FORTRAN program illustrated in Figure 4-4. The output of
the program is shown in Table 4-2 which contains the observa-
tion number (i; the observed life times (tiM ); the total
time on test (Ti); and the scaled total time on test (U.).
The program also outputs a data file, TAPE 13 (Figure 4-5),
containing all of the calculated U i's.
Using Table 4-2, a Total Time on Test-plot was con-
structed for the eighty-nine observations in the sample. As
in the example of Chapter III, Figure 4-6 illustrates the
TTT-plot for the KT-73 IMUs used in this study.
An examination of the empirical life distribution
shown on the TTT-plot for the eighty-nine observations
indicates a failure curve which is slightly DFR (decreasing
failure rate). Since the curve represents a plot of observed
data, it is not smooth, but it would become smoother with
larger samples. Most notable is the immediate leap from 0
to .16 which represents the smallest observed time to failure,
93 hours. Superimposed over the TTT-plot is an assumed
theoretical exponential failure curve. The theoretical
distribution is derived from consistently large historical
sampling and is a perfectly smooth 45-degree slope.
63

[* 4.9--
i1~71
";z r ATA AT
10r 40I1~
ll dl
Z~: Do 29 4:1,89
r
=-v-= .,II~iUE
269Z 0o 36 1:I189170= IN(K).R.T!ME[)I TNEW
Z~ ~ C v! o 10 A-a: END IF219=30 U14TINUE49 UNIT INUT
ran -0&:4 0 C .r KINU ENwn: 00 5Z 1:399
2'9,050 CON~TINUE
L!O RETURN
-a=6 END
Fig. 4-2. Program to Order Failure Data
64

11=: 13.0 460= Z17.0 710: 55.
117= 55.0 419: 222. 710= S55.9IZ0: z M 4zoz ZZZ.1 7M: 5625.9130: 101.0 4?: 9 *4^9 713 615.0
249: I9 FS: .40.0 749: 971 .9
159= 107.0 4 5: 4. 750: 701.0
160: 109.0 I : U07.3 76i% 76.170: 10M. 470: Z,5. 770: E14.0
18: 109.0 £8: Z3Z.0 710: 7 6 2.
199: 121.0 490: Z99. 790z 852.0Zoo: 121.8 600: 3.12. 9it 953.0
210Z 122.9 510: 3134.0 810: 0155.0220: I12. 5,43z 347. 8 87.
30: 12.0 659: 87,413: 349. 7.z4o: 129.0 U4P 1165.0 $402 9312.0
256: I 41I. 0 556z 3^77.0 850t 1;01.0260: 150.0, 49ja: N0.9089 ~8276= 153.0 5718: 414.0 S76tIE:.280: 1I4. So9: 4 14.9 19 Vog 19.6
299: 16.0 -9: 4 7.3 Set 111.93Hit 163.0 6902: .0 9;8= 1408.0311: 16S.0 619: 43'.0 910: 156M.329: 164.9 6zg: 436.0 9M: 1763.0330: 164.9 629 a '51.0 936= 1837.0
349: 182.0 640: 4254.9 94z: 20434.9
M5: 1311 6,40Z 403.0 935 :132.0
360: 162.6 66j0: 487.0 963: Z764.9370: 183.1 670: 40.6 970z U597.0Sf: 211.0 63: 492.1 ~:42.
3902 212.9 6702 496.0
Fig. 4-3. TAPE 12: Ordered Failure Data
65
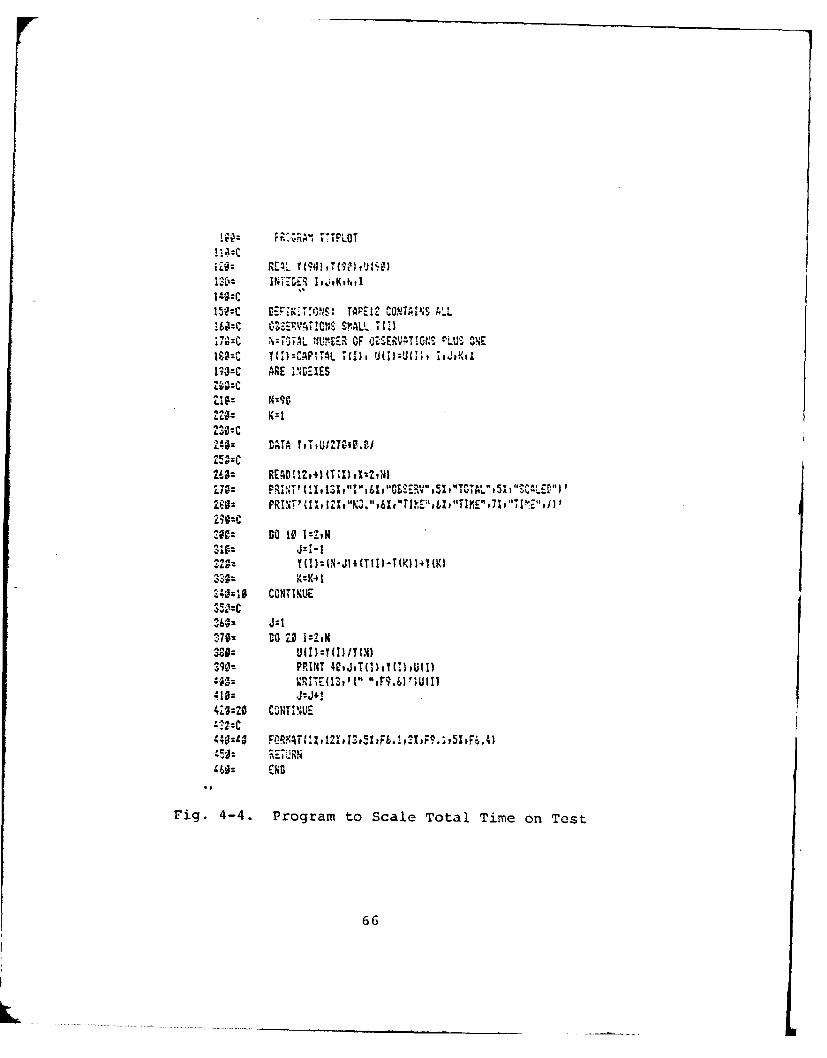
WzfC C, T 0 K S LLE CTi ISL
17~:C~ 43T l ?U1EER OF f' SER0 .1 6 C'UNE
1^73=C ASE I!JLZXES
LZ0 RECDC,'p4)(T(XA ,X:2,N)1,19: PR&Nl I5 "ZCAL5EEV')
S DO 10 1=1111
Z41%4
7.4019 COMNUE
260"M J:1
UIT.) ZY(1) /Y (41)
490:- PUN11T 42vJvTT(1h~U(I)
,102:=+4LIZZ6 C3014 14UE
Fig. 4-4. Program to Scale Total Time on Test
66

TABLE 4-2
SCALED TIMES TO FAILURE
z. TINE TIN T~46 37..3 Z:-,7;. 7 Z
1 93.; 8 a77.9 .1579 47 ...... 255L6 . ,173
s 9o. 79130 .1712 53 7. J 267!,3.0 .51;46 713.0 9:79, ,1EO3 G , 27413,i .Z2.5
9 iz . 0 5 -36.0 l .J L ?O .
19 12.0 1 ;6.9 . 19 57 7 ZiZ, .5I3P1 12 1 .0 I3/6. .Zt93 v .7. j z513. .5 54
U z:o ~i;60 22557~5*3 z .1 .$512 121.@ 1069.,9 .2539 &6 7I ..
I .2 4 .ZZ . W 6 5 4 Z 1 2 3 53 .1 .5 6
izi.3 i,1974.0. I. 11 60 81.5 4.. . l
129.8 1a t 1 .0 .Z111 1 13 2,. : 9 0. .5"1SIN7, 3 2 . .59
18 1239 1285.9 .32 777 .... z67., ,7
19^ 194.0 1397.9. .339& 75 649. 3317; .6394
~3 161.0 13546.0 ,33t 66 7161.0 3!.TU,3 .741 163.0 1364., .It. 87 74; ,3 334.9 ,
1 4 4 3 0.7136
136 54.. ... 4 ,11'.071
2 3 14S4.0 17. A z b3 69 0&3. 0 377;4J3 .719Z
.... " ,7 8
S 16-4.0 13751.3 79 952.9 80 79.. 80. a 1-7q!.V' 4L 7'f 853. 3.32. .7Z87
20 16.91.0 8550", . 72 493.043z3- ,0 .,29,27 182.0 1491.0 ZS4 ~ 73 87.3.9 j29 7529 :4.0 14980.5 .283 74 WA : 5~. .74Z6Z? 211.0 '68.1.13*5 9.32.i N4'45. .74Z6.5 -1.16480 *i 6 1313 ~ 0.7f1
31 17.9 1720.0 .1151 77 1081.0 111. .90372 12. L717.0 .2228; 7 5 to-i ~ ~ J 70
-3 9J. 177231.3 .33 9 13. 15. .7i&722.8 17230 331so ~111.3 :7. .76
~ 243.9 332.0 3969! 41~. 4445IJ1. e-79.~6 £943 18843 62 1i.3 ;5W67. j .01I
2630 i629 .26- 151 176.- ~ 29 8
677
.... 0 0 .4 3- z n a Z .7 5 3
^; 32.0 32. ~P 7;1.3 Z3 ~ 916J .6
-'~~~~': J* ~ ~ ~ ... 8 3;7. Z 314j2_.0 9% 7.1 Z;7. J 7:7 9 1.3 5* .9IO
67
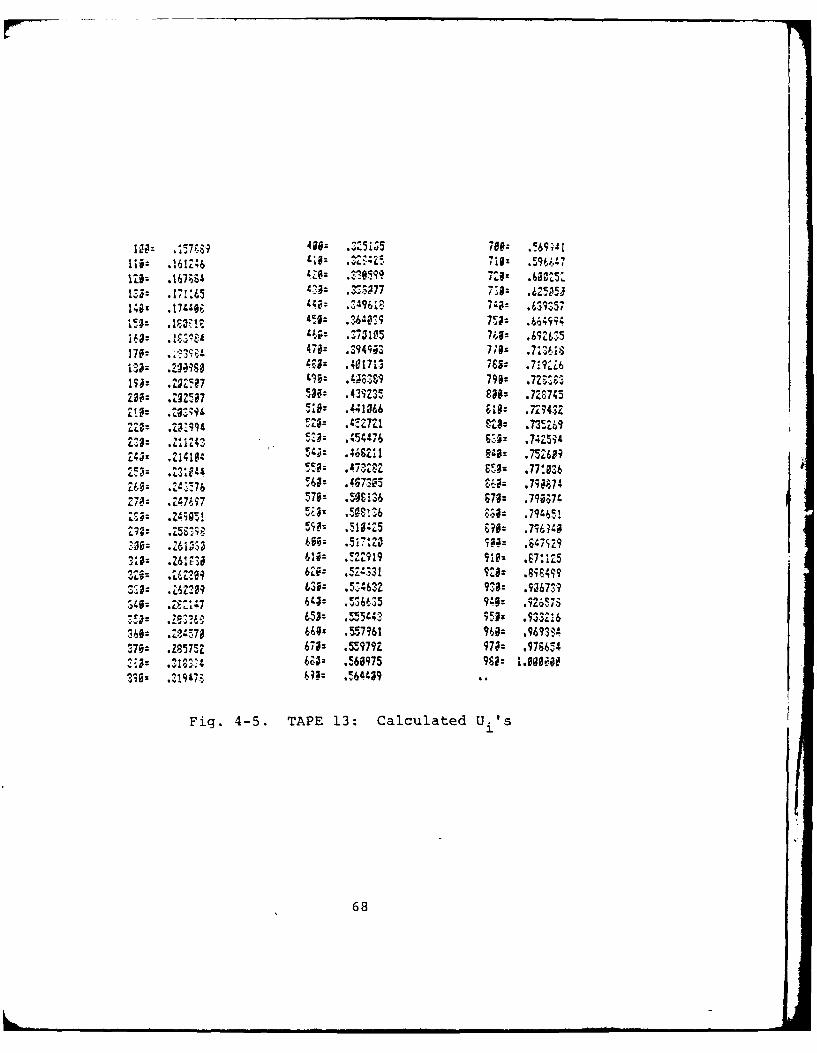
1: 7 P7.3 400= .3Z5 5 786: .!69;4jI1= .161246 L1@= .3Z;:5 719: ,596.7
1:Z .167T64 4Z6: ,".z9 7"1: .6M52j 3: ,17 IT5 . = '3;77 738= .42505J
14Z: .17116; 43: .346%1 71;z .39357
163= As 'M4 4&8z S7319'5 70: .69 IZb '170: ., 47: .3949;3 74s .71:1618
.4: .401713 768: .719Z6
Z2Z' 4197= OS3V 79@z .72r3S
Z39: .I307 '539: .43735 E9: .72^743
ZIZ ,Zol.;O !Js .4i41066 &@= rL947,2
Z93: Lzizqq) 618 IM5Z719 L.Zi . 735Z69
'53,;!g 2: ,4'j4L71 58:= ,*74g5
Z3: .Z 11943 .? = .45Z 69: .74Z634
Ni: f'147 543= .36921 ?40: .726079
Z69: .Z4 -76 54: -38 4z .7i674-470: *Z-7WI )Iiz *5VIU36 678z .799;74
Z3;: .-9TqI 54i .53ZR 13.: .96r!3
613: 730 61M .52919 90: ,E71125ZM09 64-5. TAP 1 33 92al t U '9
9j: 62Z9 3i= *5 6 ') 91'a .9167V346= ^*,-*7 64z .536t35 9-'0 .926!75
? 4: j 653: '5"544? ;50: 533ZI6160: Z8:1170 4z .557M6 960: ,969ISI
'370z .Z8575Z 473: .5!979Z 97;z .976644,;3Z 4 1819,: 643: .!60975 990Z 1.090110 1 i9 A7 64;= .!6'4419
Fig. 4-5. TAPE 13: Calculated U .'s
68

re
_7
-7.'- 4 7:=l -
.......... .. . . - -
o :77Z: % LV
F7i IF 4-6 Tota T.m on.est plo
7:j69

According to MIL-STD-756A and engineers at AGMC, a complex
electronic component, such as the KT-73 IMU, when in steady
state operation, is assumed to exhibit exponential failure
characteristics (the flat portion of a typical bathtub
curve).
Visually examining the two distributions, the
difference in their shapes does not appear dramatic. While
the assumed distribution exhibits a constant failure rate,
the empirical distribution exhibits a slightly decreasing
failure rate. The statistical significance of the difference
was not analyzed. With Bergman's method, the empirical
distribution can be visually recognized as a DFR, exponential
or IFR (9:468).
Cost Data
To find the optimal replacement interval, requires
balancing the cost of replacement (scheduled maintenance),
C0 , with the cost of failure (unscheduled maintenance),
C0 +k, where k represents the difference between cost of
replacement and cost of failure.
The collection of cost data was influenced by the
formats used by the data collection systems which contained
the needed information. As explained in Chapters I and III,
the cost of replacement includes the cost to repair and the
uost of transporting units to and from depot. The cost of
failure includes these costs plus the additional cost of
trouble-shooting. Cost data was collected for the period
70

from FY 72 through FY 81 to generally coincide with the time
period during which failures occurred for units in the
sample. However, since the cost data collected for this
period was in aggregated form, they represent the expected
costs for the entire population of KT-73 IMUs repaired and
processed through the system.
The cost to repair a unit at depot was provided by
the AGMC Resources Division and represents an actual cost
to repair based on averages for each fiscal year beginning
with FY 81 and going back to FY 72. Table 4-3 contains
average repair cost by fiscal year and total number of
units repaired for each time period. It should be noted
that AGMC provided separate averages for FY 76 (ending
30 June 1976) and for the transition quarter 76T (ending
30 September 1976). A single average for FY 76 was derived
by multiplying the average cost per unit for FY 76 times
four and adding the average cost per unit for 76T, then
dividing by five.
TABLE 4-3
AVERAGE COST TO REPAIR KT-73 IMU
Period Average Cost/ Total UnitsUnit Repaired
FY 81 $4350 312FY 80 4053 358FY 79 3378 358FY 78 4104 335FY 77 2873 360
71

TABLE 4-3-Continued
Period Average Cost/ Total UnitsUnit Repaired
FY 76 $4138 489FY 75 3126 447FY 74 2967 502FY 73 4005 344FY 72 3203 73
Transportation costs were extracted from the K051
Maintenance Data Collection System as quarterly totals under
"packing-shipping cost" for WUC 73FAO. The listing was
found under the Logistic Support Cost Breakdown for the
A7-D Aircraft. Copies of the microfiche files containing
the data are contained in Appendix C. Cost data was only
available as far back as the fourth quarter of FY 72, and
not all of the information was available at Headquarters
AFLC. Data for the second quarter of FY 79 was retrieved by
telephone from the Sacramento Air Logistics Center. Table
4-4 contains the quarterly transportation cost totals for
each quarter beginning with the fourth quarter of FY 81
and going back to include the fourth quarter of FY 72.
Annual averages were then computed by summing the four
quarterly totals in each fiscal year and dividing by the
number of known units repaired by AGMC (Table 4-3) in the
same year. For FY 76, an annual average was derived by
summing the four quarterly totals for FY 76 and the quarterly
total for 76T, then dividing by the number of units repaired
72

in FY 76 (which includes 76T). The average transportation
cost per unit for FY 72 was derived by counting the number
of units repaired by AGMC between the 183 and 274 days
(fourth quarter) of FY 72 using the G078C reports and
dividing that number into the fourth quarter total for FY 72.
TABLE 4-4
TROUBLE-SHOOTING AND TRANSPORTATION COSTSQUARTERLY TOTALS
Period Trouble-shooting Transportation
4 FY 81 $108367 $28413 FY 81 91920 15272 FY 81 95520 19511 FY 81 105206 20714 FY 80 124926 28683 FY 80 132477 31342 FY 80 85000 45311 FY 80 65264 28224 FY 79 97117 51293 FY 79 69190 35052 FY 79 71969 29921 FY 79 94732 39324 FY 78 98908 53863 FY 78 72248 38962 FY 78 69022 29611 FY 78 63424 25464 FY 77 69613 35433 FY 77 66644 37692 FY 77 66932 23841 FY 77 64854 3154
FY 76T 88377 43134 FY 76 78458 54073 FY 76 75966 28772 FY 76 57687 29701 FY 76 75126 39424 FY 75 79169 39263 FY 75 89018 57002 FY 75 58926 34761 FY 75 76344 36694 FY 74 55584 38983 FY 74 43003 27112 FY 74 40731 2659
73

TABLE 4-4-Continued
Period Trouble-shooting Transportation
1 FY 74 $ 44290 $31734 FY 73 51740 34243 FY 73 47143 19302 FY 73 39361 17501 FY 73 41243 22494 FY 72 34127 814
Once annual averages were collected for the cost to
repair and computed for the cost of transportation, these
two costs were added for each corresponding fiscal year to
produce annual averages for the cost of replacement, CO ,
for FY 72 through FY 81.
The cost of failure includes the cost of replacement,
C0 , plus an additional cost, k. For this study, the addi-
tional cost or difference, k, was defined as the cost to
trouble-shoot a unit failure. Trouble-shooting costs, like
transportation costs, were collected from the Logistic
Support Cost Breakdown of the K051 MDC System (Appendix C).
The quarterly totals are listed under "field maintenance
cost" for WUC 73FAO. Annual average trouble-shooting costs
per unit failure were derived in the same way that trans-
portation costs were computed. Table 4-4 contains the
quarterly trouble-shooting cost totals for the same time
period that transportation costs were collected.
In order to fa'.ilitate Bergman's graphical method,
the cost of replacement, C0 , must be standardized to units
74

of k dollars. Bergman refers to this standardized value as
"C." To find C, the cost of replacement, C0 , which includes
the cost of repair and the cost of transportation, must be
divided by the additional cost of failure, k. In this study,
a value for C was calculated for each fiscal year from FY 72
through FY 81.
The entire range of calculations necessary to arrive
at values for C for each fiscal year were accomplished using
a FORTRAN program (Figure 4-7). The program calculates
annual values for C0 , k and C. Data input included TAPE 20
and TAPE 21 which contained values transcribed from Tables
4-3 and 4-4, respectively (Figures 4-8 and 4-9). The output
TAPE 22, displays ten values for C, one for each fiscal year
(Figure 4-10).
Since Bergman requires a single fixed value for C,
which represents an average long-term cost of replacement, a
mean value for C based on the sample was required. Values
for both the mean and standard deviation were found by sub-
jecting TAPE 22 to the SPSS Condescriptive computer program.
The program and results are contained in Figure 4-11.
Graphical Solution
Using the mean value of 5.206 for C, the point (-c,o) was
located and a tangent drawn to the failure curve. Figure
4-12 indicates that the tangent point is at the upper right
most portion of the failure curve. The abscissa of the
75
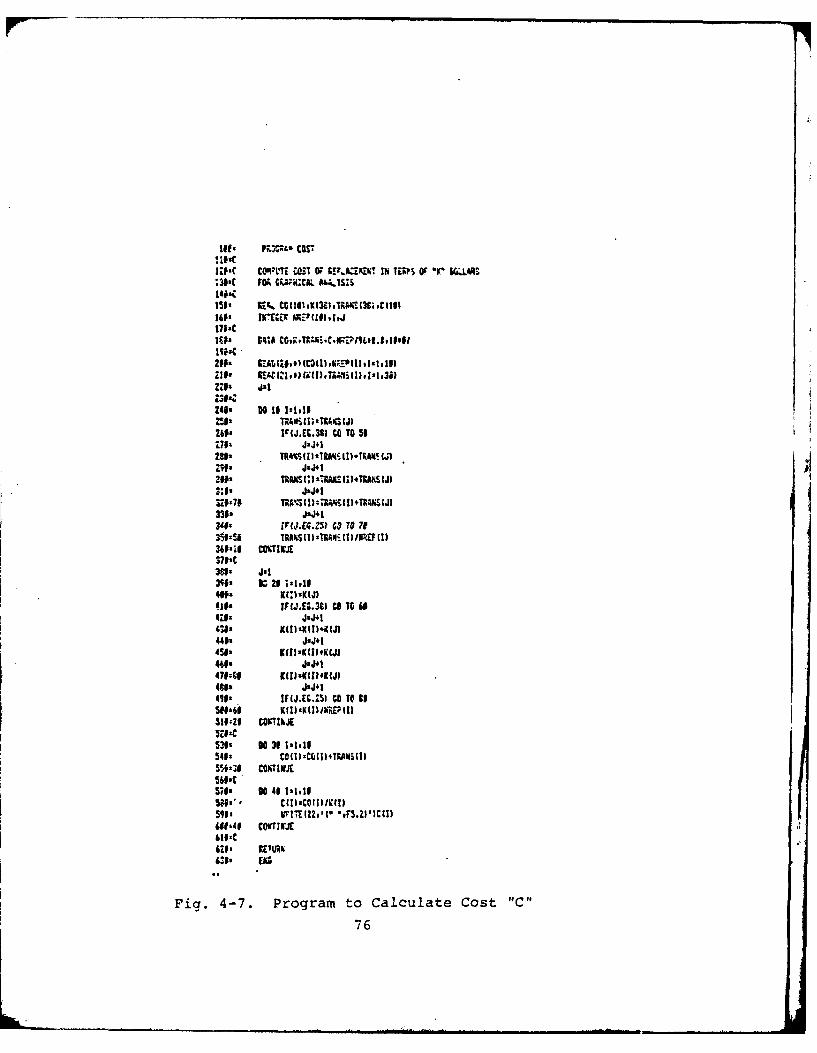
lots rv::~ CGS7
UK9' CQ'I"'T UST 0; RVI.aME41~ IN TEPS OF *F' WL#M
1512 W24. CGI1%sKI3~vITfA(3CX.CIIl1UP EC6IM'09,,Mats
Z3' 10 191:,
24#' IV(J.EC.3S, CA To 511761 J'j+1less TR8KI12'TRA%,I1).TRA4iIj)
"Its TRANS G)' 3Art: II TANSIJI3:02 J'JI32#41, TRV(l)-R NSA'i(+R4JI
351415 TRAUS11)TRANS (1)IEF (1)360-1S M11T1WJE370-C361a J21V69' 11 20 ;$loll41t' 11)'1K(JI008: JFUM..39) to To 6
418' KII)'KII+XJI
4511a K(U:sK(11J#K
493' IF(J.EG.251 CC TO It5ef96i MI)sKU)/hEP III
541: CO M-CO7TUMM
56176

Cost No. FY
iB024M3 31Z 81i1:4253 358 801Z 23378 358 7913:4tV 335 78140:2873 363 7715 ^4I8 489 76168:3-Z6 47 75171:Z7 532 74j$Z-:0KI; 344 73190-3293 73 72
Fig. 4-8. TAPE 20: Average Cost to Repairand Total Number of Units Repaired
7 7

Trouble-shooting Trans FY
10a=W 7 2.S781
lz§=7550 1951
I9:i215ZO6 Z171149ZIZ4926 286158=13Z47"r 31S 8016:82= 4531179=65264 Z221.Sf=97U17 5129
150=69199 356526671969 Z99*2zloz9L7:3Z 392K223=98909 5386239:72248 :3S96
240:69-Z2 2961 785043424 Z546_ _2&64T13 " ;
27146644 3769W60 693Z Z734290: 85, 3104300=61377 4313 76T319=78458320=75966 2877
346711Z6 291235079169 39,6266=491 57M370=526 37 75
339:73M 44 36693592~5784 38954W4303 271141047SI 26119 7420z;4290 IM343574 344:4714t3 1%0450=:3$16 17T 7
:79:Z&127 814 72
Fig. 4-9. TAPE 21: Costs-of Trouble-shooting and Transportation
78

Cost "C" FY
!: 3.41 81i1;: 3.51 80IZI- 3.68 79130z 4.58 -78141= 3.91 77IS=5.44,. 76Ma 4.*0 75170: 8.16 74180z 7.73 73190C 6.$G 72
Fig. 4-10. TAPE 22: Standardized Cost of Replacement "C"
79

,: I-. in
IVi
I.I
I I
JX I, Cl 4.
I h"
ILII
.-.
- ,o . . 0
I. 0
- - " .:. .--., C)
ILI m'I
-. . aQt
--' a: ,. ,' , -
(.' W . CA, JS. l.Ij : . I-1~' 7r C I
T 7' 7- r -i-'J ... _. .a 7 ., r.
Z ITI I '..:. I
800
I.A. , . I-- '
r..f(. l.. I- a . -.x
/-> ~ - r. .4
f.4 -- " / 0-. IA
. .,-. a,.,.--
• -" "/, % .,i- .', .
I~.,UJI.. I IL:J',I' - ). .-- 80..

T71ti TIT7,
I 117T7I
7! 1 7_
-7i ... ... .r~ jI.i 17..'. ... ........ ...
:77':I T ii i2 7___-r I __
.zjjT :1-±1I lIr T -
4'T T.4.
TT ' 1 ]H A.
... J .. .. I _ _ _ _ _I ____________________7 7-__________
__7__7_7t- ____ii7.
i _____A.::
.. .. ... 1
AO7...Q3 025 A S5TUDY TO DEMONSTR ATEUTHEIAPPLICATION OF A GRAPHICAL 2/METHOD 0 OETERM IkE. IU AIR FORCE INST OF TECH
WRI GHT-PATTERSDN AFB OH SCHOO LOF 555T.NCLSSIIED D C E IH ET AL SEP 82 AFI- SR-60-82 F/ 5/ 5 L
EhohhhmhhEmhEE
somhhmhmml

111.0 L* 28 2 5
L
MCLU
1.5111111 4 1111116
MICROCOPY RESOLUTION TEST CHART

4~ .L+ _ 71- 7
7 7 rr 7. 71
-'! - - 7 - 1- - f
7 -3 vij
-7 i F
-I: ~ ~ ~ ... .................
ij i. 77+:::: -'~ i-
7fF ij 4.)' * --ird t7VKI I7FIFII

tangent point is the value 89/89 or 1 and denotes the
index of the optimal replacement interval, j 0 In this
case, the estimate of the optimal replacement interval was
interpreted to be infinite. As explained in Chapter III,
this conclusion could have been reached without having per-
formed the graphical solution since, by definition, exponen-
tial and DFR curves yield infinite replacement intervals.
The current interval and the optimal interval found
using Bergman's method are the same. They are both infinite,
and the optimal maintenance policy for the KT-73 IMUs in the
sample is to operate until failure.
Sensitivity Analysis
In Chapters I and III, a large portion of discussion
was devoted to limitations regarding cost measurement and
cost uncertainty. Cost estimation results in a degree of
uncertainty, and Bergman's graphical m-thod can be used to
perform sensitivity analysis with respect to cost.
By constructing a range of values for cost, C, about
the mean, new lines tangent to the failure curve can be
drawn through these points and observations can be made to
identify changes, if any, in the optimal replacement interval
index, j0. In the last section, the mean value of 5.206 was
used for C in finding the estimate of the optimal replace-
ment index. The results of this study indicate that the
replacement interval for the KT-73 IMU is infinite. Knowing
this, it can be concluded at this point that the replacement
83

interval is totally insensitive to changes in cost, C.
However, for the purpose of demonstrating the method, a
sensitivity analysis was performed.
The degree of uncertainty of cost for this study is
unknown, and the variability of cost in the sample may not
reflect the true variability of the population of costs
associated with the KT-73 IMU. The size of the sample of
cost values (ten cases) preclude efficient analysis of the
distribution of costs calculated in this study. Employing
a rule from Chebyshev's theorem that applies to any sample
of measurements, regardless of the shape of the frequency
distribution, at least 75 percent of the observations are
expected to fall within two standard deviations of the
mean (13:149). Figure 4-11 shows the calculated standard
deviation for the sample to be 1.783. Since the mean is
5.206, the two standard deviations from the mean are
calculated as
+ S = (3.42, 6.99) X + 2S = (1.64, 8.77)
These values (except 8.77) were plotted on the graph
in Figure 4-13 and new lines drawn tangent to the failure
curve. In the interest of conserving space, the point
(-8.77,0), which represents two standard deviations above
the mean, was not plotted. Also, since the point represent-
ing one standard deviation above the mean resulted in an
84

fT. .. 1 7 1
±~~~z~14$_ t1 7-....... ....
..... .
I- L
I~~. ..... ...17 jT -\r
857
1-4:!ITi7 HT jVVV.***.* !In7
1177 7T.71
7-I
1 --A4 7~i
::"I7 .7'I hI 1 1jTL'7-1421IF 7t1--2
77 1j. . 4fT 10 ..j .~~. ... i.... 1.~~~t . .... .
I IH~ I77r
.... .. ... t 'lu~l t lt' ~A
1.1 1-i*TT'-*TON... ......f....T ..... .. ........
7n I 7 -7:
.... I .. .. .. . ..j: . ,7 -
J-i-
86

infinite solution, it is known that any point beyond one
standard deviation would produce an identical result given
the failure curve for the units.
For this study, in each case in whLch a new line
was drawn tangent to the failure curve from a new value for
C, the solution was the same. In each case, the estimate
of the optimal replacement interval was infinite resulting
in a recommendation to operate the KT-73 IMU until failure.
Hence, the optimal replacement interval is totally insensi-
tive to changes in cost, C. Furthermore, it should be noted
that all ten values for C contained in the sample fall within
two standard deviations of the mean. This observation pro-
vides a "feel," as Bergman states it, for the confidence in
the estimate of the optimal replacement interval.
Summary
The application and analysis of Bergman's method is
summarized in light of the research question and the two
secondary questions. In Chapter III, a set of criteria was
established so that the degree to which the research answers
these questions can be evaluated.
The research question asks if Bergman's method can
be applied in determining an optimal maintenance task
interval based on the objective of minimizing total long-run
average cost per unit of time using actual field data. To
answer the question, the cost of replacement, the cost of
87

failure and the time from renewal to failure (cycle) for all
units in the sample, must first be known.
The cost of replacement, CO , was defined as the sum
of the cost to repair a unit at AGMC and the cost to trans-
port a unit to and from the depot. Data was gathered from
the AGMC Resources Division and the K051 MDC for the KT-73
IMU in the form of dollar amounts. The cost of failure,
Co+k, includes these costs plus the additional cost of
trouble-shooting a failed unit. Data for trouble-shooting
costs was also gathered from the K051 MDC for the KT-73
IMU in the form of dollar amounts. No attempt was made to
quantify other cost factors, such as Not-Mission-Capable
time or readiness. Adding these costs to the cost of failure
would have resulted in a larger value for k and a smaller
value for C. However, since the interval for the KT-73 IMU
is totally insensitive to changes in cost, the results would
have been the same if these additional costs had been added
to k.
The times from renewal to failure were taken as
Cycle 1 for all units in the sample. The data was gathered
from the G078C reports by serial number and cycle number.
Seven serial numbers in the original sample of ninety-six
were said to have attrited and were removed from the sample
without bias, leaving eighty-nine units for the study.
The second set of criteria which must be met to
answer the research question is to have a large sample
88
(greater than 30). The sample of eighty-nine units meets
this criterion.
The final set of criteria concerns procedures
necessary to apply Bergman's method. If (1) the cost of
replacement can be standardized to k units of dollars, (2)
the observed life times can be scaled to Bergman's TTT-plot,
(3) a graph of the scaled empirical life distribution can be
constructed, (4) a tangent to the failure curve with the
greatest slope passing through the point plotted for replace-
ment cost can be drawn, and (5) the index for the optimal
replacement interval can be identified using Bergman's
graphical technique, then the research question can be
answered in the affirmative.
Using a FORTRAN program, annual per unit averages
for the cost of replacement and the additional cost of
failure, k, were computed. The cost of replacement, Co,
was then standardized to k units of dollars by dividing C0
by k to arrive at values for C. The values for C were then
analyzed for parameters and the mean value of 5.206 used to
plot a point representing (-c,o). A line with the greatest
slope passing through this point and tangent to the failure
curve was drawn and the index for the optimal replacement
interval identified as infinite. Accordingly, the recommenda-
tion based on this study is to operate the KT-73 IMU until
failure.
89
Having met all of the criteria necessary, the research
question is answered in the affirmative. As explained in
Chapter III, having successfully applied Bergman's method
for arriving at an optimal maintenance task interval, the
reciprocal, [C(T)] , of the objective function C(T) is
minimized. The resultant solution is an optimal maintenance
task interval which balances the cost of replacement with
the cost of failure, and results in a minimum total long-
run average cost per unit time.
Secondary Research Question "a" asks how the optimal
interval for the units tested compares with the current
interval for the item. To answer this question, (1) the
current interval must be known, (2) the distribution of
observed failure data must be identified, (3) the index for
the optimal interval must be identified using Bergman's
graphical technique, (4) the current and optimal intervals
must be compared, and (5) differences, if any, between the
two intervals must be explained or reconciled.
The KT-73 IMU is replaced upon failure and so the
current task interval is infinite. The empirical life
distribution revealed by the TTT-plot using field data for
the units was slightly DFR, and the index for the optimal
replacement interval denoted an infinite interval. Thus,
the current and optimal intervals are the same. Since all
of the criteria for answering secondary Research Question
90

"a" were successfully met, the conclusion that the two
intervals are identical can be asserted.
Secondary Research Question "b" asks how sensitive
the calculated optimal interval is to the uncertainty of
cost. To answer this question, (1) the mean and standard
deviation for standardized cost values must be identified,
(2) a range of values for C above and below the mean must
be identified for use in performing the sensitivity analysis,
(3) changes in the optimal index must be identified based on
changes in C, and (4) conclusions about the sensitivity of
the optimal interval to uncertainty in cost must be drawn
from the analysis.
The ten values for cost of replacement, C, were
subjected to analysis by the SPSS Condescriptive computer
program to find values for the mean and standard deviation.
Computing values for one and two standard deviations above
and below the mean, new lines were drawn through these
points and tangent to the failure curve. The index for the
optimal replacement interval in each case denoted an infinite
interval. Hence, it was concluded that the interval is
totally insensitive to changes in cost, C.
Having successfully met all of the criteria, it was
concluded that the optimal interval is totally insensitive
to changes in cost.
91

CHAPTER V
CONCLUSIONS, IMPLICATIONS AND RECOMMENDATIONS
In this chapter, the authors endeavor to place in
perspective the findings and observations gained through the
demonstration of a simple graphical method for determining
optimal maintenance task intervals using actual field data
for equipment used in aircraft. The method is based on a
control strategy which balances cost of replacement with the
cost of failure resulting in a minimum total long-run average
cost per unit time. The research conclusions, implications
and recommendations are presented in the following sections.
Conclusions
The research objective was attained by answering the
following research question and secondary questions:
Research Question
Can Bergman's graphical method be applied in deter-
mining an optimal maintenance task interval based on the
objective of minimizing total long-run average cost per unit
time using actual field data?
Bergman's method was successfully applied to a sample
of KT-73 Inertial Measurement Units (IMUs) used in the Air
Force A-7D aircraft. The study indicated that the component's
92

optimal replacement interval is an infinite one (operate
until failure). The solution was found graphically.
Bergman's method assigns an infinite task interval to any
component displaying an exponential failure distribution or
decreasing failure rate (DFR); therefore, by definition,
the task interval could have been specified once the TTT-
plot had been constructed and the distribution identified
as DFR.
Secondary Research Question "a"
How does the calculated optimal interval for the
units tested compare with the current interval for that
item?
The units tested exhibited a DFR, thus, an infinite
task interval was assigned. The current interval is also
infinite. Comparison of the optimal and current intervals
show that they are identical. Hence, the current interval
is optimal.
Secondary Research Question "b"
How sensitive is the calculated optimal interval to
the uncertainty of cost?
It was demonstrated in Chapter IV that a range of
values for cost on the order of two standard deviations
about the mean caused no change in the optimal replacement
interval. Therefore, it was concluded that the optimal
replacement interval is totally insensitive to changes in
93
cost. This conclusion could have been reached without per-
forming the analysis since, by definition, a failure distribu-
tion which is DFR must yield an infinite interval.
The item chosen to demonstrate the graphical
technique was not ideal for use in performing sensitivity
analysis. The authors were unable to identify a unit of
equipment that would display an increasing failure rate and
that was traceable by serial number. This constraint
severely limited demonstrating the usefulness of sensitivity
analysis and the ease in which it can be accomplished using
Bergman's method. However, the significant prospects that
are offered for analyzing the uncertainty associated with
cost through sensitivity analysis should not be overlooked.
Having answered the research questions, the researchers
conclude that the application of Bergman's graphical tech-
nique to an IMU demonstrated a viable method for determining
an optimal interval for an item in the Air Force inventory.
It provides: (1) an easy way to give sensitivity analysis
with respect to the uncertain relationship between cost of
replacement and cost of failure, and (2) help in solving the
problem of communication between the analyst and the decision
maker (9:471) by presenting a visual means for analyzing
failure data and by giving the analyst a "feel" for the
uncertainties and relationships involved in arriving at the
graphical solution.
94

Implications
Managerial Tool
Bergman's graphical method could provide the item
manager with information to better manage the item. An
empirical representation of the item's failure distribution
would be known versus an assumed theoretical exponential
failure distribution. The manager's planning could be
influenced and enhanced significantly by better understand-
ing the effects of changing cost on item intervals.
Opportunistic Maintenance Policy
This research was limited in scope in that it
addresses optimal task intervals for individual components.
To achieve an optimal maintenance policy for an end item,
i.e., aircraft, the intervals of all components must be
effectively incorporated into an optimal maintenance
strategy for the end item. It is conceivable to combine
optimal task intervals, achieved through Bergman's method,
with the comprehensive maintenance strategy of an Oppor-
tunistic Maintenance Policy. Under such a policy, complex
end items, i.e., aircraft, can be considered so that
maintenance action taken on one part is made to depend on
the state of the rest of the system. The use of such a
maintenance policy in conjunction with optimal task inter-
vals would result in some suboptimization of task intervals
for the major end item; however, the final product would be
a more effective maintenance strategy.
95

Smith conducted a Government-contracted study in
1980 in which he applied an opportunistic maintenance policy
to the FlOOPW100 aircraft engine. The Fi00 engine is
currently maintained under an on-condition policy, whereby
the engine is removed and maintenance is performed to pre-
clude failure of "driving" items only when required.
Driving items are items whose failures are undesirable due
to safety or economic consequences. Hence, this type of
policy disallows scheduled maintenance for engine components
on a hard time basis (27:3).
By applying an opportunistic policy, Smith reasons
that maintenance actions not required at the time of engine
removal (the opportunity) can be performed so as to avoid
future costs (27:4). Using a total engine life-cycle cost
formula, he balances the marginal cost to replace an item
with the marginal cost of failure for the item and develops
optimal Conditional Part Level (CPL) screens conditioned on
engine status (27:22). A simulation of the engine's twenty-
year life cycle indicated substantial savings, measured
primarily by a reduction in engine removals. One of the
major weaknesses in the analysis, according to Smith, regards
assumptions in part failure distributions (27:39).
Since one of the keys to success of the model is the
input of valid cost and failure data, Bergman's method could
provide assistance in establishing an information storehouse
96
from which to feed the opportunistic maintenance screening
process.
Within the context of the Reliability-Centered
Maintenance Program, the use of an Opportunistic Mainte-
nance Policy for major end items, based on individual
analyses of components through Bergman's method, might
better realize the objective of the program which is to
develop a scheduled maintenance program that will realize
the inherent reliability levels of complex equipment at
minimum total cost.
Recommendations
It was found during the course of this research that
some areas were worthy of further study:
General
There is much theory (see Chapter II) concerning
optimal maintenance policies used to determine task intervals
and typically based on the objective of finding the interval
which minimizes cost. A need exists to begin closing the
gap between theoretical and practical applications of
methodology to determine maintenance task intervals.
The Air Force is dedicated to pursuing a means of
improving the analytical process for determining scheduled
maintenance task intervals; therefore, there is a need to
restructure portions of the data collection system so it is
responsive to the data needs of managers and, ultimately,
97

the analytical process brought about for determining task
intervals.
Recommendations for Future Research
The amount of significant information obtainable
through the use of Bergman's method is somewhat dependent
on the failure distribution exhibited by the item under
study. This is to say that sensitivity analyses and cost
and interval relationships are better demonstrated by
Bergman's method if the item displays an increasing failure
rate versus an exponential failure distribution or decreasing
failure rate. Therefore, it is suggested that further
research be conducted with Bergman's graphical technique
using an item which exhibits an increasing failure rate.
Any attempt to demonstrate the practical application
of theoretical optimal maintenance models should be made
within the context of an existing maintenance program. Only
under this condition can the impact of the test be truly
appreciated by an audience of potential benefactors. The
attempt was made in this study to demonstrate Bergman's
method within the context of the RCMP. However, in future
research made within this context, a different approach is
suggested. It is recommended that the item used for study
be selected and characterized in accordance with the basic
steps necessary to integrate items into the RCMP. Specif-
ically, the item (1) should be identified as a significant
item, (2) should have failure consequences (cost of failure)
98

identified through FMEA, (3) should have a specific type of
maintenance task assigned to it, and (4) should have a main-
tenance task interval assigned to it.
Complying with these basic steps will accomplish the
following: (1) it will be known that the item for study
qualifies for RCM analysis because of its value in terms of
safety and/or economics, (2) specific failure consequences
can be identified and subsequent attempts made to quantify
them for purposes of the study, (3) it will be known which
type of maintenance task (hard time, on-condition, condition
monitoring) has been assigned to the item so that an appro-
priate methodology for selecting the interval can be used,
and (4) it will be known what task interval (finite or
infinite) has been assigned to the item so that the optimality
of the interval can be evaluated based on the results of
the study. In this way, conclusions can be made about the
applicability of the method under study as well as about the
appropriateness of current intervals.
99

APPENDICES
100
APPENDIX A
FUNCTIONAL DESCRIPTION AND INSPECTION CHECKLIST--
KT-73 IMU
101

The purpose of this booklet Is to famliaiss the reader with
the basic sodes of operation of the A? De. his lnformation
should be of value In determining and isolating mlfunctions of
the system.
It is recolnpized that this is nAt an in-de.th analysis of
systen operation. Th_-s information viii be supplemented by on-
the-Job training and technical assistance "ra the Logistics
Support Engineering staff.
102
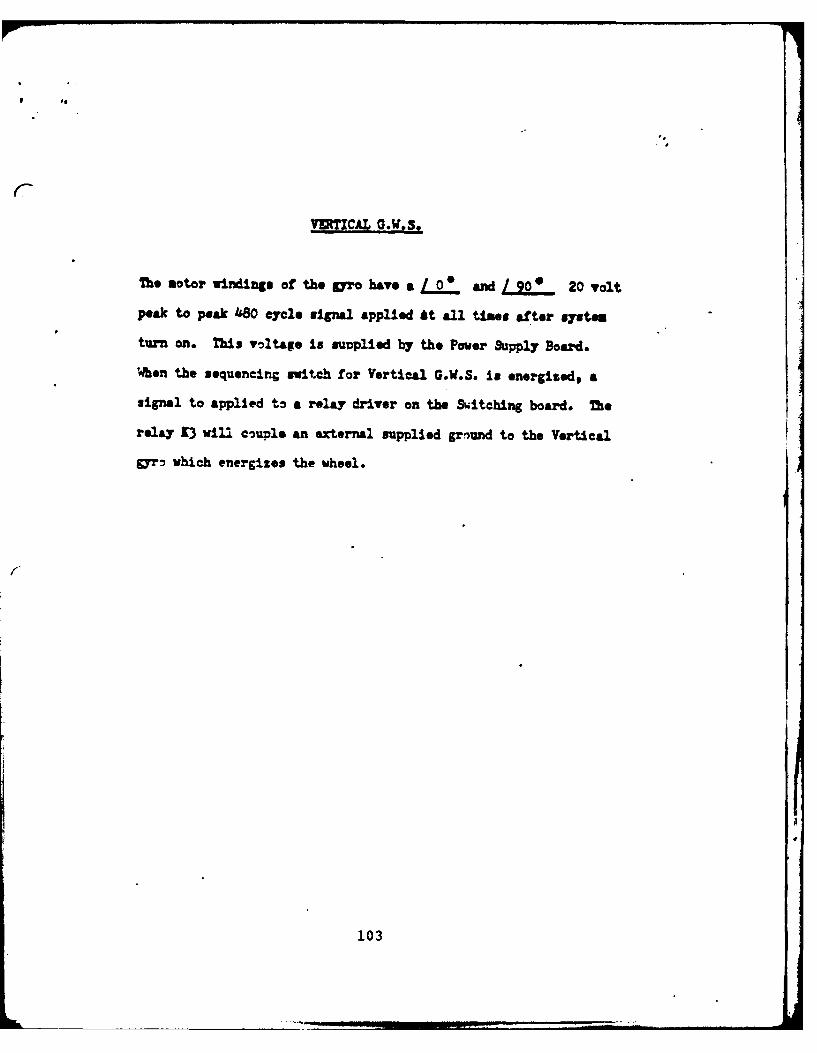
VOTICAL G.W.S.
The motor windings of the gyro have a 0 mnd 90'0 20 volt
peak to peak '80 cycle signal applied it all tines after system
turn on. This vtltago is suoplied by the Power Supply Board.
When the sequencing switch for Vertical G.W.S. is energised, a
signal to applied to a relay driver on the Switching board. The
relay 13 will couple an external supplied gr.iund to the Vertical
gyr-,7 which energizes the wheel.
103

CAGE MS (A7 M)
The Cage M:de Is for the purpose of aligning four glmbals tothe attitude of the fixed frame of the platform. The variousloops are standard serve loops employing direct current torquer.
The Asiuth pitch and outer roll synchros employ 26 vac. 400 hsexcitation from an exaternal source while the Inner Roll pickoffexcitation is a system supplied 19.2 KRZ at 8 vrus. This signalis supplied by the Power Supply Board.
OUTUR ROLL LOOP - The stators of the outer roll Synchero aremechanically connected to the fixed Giabsl;while the toter winding is essentially partof the outer roll Gimbal. The displacemtangle of the rotor winding to the statorwinding (S3) is indicated by a voltage. Whemthis voltage is at a null with the properphasing the mechanical position of the glumbal is zero degrees. The 400 cycle error isrouted to the switching board to the O.R.Amp. The O.R. Amp. demodulates the A.C. toD.C. The D.C. signal is thon coupled thrutho Fisbal board. The D.C. then is appliedto the O.R. torquer (W9) which rotatee theO..I. gimbal until it is positioned to pointat which error signal is nulled. The remain-ing stator outputs are used to display O.R.position on the Roll P.A.I. at initiation ofvertical isolation.
PITCH LOOP The pitch Loop Is similar to the O.R. chanmelin as the stators of (M) Pitch CX are physic-ally mounted an the O.R. gimbal and the rotoris on the Pitch Gimbal. The 400 cycle errorsignal is taken off of 53 and coupled throughthe switching board via relays to the Gimbalboard. At the Gibal board the 400 cyclesignal is applied to a demodulator circuit whichalso receives a 400 cycle reference signal. Thecutut is a positive or negative D.C. voltagedepending on the phase of the error signal. The, D.C. is applied tn a Power Amp* and coupledout to the torquer (B7) which drives the gimbaluntil the error is null.od. The remainingstator outputs ane used to display Pitch angleon the P.A.T. during Vrtical isolation.
104

itrne- ?Z11l !.4C~p - ThD l.R. Ic.CSP dirfori, fr-ta the O.R. and ?Itchcrily In the Txeittion c * en t"v pick offvl-.I,-h is 6 vrinw. 39.2 kts. The pick onf win4 -inr, !z z.-ntod on the pitch fila and th. rotor1.5 Positined E the I.R. e-2aft1 itseit. Theerror :tzza- Crom B4 In roiutad t~xruh thorwitehii bcard =1. smt to the W-i-a bord71he eignal Is thxn applied to dearoator whichi*as a f'ixed reezestiee einA~l oe 19.2 k&16 The
,). C. level 1. Ahea swp~tled by the ?oor Anp.amd applied to the I.R. torqaw 29 V'.ic h drivesthe I.R. Gimbal until the error signal is muloed
.sit h lop - Tb. Aimutb Loop dilltme fro t " previouslydescribed loops In an It ue* an szterml ief-*raese ?or Its pocltioning. The Adwazth CZ ispositivaed so that when the rotor and the stater(Mi) are paralel to the I Axis of t~he frus ofr.1ere the autpe. r*7msut 2-ara d..2reesoTho error rizoal from the al-aters of B2 is routedouat or the 1W. and ipplied to a e~hre-tow trzzu-!ormer. 13 thA tert sqt±mt the rotor of th*C.?. 13is ebmnic21 poitia-zed to the desiredAaimuth anr.. T%.* ttator rmtpxate ggy& s.ttthis arrlo and Is applied ta tLe trannformar.rhe outiat of the taaformar 12a the dllfTweneeof th6e tw l-nuits. The error aih-nal Is thennpliffled and applied to the- Auith rhanlozi the Gimale bard. The-re t'a ei--ua is demo6..ulated and =l±:'IPd The A P.C. is applied tothe .1lat tam~er B3. The Aainxtis -1ubal Isdriviag nutil the error s±2nal out of the testeuimnt is called. TI-a st-r octutvt of 32
are also used to drive,.the Asimtb M.
The various rlvqv on the evitchiax and "jimbal t'.rac vl-deb wremsed : 'r qig aI rotim; d-Urig the Cage Mods ams enarlized 1V logic-irit-a cm the switehing bord ?l logic eircuits axe, InItIstedby 7 seutn~g zdtcbas on th-e test 'wqai~aant.
105

VERTICAL ISOLATION
In this mods of operat4 n there are actually two phases. Thefirst being Low Gain and the second, Normal Gain. The onlydifference in the two phases is the input resistance to thedemodulators in the Inner Roll and Pitch channels. Theseresistors are large during Low Gain and smaler during NormalGain.
The purpose of Vertical Isolation is to cage the Inner Roll,Pitch and Outer Roll gimbals to the pick offs of the VerticalGyro rather than to the synchros as in the Cage Mode. Thecircuit operation is as follows:
The outputs of the Vertical Gyro referred to as OX" axis pickoff and "T" axis pick off are amplified in the Gyro electronicsboard and applied to the rotor windings of the coordinate res.olver (Bl). The rotor of 01 is mechanically positio.-d at thefunction of the Azimuth gimbal. The stators position is fixeddue t, the fact that they are physically attached to the InnerRoll Cap in which the cluster is housed. The rotor windingsRl and R2 and stator vindings Si and £2 are displaced fromeach other by 90 degrees. Refer to tho figure below.
DIP IM
When the Azimuth is positioned to sero degrees and the PlatformIs aligned along the X axis frame of reference the rotor RI andthe stator S1 are both alignod to sero degrees. Atthis tinethe "X" pick off is applied to RI and induced into the S2 wind-ing. If the Atimuth or the Flatform is repositioned to an angleof 90 or 270 decrees the voltace applied to Rl would be inducedin the 52 winding and any voltage on R2 would be coupled to S1.
106

-2-
The signal representing "10 axis pick off which isApplied toeM1 and induced into S1 is applied to the Inner Roll channel onthe Gimbal board. The signal is demodulated, applified andapplied to the Inner Roll torquer.
At this time, the Outer Roll gimbal, which was caged to itsown ynchro output, is caged to the output of the Inner Rollpick off. The I.R. pick off signal is coupled to the OuterRoll Amp. on the Switching board. The reference input isswitched from 400 ZZ to 19.2 IKHZ by circuits on the Switchingboard. The output from the O.R. Amp. is sent through theGimbal board and applied to the Outer Roll torquer B9. Theoutputs of the 0.R. CZ (BS) are used to display position onthe Roll P.A.I.
The "T" pick off signal is applied to R2 of Bl coupled to S2and applied to the Pitch channel on the Gimbal board. At thistime the reference input to the deRodulator is switched from400 HZ to 19.2 KHZ by circuits on the Switching board. Thesignal is demodulated, amplified and applied to the Pitchtorquer B7. The outputs of the Pitch CX (B6) are used to dis-play position on the Pitch P.A.I.
The Azimuth loop remains asil was in Cage Mode. The variousrelays cis the Gimbal and Switching boards are driven by inputsto the Switching board from the sequencing switches on thetest console.
107
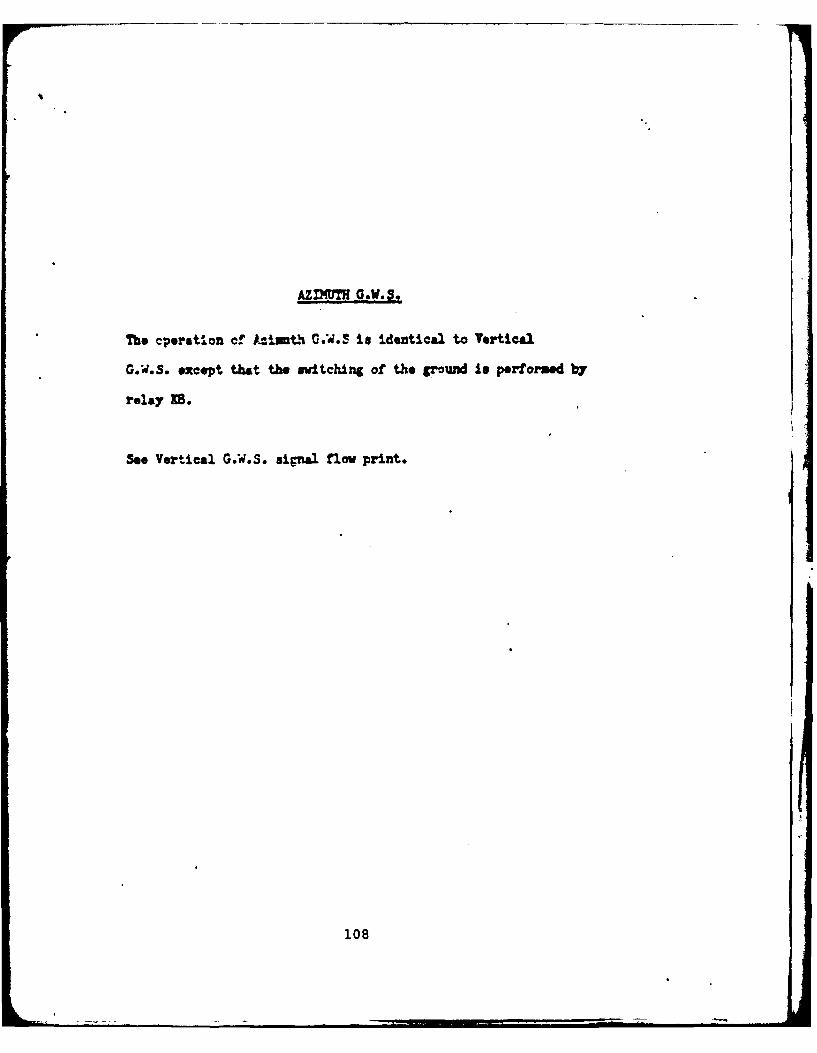
'S°
AZIMtTH G.W.S.
The cperation cf )--iith. G.W.S is identical to Vertical
G.W.S. except that the switching of the ground is performpd by
relay 18.
See Vertical G.W.S. signal flow print.
108

S t
AXMtJTH IiSOLATIEW
This mode consists of two phases of operation. The firstbeing, caging of the Amuth gimbal to the Z Axis pick off ofthe Azimuth gyro. The "Z" pick off in applied to the Gyro 11.electronics board where it is amplified to a useful output leveland then is sent to the Azimuth channel of the Gimbal board.The signal is coupled through a 1 megohm resistor by the actionof relay XIO and through the contacts of [6 to the demodulatorstags. The reference input is switched during this -ode ofoperation from 403 HZ to 19.2 KHZ by the Switching board. The±D.C output is applied to the amplifier section and appliedto the Azimuth torquer (B3).
The second phase consists of two separate actions; switchingto high gain in the azimuth channel nd and the caging of theRedundant loop to its -wn pick off.
High gain switching of the Azimuth channel is accomplishddby the energizing of relay K1O. The contacts of X1O willinsert a 30K ohm resistor in place of the 1 mehoha resistorthus increasing gain of the stage.
The output of the Redundant axis of the Azmuth Gyro Is ampli.fied, demodulated and amplified again and applied to the red-undant torquer. The circuit is completed by the action of relayK2 cnn the Switching board which places the other side of thetorquer to grcudd.
109

CaMThe purpose of this mode of operation Is to level the doubleaxis accelerometer so that the two axis are perpendicular tothe gravity vector. Since both channels are effectivelyidentical, only the "" axis will be discussed.
Folloaing the previously discussed modes of operations theaccelerometers, particularly the double axis, will not beperfectly level to the earth and there will be an outputrpresenting this misalignment. T'he output signal which is19.2 KRZ is aliflied by pre-aps located on the D/A. Thesignal is then sent to the restoring amp. on the acceleroueterMectrrics bard. rhe nutput is a + D.C. representing theaccount ef off level. Mhe D.C. sinal is applied through thetorquar coil and r,"utpd to a junction point. Also tied tothe juncti-'rn point is a D.C. level which is used to null outthe amount of err-br zignal which is due to mass unbalance ofthe accelertetar. 'his voltage is supplied by the resistorn-twirk R12 and R33 nn the Compensation Bnarde.
5e D.C. signal is applied to the Power Supply Board andthriugh relay 12 to the IX" Coarse Level amp. The amplifiedsignal is then sent to the Switching board. On this boardthe relay M0 s-rv-s a ftnctiin if increasing or decreasingthe gain f the signal. -L*&inc Back-up level the 3.l4Kresict-r is ine-rt d int- the circuit to lower the gain. InCoarse Level the rilay i: as above. The output of the Switch-irg b- ard j sent back ti the Compensation board, through R18and A19 add applied t- the IT" axis torquer of the VerticalGyr. This ricnal will .- ecess the gyro wheel causing ancutrut on the "Tr pick of-". The pick off signal Is thenuwlified and applied to the r-tor winding of the coordinateResolver (31). At this time i the Platform Is aligned alongthe IX" axis and the heading is zero debrees, the signal willbo cou;ld inti the statr winding which feets the Pitchchannel of the Gimbal board. As the Pftoh gimbal Is rotatedthe output .f the OX" axis acce-lerTmeter will diminish. ThePitch pirbal will €ntinrun ti tor;ue until the output of theascmleroueter is nulli --it.
The "Y" axis errnr signal will cause torque to be applied tothe "X" axis if the Vertical Cyro whils output will cause theInner Roll gimbl to be r-tated until the error signal isnull d.
110

ALIGN NORMAL
In this mode of operation the Platform Is free to drift withZUrth Rate. At this present nosition of LUditude the driftrate about the I axis is I1.519DEG/HR. and the drift rateabout the Ix Z axI is 9.672DM/R, This drift wil appear asanvement on the Roll and-Asiinth API's respectively.
There are certain corrections in respect to the Gyroflex thatare taken Into consideration at this time. All gyros exhibitdrift characteristics mdd there are two classifications ofdrift. The first is referred to as "random drift" add is notacceptable for use in an IMU. The second is "fixed drift".,he rate of drift is measurable and can be compensated for.
There are two other characteristics of the Goyriflex to beaccounted End corrected fir. They are both due to the actualconstruction of the wheel assembly of the gyro and will notbe discussed in detail.
Both the X and 1 axis of the Vertical Gyro and the Zaxid ofthe Azimuth will have In their pick-off signal a voltage whichis due to Yin phase" error, also referred to as Spring Rates.Located on the Compensation Board are Amplified/Demodulatorstages and "select during test" reristors which are used to
*null out the "In phase" error.
The other type of error is referred to as quadrature. Due tothe "torque about - pretess about" principle of gyrosthissignal is applied to the axis 90 degrees displaced from wherethe error is detected. In Izz other words, if the quadrature erroris taken off the X axis pick-off it 1 applied to the Y axistorquer.
The fixed drift mentioned previously is compensated by apply-ing a voltage to the 1, and Z torquers, which will causemovement that is equal but opposite the drift, there fore,eliminating tho affect of drift. This voltage is insertedinto the circuit by Ri0, R11 and R12. The pots are also ref-erred to as Restraints.
111

ALIGN NCRXAL (FAST SLAVE)
In fast slave mode the Azimuth, Pitch and Roll dbal positionis determined by the arglar displacment of their respectiveAPI's. Asthe API position is changed a signal is applied tothe proper gy-o torquer causing the gimbal to be repositioned.
The signal flow for Fast Slave is as follows,
AZDIM A demodulated signal representing Azimuth PAI posi.tion is coupled across the contacts of relay 1l5 onthe Switching Board and Is applied through resistorsR22 and R23 on the Compensation Board. This D.C.signal is applied to the Z torquer. The other sideof the torquer is tied to ground via the SwitchingBoard from an external source. The resultant Zpick off is amplified in the Gyro Electronics Boardand applied to the Azimuth channel of the GimbalB-ard. The output of the Gimbal Board is appliedto the Azimuth Torquer which causes the Azimuth CSoutput to change. When the Azimuth CI positionoutput is equal to the PAl's position the errorsignal applied to the Z torquer drops to zero andthe Clustesr. stops driving.
The operation of the Pitch and Roll Gimbals during Fast Slave IsIdentical except the error signals are applied directly fromthe PAI's to the X and T 3ro torquers.
112

ALIGN NORMAL (SLEW)This mode of operation is Identical to Fast Slave except theAsimth, Pitch and Roll Gimbals are not repositioned by anerror signal from the API's but rather by a 15 vdc signalfrom the Switching Board.
The selection of which Gimbal is slowed and in what directionis controiled by switches on the test equipment. Since themethod of siowing all three of the Gimbals arc sonewhat IM ides.tical only the Pitch will be Vlainod.
When T Slew Is selected relay 114 is deoenergized by the signal applied to Z20 on the Switching Board. This ties thecontacts of 114 to the Contacts of K12. Depending upon if12 is energized or not a + 15 idc signal is applied to theT torquer via the Compensation Board. Tho I pick off signalIs amplified and applied to the coordinate resolver and sentto the Pitch channel on the Gimbal board. The signal is app-lied to the Pitch Torquer Relay K12 determines direction ofSlew.
The Azimuth Slew differs from Pitch and Roll to the extentthat the Z torquer has a + 1 vde on one side and a - 15 ideon the other. Thse polarities are reversed by the action of19 when actuated by the polarity urithh on the T/S.
113

S I
DIGITALLEU
This is the mode of operation where the system Is reined.That Is to say that we want to perfectly level the systemin respect to the earth's surface and insure that the systemis pointed exactly north.
This is aocomplished in the following manner. The Xp Y and Zaccelerometer signas are applied to the CAPRI Board wherethey reintegrated Into X, and Z velocity signals. Thesesigmas are displayed on the CAPRI counters. The X and TCAPRI signals are also applied through the Digital Level Con.trol Module to the Gypto Control Module. The X CAPRI signalis converted to pulses and Is applied as T Gpton pulses tothe Switching Board. The Switching Board circuitry changesthe one signal into two signals 180 apart. The two signasrepresenting T Gypto are applied to a push-pull ciscuit onthe Gyro Electronics B-lard and the Y Bias torquer. Thissignal wll null out any iff level condition of the X accel-erometer.
The X Gypto circuitry is identical to the . Oypto sxcept tfor the amount of pulses that the X Gypto puts out. J- As di"-cussed previously, the X axis of the V rtical Gyro if not cor-rected would appear to drilft with E-rth's Rate. In DigitalLevel the output of the Y eccelerometer is due to the Earth'sRate on the I axis Gyro. The false acceleration signal Is Integ-rated in the CAPRI Board and converted to pulses to be appliedtm the I bias torquer. The amount of pulses required to keepthe X axis of the D/A accelerometer perfectly level with theEarth's surface is the Earth's Rate correction signal for theI axis Gyro.
The Z Gypto circuit is used to null out the effect of Earth'sRate about the Z aids. To supply the correct signal f or theAsimuth Gyro the output of the Azimuth CX is used. As the Zaxis starts to drift, the Azimuth CX output changes to Indic-ate this apparent procession. The signal in applied to the"Z" V:. Module where the UOD cps signal I; converted intodigital pulses. Mis signal is applied through the Test Xquip-ment tc. the Z Gypto circuitry on tha Switching Board andfinally tc the Z Bias torquer. The torquing signal is usedto drive the 7 a-is of the Azimuth Gyro in a direction whichis ecual but opposite thn drift rate..
114

LL..
CIO'
A-l
1151

4 LJ S22 '-
0 QL4c N
00 Ir-f (/_j(
Vc)
wn o~
d- x C)!2
.11

V Ic
..- J.
117
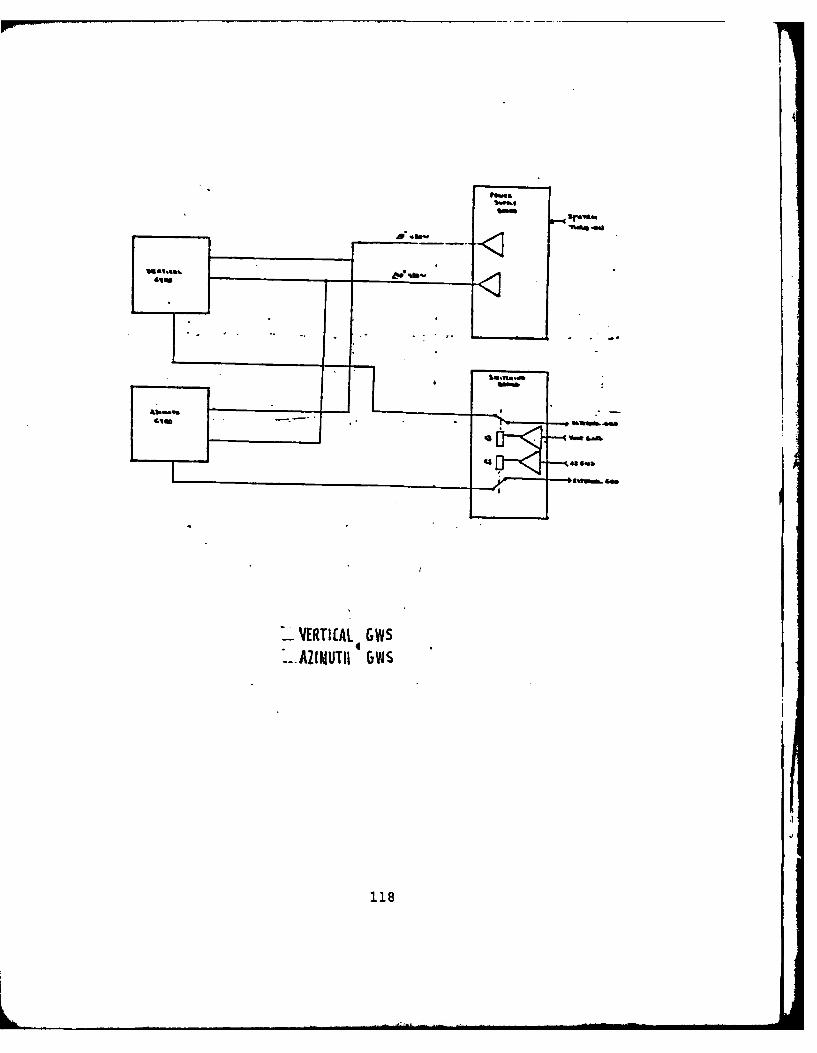
IUUsome
UVERTICAL &WS>-AZMUTII GYJS
118
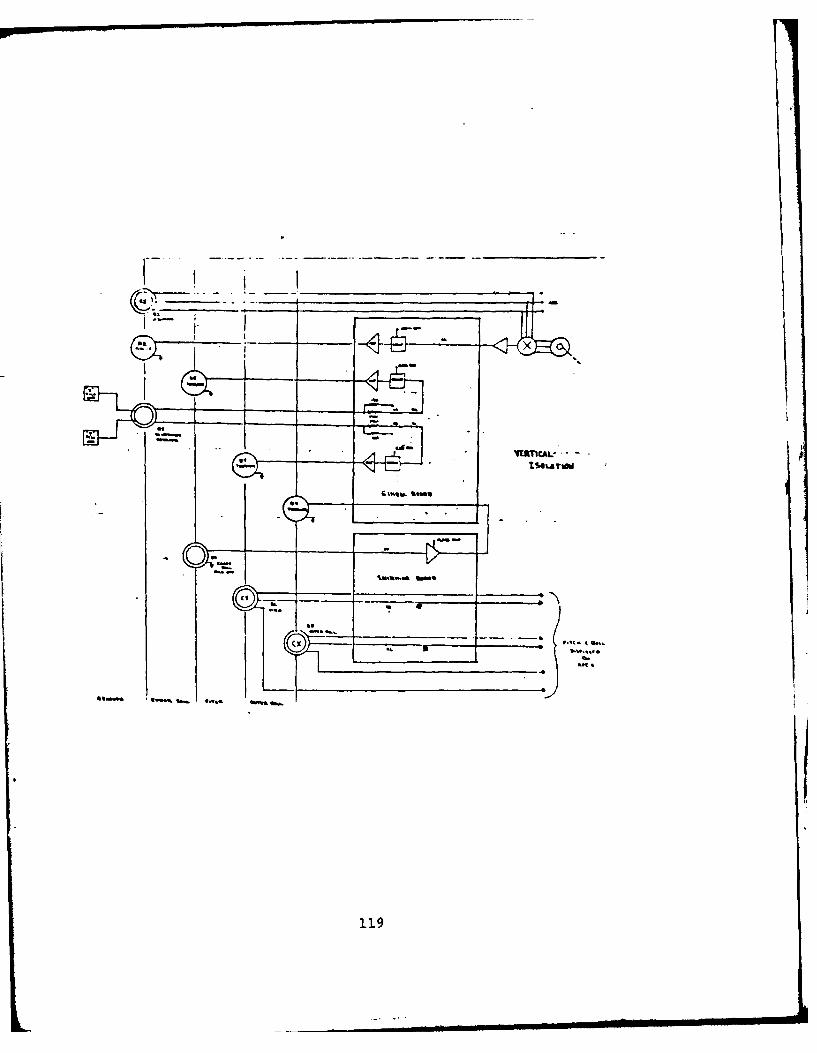
.some
- -$ 8 'm-
.X
L-'• - -I
aft.
1.19

ARIU~H isoLATiot
120
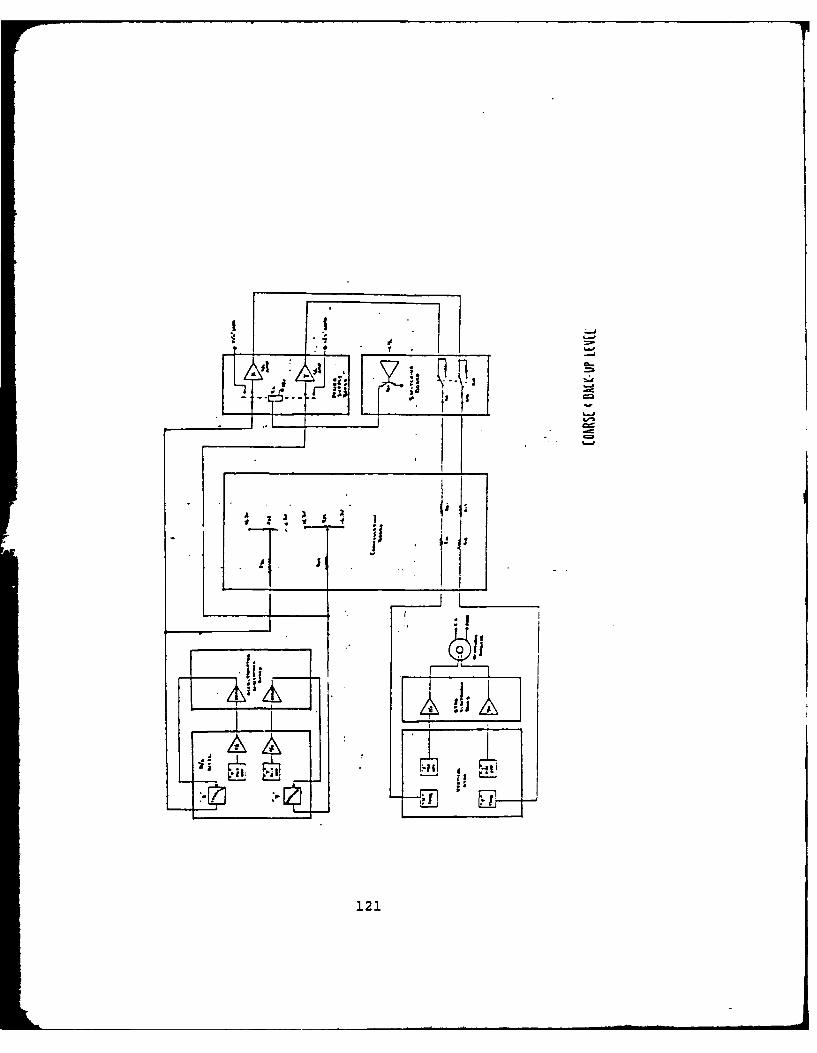
I -3
I ~ 'a,4=
I.c
121

T 1 T T i TI t~fl
i 7 "i'-
LL
I,
Is.
:jJ ii
• i
~.
4 I,1! ,
122

.-,.I .,I-, , ..
41>1171
H- -i
3 - I
L JJ0
123
Itf

V1 EW oir-R PLATFORM1
Pi )PIOJ5,IJ6 CONI49CTORSW1TU CARRIESPONDING PIN LOCATLOIVS
2 O/ X35 5, 00 033s o ila 0o 0 1
vIaw ot Pi CONP4ECTOMiei.3aa TOwA~as VLWop3 C~r4CO
CompgAiSATION BOAR~D LOWMIN~G AT IMU 90OUSJNG
019 6 0 0/12A0 J 7 9 li 0 0 o19
5130 ~vlaw 0: .J6 CONNECTC.?LO@MNG AT JKU NOWISIN4 V, %ivoo to c~ .We're7r
124

PLbTFORMI MISALIGNMENT ANGLE DEFriNITION
Z ACrQ SENS. AXISGYR~O iwPU'T VERICAL GIRO K4
AX15 SPIN AXIS B
'Y GYRO INPU
AXIS
Z GYRO 4ZC I CUTESPINPU AX15AX
W TW
Vv, 0,4 125

I- o
0
7 d 10
t- z
Li l
0'
wU
126$
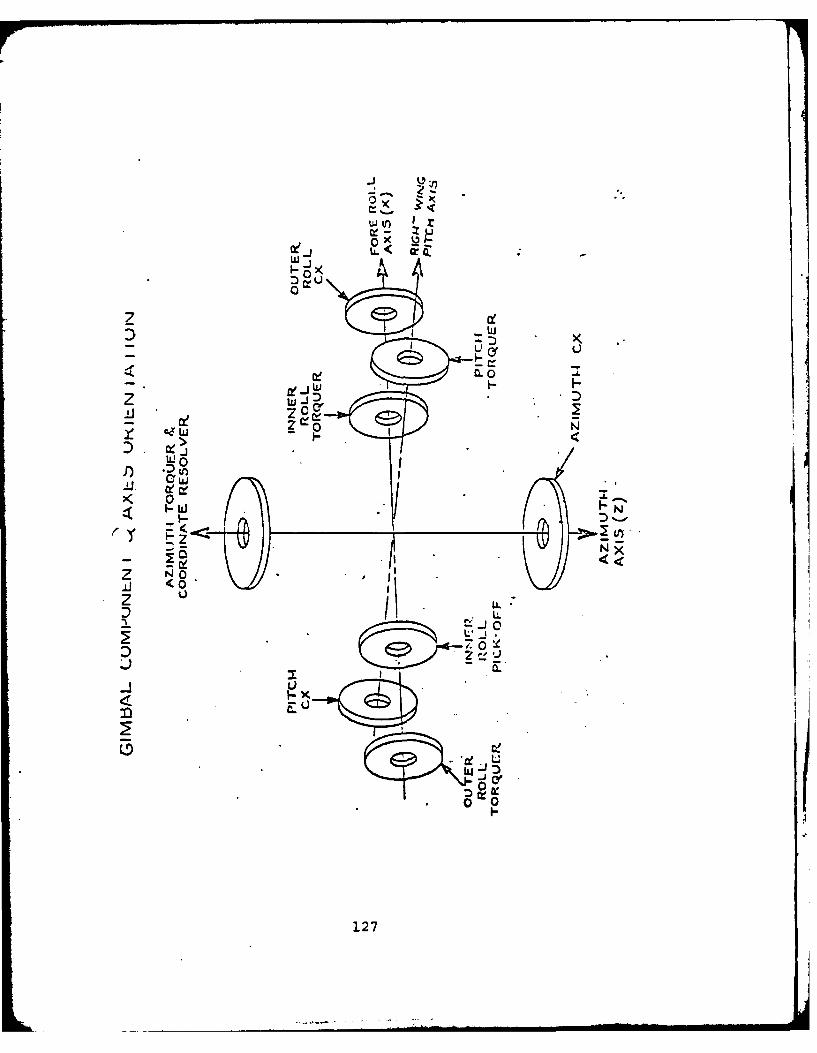
IoZ
le _I L
Wc.o
'K7 0
Z e Z a
0.C.
Ce127

VOUGHT AERN UTIC$ COMPANY
,IN, NO. 80378 0 :co.e.S 2 o 6 - 1 6 -8e
Page 106ENGI::rZl9::G DEPA.".MZ.:T SPEC.TFCATION
TABLE XIII
AUTOM;ATIC IMS TESTTIG FAIL NUMBEFS
ASIC FArL
TEST i,. r, !;"C INDICATED FAULT---- --- ---- -- ------------ ----.. . . .-------- ------------------ ---.
A I 14s fdil6d and/or ImS System ready not indicated
0 2IMS ground align mode not indicated
C c IMS self contained analog level incorrect
D 6 IMS self contained hdq loop initialization incorrect(Mag Var difference of 100 not indicated)
Accelerometer X and Y null bias S vertical accel.I"G" bias not within prescribed limits:
7 X accel/CAPPI high gain null bias ou of tolerance8 Y accel/CAPRI high gain null bias out of tolerance
X accel/CAPPI low gain null bias out oftolerance
10 Y accel/CAR: low gain null bias out oftolerance
11 Z accel/CAP?: I"G" bias out of toleranceX and/or Y accel/CAPRI low gain output saturaed
Continuous platform slew condition:12 Continuous platform slew in X and/or Y axes!3 Continuous platform slew in azinuth axis
G 11 IMS not under computer control:14 N(o response to pcsitive X C Y slew commands
(X 6 Y accel measuremrents)15 :3o response to positive Az slpw commands (Az
synchro measurement)16 N:o response to positive Az slew commands (,ag
hdq synchro measurements)Y slew sense malfunction (slews in one direction
only)4X slew sense malfunction (slews in one direction
only)6Q Continuous computer control
H Azimuth sl-w function malfunctions and/or h.!synchro signals invalis:
18 Positive Az slew malfunctionIQ . , .to negative AZ slew commands ([z
y..ciro ..ealurement)22 :o Lzonre to ncitive AZ slew cannards ,mag hJg
LpyrchrO meislirerent)
21 ?: aati: AZ s1em malfunction22 rlatfc-.-A: sAzynr.2-.'. A
128

VOUGHT AIRL- JTIC$ CO-PAWV
80378 ......... .O. 206-16-qep,INT' No. 80378 ~ "...A ol ix
Patge 107NGI:IEERI::G DEPAR ?:FT SPECIFICATION
TABLE XIII (Continued)
BASIC F;7L "'% I.TEST P51 SEC INDICATED FAULT
23 .ag hdg synchro invalid2 4 no Az slew function2 S Azimuth slew sense malfunction (slew in one
direction only)
1 21 Malfunction of auto reversion to and/or operation ofbaickil, qrid mode (plat hdg I mag hdg)
J Ji Fast n.aqnetic heading update malfunction:2.3 Fast mag hd; update response rates not in icated
(plat Az synchro me4surems.nt)it) Fast maq hdq up,.ate response rates not -.nlicated
(mag hdg synchro measurement)
9 34 Malfunction of auto reversion to and/or operaicr ofbackup maq slave mode (land only):
J2 Response rates not proper for mag slave nole(plat Az synchro measurement)
33 Response rates not proper for mag slave mcde(mag hdg synchro measurement)
L Malfunction of X 6 Y slew functions and/orAcc-l/CAPRI signals and/or roll E pitch adtit:'Jeisiqnals:
Improper response to * X slew commandz (rollsynchro rreasurement)
It TinpLoper response to * Y slew coirmaraJn (pl.rchsyrichro measurement)
7 Improper response to * Y slew commands (X lowqain accelerometer rreasurement)
38 Improper response to + X slew commands (Y lowgain accelerometer measurementp
Iq :mproper response to * Y slew conmand- (X highgain accelerometer measurement)
U0 Improper respo:se to + X slew commands (Y highgain accelerometer measurement
41 Positive X slew malfunction"2 Positive Y slew malfunction43 Improper response to -X slew commands (roll
synchro -easurement)144 Improper response to -Y slew commands (pitch
synchro measurement)145 Improper response to -Y slew commanis (X low
gain accelerometer measurement)b -Improper response to -X slew command= (Y Irw
gain acce-erometer meaajrement)"7 :;- ro;per rospcnre to -Y slew commands (Z high
gain accelerometer measurement)
129

VOUGCT a*" UTICI COMPANY
N.,.80378 : C:0.: 2.. No. 206-16-98ePage 108
ENG:!:!EING DEPARM7MrjT SPECIFICATION
----------------------------------------------------------------TABLE XIII (Continued)
PAS!C I"AIl. NI.
TEST rRTO SZC INDICATED FAULT
40 Improper response to -X slew conmands (Y highgain accelerometer measurement)
Qli Neqative X slew malfunctionr0O Neqative Y slew malfunction
1I Positive Y accel/CAPRI malfunction52 Neqavive Y accel/CAPzI malfunction, 3 Y accel/CAPpi malfunctionS I Negative X accel/CAPPI malfunctionr. I Positive X accel/CAPRI malfunction
56 x accel/CAPP: malfunction57 Acceleronetpr scale factor change function
mal funct ion58 Roll synchro invalid59 Pitch synchro invalid60 No X slew response61 No Y slew response
M Gyro diqital torquiq function malf ncticns:62 GYPTO clock liie malfunction (open/short)63 Positive Y torque malfunction6Q INegative X torque malfunction65 Negative Y torque malfunction66 Positive X torque malfunction67 Positive .z torque malfunction68 Negative AZ torque malfunction
N ,70 Vertical accel/CAPRI malfinctior,--- -- - ---- -----------------------------------------------------
*rrimary fail ,uml'ers underlined are critical failures %hichdiscontinue testinq.
130

APPENDIX B
G078C REPORTS - "AIRCRAFT LISTING"AND "FIELD OPERATING HOURS (FOH) BY CYCLE - QUARTERLY"
131

Explanation. The appendix contains extracts from the
"Aircraft Listing" and "Field Operating Hours (FOH) by
Cycle - Quarterly" G078C reports. The listings are prepared
by unit serial number (second column) and cycle number
(first column). Failure data for units in the sample were
taken by serial number for Cycle 1 (underlined entries).
Actual times to failure (hours) were taken from the column
labeled "ETI IN," the elapsed time indicator reading.
132

' * - a. a " . .2 rI n~£ 34'-j"I C,* 4 N ~ 2% 4.' %4' A J J%~
• " - .- - 2% . %" 3 0 -.
X.4~. ' 0 4 4
o , - N .,. 1 1(. "4 4- i .1 %0 r4o .. 02 4. '5 "-
t-4 3 ~ N A .0 1 4% f
-4- - J o
"" Z - Z Z j
"' .3',. '."3 .
0 U.L0 4 A t 3 0 '34I •
* -- .2 C' 3 4 3 % Ifc , U ~ I
* -3 U 2. 04 ' ". 2 N "~ 4!Zl D-u Z~ 'aJ Z4 0 33 !ZN . 0 . 1 U.
-j -4 -N p r
IC.6
oJ o 4. o. o % 3
S % .--33
g I I
V,- - -• • . O .• O 0 O
I '~1 -330 (

K
7 'I. 4' 03"3 03' * '3 -3-0 '' ~ -3 I'~4 A". Al ~ 4' 43C r ~ .'~ 3 3-' '4.3 4' ~ 3 3 r
3-- '4.' 3 - - - ' .33 03- I' -0 .70 '3 341~)---? - I' '41 1 '4A 333 Z 3 3 A' .3 - 33 33-3 -41,41 4% 4141 '43 '3 3 A" 1'.'.'s * fl .3;, 4.3'0-10 ~' '- - -, "4 3 '4 33- j 3 .A 3
3 3' 3'-3 410 3 J' .3 .4.' -- 3' '3-4 '~ = ~ .3 "lAO A 4141333.. ' 3 ''-.3- '43 ~0 4fl '~'43 '43.3 A- 33
-J
34. 'A- .1. '43 U. .334 '3 33 ~. 3 ~ 33 ~
4
z '4 .a. 3.33.1 - .3 .7' 3-41432 3'3' "1 '77' "43- .743 2~. .4' 3 .~' - .. L 4 " -33'
-. 44 - .34330 -03. ~ 4 = ~fl34
.3.3 '4 C' '3 ~ ., . '3 3.3 '473 -J 3. '4A' -7 A' .4' .4" ~4 4' 41.~. '3 7"' 4' -~ * 4 .7- 3 -'
.4;-* 4.
3- I .3
- 33 333 3333 ~ 3-'- -1
-'9-a,
- '3 X 3.: .AZ 33 .3 .j .4.32)33.3 2 .-. .3ge - '3. - ' - ' - - - - "9 - - - -
.3 .... ~..3 ~ - -. - - - '3 -3=-3,
3 1'~-J 3' 4' 3' 4 *'3' A" .'. 3 " ~3 '9 .7333.7- 33- '43 3.7 4",' .7'- >43 3 3'.. 4
Z -.. A - .4 3 32) 3 4 .4 - 3-~ 4 - ' "I 4.7 .. ' 2. .3.- = . :3 ', V. 7 7 7 .~. 2 -
3 - - - - ~l - - -- 3 -. .7 3 -. - - -.1 fi - 3 '4 3 - 7 .7 1 .) . .4 3 3 ~ 3 - "9 .2 3 7 -
3~*3 -~ 3~ -- ~.-. - - -- - - - '43 - -
- ' - - - - - 3 3 - 3 3 - - . 3 7. -
3 3 '4 -' 'A '4 '9 3 -' 3 " 3 3 3 -. * '4 4-- '4 - 1~ -' - -J *' *j 7 - ,3 - - .7 3 "' - -~- - - . U U ''? 2 1 3 3 4 3 C -
-~ 3------'4'4 33--------
- - -' .7 41 3 .7 '4 - 4 - 3 -. .4 2' .7 - "C'1 "'. 4 3 3 '9- .' .1 4 3 -~ 7 t' 3. -' " 3 .' A'
- - - ? 3 - '4 - - 'A I '9 3 '4 3 'I-- 3 - *4*4'33 ------ -'43--
.3 ,.33 .3 3 *A .4 .3 .3-43- 3 -~ .2 .3~31 333-33 - - - - 33 * -337'-
- - - 3 - - . '~ - 1~ - - -
5 - -. - -g .3 - -. . . - .. - .. - . .* -- - .3 - 3 - - 3 - 3 ." 3 - .' - ' -' 3 ."
- 4 .- - 'I j - . 3 1 3 - A - .3 4 -3 ..A.~ '7 .7 ~.". -., .3 - - - '. 'A* .7 4' A .1 . .3 - "9 .. -.4 - ' - - -
I- . .7 * - 7 .7 7 7 ~ .' .4 A .1 2 2' .' 2 S
.3 3 3 3 3 ~ 3 3 3 .4 3 , -. .. A * 3 2- I A . A A 4 3 4 4 4 A A A A '9 ~ -- - 3 - 7.33 3 33 .i 33 4 333.3 - '9 4 .3 4 3 "9
'4 .4 4 4 4 I 'A 1 4 ' I A A . .4 4 , A A A '9
-, A A - 4 -~ ~ f 'A 4 1 4 -~ 4 -~ : ': >4 -.'.
* - - 4' . - - ., 41 - - - * 4 4' * .. - .~ -' - - '.4- *J - - 4 .4 - .4 .3 .3 -4 - '- -~ A ~' -~ - -
0@ 0 6 0 S S * 0 * 0 6 0 0 0 0 *~
134

Z -4 vs ... j .0 :- 0% 0E1 .
10 -j O r r1 0 Of q 2 -
N4
234 . a 0 0 ... 4 ~ 0 A 0
0 J s s N 0 0 f" s si
a 31
* - -' ~X _.j Z -i X 4I-1 .J 3 .JJ Jf J .
'4 4-2 74 NA 0 - - - - - - -4 a -Nnl .0u - 34 a z .g a. v I I ~
I-1II--
.A
.3.0~~~ 3 ? F N- . ' - JO .j = .
- ~ ~ ~ ~ ~ ~ ~ l -~ * ~ 3 r . . . s 3 0 0~ 4 '4-
a J. .'3 00 N3 ., 0i .I nO -1 -14- N - N 0
A- .59 14 %s i s i s i s i i ~ i s ' - i s i i
44
~4 3 a 4% - C -3 - 3 0 O . .% . ' .
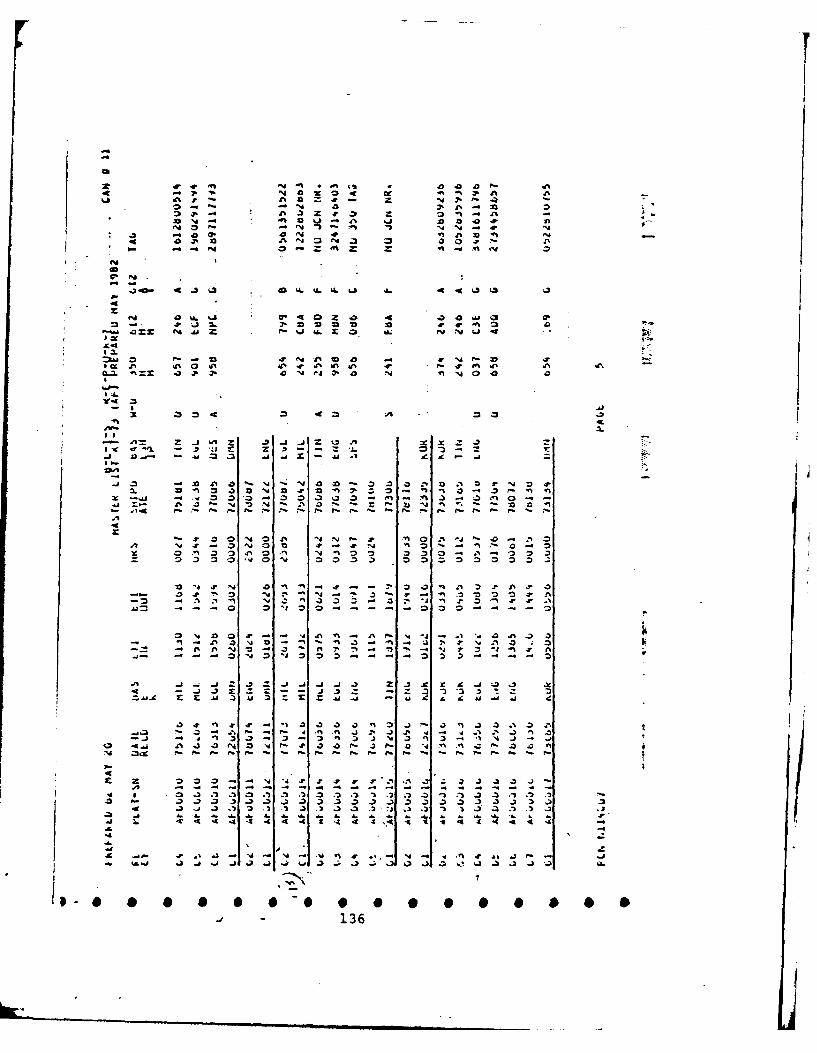
13o a% - e4 N 4. N .
0 -~ .4 .0 2' IA .07.~~~ =. Z 40~ 0 7
K.4-'. . .3. . .0 ?.
"40 "4 ~ 5~ ' '4-.?or
r- - -
~~~~~~~~~ Q z~~ A L I. Li 4 4 . 3.
.4 Z0 4 00 AJ f,
0- ? . 2 7 0 0 01 . 71 .2 .'
1.0
Y4 0
- I136

Z 4% -~ N - 4% 3 NO IN - nJ " O . 0 t
.4 - 4% 00 0.. PO N f4 U O N - 4 %
X%?, 0 3 ?.- % 4 . N 3 =
e% ... O 5 4 ~ 2~ 0.t O
0. N
03 U 0 U.0 1- 34 p. .3 zQ .. ~ 3
N n3 4% n% 0 0 43 4 04 'N
z . 04 4 -J a% ZO AN34 -%4 1.. .0 4
IXX
*~ 3u. 0 z%. m~ z% z4 4% N . 4 . 5*. 4 7 , .~i 7.% %4 4 ~ ~ % %i4 4' 4% '.'
.4 _j
a a
:3 2 2 '2 12 A " ax'2 a - )2
q. .fl 'A .J3 z. .44-
Id A3 -3 ) .3 1>
0137

II.-
10.0 d- . " .E 4l "1-- -. o.0 j 0 -100.0 -a 0 N 0
C4
a'.40 L-4L -wI U. z a.w 0 M. 0
a- -Cl~ 61 a- ZC Z LA.30 7b 0 -P
* I.44
a Ai 3. 41 I z z 11. 3 3. .
S0 '%A N v a
I %L
j-
,,Z _X , .. X, -,J _. oo3., 0 n
-~ Ao XiZZ x 3 0. = .
11-38
, 70 iiiiti i II - .. ... . .. ..n-0 ' "
.6 1
44
13

Ii~P 4P m'A ~ ~ 0. 0 4 - . 4Ii ~e 7% 4 ' . v ' ~ 1~
a-b. 80 O 00 4& 9A. W.0 W a 9 -4 LL. a .8 4- -..
P44%~C 4% a9 0, '4 e a 4 4.uj8.4 usN '4 r 4 ri '40 tO N Z-
ON
a.AAN
.34- J. .%) U . L 3 X1. c4 v.0. n Ln o
0 -D
N 0 C- n Vo - .0 AN 0 -%. Z0 -a .0 e3-~~ 71 n X% j.p 4 . .E ~ %a . .~
*~U8 *~ .& p 4 0 1% 1. 0% . Pd j 0Q-83 N -~
.3 -
AJ 'Z -.3. =a Z M A -
23. '.'X X%0. N4 a. p0 JO -% Za ej
-14 1
-4 4 1 1 a 14 4 4 .4 1.31 Qo' a - n j
4%4
1 0.0
m13

a
a Aft 4p A% 7- J, N r' - 4
.9 1.1 3.3 33LL 0 46 3 - .9 "t j~.4
4'~ ~ ~~~~~1 A ~4% # N 4 ' * r 2 0 3 0
*~~~--4f.'0CF CF,4' 3 0 # O 4'3~.1 _-A 3 %# '0 . N N 3 4
=Ai- Z U.343LQ 'A 3 4J. IN a4 u 31d 3
* j M- '0.2 N -v N 4. f 1 N 4
3.q
Y4 0
40 J, m2 4 .
T. AN 1 _
Z Zl
* - -I .~4 Z 7. 3 3 U 3 Z..4
F- #'A- GDP i3 - - F_ r- r- P0 - 0
.4~2 Ju a2 n 3 i. .2 a0- ~
I-d.2.-)
.43 . - .7 0.2'- 3 14 0 N - ~.'? .
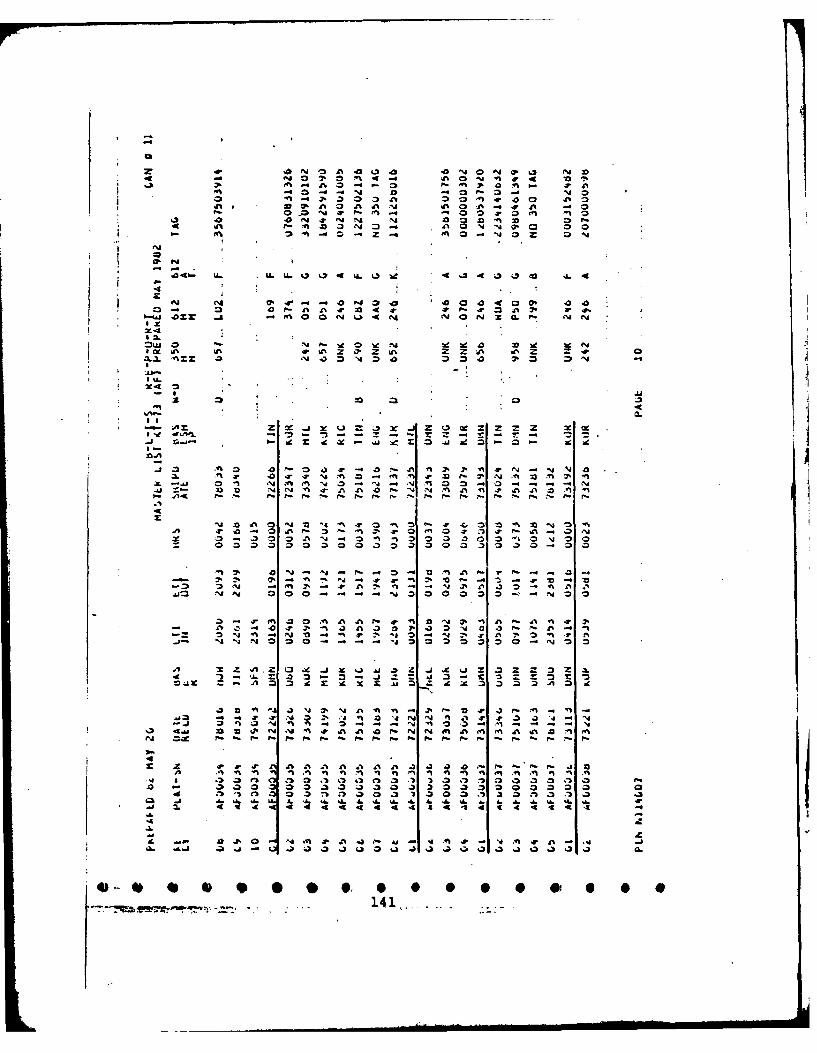
A2 4r J.41 P .0 0 4% 4%
41 oe WN UN 0 - 0 -d z 4
o 4 ) 3 r n A 04 V 40
_0 0 O ~ 0 . 0
*~~~~~~ b.4r .OfA- 4 O N ~ ~ . O N*4 Sr -4
*x Z Z.1ZQ~Z1 Z Z AZ 4
gu..
- a ...
U. 4. U. J6 -4 M. ..2 6 W6 A . A. J
A A4 'r A

.0 4 P-~ 4~% 0 L2 4A % a %CP1 10A
J% JDJ 0% 4%N 'n 1 4024 -
10 %2 L%4 a 0a ON Q.aa3='%4 ^ V . . 3%I m94 -%900
O. 0 0-. . 00 LL. kA a N.4. At Z
3 f4 %4 % n. 04% 0 z 3 n i 0
I U.
44
~u4j ao 4z o~~ ~ N 4N z
,a.l
-j i4%XZ Z- ON le.0 .7 x040 0
a N 0 V 4 0 D *. 0 0 -
12--
I. 2 l1% N 0 ' 4% A a- .-* -03 J, eN.4
.2 0. JI a% 3 N 3 a4 a% 3a 0 3' .%2 4% Q a ' 3-AX % % . .2 Cb 11 2 0 J 3 ., 3 .4% .4% .4% Q % 7 4
A.A. A.A
4
000043 1 -43 33 a~ 4.N O0. N
.9 0 3330 3003 03330100
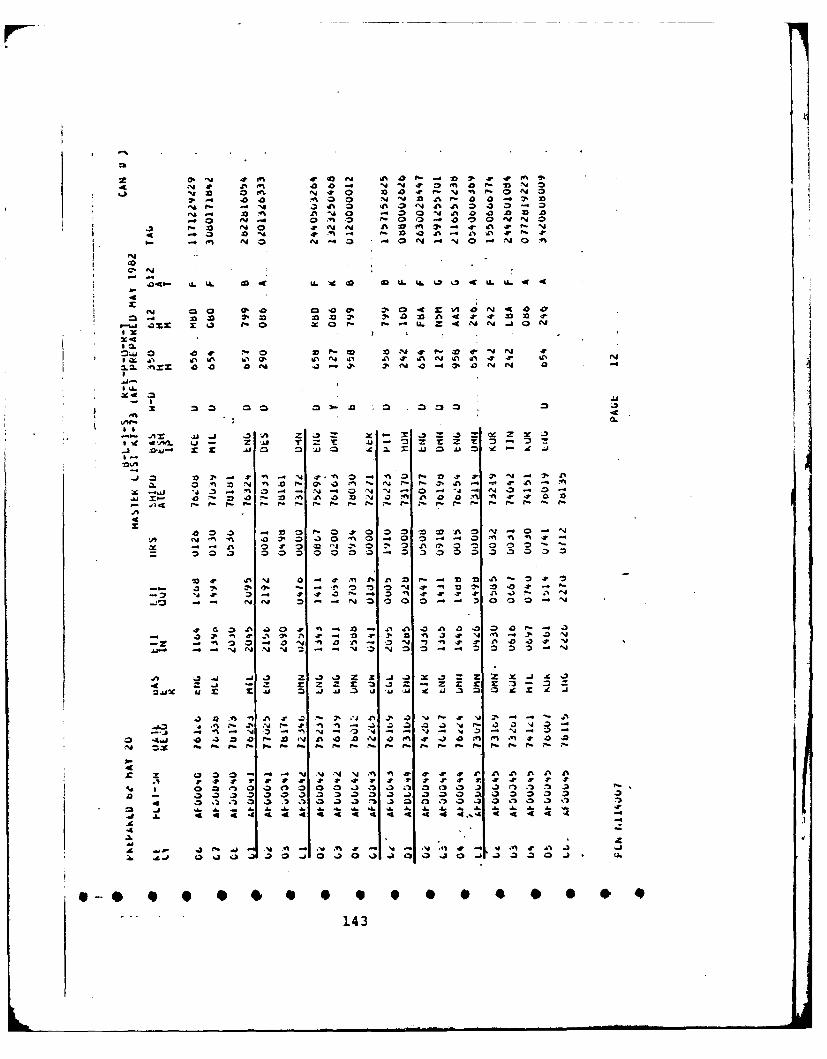
.0 N 4 0340- - a In 0 I 0 -1 14 4 C 0.
39 NC 0 4. N1 4% AN'~3 4% 0. *
4CF -3 -C 40 a~-N C a - a
Q~ Z 4 0 a r- P.w3
XC
1- UN-I % I r -
-4~~4 J .C . -d 2% a444 C 4
* ~ ~ J3 aO 10 N N . Z4 N.
*) 1
Ag - N -N NI . a N 4 ' 4 ~N a a 44
2.0 =X .0 C xN X. r. 3 C n 3 Z
* 4 .x .4.. P
Ar 3 r - r - . -V J . r - I
03 e iJ a* 41 C3 r Z J "1 2- 1
-6~0 A. 6 A. A
33 f 3 4 ~% N ..'W 3 1 ON C 4.. N- 3.c
14

-4aa
-d 0 07. U.- 4 U. . -4A Q ~ km a
a 4 -9 -4 - 0 4 -C ;L. U4- 3 3c 66 4).
ea LA. U.
z :::: n30 0 . a- a.-* N z a. ,a IV
IA.~jj ~ . ~ .00 a A~ A Ca.Ph
f -J
41AE- -- tf I-. ' -'
30 4rfk0 .N O
4. a. .- 0 N
*.)4 ~ 0 3 7 - 0 r 71 4~ . v
0 ra 0 0* 0~ 10 9 %
If z z zuz e - .z. I
.~
'Dad z 00 z a. " A 03a 40P~~~ 4 NA ' 'a. * '
0o 0- 3-- 4 h N 0---iC O O
U~ A. .16 J. .6 -. 7'd' ' ' . 4d .4.
Z 'r A 4p ;4 -4 n 4p -l m 4 -. I
44
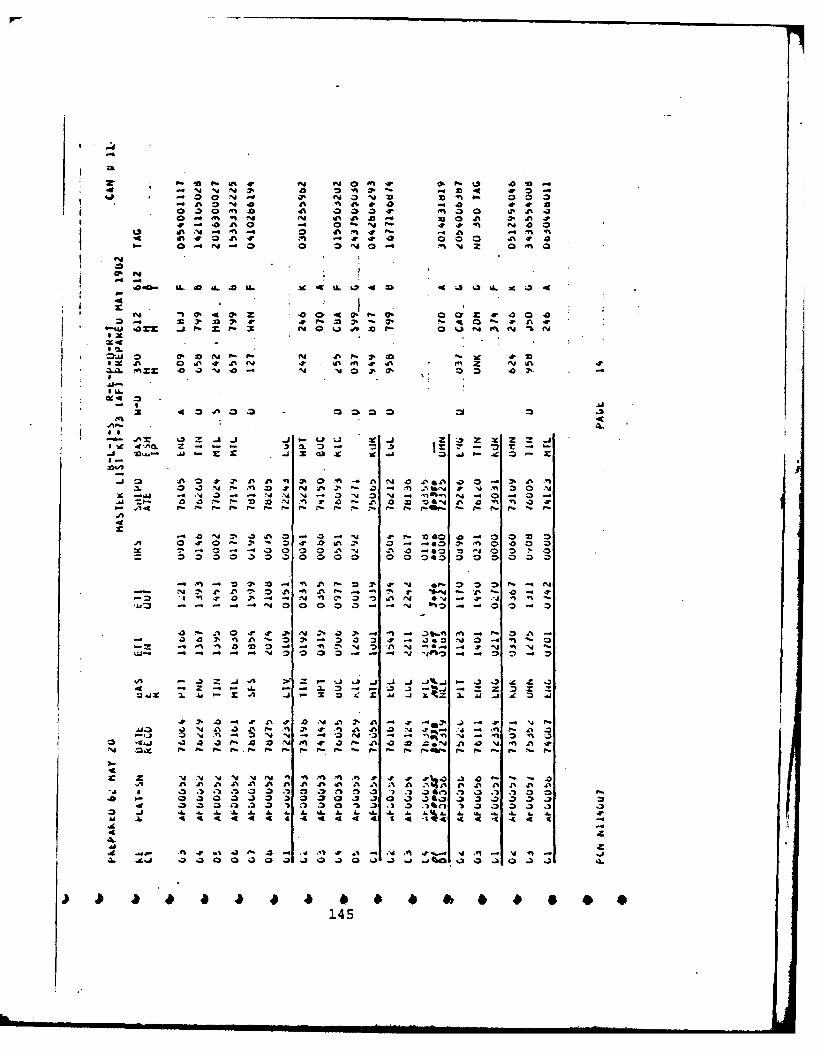
* -* , N N V 0 " 0.*- 44 . 0O30 fl 15 *'%d = -. 4 .
8-4 '% ,, -d N N 4 ,v 4p 4p a 3 A .'
|fm
4p dl N P- 40 0 0w ~.4 Q,-. .. a .
si ov JD r- 0 %.A-4-4 0%0e4 -S C4
0 0 o n 0v 4r 0 f"N Z Oy 4
ox ji
14c
.^a. 4 ...M... .. l l I I.
3- ~ ~ ~ ~ ~ ~ r .0, 32E 7 N0 ' N 4 0 .
-40 0 z
0!0I~~~ 4NO j- - -6 . - - t -
.J~~j A 4, a % 4 1 0 4 .I 0. , .~ Z Z . z 1
3. 3.3 '.4N % 4 10 0% 4r %.d 4 .% 0' AJQ *d3 - - 1N 01 4 -4 r , 14 - 0% - % -2
~~~o 0h .3 .0 - -~ -. 4 0 O N 4 1 ' 0 .
- A, . A. N N . A. A. . %L 6L A. N N . Q~~ . N . & 4
14

ft 0 ~ , 00 '4 *'
g, en 0' rJ 4 0 Ao- 3..J%130
_~ ~~~ -- a- I% a 0 3~J - ~ ' 4ZZ
z. = . .j
.O4j aI~ 4 A 04 U. I N 4A
=K 04. N0 00 0 Z. .al ,M= rmO m ~ a 0 =033.3
0m n % 0 J * u :3 T* - N -3 Z
2.2. ' 0l N 4 . 3 00 P 4.0 N~0 0 'D.
4p 4
.3 Z -.. Z03 z -
.4 r3 1%% f- 4- T' ) .,A3 . n0 -1.3'af3 - ' . . 4 0 . 0 n' 0. ') % IP .' -0 0
1 -UJ .a *' 3 N i - Ad ~% 4 a A J O 4A (4 . ~Ma r- I.- - s sr ~. = i S - l~f- F.- S IS ! I- IS I
14

CL
4 0N AN4 0 04 . 00 . 3.. C
r-04 O N aN A .74 4 a-
fO. 2N N 'IN 0 N ON0
P4
a- 4' .2' %L 9 C. U.4 3 L 49 - 4 4 -C 62 LZ 4
F-44
I C
z~~ 0 4 41 z% x i -j 4' w x D - m4' ~ ~ L 4' 4, 2 41 ~ 4 4 Z X~. 4.
0,3 fl . 3 0 0 0 0 C '' .
'M 1 r4 0 -- A
u 3 00 M M
cq AN 9%AM f
ji o4, -N A - 2 A3 - 3 = ' -'. C.& 13 0 0 -A Z 2j 2 4 Z,
a-4

4 U P4000 P )
A~~~~~~ 44 4 ~ 4 3 P. ~ P l J% a
* 0. 3 '4 Oft ~ ~ 'J -~ 33
QX w1' r4 N . ~ '4 - -
1.4
"4 kn ~0 0 6A 4A J^ 40
CL. 4Z J.g-0A 3- 303 P
2.4c
3~~~~~~ 4% 30A'A" 4 A A .1 ~ 'AP
I..71
x 6U
4 j i.'- 54 X4 3 ac IC 3 j
F- F-
AA P. - t .4 39 A .1 0 4' 4 A - .4
4
.2 .
.43 A 3 000 .j - 4% 1480
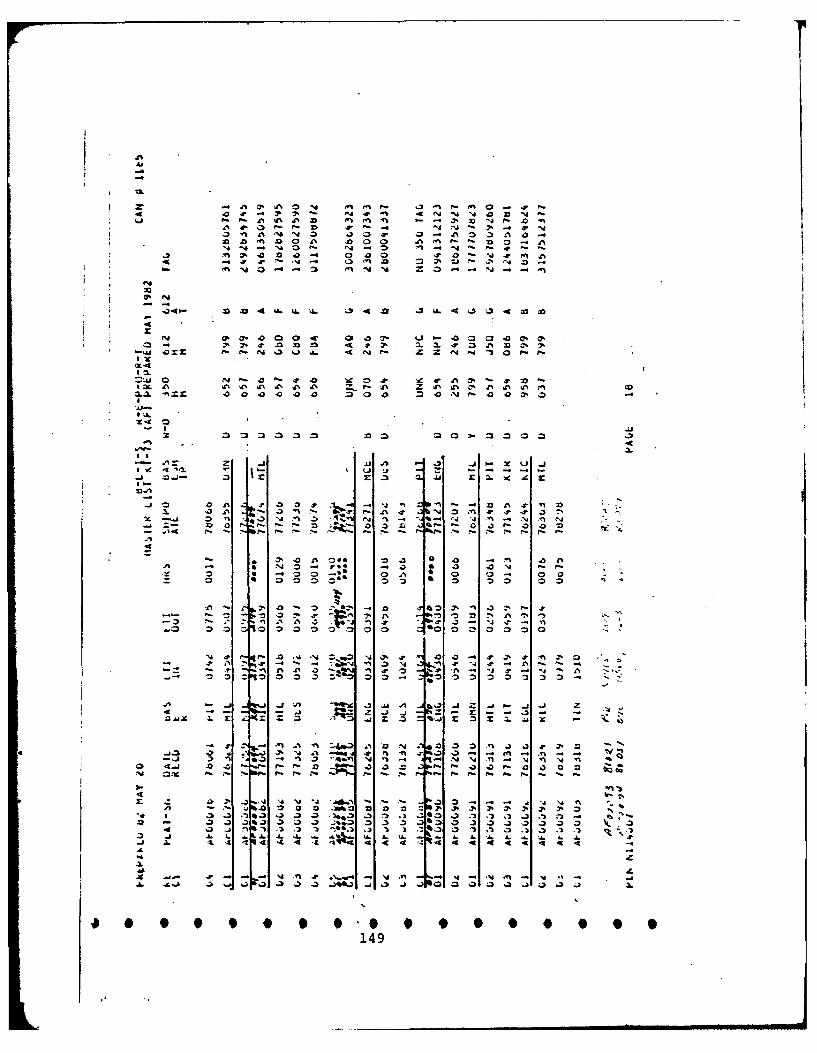
4%1.b
.- U
=L. N ' 494 CD0 1 4 4 - . ~ -Jt 04 =. 3Fr C% 4 r- -J% -J .'J -3 -.
-4 Z: lb3 M- A4 4 49. 'n~ 3X% .4Z.0. . 00M. .'. '4. r r -
P- 40 01' 35 -J ~ 03 r49 .0 'D ~
44
z ~~~-ooon 0.03 .00033.3.40.04 6t3n 4* N.. 34 .0
1 -% 1%Z X%4 .3 -. 4. 'r ! Z 4 40 9.
Z'.2
t~. 4 494' 4. 2% UL Ar- 4 . A. . 4
* 9149

0 ~NP'MPE0 ~N. :!M40NN
13-' 00M0ON~O Q 4 -m mNMN 0 N 4 ON NV
Z 3 % 0 - N-- -0 NOP NNN we0~0 N0t'j-00O0
3fl0 N a 0 0
o 0
0a
4 * K oLf LL &L
mflmfl On. q. OO I 0 N 0 ILuv Q 00 0
NNM A NwoN cp 00 0.OW M P Vqo z 0 M M0 N4~ 'a mmilO.N.
3d L.~~~AaE3 Z N Q E ~ -
Ix J nNM M fiN 'v N- 0 mN0Nmmfl3N~Mfl M 4 -1 0 E.~lyOFyr f)Emf(l3vn.O
N NM m M4N _C N N .3 ~ f~~ Nf 3 lf-d 0 _ UmCON
ON~~~~~ '3O!d O.O0 E .A 3.ZI.J 0 ~ N 0 N N 0 0 N ~ .-. I~ O - 0 2 0 N N N N NN=CJ
62 l- 013 0
-~ NN 0MN-
Nn ONNONN41 Ifq 00001- TeOO q 03.aE OM-
az 401Q013000000 ,000MV000000000000000fl00000 00 1)000 000
>.j Z £ >S£ >&Z D_')S >"£' S aS S S£ £ £ Z 4 >
4 944Lt64
O 0.~ 'CILUm3 4~10 0MIL4
0L- Oky IUJI.0 4mV%3
j .P 'P.4 3'33 -V0 4 00 U4l I' am00 04 -9 ' a 14
LL1*
- .CNN~'M NLJq ~~JJ UftNU inXQiNW-WQ)Ut3 Uk. .JNWA~.
~ 0 2 22".. 11 w NO...4( N-PIO~3'-I 0N- 03 ~ 0 00fjme0n
U ~ ~ ~ Q N O0 3~ Na pNr-NNJ0oC.w. NZQ1NNQ0DC
u*uww ul
0 I 0 J O
02- -u 0u~om~m. N ONO 11 N u-..N w0 W,3Nm i0 l 03'w..N0N3'. Q w Q NN QP0I w0 3NON QO
3 i0 d U uM0Ilu0% r 1 r NA aaNGg alJN t).&N ) l uNJ f 2h0J N o N N ) t
v 0 0000 000000000000-000000-.--0000-000-0000
0 'A e4 UOU O O OOJJ wo .jNNN NNNNNNN
-1.l0l0 C3 000e 000 11V 10000 ) ') 000,l 0000 C.00m 000030000 00 000 000
150

*V N 2r -NI'IN q~O. nF7 111(yi(.~ 0- N
iflll0 NU~ ONN GPN WN~Q N 01 7- NI. 4~ 0
0 0N 0100 0Oz zQ NZN 0 NE4-NNNoj N N 0 NMN zeN N~0 INot-N
~~Imo vz oc - :4Oi @N=Noom..
ft*000F)N. N ' 4 Fl
0-sf N N N jNn N
N :.0~e I - (ID404 mF~ ~ l 04F4 il 04,.) N0@ e.0 Jo C. O4 4 O O e0y 44 3 0
41- -0 O _mFplo NNG4 . ON N -- -- 10 - 0. 01 -O U0- ?10
a-. N -)-.04F o4N ot N F~ 4C 40W M NP.4Fl fl04 l 01 ?.wnN - N
0I M 0 0 NN 0 N -. 0~ 0 N C.0N'JO40
Az NM N.N ON m Mr) 44NVowoN3N00Fl 0 ~ 0 4 00OO O,3?N
4.NN340IN 4FON4q no t 4 Q) mf0 I0.N~ m (PO N 0 Lpow 4rrl - JU IP )y P) N~4l0 NF.) rluNNO40Fl P?00W N4N 0.44AA
4LL N .04 N m r-N 00t3.DF-Na N N 0 4 ON NN JO O ON
M .1 -I~dL N KN4LJ N N0qinpno4 NU44wNw MOULPI a2~ 0 " P40~ 0awC. 'NNNO-l..00./I4N 0n-t--flU 0Nmmfl0Fl N IlOlN'lI -NN F
0LJ ~ mq N '4N N%0V1NNE m44N N OltN. 0400-OJ4 .r'NIO .'I NwaI 000 "1000000000000O 000000 000000000000i020
= n Z;Z MN- *02 *mOuq 4M0 = 404K-ZVN lNa
*4Pon l N m N~~n
I IL 4~0 I3~t~U~u 4qa.4~ 0 ~ ~ &~0 uu..~Ju. O 2N
LL 61.J3 n 0 0 .4.. 0'e~j. .. . 01 N0 0~4 40~ Na:;UL cuJ,4Nw (J Mj0 0 4 4t, 0F ~ iU , 0N -. ,. 110 4f 0 lj44'iI lP4
4UMI " IVWJ4c nj~~ Q~owwoWO L uja~ua 0 W~o PJLII. U v
U. I LJN4N*A 4.JNNV ~kv uL~4~I VA44 £ N N LI...N% 'Iu .j
%L No,~o OOOMNUO.r Nou I~.Jo -mN fn 4~ N7" 0~~(~ I~ 0Nm Mm N NVOC N N 0000 I 0wJ~ IJSJJN o ) 40 4 N: 02)4 N . QN.U N, ol N U
QI. Z N 04 0 WO O Wt#I N WF P. , u W ; N P2 % I(qu OI'N avl 31 r, G 4laN I
.'i 'vO'J OC.)N, W5 OULQ0.0000ao 0 a .sl0-J&1 J ) 4 4 T N 4) W~fN InIn . ' :t . " 4NF, L ) . . NpI t P i r
w 4
't44444 4
4u44444.t.L44E444V4C4:444%4(:4; 444444444 40.N- z z w 0 N - NLAI I L L .L .L U .I.AI.A h..L.1..I PUI .LU. N.l
"Mrip lC,14 l lF F M j l Fl 1
F FlOlFIOl N 7V-cau- t osmm o m C4r onu~i
XN N N NCN- CCN-CNCCCC-CN-CN N-CN N CN N C. N
In cla )~oc~oo oo L.034300 151co u0 ( IIJ01
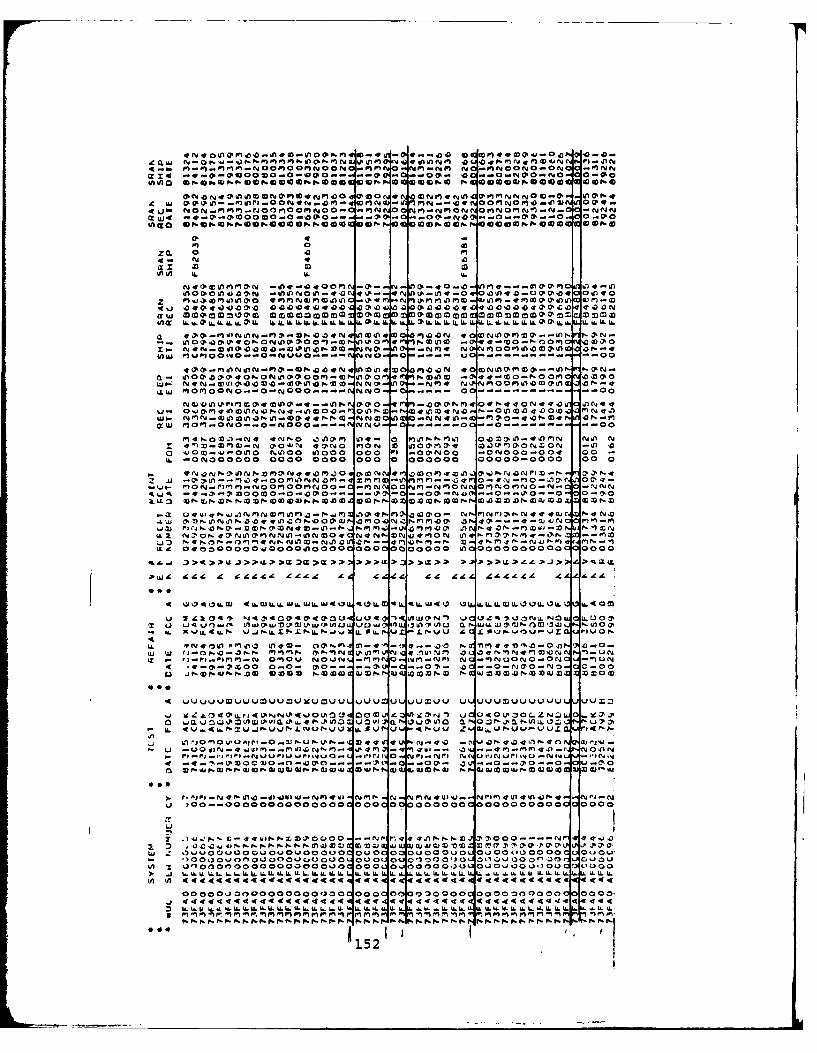
ON* -0OOM04Q
In
. e.... 0 .- 0- -00 ON of 0 NN- N; -00. 1, .... 0.NoO. 0;00
47 N N v 0~ - P~- f 0i90,0P~
40 0 ; g !j No o N 0 F 0 N 0 O . MP N I. ~ 0 pw ,N IN U fpy - N ... N N
~U)4 . -0. C 0C -0 0 0. ON O.N OM ... 0 . - N-O
gh~ QNCNQ MSCC S Q IN, CC N A Coo N Q C 0. N
'0 0=-0ONOO 0 0 .0 OWCN c apO ww"N00 9 F
N 4 Q
n E O .0 to-
zv w N0O0~0 ~ om~0 "00 "OW~ 00000
W( Ov Iiu.O L4&0s.O Id 2f&ILh womLIL &L T T 'LIm. W 4 ILLL@ww Ow L &.L .U
*J .. 0 z M0 N NM 0 ;0 F. 4,0 : C ,. 0 aMON *ONOOO--*lnm I'N-moo Ol000IVO~N NO 300M..ON iaPP0ME, NOfOM g E0 N 0f0 .0~
Is-~M,, NE..iO O O 4 0 N 0 0N) N P 0 0 flO N3I0-N
aw MOM PONO~-NJ coJ 0-- ;No 0
400MO NsfNO - .P 00- -t- NO N W-~.n0 p .N 7. .~fOi0-N .- NM
~ iO0004~.O ia000 .O mflO 0 '4 N Mfl - ozm(.Ov ~ .mN
C3 4OM PI:00N 0.0-N q-fNo 00z0 O 00nlv OENE ONZEON 0 4)EQ. N0,00f00. . 00 00 cNoo ) 0 alo .. Nfo4 Go0~fl3
L6I r%00 00 -g NNO 0 g.J~~~~ 00004i N JNEf00,D0 00lN N 0dq00 -0if00 .000 7~4
aJ 'N 1fl,-%00 4. N MN -N-i- 0-mmc4cN.loy W oo Noo N. O~ - - 0 0 N N
0 U 0.j- Otfl0o'c CIOO LpOO 00 Pb ONO - N 0 0 00 -n o Il
az 0N0000 0000o 0000 000 00000 00 00000 0 00 00 0
'V 0 0 ' , 4 w w w Ufif. .. wN .7 fto, ftiLO..o00 0 N P1NP)3Pt.Q 4OJ EN
m..J 4 w N .0N0N0..If ..N US- w - IQ1bO mA wE v 4 -,r p-1AN
LL 4 10 t0' a ~m0 .NfO *1 0;:3~b o m0 0 0 N ~ 4.JP 'IL ( 1,4:N M 0.o o o u oo a oo 00 In 0000 m0 ! m v 00 00 000 000
-t~0U1M 0-0e- 00.P - -' #--3.3,-No C. fl0*0'3-U J-N -avP COO=~P OPN 00IVW N QW .1 zNl Q 3 A3N~PJP0O P~U
-IwA U-O l.J~ ~~~~~~~ J00Oif..0.NN 047 0 N4. (710..E NE ,P
- PP Fi N -.N,0( 9)U 'lPU'J.J VIA) Z NMNJ 0; b. ~ ;NP U W ; PIM4 O0P%,U NS - l'iN mu 00 coo000fl0 0. oco co 000000 .3 -... 0.... o0-...0 j-0
V'0 0 W N.W ~ S OWN 0 oooONGJo '10 0%)oNO OJ C,0W'UJA 00 3 0c c
0 1 )0000 a000000000000000000 0000000
0f0x )00000000000000000 000 0 000 0 0 0 0u0.0U 0 00000
.,4 44444 444 4 444 444444444 444444 4, LL &&Lm. I & L LL L L .U..ILL .. WLLWU . LL LLL S.L U..ILU. IL.L 9. U. . . IAL
NP. N N P,P PN N N NNNNN N NP .P .P -N N P.N P. NN t. NNN PP .. NNNNN NN
152

APPENDIX C
K051 LOGISTIC SUPPORT COST BREAKDOWN
153
Explanation. The appendix contains extracts from the K051
Logistic Support Cost Breakdown for the A-7D MDS and WUC
73FAO (first column). The cost data (presented in dollars)
represent quarterly totals for the quarter indicated by the
"as of" date in the top left corner of each page. The data
for trouble-shooting costs were found by locating the WUC
73FAO in column 1, verified by the noun "Unit Inertial M"
in column 2, and looking under the column labeled "Field
Maint." Transportation costs were found in the same way
under the column labeled "Pack-Ship Cost." The entries
used are identified by an "X" in the left-hand margin of each
page.
154

=I LLI c Ce--LC
W.- j IC"Ii
0A or aIf a
wo-
I".-0~ 0- 4o'. =3~~0 C:0 rQ~ 0 OnqCX'
4 ~drf-js ul wi~j -aiI I W LL -I - A .
ujQ .. -A45.~~c,. V.m4 sA;: s I
4.J4- oz
~-t A
Li i..u~i~u.u. ~I&Ia.&I~il.L~I..La tj 1.C

- ~ "CI
An.* Io
I S
vp Ito~i
'I: I *AA &n I- =
JW Cwv .
Vo 2. *J2 la-
*I; ~ -~ w t I ;v
(f' -- ai
IAA I:LJwtu~-C I * I l
~t~-i ~ * I156

-I I I
to vz 0%O . tt.
S f m
- 04
I6 r .
V) w to. fA~4 f*ttr fr
- j w C- P Vila*
W!tC V.V V C- o 9 5bz1.I 1-%Malco W. t
:U CH L '2L.; 0 ea ~ USt~WItU
ku ft M.I W.W
157
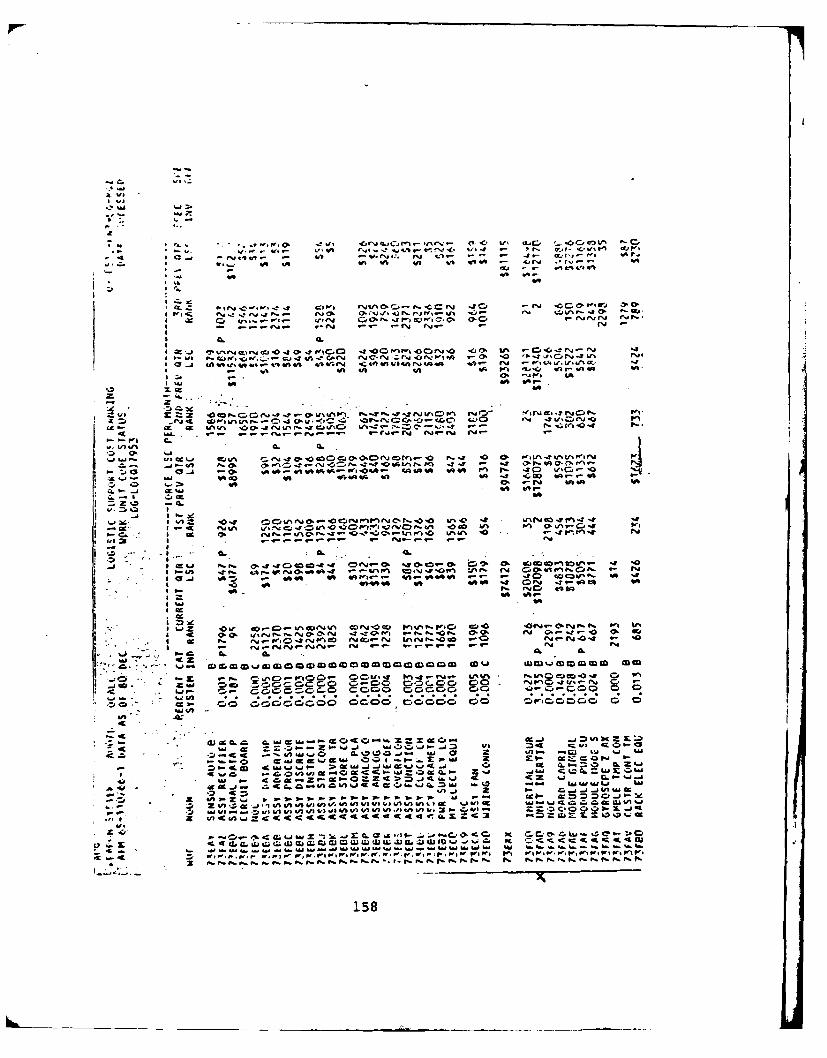
0- GV.
* ~ Wl f.. '.. ^j f.. .WI., ~ .. ~ rr~- 0~ V .C.
0-V - i' CL) .= W. - - C%j CO . j -, j' '-0 -Z vi C' 1 .j % (
ul -er W1 .*f CC. ... ff iI- t
Z * O w%1 --' cp If -:Ol Vi .O C*'O0 94 0 Q..0 If Q O'. s~ .Lf;.4
xI m V% tUI-i Y V, r- ci- C .J.x. . \ I;-. - -.; (Is 'C r .t I
I, . - I- . -A..- - U~ M. In IN- fSJ *'- r '
_j 0..0 oo, 4 ' WI-Q a' o W% In0 VCID 64 :Aca w~~I a ea
S K "InCeb' n I W%' - n- -
.j I.. O.ciga - ta JI r em04 a. %jr 0..uu_ .
'nw I. 0% '-;;7L : O-tv41'.J fj.-' Ii jP'0 -Ca C;' t ll aI a eJ .' 40 to I. rr %0 COW r -0- r
410 .. 0' '1,.
* *A
It 00 % C.0 0 00.C a - C w. "I O 0 -.001- C 0. Q " C.O: r-0 12
*v .u rj-- - - -C - =~ - - FM I%,
go-c - 0.S0 .r_ MC4 0 IV , jI - NJd Co
- C 0~Jaa C 0 Q Q.a 0Zt.J.
CC 13. Z a. mi w w1 W. 0a crKM% I
. a1Z' z vi zwckgw
4; p- C =4z Id A / I I- OI - mnd Z-9 >M' Id) t .l'Id .2- w 4d C6 -J'C 00 -~
3 atC-
42In -- z " ' 4 , aInz158 Ltu%

'i ~ ~ ~ m -r &n IliV~4 U(~ ~4*4*W%4 ev. !*~ U. 10 go * . 'oa 'soo . P,4 c
%AA %90 4AW 1% 0"A 64
(71 dot. IV
F ~ q 4 u L^- en 4'NS0f. S .%0 '0 ON,4A %64 -O ''"
cI &-I P- Z
S K -a tv. -j4SS it W, w . SSM W.
#-C. %J. 44NJ O e-.4 ) 4A
C- NP
-~ ' 4.L- Q. 6, 4A IV~9
-0. - -CC.~~~ '.) iv 2 .I C
.c ~ ~ ~ ~ ~ F F"..Z ~ . W..O K0 I~-
*~5
x-~*J

W4 I1( 1 tpI* iI4 1 A " 010 4C> 4 1
I to
I, j L 0
I ujL A t
1 0.u
to- 6*.0 q- 0~ -'.-1 0 OU)E-t 0 c ot&%AI w r- fv- .1
i " I Fn &-j-~I I IA C
*a I i
0. 1 __a r
' 1 Z 0~ - i*JD-a.
of g
04 we. B1 0 C
160

rt C
I WJ
Q. .
'-4A
Ci
0.
*u
o:v to44^04
4a~
WI. oc1p~lc) Y.ODCDOC~ - ~01 - 0
a.V% w 4A to401 %w" "01 t~~~1e 9"t- UN tv g
5-40 &4j
a~mina.
C. I -J i
40 ~# 4 i"" '- IOD 4A W% V
cc, q- 44
- I 40e 51101 01 10 a- a.O 0D4OS(I - WM1 -e--t'or - .'jw
*, da 0: %e~tOVW L, .. Ful Z eA01- a u"s4 3.2. su .
go, 1 01 c DW-
I-- Z .-- 3.010 01 .31- 01 X- "I5. " N0-'. ! Nff I".0W A n 1 ,W W z-jrcs a1 Il 40
4C
0 a. cy WI-.D4..Joc 0wwt 0 l ol 20 4-%SL a 0 W40 %wmzmCI
W~Ii 4.I'.IW4jUJ iwus l . '. U. .U- &i N6W .WIA. b.iI AI. U. UIiI. '. t&.IU. U. U6.t
161

91JA .I
a 01
IL I Mvs'Ao I I*C
ill-ri WtVo I401 on 4^ a 4A CooI
10. 6-% 0
4A 40o fA 4,W4,10% %e W
I----X1--4a-- -. .z -, u0-a -j a~he~.1 0. Q. ta In~-o
,- P-.U W~ P- z w us 0 w G 2 fA OIL on me I..E
7r" 4w~ M A. - a z 1 .d4c ' M, J;. us
49 flI0S 'S I - , 91 4c Ia Am A" U . %D
2",J M - .Z
21 -C 90.' .M DC D9 9 0C2 IM Jo .a 9C 0Q4
162
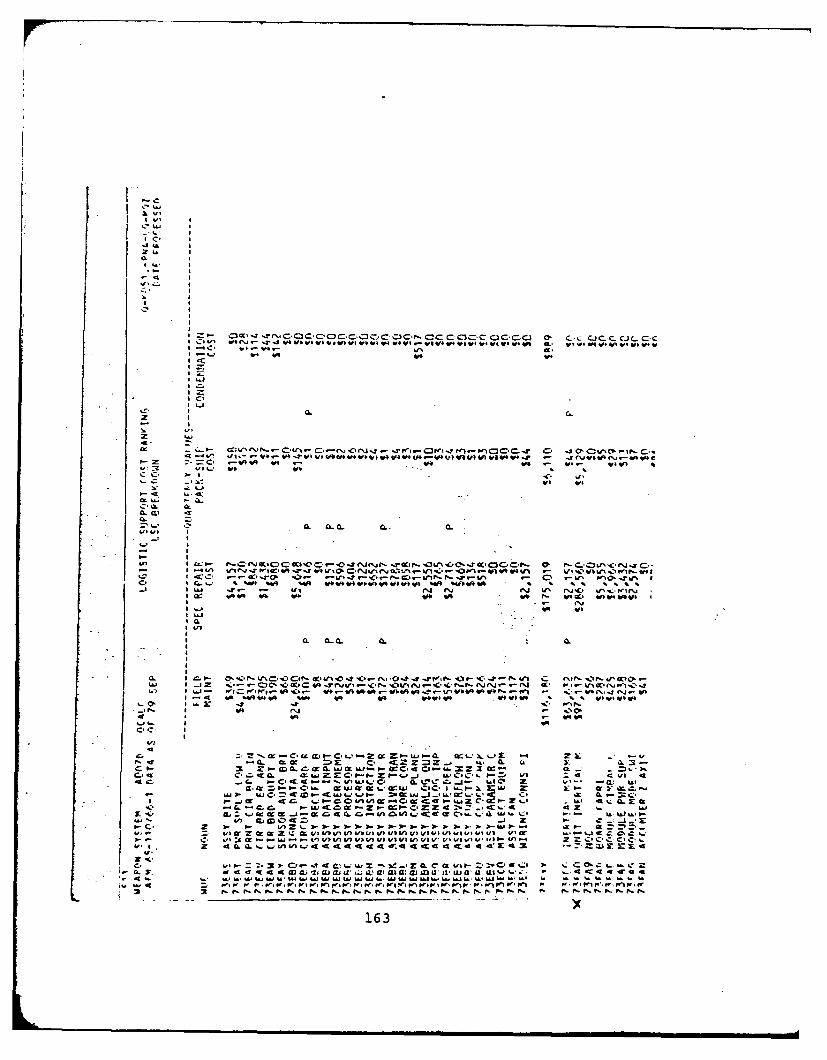
C. %W
ox.'
cc C. .- gW.S Ln I- C.cL oNcC. .*c fi ll Fool PooC3Cc cCc CJC C3 JL f C,.- C '.- u" 'r4 , bw .o %%
c
0. C0.
0. 4LQ1a. C
A- .. ,- Cu ~r....i'C u-)o . - .- r o (J.4 , raa r'fC 'I.C'_4 %ne,' IT~- V14C. ohn -**V4 .Co Mtt J ~ i ak~'I in 4Ctm.V 4j)fOW) V 14 WAn V4- -1 C'.VI ( - to VI
Az :c W)~b .4 601 %A IA I. I I %
0. CLCL C
-o, VI I oC
:_ al5-. CA 4
C- 0.' C'0. M'-' rJ4joj. mrfl zOI rz w. M~- 0A. 'M AV -9 IjCC- m . C u o-,a.s. r-C a. I a - L., 7A C~e, s % I-u' I- zt~. 0.- w0 ' _j Vb k A 1- 7 vs All a1 1 )u~ cii
C_- --O 'C, , C- - r4.AP.--I N N .J. C- 0L .- u-' Co0.t* Sa o -Q.C - -C k.... Cc '.V Wq a:I I~qA *SA, V orO I '. C. C .I I~ X
Si 4 "i. 4a.- U. L" _*.. _. " U" A_.'C 11.*.i*~~ - I. IA -z zA 46 A N ~a, VVbCc 4c- 11, Z ,' -W -1% C. r
I or. ooc w y!Pslp .Z am 1L LAt CC C Z4KC n4 nA-<arc . U1U
1I4 -o P-1 * LWC 144, -1 r a.t.-'N 'OAI , A~ Z- . aJ .:A' lo. -A:oX -1J -9I i. -o. f..*V9III 4 AA -,bqAVN ii 4 .s *'~. '~
*~~ -W W LAJW4~ *.Jff LAJ 84 W~ "ALI- VI W" "I - I ' IWse,' I W. .4 oo 3 ,C Pr iPo- lF WpIN-W r el NW l ,W to oIW o r W o o ,0fo- PS r-F oI N P N -P _flf ,r o o ,f ,f NIP ,Fo.Nro ,f P I@ r o
4 5 IAI- 163

C.,
z a.
I -on 4-J44 4 F-A Vtw 0bk f %W 4 A-0 - e
0- 1.0 to.de9
C- at -C
0-- O =t V
=A = A.
Lu
an woi4 0I0%00 0 4 0% #-Zj IC
-J 40 a. 7, or- W %t Vt Mi- -W4 UI NV oc
-j % a
CD P.ai . 8..- Zx o -i -J 4z i carc
A oW) jC C-A% 4-1,~tf a0 W, Cbag z A i-. to W 0 W..vnVAVA uA jC :% cu 01F- .U zA tZ- aVt7 C im t W W L 4t-- ~ I- )I-e' QA tA n J - t Wt 0~ IC~ 0-~ Z i ) - Z L- I'js W' 0 %X~ IL X.~ Wt -s AC x ,- - 1 _.' =gA ~ zp4 Vttoztt~ Z4 ~ ='.bQ0 L-04 -C z tt Vtj 'Vj~ IL tt~ IL W
.I VI. ~- - 4z ~ INJ 0fs j-21' A . -. b. uh Vt W I--O cc U4- Z o- arMZCC
C>J Gn &- nL)V r nV 4 -4 n32 L) t C- 0 4 oc W lCC
4 10cox-) cW r. 4ZZ. Kr CC 3,c O #a. a.j U.-mf V000 a)CV W %
r- P- 1 , r F P- r F f F N.A) 0 #- f%.3^. .AA 2K. P," F W440 P 1.P
A 00a.4F-e.J.A-.., .JW4~a~1644

Z CL
I emI~
r IL
-- C to to: A4 0WA AW i CjtIi CL >1 XI toV) x i w 0J 0.1~ -~C..b- ~uI. s ~ ~f\0 U 0~'- -~0t~ O('~0Oon-
I.-~ U.
CLJ AX0
05P-ir_-L~fr.
'w 14 VAt A WI f0~C 1 0-
I~ Ir
lid I 'U
Qc 0-C waCC4- -, oo Ou' ?l = = =
0. ~ ~~~~ ~ ~ ~ 4^ cy z C:a. JI - A Z a
uj Z4,E VC aa. A165n

CD.
o~wo
- 4n V* #AN 1 P 04 l
C^ 4
0 4L
"Z I
ZI ISL% o t.
~~J0.~~ 5- .. 0 0 0 U.
m. $~ _ju Z g Ol~ Q ,i 40 F N. rk a4- 0W% . - ~ .0 W% v. aNw DW. a'.an .- r- W %OWN" CW
a-a >40 '0 w v0 4R0 . "I *..-V
_.j I.J %F lo .i 0W40 'A-p
a-C & 2svp _j w>S- 0 J 4 ju - c4 .a
16 C3 JW za Qww4 0 0 ILC
-i -a .- 4 4a -A.V... b.. Sf 'o - I' '0V r4 . low_ .. a ! -j -a - WAgus0-4 Sj P0 I.-. 0c ad. !;~fl. N'S C,-t Ov'Vc V
C>.. S..S^ CA 0. V) 4qc 9 49 aV ME IO-J SS -M CL 9a' 0 4- - Uh . 4.4. w~E1 a W.0 0E6 w 2"m "40 '9 TV x Coa aw z&ow o
om o w 0 C444CDIaqn 0aQA Z bzaaar lw
tr WA 19f%* %P 1 nO l r O )ol r W np nnpr Nr tw %w %w No %W o nFW f ni
S p 166

Q c,
U, I
0-C 04 o I I r
cc~ i CiLA cc
svs a I
04oa z; Irw 1 i no ~ b0 I6 C L%4 I1 " % % b % f
r.I~~~ Kf Ko4 o4
a4"
4140 a. ^; Iof
CD0 I A 1 2 c I J I LI,I z fi c rntoI . awA3 EE IL)KA " i i "
C~ w 0 - de W 00 J W " I q
I. iiJ : -C 4L WE i ~ u C'i. -1c 94 , a D3 ~* 3,-. S..
167 c sa

I .ct A
QG.
A' *QcIfW4,
%6%
=0 I- II
0) -1 - W
Cc ju i4
ow 1 1-3 i".m :. m
COC-4&,c g Woc -4. -M - 4 c%
W: p moIMimIpFPt d FI.P.9.f.Fl NF~ T68

_jI. w
.j-A ttol4 ito W 0 46;Av vtA0-..t wto W
:C. I
c
Cc . 7.Co
I C)
W% -. ovC 0iDn - sC ), (p ' sC,0 o
: wyr - 40
4040 oh, % 40# -4 0 #
c_ le %.. .j Z_ c9 n&1-3.3-b
~w I-
InZ I j I ^C cc
~~~.~ ccl ccl- _je'. Wc~ 4c C- w** _t. o o -a of-.~s' _jr.- _j Cc CC'% Cif ox fx -jMCL
o-n Ij 0 .- - 7-cc =NJ0 VI Mo. i 0.,.- 09 _l. , ,.Jd a- 0: P.. ~wi .z ,=C I.- Z " -4c- m zIz - & . C": -1
V)( 4A a. 4A .j 4. V..V 4c4-ar rtZ. 4- W .V cc V. r_ V.4 cC Z r0 C L: .e- IV / o o0C 3. -C a Vr.CC4c0 - C4; -C-q o
z ~ ~ ~ ~ V V.A 4 =Z EX 0 W..~t
I0 qxsU) o010w4w2C OQ n0a.1 IWW 0 4 - 9- - C- C- j% -Co MZ Z4 Zi ) Z
www ww im 4 SUin . 1 .1 wU.1 ., -&
I o W0. ,W nW l PnW lW viPoltW nWiW Io . nW .P, W ,w ,W ,W
In169
........ .

* a
Ia.
owo
I .1.W
I I
too ~ - o oc o'~-oo o 0 '
ag CL-a, I
I2
I-. 4L
0~g W 0.at ~ eq_) I CLe Wq %44 eqqt Weq #A qe eq Mo qeq# fAqqe* WI40
oato
IL 4
wla a. a.4 r A0 "- n0N *fIA lrt 0
4- &fC. 0
I.-I., I- W - L - W WC
uaW 3 WQa. a.O-c a. Z =
a.0 a,-Q Ao 4C00 OGC0P -zU iP- E~ 0 L%J li z V W'V'
up j I.-
3poG nwi w wa-~ wjo I.0Ae~a .,~-~ w .JA AS 'a0
1cu I-~a J zeqzqaeq4I&.iO4W4D W i W l*~~D o ..js-e Wq W0 4c IcI.a c- O
.0 Ww ww 4"1"eq~e eqqAU lI &I #- 6L 4420t.0&00eqn on "I Q a w 44 4 4 4 44 4 aa K FnMI NW o nPttMM 1nW AW W W )W) W nM* % OLPOf
170

C..
IJ Z
%0,
40 "t .- C W'0
4 4 3' 10l f
u- t0:A M o
co C0
In ..a ...... 0
Ow. I
"M I
4~-44
IS& W
~ a ~ oAL 0.o- ooc
~4. I PONJ 40. C4,* *ajr. I - UNa 10 -~ W r-
C. -C= - R& wj
1.- a.;. .C^ WWI- a$.
C;P- PSL P -OTTO-
400 Soc a w a w0 a
W cc zg ow M-D.Y wws~ ~a SA9 E ~ M 2 .. )l adz ESZZ Ka22I.4K 02 Wl4.-y I.m WOu- j.0j. j
ILX . db 4YS 4dlhO U 0.UbIJ l-0la a aa : 0a.2hZ0 Utn . wk S W%.J.I on .jonZ on wn m V% 01
KSz~'P~XdI ~Z W MW0.l- 0171)Vl44.

a
Ie
Vwt
.0
a
-1 IL 4LI ~ eI- a
4.j 49 InD4.r 00a 4 C %-I.. SE --
I WOI ~ z; .'
CLa ac A wC, fA - ~ %hIt~00 -0'V~ O O 0 O O 0
: q-# -AI II n I . In n I nI nI n nI I n I I J-I nI n nI nI nI nI I
wo0In0 V I~CLGo.*0 e
4n In CCA
dc Va PNr J W %-jz WWapr o CI "~nn n% - nf 04 A.
km Iw CI- =*d %I 401
upf 0 0 a a_j 1010
-404a
0 I wA - =. I- 49 wwo -0 o
Ob. W - -*.F
40 - . "" " .. ~ drA .. z DGo. I Ai ot n CAv 1i -04 000O4I C3
n 'n~ In ImFfn in pn n M n~ IMo p n I n n W S w N0 WN o~n n n pmw .
a ft. I F r t N. .Pn f. %P
.172 a I

IIi-i
I- z
tooto
a. 0 a 40944
Ome .1
s-C a
C3 a..P, s o on -0WD 00%m s
£SJ0 o- S
I~ * l a. A4 o 44 0g
at ai d t-j- j %
oat. a -. 4ww00-P
o f - oa di IImt aL ant - a a -a-A .4D 9L Z1~ I" N 60iW -40 W -j 4
oa n I.. m qt '
a.bA a a S
- a
P. P. a.f .F tF .
* e..173

LiLW% c
*iz aj - eO, 4m- cca-
at% a9
CP I.
II
.0 vS0 Ww,~~ D%ac4 LA in - 04,14 " % %f*%"
to (Aa n .-41J toa toi
2 LP
&&0IL C CL 44O.J.& L 9&4d& . L (
4L I .- F . .0 .noaP J-r00IO- .WyW %C . , . ~nk i ' f-
owta
dcj aw -a- 4z tta >0oMaJr
Ow a'~ Q9;44ow.in=-P actui0'GVU Ool-w Pu i. z a% '0 CC.,
0 a - P.- a i -~i-% P j e % b P b04 9P dc 4 4 - za W.i a 6 j i%1. a 4dc 3 iin in inn.-niinni inin f.i i - z %nV
so I- in ino in =4Oaa
3.- aa-0 a a 0..40.. .0.4.0t - .. . 2P0p -c4.4.4 0.0.4..J~~pdl Z. 4.0. . . .4 w 0.0 .0
in adc. 9- c4 ec cd 1 c CC<
ww wwWww0w0o a AIMp . P3P nMolF "W Ao nF(vn*onW VW 1-sW0 np P n0 o n F npn0
0. a a a~-. J-.-aI00- Qale.~U~~a~Nie~Qa~i~1704r'o-

.
If
0 I 4 - 40 CCo
- W4
04 4 '
c .2.
04)~ron ev
Ow -o4.1 4
4A4
z f*, I 9^lo nc o, Of l~.%
ew s*, 40fInon:w-
*% .1~ No~~ ot o* Q* .4 64 4A 40 I&4 DV 0 . .0 -- f% fw
x acJ ;1 04 g
j -0 4c o 4. o0 w
0o z 64 jo 0u Cc
j o.- )a~%.fl% '- 0 A.- b- "a0 O 0 0 0 0-a==Ow w4
La c .5 jP 0' *a" I=x
agat4 .4 a .4 0 0. w44.1 az a a 3~*1. a
vs L4 0j 3. _ o aa04 a4 .
z4 4L v .4
L ~ W 02.5 'n Fn *5 3 - -.A45.-f ., po on- n p np P no o
0 .13 ~0U"X ~-aJ KOK 4M'175X

4-.4
6 S
-.1 C,' Q- -I 4.
7) .
I I
C) W. .4455 S* -S 0 to4 - Wo .4 .11 W 4 10f 4 -- 5 0- %pi I.. r 0us Qj C sp - -. 0 *~
1 46.t
*D -=- 3
3 3 aM :;.54 4 . :; 4IJ. 'A .1 .1 V)14 in V, lCS -4 .9 A444 *444. -C .4 C .44. W4 .4.9'
.0 z T -C) .1 , K ( - - x ,S
.. L CI "' to -p "l i*
WN WN .4 W- .4.wnW14N
-- 51.6

C. %D. 0 C. C, 0 V, k-c,: :IC. D, C, C. 0 C.
-J.-.; 5.4w, Q.V p* o 4 .4, .fW e W Aw
.40
0 UO'lr~ %
W'4t
t- Xm- 0 (%A C0~ O r~'
-l wo-o0 4 4A CI t
ev W .j CP VIW Dp % mW fck ' r P 0K T aF
O IOO
4cI. r_0 - ZZJI OD b. C-.W1
4z 4 C
b.-~~ ~ 4 LW% I1 Z CA LL
&M an C m -
wlz a
J,'~,.~VN~~Ja~.
-z~ ~ -3 cc vt -C'C =4& v _j. 0 4 G ~ - .X.. 4a C. 4L -C -a <V 4 4 I V II% ~ VV
IF .9.-aJ. -*. - . r.4 VU *-9 S, W, V WvY W. W', VIV Wt VIO Pb no% ,oI .W W, W . WW
I4 3 .177

AD-A123 025 A STUDY To DEMONSTRATEUHE APPLICAT ZON OF A GRAPHICAL 33METHOD 0TOF DERMINE.. ) AIR FORCE INST OF TEC HWRIGHT-PATTERSON AFB OH SCHOOL OF SYST.
UN LASSIFIED D C BECKWITH ET AL SEP 82 AF TSSR-60-82 F/G 5/ NNCuENuuumuuuuio
I-
01.8
11111' .25 11111. 1 .611111- IIIIu III
MICROCOFPY RESOLUTION TEST CHART
N "Ni
4

IL 0a000c0000000000000000000
-.
v' 0 -p in69 O
0al
4.# Wb A.j ft.
Sr a.I wPSP.dusv s.r *gill]
C2
44
41,8

LU
In 0-S cc0 0 C ) QC 0
U.S
0.0. 65
m in
CAJ 146J
ot
.-. atS
ac " N.GoOhl W) %nN0-~ O~ ONRIUE@d
of 10w in In we e'.s an~-,-ee qe e
I ul L C 4
4. I4 it4 6MRO
on. or 04
0&ANeq~
49 eq eq4pcw " fn a
0.# OA403. 6.J
"i fto Qzl. 0. 4WAI-x
mU9- ?6 0o IV' at I c c9Sc 4A CL eq.z ja. U
4n. at eq )wI. A 0 ifZ I0 0 4,414
0 r Z,2 PCequ a~0 mi a -4 , j :eq Ib MI ADC
W44 - J 4U1 W AI t ia N nf.U.I. .WPON ~~~ ~z c.4onwwlPN
179.2--0innsS

2 QZI
IM-
6I
* -.
Lf. 4. - #V t* W 20* 5qk
c" ICHab .5CO."w
g. m 1 Ow
4180

S0 000 000 O 000000002C
aI0I0
. ,- " U ww I1I w181
I-
s u~ooo~Oo~oro~
11101 fi loliop
181 55 5

I '' 0i
•LL a
I
182
-I. . .. I -I .- II-.
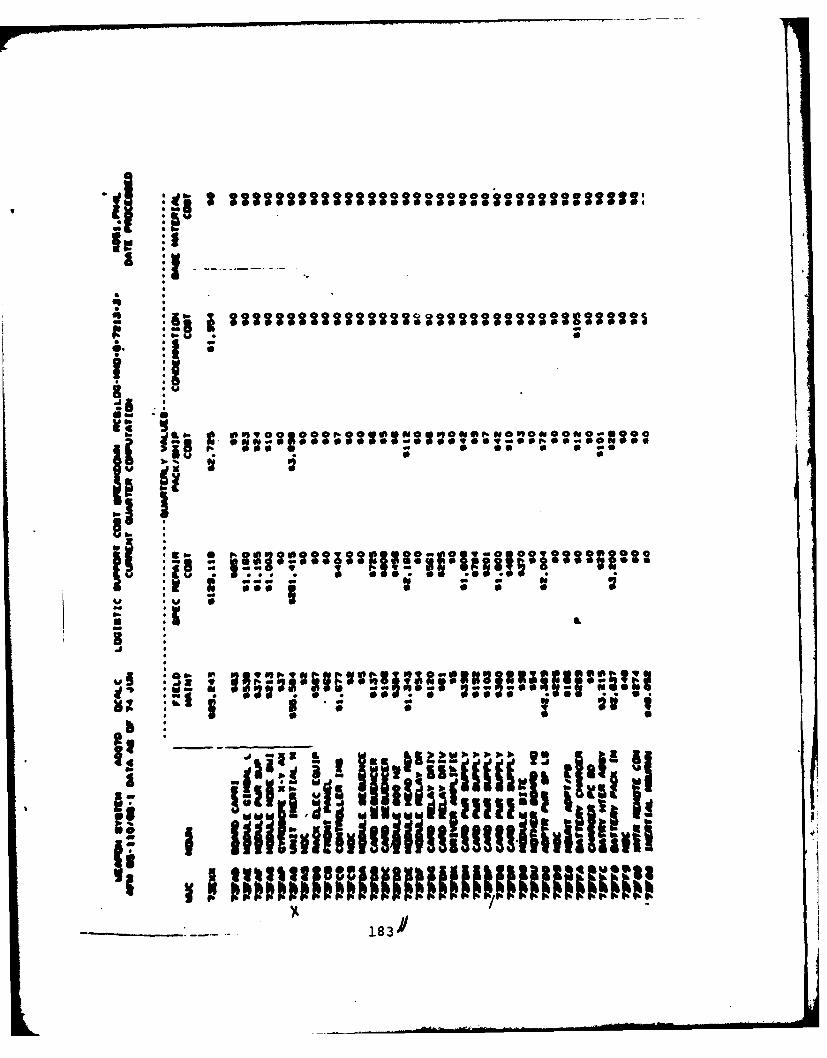
JI
39 2
89 iiS0
iwi
M12 se183

I
HVr~0
0.. S .b(.
N~s* -z
118

I-0) ssssssssss ~~llSsl~ts :s
* &il Il ,I
* :13 o ., ,,. ,- o ,..,- i:-l~ ,. ,I l" ;"" ." ':: " +' - " *i ! .+- " |';" 6 ' >
t + !IU *bI

ILI
a IJ1
-;0-
S~j i3Z
'. 1651.3.30 30o-w
0
* ~a em Ili ..Id H;
V/, Ille I*l i 1u16 olIIIi
186. e..0

a 1'
g~ Its 2
"lL IL
i t
* -- . . IS. S,, , .
* LI 3.3I. 3.1
lddII2V t 2 i,,,.|C iii
L ___--~A .....7.

~000000 0 000000000000000000000000000i000c
-0W
w *
4 Iw
0 ..- 00 0 0 000 0 n 00 0 000N0o0O- o oo00ov0c.'-r 0 0 T c
4
0o 0 0 0
m .* e** 0) t, C- .%W ' -o - ?
NJ. N" 0 W N iI ZP 0v" (l4. . t, M Ir, r I -n ww -n ". N ,10 0 Nec N . -f W)* T
'. *u. r0 0 0 0
5. 0
0C.
o040 jO'l0 3t- ~ .'f
(4 03ft.. C.'tI w--- i -i
Cb W JOC.Z-- 15j I.- w I-
WU w m.#rw , L~~- r. Ix .tE JI .W S 0...1',A ~ .'
wx188 L vL

I'-L
":go
0 c J
a. v fv2I
I - s'A~~I >ttf j~tttttfytt f
L 0w
3t ft I- cadu
I. Z~.* k~~ ) 189

000
fa
-000 a ~ -~* 0: 10H@~@0 0* eY0000 Oe 1.
2300
JW j 946~ ,q. tte@'p t
00
SOS Mill omi O9
'o r- lkr kP % %P .ikP
~' :'~ 190

S. 0----------------------. 0 0 0 0 0 P
- - . i
N.~ 0 0 0 ,0 0 N. -*
J04
3. 0 Z; 7 Zs -~ O -0g Ou C4 6-I *
->- ><
0 m , 0f Io m i 0UOem S- w. - 0
191

04 0
104
4
020
U 04
0~
00
-r4 4.141
cn H
o r-
54 E-4
to z
04. Z
0
030
41p
41.
00
d)~ rk,
192

SELECTED BIBLIOGRAPHY
193

A. REFERENCES CITED
1. Allison, Lieutenant Colonel Jeffrey B., USAF. "Documen-tation of the USAF Implementation of Reliability-Centered Maintenance." Unpublished research reportNo. 810603, AFLMC, Gunter AFS AL, July 1981.
2. Asselin, Joseph R., Program Analysis Officer, ProductionDivision, AGMC, Newark AFS OH. Telephone interview.24 May 1982.
3. Badalamente, Major Richard V., USAF, and Major Thomas D.Clark, Jr., USAF. "Spinning Our (Information)Wheels: A Look at the Maintenance Data CollectionSystem." Unpublished technical report No. LSTR 1-78,AFIT/LS, Wright-Patterson AFB OH, February 1978.
4. Barlow, Richard E., and Raphael Campo. "Total Time onTest Processes and Applications to Failure DataAnalysis," in Richard Barlow, Jerry Fussell andNozer etngpurwalla, eds., Reliability and Fault TreeAnaly, a. Philadelphia PA: SIAM, 1975, pp. 451-481.
5. , and Larry Hunter. "Optimum PreventiveMaintenance Policies," Operations Research, 1960,pp. 90-100.
6. , and F. Proschan. Mathematical Theory ofReliability. New York: Wiley and Sons, 1965.
7. Berg, Menachem. "A Proof of Optimality for Age Replace-ment Policies," Journal of Applied Probability,1976, pp. 751-759.
8. , and B. Epstein. "A Modified Block ReplacementPolicy," Naval Research Logistics Quarterly,March 1976, pp. 15-24.
9. Bergman, Bo. "Some Graphical Methods for MaintenancePlanning," Proceedings of the Annual Reliabilityand Maintainability Symposium, 1977, pp. 467-471.
10. Covency, William. Program Manager, Singer Company,Kearfott Division, Little Falls NJ. Telephoneinterview. 16 July 1982.
194

11. Crowe,Captain Lowell R., USAF, and Captain Levi D.Lowman, USAF. "An Analysis of the ExponentialFunction as the Underlying Distribution forDescribing Failures in Initial Measurement Units."Unpublished master's thesis. LSSR 22-77A, AFIT/LS,Wright-Patterson AFB OH, June 1977. AD A044189.
12. Fox, B. "Age Replacement with Discounting," OperationsResearch, 1966, pp. 533-537.
13. Freund, John E. Mathematical Statistics. EnglewoodCliffs NJ: Prentice-Hall, Inc., 1971.
14. Frick, Lynn A., Captain, USAF, and Captain R. E. Sasser,Jr., USAF. "Improving the Preventive MaintenanceChecks and Services Program for the M60A1 MainBattle Tank." Unpublished master's thesis.LSSR 15-79B, AFIT/LS, Wright-Patterson AFB OH,September 1979. AD A075589.
15. Glasser, Gerald J. "The Age Replacement Problem,"Technometrics, February 1967, pp. 83-91.
16. Griffin, Captain John T., Jr., USAF. Lead ReliabilityEngineer, Reliability Engineering and OperationsDivision, AGMC, Newark AFS OH. Telephone interview.14 May 1982.
17. Hall, H. D. "Computer Monitored Inspection Programs(CMIP)," Proceedings of the 14th Annual InternationalLogistics Symposium, 1980, pp. 29-38.
18. Ingram, C. R., and R. L. Scheaffer. "On ConsistentEstimation of Age Replacement Intervals,"Technometrics, May 1976, pp. 213-219.
19. Janisieski, John A. Deputy Chief, Maintenance PolicyDivision, HQ USAF/LEYM. Letter, subject:Reliability Centered Maintenance, to HQ AFLC/LOL/LOE,29 May 1981.
20. Leaf, Lieutenant General Howard W. Inspector General,HQ USAF/IG. Letter, subject: Summary of Class AAircraft Final Progress Report, to HQ USAF/CS,10 April 1981.
21. Lewis, Jim, C-141 Systems Management Office. Addressto the Joseph P. Cribbins Product Support Symposium,St. Louis MO, 5 November 1980.
195

22. Nowlan, Stanley F., and Howard F. Heap. Reliability-Centered Maintenance. El Paso TX: Dolby AccessPress, 1978.
23. Pierskalla, William P., and John A. Voelker. "ASurvey of Maintenance Models: The Control andSurveillance of Deteriorating Systems," NavalResearch Logistics Quarterly, March 1975, pp. 353-388.
24. Ross, Sheldon M. Applied Probability Models withOptimization APPlications, San Francisco: Holden-Day, Inc., 1970.
25. Scheaffer, Richard L. "Optimum Age Replacement Policieswith an Increasing Cost Factor," Technometrics,February 1971, pp. 139-144.
26. Singpurwalla, Nozer D., and Major Carlos M. Talbott, Jr.,USAF. "Optimum Maintenance Policies," Unpublishedresearch report, unnumbered, AFLMC, Gunter AFS AL,1981.
27. Smith, Michael C. "An Analysis of OpportunisticMaintenance Policy for the FIOOPWl00 AircraftEngine." Unpublished research report No.AFOSR-80-0102, Air Force Office of ScientificResearch, Alexandria VA, 1980. AD A097548.
28. Talbott, Captain Carlos M., Jr., USAF, ScientificAnalyst. Address to the Military OperationsResearch Society, 42nd Symposium, U.S. Naval WarCollege, Newport RI, 7 December 1978.
29. Taylor, Howard M. "Optimal Replacement Under AdditiveDamage and Other Failure Models," Naval ResearchLogistics Quarterly, March 1975, pp. 1-18.
30. U.S. Air Force Logistics Command. Scheduled MaintenanceRequirements Analysis. AFLCP 66-35. Wright-Patterson AFB OH, 2 September 1977.
31. U.S. Department of the Air Force. Equipment MaintenancePolicies, Objectives and Responsibilities.AFR 66-14. Washington: Government Printing Office,1978.
32. . Product Improvement Policy (PIP) forOperational Eguipment. AFR 66-30. Washington:Government Printing Office, 1982.
196

33. U.S. Department of the Army. DARCOM Guide to LogisticSupport Analysis. DARCOM-P 750-16. Washington:Government Printing Office, 1980.
34. U.S. Department of Defense. Maintenance Program Planning.MIL-M-5096D. Washington: Government PrintingOffice, 1967.
35. . Reliability Prediction. MIL-STD-756A.Washington: Government Printing Office, 1963.
36. Requirements for Reliability Program.MIL-STD-785B. Washington: Government PrintingOffice, 1980.
B. RELATED SOURCES
A'Hearn, Major Francis W., USAF. "The MSG-2 CommercialAirline Concept: A Department of Defense Program forReliability-Centered Maintenance." Unpublished researchreport No. PMC 77-2, Defense Systems Management College,Fort Belvoir VA, February 1978. AD A050531.
Barlow, Richard E., "Analysis of Retrospective Failure DataUsing Computer Graphics." Proceedings of the AnnualReliability and Maintainability Symposium, 1978,pp. 113-116.
_ "Geometry of the Total Time on Test Transform,"Naval Research Logistics Quarterly, September 1979,pp. 393-402.
Budne, Thomas A. "Basic Philosophies in Reliability,"Industrial Quality Control, September 1961, pp. 87-93.
Denardo, Eriv V., and Bennett L. Fox. "Nonoptimality ofPlanned Replacement in Intervals of Decreasing FailureRate," Operations Research, 1967, pp. 358-359.
Rambo, Major Stephen W., USAF. "Impact of ReliabilityCentered Maintenance on Scheduled Aircraft MaintenanceMan-Hours in Three C-130 USAF Reserve Units."Unpublished research report No. 1920-79, Air Commandand Staff College, Maxwell AFB AL, April 1979.AD B039473.
Resnikoff, H. L. Mathematical Aspects of Reliability--Centered Maintenance. Los Altos CA: Dolby AccessPress, 1979.
197

Singpurwalla, Nozer D., and Captain Carlos M. Talbott, Jr.,USAF. "An Assessment of the Benefits Due to ReliabilityCentered Maintenance on the C-141," Air Force Journalof Logistics, Winter 1980, pp. 11-15.
Story, Major Donald H., USAF. "F100 Engine ReliabilityCentered Maintenance (RCM)--Success or Failure."Unpublished research report No. 2305-81, Air Commandand Staff College, Maxwell AFB AL, May 1981. AD B057596L.
U.S. Department of the Air Force. "Review of SelectedAircraft Maintenance Programs." Summary report ofaudit. SRA 67248, Air Force Audit Agency, Norton AFB CA,October 1978. AD B030559.
198

BIOGRAPHICAL SKETCHES OF THE AUTHORS
199
Captain Douglas C. Beckwith graduated from high
school in Pembroke, New York, in 1967. He attended
Oklahoma State University from which he received~a Bachelor
of Science degree in Hotel Administration in May 1973.
Commissioned an officer in 1973, he received nine months
of formal training at Fort Rucker, Alabama, for subsequent
duty as a Flight ExamirrPilot at Minot Air Force Base,
North Dakota. He was then transferred to Eglin Air Force
Base, Florida, where he performed duties as the Wing H-lF
Standardization Pilot and Wing Executive Officer. He then
became a Maintenance Supervisor and was assigned to the
Air Force Systems Command.
200

Captain Anthony R. Roclevitch was born 1 January
1953 in Bourne, Massachusetts. He graduated from high
school in Wiesbaden, Germany, in 1971. He attended Troy
State University where he earned a Bachelor of Science
degree in History and received an officer commission through
the AFROTC Program in June 1975. He cross-trained from the
Administration career field in 1980 and was assigned as
OIC of the Aircraft Branch, 1 TFW, Langley Air Force Base,
Virginia, from 1980 to 1981. He graduated from the Squadron
Officer School with Class 3-79.
201


![aaaaaaaaaaaaaaaaaaaaaaaaaaaaaaa ......, FDQ GHILQH D YHFWRU IXQFWLRQ RI [ H Y Y TJO Y \ ] ^ _ ` a H U GMPBU \ ] ^ _ ` a DQG JHW WKH J [ > RU J [ > U H Y Y U H Y TJO Y Ô U K H Y K](https://img.dokumen.tips/doc/110x75/605590d7a01915614f4cfd6c/aaaaaaaaaaaaaaaaaaaaaaaaaaaaaaa-fdq-ghilqh-d-yhfwru-ixqfwlrq-ri-h-y.jpg)