Embed Size (px)
Citation preview
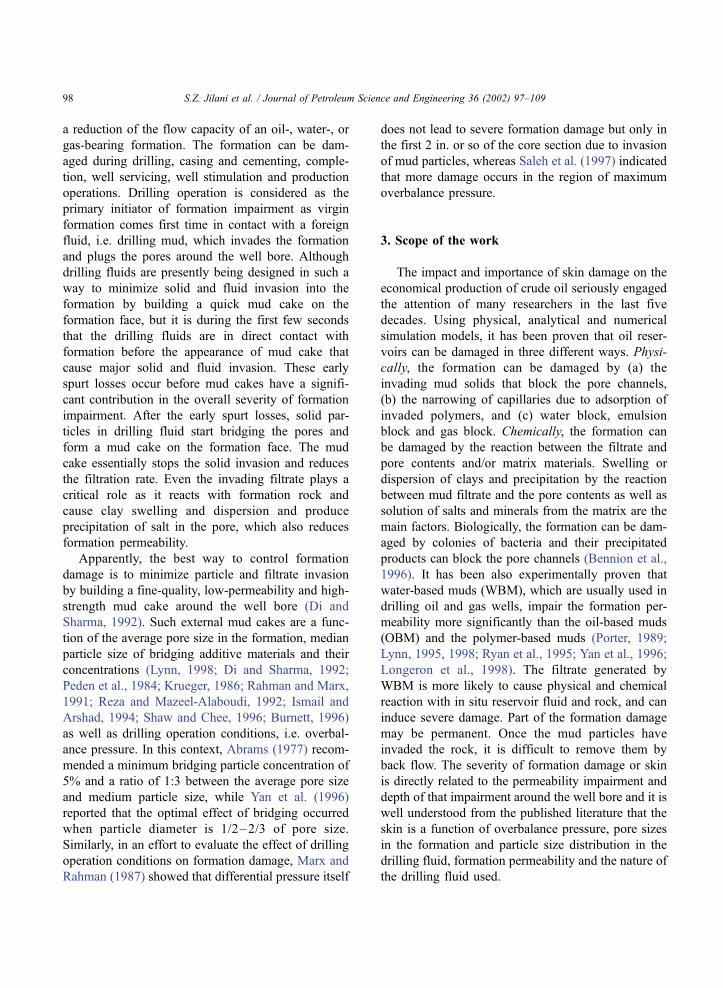
Effect of overbalance pressure on formation damage
S.Z. Jilani a,b, H. Menouar a,*, A.A. Al-Majed a,b, M.A. Khan c
aCenter for Petroleum and Minerals, The Research Institute, King Fahd University of Petroleum and Minerals, Mail Box # 2002,
Dhahran 31261, Saudi ArabiabDepartment of Petroleum Engineering, King Fahd University of Petroleum and Minerals, Dhahran 31261, Saudi Arabia
cCenter for Applied Physical Sciences, The Research Institute, King Fahd University of Petroleum and Minerals, Dhahran 31261, Saudi Arabia
Received 31 July 2001; accepted 5 June 2002
Abstract
Experiments were conducted to investigate the influence of overbalance pressure on formation damage during drilling
operations. An innovative ultrasonic method was employed to measure mud invasion depth. It was observed that mud invasion
depth decreases with increasing overbalance pressure until it reaches a critical pressure. Beyond that, invasion depth increases
with overbalance pressure. The above phenomenon reflects a strong physical relationship between overbalance pressure and
mud fines and filtrate invasion depth.
D 2002 Elsevier Science B.V. All rights reserved.
Keywords: Formation damage; Mud invasion depth; Horizontal wells; Overbalance pressure; Nondestructive evaluation
1. Introduction
The main purpose of drilling vertical or horizontal
wells is to produce maximum recoverable oil at
minimum cost. Unfortunately, drilled wells are subject
to formation damage with varying degree of severity,
depending upon the drilling conditions. This is mainly
due to the invasion of drilling fluids during drilling
operations. The formation impairment or skin due to
drilling fluid invasion around the well bore reduces
well productivity. This is especially true for wells
completed either open hole or with slotted liner due to
the difficulty to undertake any stimulation job to
alleviate formation damage problems. Nowadays,
horizontal wells are preferred over vertical wells
because they offer a net productivity enhancement
as well as an increase of the contact area with the
reservoir. However, formation damage is more critical
to horizontal wells because these wells have such long
exposed interval that stimulation jobs are not efficient
and feasible.
2. Formation damage concepts
Ever since van Everdingen (1953) and Hurst
(1953) introduced the concept of a skin factor, the
primary focus of research has been on evaluation and
minimization of formation impairment. Formation
damage may be defined as a process that results in
0920-4105/02/$ - see front matter D 2002 Elsevier Science B.V. All rights reserved.
PII: S0920 -4105 (02 )00268 -1
* Corresponding author.
E-mail address: [email protected] (H. Menouar).
www.elsevier.com/locate/jpetscieng
Journal of Petroleum Science and Engineering 36 (2002) 97–109
a reduction of the flow capacity of an oil-, water-, or
gas-bearing formation. The formation can be dam-
aged during drilling, casing and cementing, comple-
tion, well servicing, well stimulation and production
operations. Drilling operation is considered as the
primary initiator of formation impairment as virgin
formation comes first time in contact with a foreign
fluid, i.e. drilling mud, which invades the formation
and plugs the pores around the well bore. Although
drilling fluids are presently being designed in such a
way to minimize solid and fluid invasion into the
formation by building a quick mud cake on the
formation face, but it is during the first few seconds
that the drilling fluids are in direct contact with
formation before the appearance of mud cake that
cause major solid and fluid invasion. These early
spurt losses occur before mud cakes have a signifi-
cant contribution in the overall severity of formation
impairment. After the early spurt losses, solid par-
ticles in drilling fluid start bridging the pores and
form a mud cake on the formation face. The mud
cake essentially stops the solid invasion and reduces
the filtration rate. Even the invading filtrate plays a
critical role as it reacts with formation rock and
cause clay swelling and dispersion and produce
precipitation of salt in the pore, which also reduces
formation permeability.
Apparently, the best way to control formation
damage is to minimize particle and filtrate invasion
by building a fine-quality, low-permeability and high-
strength mud cake around the well bore (Di and
Sharma, 1992). Such external mud cakes are a func-
tion of the average pore size in the formation, median
particle size of bridging additive materials and their
concentrations (Lynn, 1998; Di and Sharma, 1992;
Peden et al., 1984; Krueger, 1986; Rahman and Marx,
1991; Reza and Mazeel-Alaboudi, 1992; Ismail and
Arshad, 1994; Shaw and Chee, 1996; Burnett, 1996)
as well as drilling operation conditions, i.e. overbal-
ance pressure. In this context, Abrams (1977) recom-
mended a minimum bridging particle concentration of
5% and a ratio of 1:3 between the average pore size
and medium particle size, while Yan et al. (1996)
reported that the optimal effect of bridging occurred
when particle diameter is 1/2–2/3 of pore size.
Similarly, in an effort to evaluate the effect of drilling
operation conditions on formation damage, Marx and
Rahman (1987) showed that differential pressure itself
does not lead to severe formation damage but only in
the first 2 in. or so of the core section due to invasion
of mud particles, whereas Saleh et al. (1997) indicated
that more damage occurs in the region of maximum
overbalance pressure.
3. Scope of the work
The impact and importance of skin damage on the
economical production of crude oil seriously engaged
the attention of many researchers in the last five
decades. Using physical, analytical and numerical
simulation models, it has been proven that oil reser-
voirs can be damaged in three different ways. Physi-
cally, the formation can be damaged by (a) the
invading mud solids that block the pore channels,
(b) the narrowing of capillaries due to adsorption of
invaded polymers, and (c) water block, emulsion
block and gas block. Chemically, the formation can
be damaged by the reaction between the filtrate and
pore contents and/or matrix materials. Swelling or
dispersion of clays and precipitation by the reaction
between mud filtrate and the pore contents as well as
solution of salts and minerals from the matrix are the
main factors. Biologically, the formation can be dam-
aged by colonies of bacteria and their precipitated
products can block the pore channels (Bennion et al.,
1996). It has been also experimentally proven that
water-based muds (WBM), which are usually used in
drilling oil and gas wells, impair the formation per-
meability more significantly than the oil-based muds
(OBM) and the polymer-based muds (Porter, 1989;
Lynn, 1995, 1998; Ryan et al., 1995; Yan et al., 1996;
Longeron et al., 1998). The filtrate generated by
WBM is more likely to cause physical and chemical
reaction with in situ reservoir fluid and rock, and can
induce severe damage. Part of the formation damage
may be permanent. Once the mud particles have
invaded the rock, it is difficult to remove them by
back flow. The severity of formation damage or skin
is directly related to the permeability impairment and
depth of that impairment around the well bore and it is
well understood from the published literature that the
skin is a function of overbalance pressure, pore sizes
in the formation and particle size distribution in the
drilling fluid, formation permeability and the nature of
the drilling fluid used.
S.Z. Jilani et al. / Journal of Petroleum Science and Engineering 36 (2002) 97–10998
The objective of the present work is to better
understand the influence of overbalance pressure on
formation impairment during drilling operations. An
innovative ultrasonic method was used to measure the
mud invasion depth in order to investigate the rela-
tionship between the overbalance pressure and the
invasion depth.
A leak-off apparatus was constructed to simulate
the mud circulation process across the formation face
during drilling operation. Berea sandstone cores that
are known for their homogeneity were used. Sample
cores of nearly the same effective permeability and
pore size distribution are selected to perform experi-
ments in order to eliminate the effect of core
permeability and pore size distribution on the present
study. These core samples are subjected to different
overbalance pressures for various mud contamination
times under actual reservoir conditions. All other
parameters, like mud composition, confining pres-
sure, pore pressure and temperature, were kept con-
stant. Regain permeabilities and skin factors are
calculated using the experimental data obtained from
the leak-off apparatus. The mud invasion depth was
measured by comparing the ultrasonic wave velocity
profiles along the length of the damaged samples to
the corresponding velocity profiles for nondamaged
cores.
4. Experimental set-up
Leak-off experimental setup is designed to simu-
late the drilling fluid circulation process at the for-
mation face in the well bore under bottom hole
conditions.
4.1. Apparatus
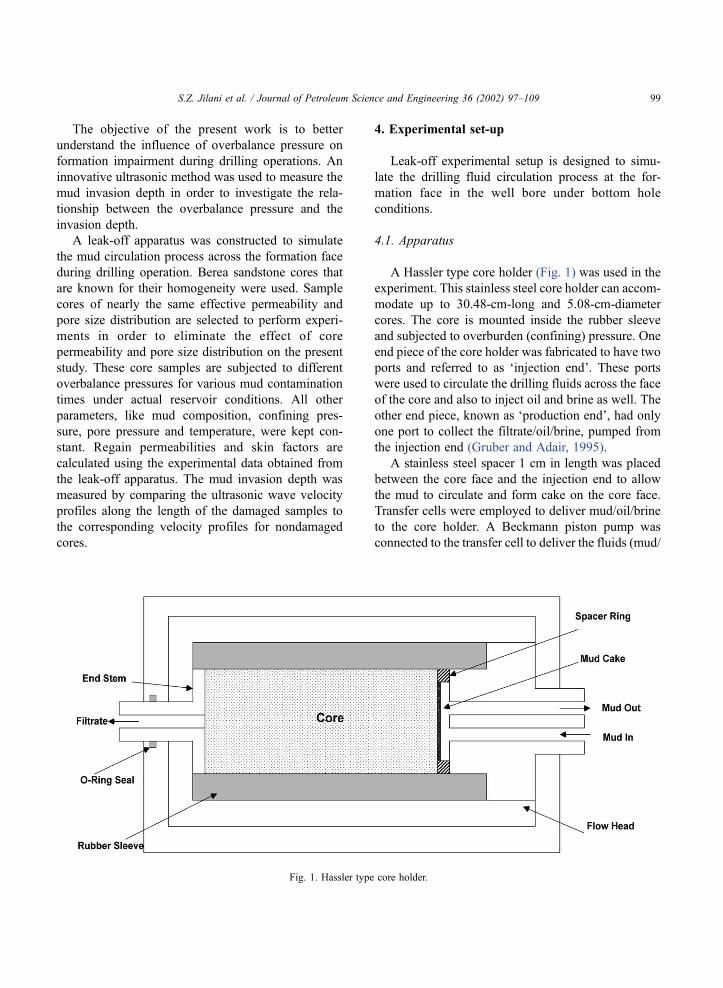
A Hassler type core holder (Fig. 1) was used in the
experiment. This stainless steel core holder can accom-
modate up to 30.48-cm-long and 5.08-cm-diameter
cores. The core is mounted inside the rubber sleeve
and subjected to overburden (confining) pressure. One
end piece of the core holder was fabricated to have two
ports and referred to as ‘injection end’. These ports
were used to circulate the drilling fluids across the face
of the core and also to inject oil and brine as well. The
other end piece, known as ‘production end’, had only
one port to collect the filtrate/oil/brine, pumped from
the injection end (Gruber and Adair, 1995).
A stainless steel spacer 1 cm in length was placed
between the core face and the injection end to allow
the mud to circulate and form cake on the core face.
Transfer cells were employed to deliver mud/oil/brine
to the core holder. A Beckmann piston pump was
connected to the transfer cell to deliver the fluids (mud/
Fig. 1. Hassler type core holder.
S.Z. Jilani et al. / Journal of Petroleum Science and Engineering 36 (2002) 97–109 99
oil/brine) at desired flow rate and pressure. A mixture
of kerosene and silicon oil is used as transferring fluid
in the pump. The pump could deliver the fluid at a
maximum flow rate of 10 cm3/min and pressure of
10,000 psi. Back pressure regulators (BPR), at each
end, were installed to control and maintain the desired
pressure in the system by mean of pressurized nitrogen
gas. A regulator at the injection end was used to
maintain the overbalance pressure across the core,
while another one retained the pore pressure inside
the core. AValidyne DP303 differential pressure trans-
ducer was mounted over the core holder for measure-
ment of differential pressures across the core. These
differential pressures are displayed on analogical dig-
itor. The electrical signals sent by the transducer were
also transferred to a chart recorder where pressure
difference across the core was recorded.
An ISCO fraction collector was used to collect the
produced fluids in 10 cm3 test tubes. The fraction
collector could be set to rotate with time. In this way,
the volume collected in a certain time could be
recorded. The whole setup, except for the pump and
the backpressure regulators, was confined in an elec-
tric oven to operate at reservoir temperatures up to
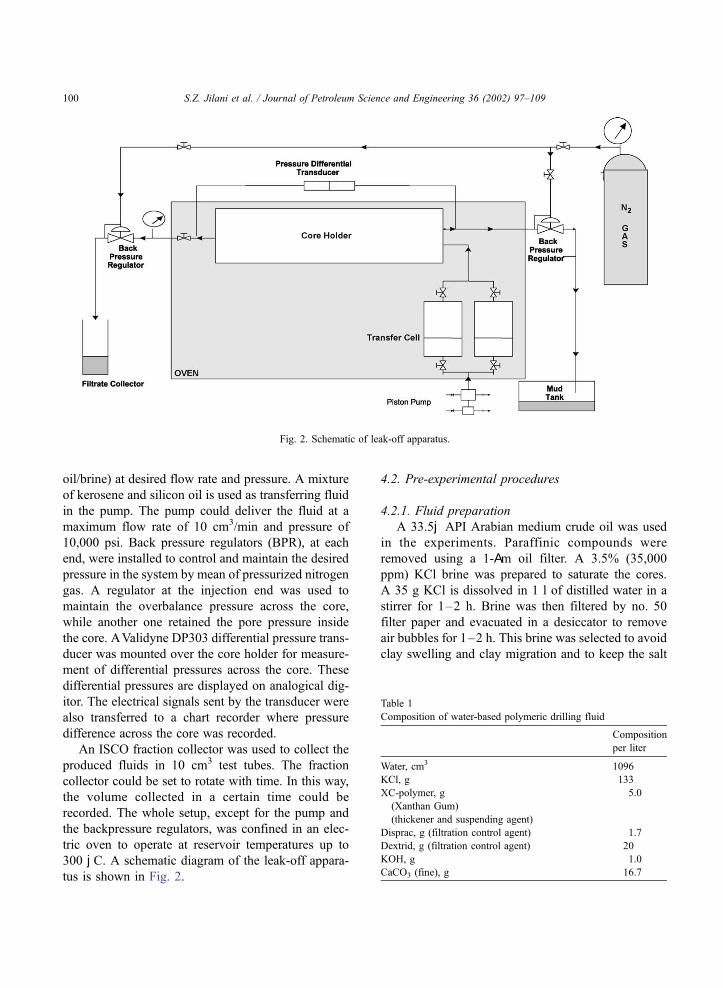
300 jC. A schematic diagram of the leak-off appara-
tus is shown in Fig. 2.
4.2. Pre-experimental procedures
4.2.1. Fluid preparation
A 33.5j API Arabian medium crude oil was used
in the experiments. Paraffinic compounds were
removed using a 1-Am oil filter. A 3.5% (35,000
ppm) KCl brine was prepared to saturate the cores.
A 35 g KCl is dissolved in 1 l of distilled water in a
stirrer for 1–2 h. Brine was then filtered by no. 50
filter paper and evacuated in a desiccator to remove
air bubbles for 1–2 h. This brine was selected to avoid
clay swelling and clay migration and to keep the salt
Fig. 2. Schematic of leak-off apparatus.
Table 1
Composition of water-based polymeric drilling fluid
Composition
per liter
Water, cm3 1096
KCl, g 133
XC-polymer, g
(Xanthan Gum)
(thickener and suspending agent)
5.0
Disprac, g (filtration control agent) 1.7
Dextrid, g (filtration control agent) 20
KOH, g 1.0
CaCO3 (fine), g 16.7
S.Z. Jilani et al. / Journal of Petroleum Science and Engineering 36 (2002) 97–109100
concentration above the critical salt concentration. A
water-based polymeric drilling fluid was used during
the experiments. The composition and properties of
the drilling fluid are given in Tables 1 and 2, respec-
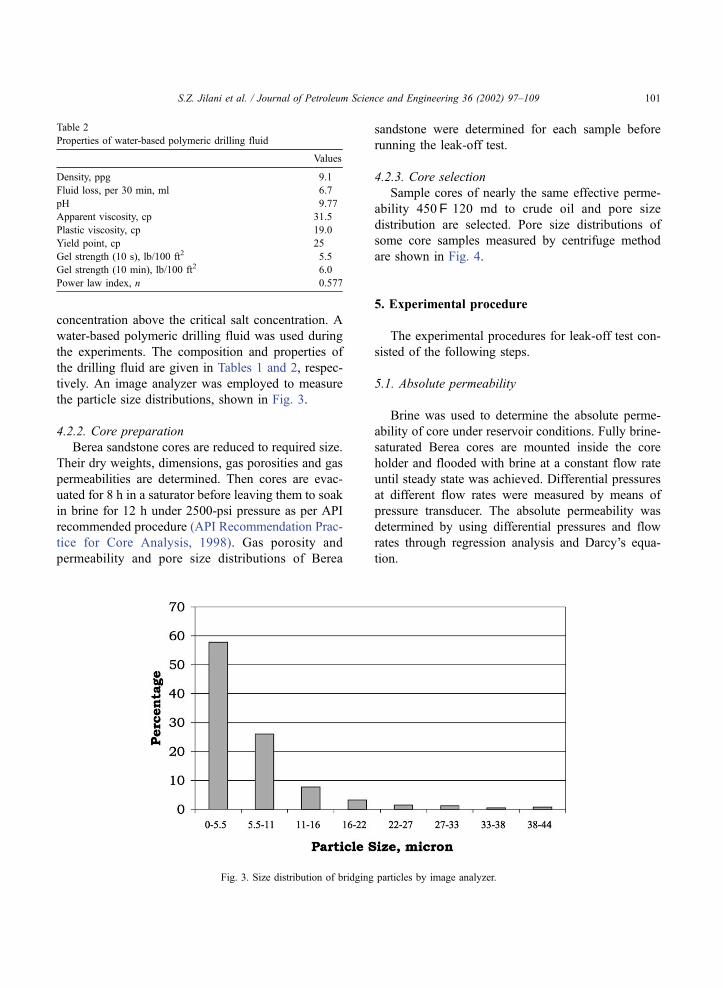
tively. An image analyzer was employed to measure
the particle size distributions, shown in Fig. 3.
4.2.2. Core preparation
Berea sandstone cores are reduced to required size.
Their dry weights, dimensions, gas porosities and gas
permeabilities are determined. Then cores are evac-
uated for 8 h in a saturator before leaving them to soak
in brine for 12 h under 2500-psi pressure as per API
recommended procedure (API Recommendation Prac-
tice for Core Analysis, 1998). Gas porosity and
permeability and pore size distributions of Berea
sandstone were determined for each sample before
running the leak-off test.
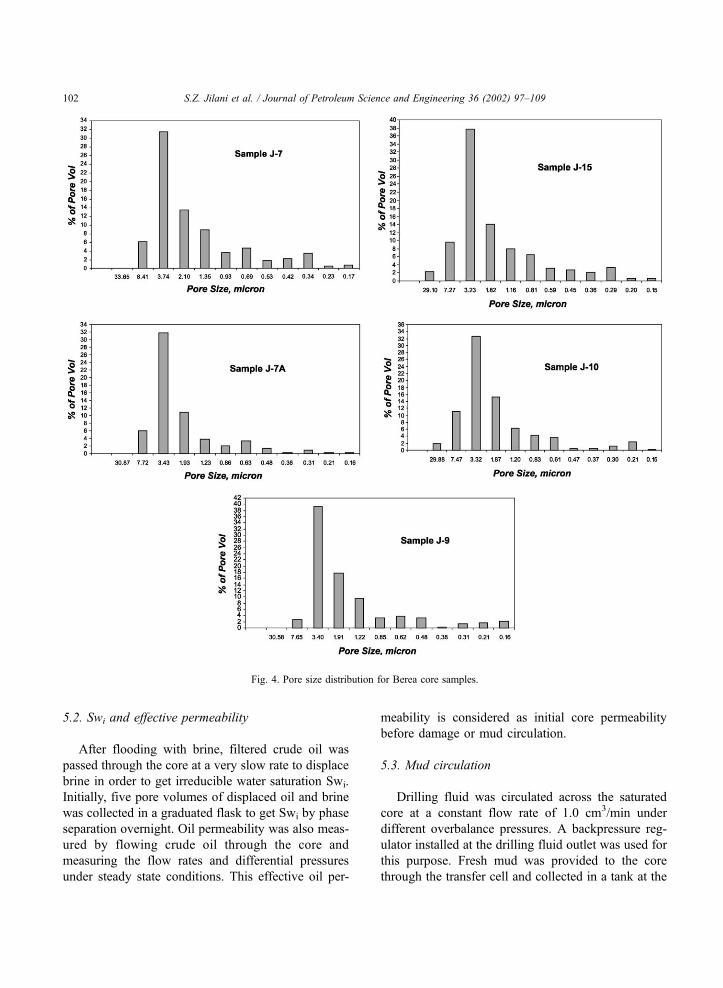
4.2.3. Core selection
Sample cores of nearly the same effective perme-
ability 450F 120 md to crude oil and pore size
distribution are selected. Pore size distributions of
some core samples measured by centrifuge method
are shown in Fig. 4.
5. Experimental procedure
The experimental procedures for leak-off test con-
sisted of the following steps.
5.1. Absolute permeability
Brine was used to determine the absolute perme-
ability of core under reservoir conditions. Fully brine-
saturated Berea cores are mounted inside the core
holder and flooded with brine at a constant flow rate
until steady state was achieved. Differential pressures
at different flow rates were measured by means of
pressure transducer. The absolute permeability was
determined by using differential pressures and flow
rates through regression analysis and Darcy’s equa-
tion.
Table 2
Properties of water-based polymeric drilling fluid
Values
Density, ppg 9.1
Fluid loss, per 30 min, ml 6.7
pH 9.77
Apparent viscosity, cp 31.5
Plastic viscosity, cp 19.0
Yield point, cp 25
Gel strength (10 s), lb/100 ft2 5.5
Gel strength (10 min), lb/100 ft2 6.0
Power law index, n 0.577
Fig. 3. Size distribution of bridging particles by image analyzer.
S.Z. Jilani et al. / Journal of Petroleum Science and Engineering 36 (2002) 97–109 101
5.2. Swi and effective permeability
After flooding with brine, filtered crude oil was
passed through the core at a very slow rate to displace
brine in order to get irreducible water saturation Swi.
Initially, five pore volumes of displaced oil and brine
was collected in a graduated flask to get Swi by phase
separation overnight. Oil permeability was also meas-
ured by flowing crude oil through the core and
measuring the flow rates and differential pressures
under steady state conditions. This effective oil per-
meability is considered as initial core permeability
before damage or mud circulation.
5.3. Mud circulation
Drilling fluid was circulated across the saturated
core at a constant flow rate of 1.0 cm3/min under
different overbalance pressures. A backpressure reg-
ulator installed at the drilling fluid outlet was used for
this purpose. Fresh mud was provided to the core
through the transfer cell and collected in a tank at the
Fig. 4. Pore size distribution for Berea core samples.
S.Z. Jilani et al. / Journal of Petroleum Science and Engineering 36 (2002) 97–109102
outlet end of the core continuously. As the circulation
starts, a mud cake begins to form on the face of the
core and the filtrate also starts invading the core. As
the invading filtrate pushed the oil, the effluent was
collected from the production end in a fraction col-
lector at desired time intervals. The filtrate had to pass
through a 1000-psi backpressure regulator before
accumulating in the fraction collector. The drilling
fluid is circulated for different time periods and at
different overbalance pressures. At this point, the core
was assumed to be damaged with invaded filtrates and
mud particles.
5.4. Return oil permeability
The permeability of the damaged core was deter-
mined by flowing the oil in the opposite direction at
constant flow rate until steady state was achieved.
This oil permeability was referred to as return oil
permeability after the damage. The values measured
are presented in Table 3.
5.5. Method of measuring the invasion depth
The experimental setup for ultrasonic measurement
of invasion depth consisted of two panametric trans-
ducers used to launch and receive longitudinal waves
using panametric pulser-receiver. The transmitted sig-
nals were amplified by a panametric preamplifier and
recorder on 500 MHz digital oscilloscope and a
personal computer. Cylinder-shaped rock samples
were investigated by sending ultrasonic waves along
the diameter at different position scanning the entire
length with a 0.5-cm resolution. The transit times of
the waves traveling from the source to the receiver at
different positions along the length were stored in the
computer. Velocities of the longitudinal ultrasonic
waves were determined simply by calculating the
ratios of the specimen thickness (i.e. diameter) and
the transmit times. For each sample, the wave veloc-
ities were measured under three different conditions,
i.e. dry, oil saturated (Soi and Swi) and mud invaded.
6. Experimental results
Parameters like regain permeability, mud invasion
depth and skin were obtained for each core sample.
Comparisons were made in order to evaluate the
impact of overbalance pressure on the formation
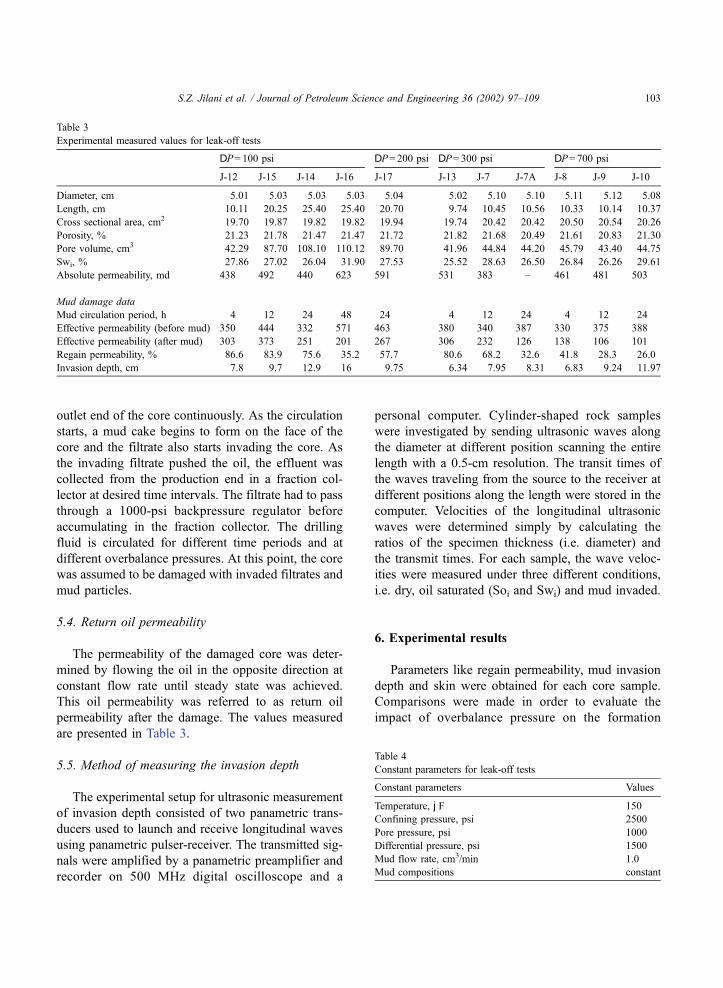
Table 3
Experimental measured values for leak-off tests
DP= 100 psi DP= 200 psi DP= 300 psi DP= 700 psi
J-12 J-15 J-14 J-16 J-17 J-13 J-7 J-7A J-8 J-9 J-10
Diameter, cm 5.01 5.03 5.03 5.03 5.04 5.02 5.10 5.10 5.11 5.12 5.08
Length, cm 10.11 20.25 25.40 25.40 20.70 9.74 10.45 10.56 10.33 10.14 10.37
Cross sectional area, cm2 19.70 19.87 19.82 19.82 19.94 19.74 20.42 20.42 20.50 20.54 20.26
Porosity, % 21.23 21.78 21.47 21.47 21.72 21.82 21.68 20.49 21.61 20.83 21.30
Pore volume, cm3 42.29 87.70 108.10 110.12 89.70 41.96 44.84 44.20 45.79 43.40 44.75
Swi, % 27.86 27.02 26.04 31.90 27.53 25.52 28.63 26.50 26.84 26.26 29.61
Absolute permeability, md 438 492 440 623 591 531 383 – 461 481 503
Mud damage data
Mud circulation period, h 4 12 24 48 24 4 12 24 4 12 24
Effective permeability (before mud) 350 444 332 571 463 380 340 387 330 375 388
Effective permeability (after mud) 303 373 251 201 267 306 232 126 138 106 101
Regain permeability, % 86.6 83.9 75.6 35.2 57.7 80.6 68.2 32.6 41.8 28.3 26.0
Invasion depth, cm 7.8 9.7 12.9 16 9.75 6.34 7.95 8.31 6.83 9.24 11.97
Table 4
Constant parameters for leak-off tests
Constant parameters Values
Temperature, jF 150
Confining pressure, psi 2500
Pore pressure, psi 1000
Differential pressure, psi 1500
Mud flow rate, cm3/min 1.0
Mud compositions constant
S.Z. Jilani et al. / Journal of Petroleum Science and Engineering 36 (2002) 97–109 103
impairment while keeping all other parameters con-
stant. In particular, the temperature of the sample,
confining pressure, pore pressure, differential pres-
sure, mudflow rate and mud composition were kept
constant during all the reported experiments. Their
values are presented in Table 4.
6.1. Effect of overbalance pressure on regain perme-
ability
Experiments were carried out using four different
overbalance pressures, DP values of 100, 200, 300,
700 psi. The effect of DP on the regain permeability,
which is defined as mud damage permeability
divided by initial permeability, is evaluated for
different mud circulation times. A general trend
exhibiting a decreasing regain permeability with
increasing DP is observed, as shown in Fig. 5. Curve
‘‘c’’ in Fig. 5 illustrates the regain permeability for
different DP maintained for 24 h during mud circu-
lation. Decreases in regain permeability of 75.6%,
57.7%, 32.6% and 26% were observed at DP of 100,
200, 300, and 700 psi, respectively. One possible
reason for this decrease is that, with the increase in
DP, more force acts on the mud solid particles to
enter into pores while circulating across the forma-
tion. As the consequence, the large sized particles in
the drilling fluid (>1/3 of pore size) start sticking
firmly to the pore throats, thereby blocking or con-
stricting the pore throats more firmly. During back-
Fig. 5. Effect of overbalance pressure on regain permeability at different contamination times.
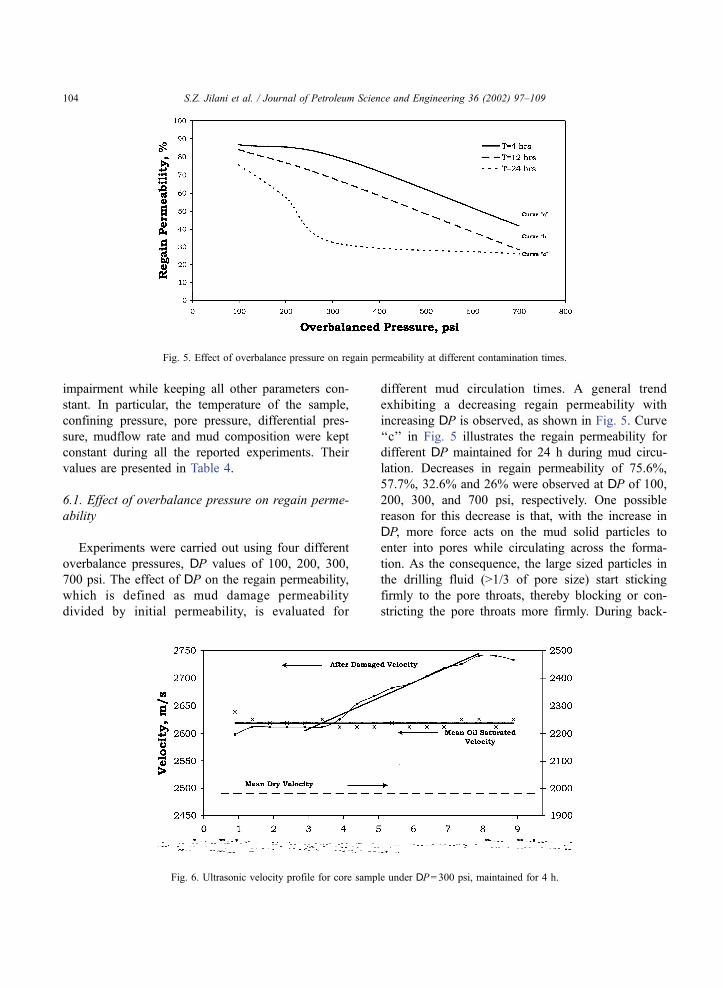
Fig. 6. Ultrasonic velocity profile for core sample under DP= 300 psi, maintained for 4 h.
S.Z. Jilani et al. / Journal of Petroleum Science and Engineering 36 (2002) 97–109104

flow, these solid particles remain there in the pore
throats and ultimately decrease the return permeabil-
ity. At low DP, on the other hand, the solids do not
stick themselves so firmly because less force acts on
them and they flow out relatively easily during back
flow as compared to the previous case.
6.2. Effect of overbalance pressure on mud invasion
depth
The mud invasion depths were measured through
ultrasonic velocity profiles along the length of the
cores as shown in Figs. 6 and 7. The velocity
distributions at three stages: dry, oil and water
saturated (at Soi and Swi), and mud-laden sample
are quite distinct in the specific case of Fig. 6 where
DP= 300 psi and a contamination time of 4 h. The
average velocity in the dry sample is 1980 m/s while
for oil saturated sample the average velocity is about
33% higher, i.e. 2620 m/s. The velocity profile for
oil saturated sample acts as the base line velocity
distribution. As expected, the mud-laden portion of
the sample core shows higher velocities. We note
that initially (seen from the right side, or the dense
Fig. 7. Ultrasonic velocity profile for core sample under DP= 700 psi, maintained for 12 h.
Fig. 8. Ultrasonic velocity profile for core sample under DP= 700 psi, maintained for 24 h.
S.Z. Jilani et al. / Journal of Petroleum Science and Engineering 36 (2002) 97–109 105

end) there is a plateau where the average velocity is
about 4.5% higher than the baseline velocity. The
region is followed by a linear decrease in the
velocity. The plateau indicates that this part is
completely filled with mud particles and filtrate,
while the linear decrease in velocity is due to gradual
decrease in these particles and filtrate concentration
(incomplete invasion). Apparently, the mud has not
affected the remaining portions of the sample leading
to the lean end. The invasion depth of the mud can
be measured easily and the region occupied by the
filtrate can also be seen. Fig. 8 shows an example of
the full-length invasion of ‘‘mud’’ under DP= 700
psi and DT = 24 h. Here the region with pores
exclusively filled by the filtrate, without fine par-
ticles constituting the mud, is not visible. Invasion
depths for each core sample under different condi-
tions are given in Table 3.
Fig. 9 compares the effects of DP on invasion
depths for different contamination times. One would
expect an increase in invasion depth with DP in the
sense that higher pressure would force mud particles
and filtrate to penetrate deeper and deeper into the
formation. Contrary to this expectation, however, the
result indicates a decrease in the invasion depths
with increasing DP up to a certain value, i.e. 300 psi.
Beyond this value, invasion depth starts to increase
with DP in line with expectation. Curve ‘‘a’’ in Fig.
9 shows the experimental results on invasion depths
as a function of DP, for a contamination time of 24
h. It is observed that invasion depth is considerably
higher, i.e. 12.9 cm for DP= 100 psi than for
DP= 200 and 300 psi, which are 9.75 and 8.31
cm, respectively. Further increase in DP tends to
increase the invasion depth reaching 11.97 cm for
700 psi. It can be inferred from this observation that
for the rock and fluid used in these experiments,
DPf 300 psi acts as a critical pressure which
produces minimum invasion depth. Curves ‘‘b’’ and
‘‘c’’ in Fig. 9 follow a similar trend.
7. Discussion of the results
The apparent behavior of mud invasion depth as a
function of overbalance pressure could be explained
from the following considerations. At low DP, micro-
fine particles that are in suspended form in the drilling
fluid move gradually through the mud cake and pores
and can travel a long distance. On the other hand, at
high DP, particles interfere with each other and form a
bridge at the pore constrictions. A pictorial illustration
of the mechanisms of formation plugging at different
DP is given in Fig. 10. In the present experiments, at
low DP, e.g. 100 psi, the mud solid particles gather
themselves loosely at the pore constrictions and pass
in an orderly manner. This results in deeper invasion
as presented in Fig. 10a. As DP increases, these
Fig. 9. Effect of overbalance pressure on mud invasion depth at different contamination times.
S.Z. Jilani et al. / Journal of Petroleum Science and Engineering 36 (2002) 97–109106

particles start to form relatively tight bridges at the
pore throats and begin to act as ‘‘one-way check
valves’’ as illustrated in Fig. 10b. In the present
situation, this ‘‘one-way check valve’’ phenomenon
apparently works at its best at a pressure around 300
psia. Further increase in DP results in breaking these
tight particle bridges. Either these particles break into
small sizes or the pore constrictions/throats get
enlarged by the friction of the grains against the pore
throat walls, which help the solids to migrate until
they stop at farther constrictions, as illustrated in Fig.
10c.
The above mechanism is also discussed by Grue-
beck and Collins (1982) in his study relating to
entrainment and deposition of fine particles in porous
media. He reported that while the smaller pathways
are blocked as a solid laden fluid flows in a porous
media, the flow is diverted to larger pathways and
more fine particles reach the effluent. But eventually,
the pressure differential across the blocked pathway is
so great that some plugs (bridges) are broken. These
results in a spurt of fines in the effluent and then new
deposits start growing.
8. Estimation of skin
Using Hawkin’s relation (Craft and Hawkins,
1991), the skin factor has been estimated as a function
of the overbalance pressure. It should be observed that
in Hawkin’s equation, the return permeability is more
important than the invasion depth, which affect the
skin only logarithmically. Consequently, the return
permeability decreases with increase in overbalance
pressure, observed experimentally, and prevailed over
the invasion depth relation described above. The
Fig. 10. Mechanism of formation plugging at different DPs.
S.Z. Jilani et al. / Journal of Petroleum Science and Engineering 36 (2002) 97–109 107

overall results still show that the skin increases as the
overbalance pressure increases. The curve ‘‘a’’ of Fig.
11 shows the situation where DP is maintained for 24
h and the skin factor is increased by 115%, whereas
regain permeability decreased by about 23.6% for an
increase in DP from 100 to 200 psi. Similarly, an
increase in skin of 438% and 750% was observed with
the decrease of regain permeability of 57% and 66%
for DP of 300 and 700 psi, respectively. Curves ‘‘b’’
and ‘‘c’’ in Fig. 11 also show the same general trend
of increase in skin factor with DP for different periods
of time.
9. Conclusions
A nondestructive method of investigation is used to
directly measure the drilling fluid invasion in Berea
cores at different overbalance pressures, keeping the
other major influencing parameters, i.e. core perme-
ability and nature of drilling fluid constant. Our
experimental results confirm that:
1. The return permeability decreases as the over-
balance pressure increases.
2. The invasion depth starts increasing with the
overbalance pressure only after the overbalance
pressure reaches a certain ‘critical’ value.
3. The calculated skin increases as the overbalance
pressure increases.
Nomenclature
DP Overbalance pressure, psi
OBM Oil-based mud
WBM Water-based mud
SI Metric Conversion Factors
in.� 2.54 * E + 00 = cm
psi� 6.894757 E + 00 = kPa
SPEDC
* Conversion factor is exact.
Acknowledgements
The support of K.F.U.P.M is highly acknowledged.
The facilities provided by the center for applied
physical sciences are highly appreciated. The lab
assistance provided by Engr. Mousa Ali and Engr.
Abdul Samad Iddrisu of Petroleum Engineering
Department is also appreciated.
References
Abrams, A., 1977. Mud design to minimize rock impairment due to
particle invasion. SPE-5713. JPT, pp. 586–592 (May).
API Recommendation Practice For Core Analysis, 1998. Recom-
mended Practice 40, 2nd ed. American Petroleum Institute,
Washington, DC.
Bennion, D.B., Thomas, F.B., Bietz, R.F., 1996. Formation damage
and horizontal wells—a productivity killer? SPE 37138. 2nd
Fig. 11. Skin variation with overbalance pressure at different contamination times.
S.Z. Jilani et al. / Journal of Petroleum Science and Engineering 36 (2002) 97–109108

International Three-day Conference on Horizontal Well Tech-
nology, Calgary, Alberta Canada, 18–20 November, pp.
827–840.
Burnett, D.B., 1996. Laboratory and field evaluation of the role of
drilling solids in formation damage and reduced horizontal well
productivity. SPE-37125, SPE International Conference on Hor-
izontal Well Technology, Calgary, Alberta Canada, 18–20 No-
vember.
Craft, B.C., Hawkins, M.F., 1991. In: Terry, R.E. (Ed.), Applied
Petroleum Reservoir Engineering, 2nd ed. Prentice-Hall, Engle-
wood Cliffs, NJ, pp. 210–230.
Di, J., Sharma, M.M., 1992. Formation damage due to static and
dynamic filtration of water-based muds. Paper SPE-23823 pre-
sented at the 1992 SPE International Symposium on Forma-
tion Damage Control, Lafayette, Louisiana, 26–27 February,
pp. 491–501.
Gruber, N.G., Adair, K.L., 1995. New laboratory procedures for
evaluation of drilling induced formation damage and horizontal
well performance. Journal of Canadian Petroleum Technology
p. 34, 27 (May).
Gruebeck, C., Collins, R.E., 1982. Entrainment and deposition of
fine particles in porous media. SPEJ 22, p. 847 (December).
Hurst, W., 1953. Establishment of the skin effect and its impediment
to fluid flow into a well bore. The Petroleum Engineers, B6–
B16 (October).
Ismail, A.R., Arshad, A.M., 1994. The effect of solids concentration
and formation characteristics on formation damage and perme-
ability recovery. Paper SPE-28762 presented at the 1994 SPE
Asia Pacific Oil and Gas Conference, Melbourne, Australia,
November, 7–10, pp. 203–213.
Krueger, R.F., 1986. An overview of formation damage and well
productivity in oilfield operations. SPE-10029. JPT, vol. 38,
pp. 131–152 (Feb.).
Longeron, D.G., Jlfenore, J., Poux-Guillaume, G., 1998. Drilling
fluids filtration and permeability impairment: performance eval-
uation of various mud formulations. SPE-48988. 1998 SPE An-
nual Technical Conference and Exhibition, New Orleans,
Louisiana, 27–30 September, pp. 237–251.
Lynn, J.D., 1995. Evaluation of drilling fluids damage using a closed
loop dynamic slurry circulation system. SPE-29833. SPE
Middle East Oil Show, Bahrain, 11–14 March, pp. 571–580.
Lynn, J.D., 1998. Drilling damage associated with water-based
fluids. Saudi Aramco Journal of Technology, pp. 30–34 (Oct.
24–26).
Marx, C., Rahman, S.S., 1987. Evaluation of formation damage
caused by drilling fluid, especially in pressure-reduced forma-
tion. Journal of Petroleum Technology 39, p. 1449 (Nov.).
Peden, J.M., Arthur, K.G., Margarita, 1984. The analysis of filtra-
tion under dynamic and static conditions. Paper SPE-12503
presented at the 1984 Formation Damage Control Symposium,
Bakersfield, CA, 13–14 February, pp. 283–294.
Porter, K.E., 1989. An overview of formation damage. SPE-19894.
JPT, pp. 780–786 (August).
Rahman, S.S., Marx, C., 1991. Laboratory evaluation of formation
damage caused by drilling fluids and cement slurry. Journal of
Canadian Petroleum Technology 30, p. 40 (Nov.–Dec.).
Reza, G., Mazeel-Alaboudi, M.A., 1992. Damage caused by clay-
based and clay-free inhibitive fluids in sandstone formations.
Paper SPE-23815 presented at the 1992 SPE International Sym-
posium on Formation Damage Control, Lafayette, Louisiana,
26–27 February, pp. 439–446.
Ryan, D.F., Browne, S.V., Burnham, M.P., 1995. Mud clean up in
horizontal wells: a major joint industry study. SPE-30528. SPE
Technical Conference and Exhibition, Dallas, USA, 22–25 Oc-
tober, pp. 801–810.
Saleh, S.T., Rustam, El-Rabaa, R.W., 1997. Formation damage
study with a horizontal well bore model. Journal of Petroleum
Science and Engineering 17, pp. 87–99.
Shaw, J.C., Chee, T., 1996. Laboratory evaluations of drilling mud
system for formation damage prevention in horizontal wells.
2nd International Three-day Conference on Horizontal Well
Technology, Calgary, Alberta Canada, 18 – 20 November,
pp. 713–722.
van Everdingen, A.F., 1953. The skin effect and its influence on the
productive capacity of a well. Transactions of American Insti-
tute of Mechanical Engineers 198, p. 171.
Yan, J., Jiang, G., Wang, F., 1996. Characterization and prevention
of formation damage during horizontal drilling. SPE-37123. 2nd
International Three-day Conference on Horizontal Well Technol-
ogy, Calgary, Alberta Canada, 18–20 November, pp. 739–747.
S.Z. Jilani et al. / Journal of Petroleum Science and Engineering 36 (2002) 97–109 109