Embed Size (px)
Citation preview
Available online at www.sciencedirect.com
ScienceDirect Energy Procedia 00 (2013) 000–000
www.elsevier.com/locate/procedia
1876-6102 © 2013 The Authors. Published by Elsevier Ltd. Selection and peer-review under responsibility of GHGT.
GHGT-12
Oxygen and temperature effect on formation of degradation compounds from MEA
Solrun Johanne Vevelstada*, Maren T. Johansenb, Hanna Knuutilab and Hallvard F. Svendsenb
aSINTEF Materials and Chemistry, 7465 Trondheim, Norway bNorwegian University of Science and Technology, 7491 Trondheim, Norway
Abstract
Liquid phase degradation of MEA and the formation of 8 degradation compounds were studied at 4 different oxygen concentrations and three different temperatures. Liquid phase total nitrogen was determined and compared with quantified remaining MEA and degradation compounds. The first order rate constant for MEA degradation was determined and found to increase with both oxygen concentration and temperature. Temperature and oxygen dependence of the degradation compounds were complex. In particular the behaviour at 6% oxygen level was interesting. The end sample liquid phase nitrogen balance is almost closed at 6% O2. The nitrogen accounted for decreases with increasing temperature. © 2013 The Authors. Published by Elsevier Ltd. Selection and peer-review under responsibility of GHGT.
Keywords: Amine degradation, MEA, Reaction kinetics, Degradation products, Temperature, Oxygen concentration, Liquid phase nitrogen balance
1. Introduction
Amine degradation in post-combustion CO2 capture plants can cause problems as e.g. solvent loss, formation of degradation compounds that accumulate in the process (“heat stable salts”) and emissions of e.g. ammonia and aldehydes. Degradation compounds formed in laboratory studies in the presence of oxygen show high similarity to
* Corresponding author. Tel.:+47 40642608.
E-mail address: [email protected]

2 Author name / Energy Procedia 00 (2013) 000–000
compounds seen in pilot plants [1]. However, the temperature cycle in real processes also influences formation of the compounds or their intermediates [1, 2]. Experimental setups and conditions used in oxidative degradation experiments have varied significantly between various research groups [2-6]. In most studies setups oxygen concentration and temperature have been kept constant. In a recent publication the effect of oxygen concentration (21-98% O2) at 55°C and temperatures (55 and 75°C) for 21% O2 on MEA degradation was investigated [6]. Supap et al. evaluated the effect of temperature and concentration of MEA, O2, SO2 and CO2 on the MEA degradation using a closed vessel [6] varying more than one factor at the same time. However, a systematic study evaluating the effect of oxygen concentration, 6- 98%, and temperature, 55 – 75°C, on the formation of specific degradation compounds has not been conducted earlier.
Both qualitative and quantitative information on degradation product formation reported in the literature will depend on the analytical techniques and standards available in any research group at a given time. A rapid development in analytical capabilities has taken place the last ten years, and this might explain the variation in reported degradation compounds from different research groups.
In this work it will be shown how 4 different oxygen concentrations (6-98%) and 3 different temperatures (55-75°C) influence the formation of MEA degradation compounds in liquid phase. In addition, rate constants for the MEA degradation and nitrogen balances for liquid phase will be given.
Abbreviations
BHEOX N,N’-bis(2-hydroxyethyl)oxamide 1871-89-2 HEA N-(2-hydroxyethyl)acetamide 142-26-7 HEEDA/AEEA N-(2-hydroxyethyl)ethylenediamine 111-41-1 HEF N-(2-hydroxyethyl)formamide 693-06-1 HEGly N-(2-hydroxyethyl)-glycine 5835-28-9 HEHEAA N-(2-hydroxyethyl)-2-[(2-hydroxyethyl)amino]-acetamide 144236-39-5 HEI N-(2-hydroxyethyl)imidazole 1615-14-1 HEPO 4-(2-hydroxyethyl)-2-piperazinone 23936-04-1 HEOX 2-[(2-hydroxyethyl)amino]-2-oxo-acetic acid 5270-73-5 MEA 2-ethanolamine 141-43-5 OZD 2-oxazolidinone 497-25-6 GC-MS Gas Chromatography-Mass Spectrometry IC Ion Chromatography LC-MS Liquid Chromatography – Mass Spectrometry P parallel/re-run of experiments for experiment where more than one experiment was conducted T temperature
2. Experimental
Amine solution (MEA, 30 wt%), loaded with CO2 (α= 0.4 mole CO2 per mole of amine), was introduced into an open batch reactor (1L) according to the flow sheet given by Vevelstad et al. [2]. Na2SO4 (≈30 mM) was added to the solution as a control for the water balance during the experiments. A recycle loop maintained a circulation rate at about 50 L/h of a gas blend of air/O2 with 2% CO2. The gas was humidified by passing through a contactor and sparged into the reactor solution. A net throughput of gas was obtained by adding (0.35 L/min air or O2/N2 + 7.5 mL/min CO2) to the recycle loop. The reactor temperature was maintained at 55°C, 65°C or 75°C. The outlet gas was bubbled through gas bubble flasks containing H2SO4 as shown in the flow sheet, see [2]. Samples were taken regularly from the liquid phase and the gas bubble flasks and analyzed by different analytical techniques. Liquid Chromatography – Mass Spectometry (LC-MS) was used for MEA and degradation compounds (BHEOX, HEA, HEF, HEGly, HEI, HEPO, OZD and NH3, see abbreviations). Ion Chromatography (IC) was used for anions

Author name / Energy Procedia 00 (2013) 000–000 3
(formate, oxalate, nitrate, nitrite and sulphate, but results not presented here) and Kjeldahl analysis for liquid phase nitrogen [7]. A more detailed description of the analytical techniques used, ion source, column, mobile phase, is given by Vevelstad [8]. An overview of experiments conducted is given in Table 1.
Table 1: Overview of the oxidative degradation experiments.
6% O2 + 92% N2 21% O2 + 77% N2 49% O2 + 49% N2 98% O2 55°C This work P1 - [2]
P2 - [2] P3 - This work
[2] [2]
65°C This work P1 - This work P2 – This work
This work This work
75°C This work [2] This work This work
For the oxygen concentration 21% O2 and temperatures 55 and 65°C, more than one experiment were conducted.
These experiments are separated from each other defining them as Pi, where i stands for 1,2 or 3.
3. Results
3.1 MEA
The effect of oxygen level and temperature on MEA degradation was evaluated assuming the liquid phase to behave as a CSTR, giving an expression for the oxidative degradation of MEA as given in Equation 1, where r is the reaction rate, k is the first order rate constant and CMEA is the MEA concentration.
(1)
The reactions for MEA to various degradation compounds were all assumed to be first order with respect to
MEA. Integration of the rate expression over time t and re-arranging gives Equation 2.
(2)
All rate constant was found by plotting ln(CMEA,0/CMEA) against t. Linear regression gave the slope of k as given
in Table 2.
MEAdC r kCdt
= =
,0ln *MEA
MEA
Ck t
C=

4 Author name / Energy Procedia 00 (2013) 000–000
Table 2: Rate constant (k) for the different experiments together with the linear regression fit (R2).
T (°C) O2 (%) Experiment end [days] k[day-1] R2 75 98 21 0.068 0.6871
49 28 0.0418 0.9662 21 20 0.0483 0.9925 6 36 0.012 0.9639
65 98 21 0.0396 0.9358 49 28 0.0311 0.9356 21 21 0.0057 0.6652 21 21 0.0127 0.9736 6 42 0.0065 0.5647
55 98 21 0.0142 0.9936 49 21 0.0093 0.9398 21 21 0.0077 0.979 21 21 0.0072 0.9966
21 21 0.0044 0.2683 6 42 0.0055 0.9435
Initially, for the linear regression, all experimental points were used, see Appendix A for plot of equation 2 with
linear regression. With the exception of four experiments the R2 values were higher than 0.93. These four experiments are marked with red in Table 2: 75°C – 98%, 65°C – 21%, 65°C – 6% and 55°C – 21%. The experiment at 65°C – 21% also showed a high deviation in the water balance and a second experiment at 21% O2, 65°C was therefore conducted. The water balances were only controlled comparing the start and end of an experiment. Using all experimental points to calculate k would be expected to give a higher error than only using the first experimental points. For the experiments with low R2, new k values were calculated excluding the last experimental points or removing outliers. The rate constants (k) for each experiment were then plotted as a function of oxygen concentration (%) for the various temperature as given in Fig. 1. Filled points are values from Table 2 and open points are the new k values calculated for the four experiments with low R2.

Author name / Energy Procedia 00 (2013) 000–000 5
Fig. 1: Reaction rate (k) as a function of oxygen concentration (%) (filled points: k from Table 1:, open points: new k).
The reaction rate constant generally seems to increase with temperature and almost linearly with oxygen
concentration. A first order dependency on oxygen level is thus indicated. The data also show a higher scatter for the experiments at higher temperature, especially for the experiments at 75°C. This is likely related to the design of the experimental setup which is not able to maintain a close water balance at higher temperatures. However, the deviation between the original and re-interpreted k-values for 98% O2 and 75°C also illustrate that trends could easily be misinterpreted based on uncertainties in the experimental data.
3.2. Degradation compounds in liquid phase
Oxygen level, temperature, volatility of intermediates and degradation products and the concentration of intermediates in the liquid phase influence the build-up of degradation products. In the following the build-up over time of eight secondary degradation products is shown and qualitatively discussed.
3.2.1.Formation of degradation compounds containing nitrogen The percentage formation, τi,f, of each degradation compound used in the figures was calculated using the
procedure described by Lepaumier et al. [9], and given in Equation 3.
(3)
Here m
iC is the molar concentration of the compound i, 0mC is the initial concentration of MEA and νi is the
number of nitrogen in the molecule i. The percentage formation of 4-(2-hydroxyethyl)-2-piperazinone (HEPO - logarithmic scale) as a function of time (days) for different oxygen concentrations and temperatures is given in Fig. 2.
,0
*100mi
i f i m
CC
τ ν
=

6 Author name / Energy Procedia 00 (2013) 000–000
Fig. 2: %formation of HEPO as a function of time (days) for the different oxygen concentrations and temperatures.
For HEPO, keeping the oxygen concentration constant and varying the temperature shows that the rate of HEPO
formation increases with temperature for all oxygen levels. Comparing the HEPO formation rate for oxygen levels 21 to 98% at 55°C it is seen that they are very comparable, but a small positive effect of increasing oxygen level is visible. At 6% oxygen the rate of formation of HEPO is clearly lower. At the higher temperatures (65 and 75°C) similar trends for the rate of formation as function of oxygen concentration are seen. Temperature has clearly a stronger effect than the oxygen level.
The %formation of N-(2-hydroxyethyl)-glycine (HEGly) as a function of time (days) for the different oxygen concentrations and temperatures is given in Fig. 3.

Author name / Energy Procedia 00 (2013) 000–000 7
Fig. 3: % formation of HEGly as a function of time (days) for the different oxygen concentrations and temperatures.
As for HEPO, the initial HEGly formation increases with temperature at constant oxygen concentration. The
temperature sensitivity for HEPO is, however, stronger than for HEGly. This is in agreement with observations from pilot campaigns that HEPO is preferred at higher temperatures [1]. At 75oC after about 5 days, the HEGly formation is seen to level of and fall at the intermediate oxygen levels. This is reasonable if HEGly is an intermediate. At 55oC the HEGly formation is seen to be almost independent on oxygen level. However, at 75oC, the net rate of formation of HEGly is seen to increase with decreasing oxygen level, in particular going from 21 to 6%. For HEPO, the opposite was seen where formation increased with oxygen concentration. This is a very interesting finding as HEGly has been suggested as an intermediate for HEPO [1].
The %formation for 2-oxazolidinone (OZD) relative to initial nitrogen as a function of time (days) for the
different temperatures and oxygen concentrations is given in Fig. 4.

8 Author name / Energy Procedia 00 (2013) 000–000
Fig. 4: % formation of OZD as a function of time (days) for the different oxygen concentrations and temperatures.
An oxygen concentration and temperature effect is also observed for the formation of OZD. A steady increase in the formation is observed at 55oC with increasing oxygen level. The same trend is found at 65oC although the results at 49 and 98% oxygen are very similar. At 75°C the levels of OZD are very similar for the three highest oxygen levels, whereas at 6% it is much lower. In fact, at 6% oxygen the temperature dependency is the opposite of what was found for the other levels. At higher temperature the small difference in formation of OZD between 49 and 98% might be explained by competitive reactions more favorable than OZD formation e.g. N-(2-hydroxyethyl)ethylenediamine (HEEDA) and less MEA available for reaction. The liquid samples were not analyzed for HEEDA. If HEEDA is formed, a higher consumption of CO2 is expected and amine titration should give higher concentrations than MEA analyses. The CO2 loading decreases from 65 to 75°C, but amine titration does not indicate that there is formation of other amines as is the case in thermal degradation experiments with CO2 [10]. The observed decrease in CO2 loading is likely connected to less MEA present in the solution. Small amounts of HEEDA could still be present, however HEEDA does not seem to contribute significantly to the amines in liquid phase.

Author name / Energy Procedia 00 (2013) 000–000 9
The %formation of N-(2-hydroxyethyl)imidazole (HEI) as function of time (days) for the different oxygen concentrations and temperatures is given in Fig. 5.
Fig. 5: % formation of HEI as a function of time (days) for the different oxygen concentrations and temperatures.
At 55 and 65oC the formation of HEI increases with increasing oxygen concentration. At 75oC the trend is a bit more unclear but the highest concentrations are clearly found at 98% oxygen. At 6 and 98% oxygen there is a clear trend that HEI formation increases with temperature. At 21 and 49% oxygen this trend is not so clear when going from 65 to 75oC, but also here an increase with temperature is seen. Higher concentration at higher oxygen concentration and temperature might be connected to higher amounts of ammonia also seen for the same experiments as shown in the next paragraph.
10 Author name / Energy Procedia 00 (2013) 000–000
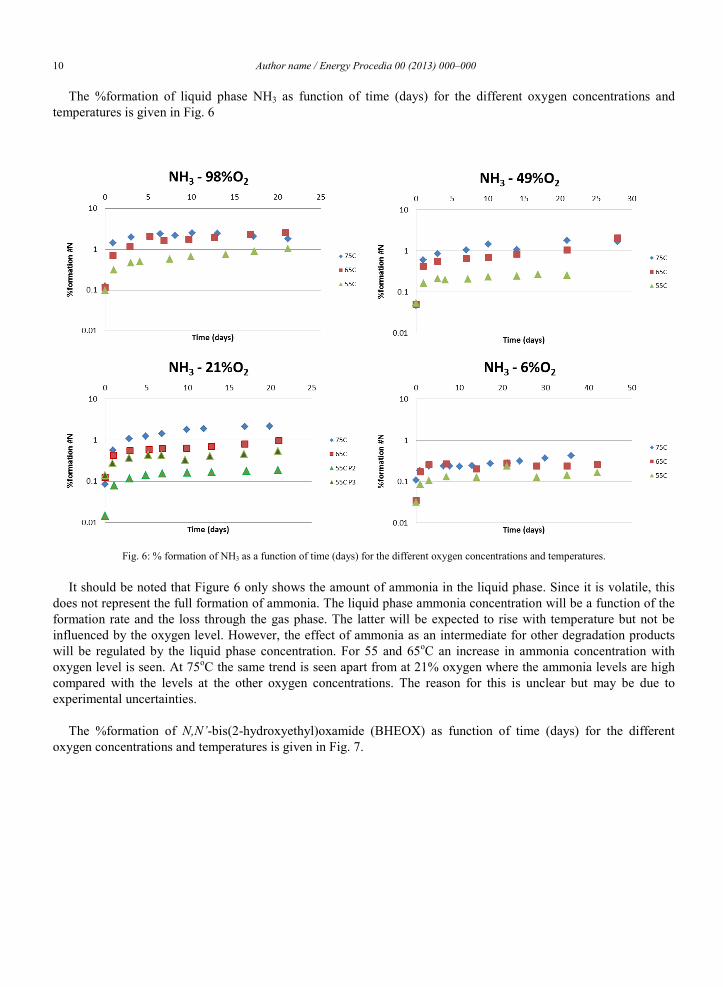
The %formation of liquid phase NH3 as function of time (days) for the different oxygen concentrations and temperatures is given in Fig. 6
Fig. 6: % formation of NH3 as a function of time (days) for the different oxygen concentrations and temperatures. It should be noted that Figure 6 only shows the amount of ammonia in the liquid phase. Since it is volatile, this
does not represent the full formation of ammonia. The liquid phase ammonia concentration will be a function of the formation rate and the loss through the gas phase. The latter will be expected to rise with temperature but not be influenced by the oxygen level. However, the effect of ammonia as an intermediate for other degradation products will be regulated by the liquid phase concentration. For 55 and 65oC an increase in ammonia concentration with oxygen level is seen. At 75oC the same trend is seen apart from at 21% oxygen where the ammonia levels are high compared with the levels at the other oxygen concentrations. The reason for this is unclear but may be due to experimental uncertainties.
The %formation of N,N’-bis(2-hydroxyethyl)oxamide (BHEOX) as function of time (days) for the different
oxygen concentrations and temperatures is given in Fig. 7.

Author name / Energy Procedia 00 (2013) 000–000 11
Fig. 7: % formation of BHEOX as a function of time (days) for the different oxygen concentrations and temperatures.
The formation of BHEOX shows somewhat different trends with temperature compared to the other degradation
products. The temperature sensitivity is low and actually reversed for 6% oxygen showing less formation of BHEOX at higher temperatures. At 55oC the trend for all oxygen concentrations is an increase in BHEOX formation with time. However, at 65oC the BHEOX formation, for the three highest oxygen levels, seems to level off after about 5-10 days and after that remain constant. The plateau is reached earlier at the higher oxygen concentrations. At 75°C the BHEOX concentration, for the three highest oxygen levels, reaches a maximum after about 5 days and then decreases. This may indicate that BHEOX is either an intermediate where the further reaction is more favored at higher temperatures, or is part of equilibrium reactions where the equilibrium shifts with temperature. At 6% oxygen the temperature trend is reversed as mentioned, possibly indicating that the further reaction is favored by increasing temperature, as also indicated at the other oxygen levels, and that the formation rate is slowed down by a lack of oxygen caused by the low oxygen pressure and also lower solubility at the higher temperatures.
The %formation of N-(2-hydroxyethyl)acetamide (HEA) as function of time (days) for the different oxygen
concentrations and temperatures is given in Fig. 8.

12 Author name / Energy Procedia 00 (2013) 000–000
Fig. 8: %formation of HEA as a function of time (days) at different oxygen concentrations and temperatures.
The formation trends for HEA are similar to most other degradation products. At constant oxygen concentration,
% formation increases with temperature, but this effect is small for 6% O2. At 55 and 65°C an increase in formation is seen until 49% O2 before it seems to stabilize, while for 75°C an increase in oxygen concentration gives higher formation of HEA over the whole range.
The %formation of N-(2-hydroxyethyl)formamide (HEF) as function of time (days) for the different oxygen
concentrations and temperatures is given in Fig. 9.

Author name / Energy Procedia 00 (2013) 000–000 13
% ( )*100i MEA
nitrogen
n nNn+
=
Fig. 9: %formation of HEF as a function of time (days) for different oxygen concentrations and temperatures.
At constant oxygen concentration only small increases in % formation are observed with increasing temperature,compared to other degradation compounds as HEPO. Keeping the temperature constant, an increase with oxygen concentration is observed. For 55 and 65°C increase with increasing oxygen concentration is observed up to 49% O2. At 75oC and 98% oxygen level the HEF formation goes through a maximum.
3.3. Liquid phase nitrogen balance
The end samples from each experiment were analyzed for nitrogen using the Kjeldahl method [7]. Density and weight of end solutions were also measured. Based on density and weight of the solution the number of moles of nitrogen (from Kjeldahl analysis), in all analyzed degradation compounds and in MEA (from LC-MS analysis) were calculated and the amount found in MEA and the degradation products could be compared with the Kjeldahl analyses. By summing up the percentage nitrogen accounted for, see Equation 4, in the different experiments could be found as given in Fig. 10.
(4)
where ni is mole of each organic degradation compounds, nMEA is mole of MEA and nnitrogen is mole of nitrogen in
liquid phase.

14 Author name / Energy Procedia 00 (2013) 000–000
Fig. 10: Nitrogen (%) accounted for in liquid phase for the experiments at different oxygen concentrations and temperature.
Based on this, Figure 10 shows that the nitrogen in the liquid phase is well accounted for in all the experiments at
6% oxygen concentration. At 55oC this is reasonably true also for the other oxygen concentrations even if it seems that the amount unaccounted for increases with increasing oxygen concentration. At 65°C and the two lowest oxygen levels also the nitrogen is reasonably well accounted for whereas at 49 and 98% oxygen almost 40% is not accounted for. At 75°C already at 21% oxygen the amount accounted for is nearly 40% and this drops to 50 and 53% at 49 and 98 % O2 respectively.
Reduction in nitrogen recovery at higher oxygen concentrations and temperatures may suggest that nitrogen containing degradation compounds are formed which are not identified or quantified in our analyses. There are two known nitrogen containing secondary degradation compounds without quantitative data, N-(2-hydroxyethyl)-2-[(2-hydroxyethyl)amino]-acetamide (HEHEAA) and 2-[(2-hydroxyethyl)amino]-2-oxo-acetic acid (HEOX). No standard was available for HEOX, and quantification of HEHEAA was only conducted for 21-P2 (55°C) and 21 O2 (75°C). HEHEAA has not been taken into account in nitrogen recovery above since data were available only for two samples. Also, HEHEAA was not one of the main contributors to the nitrogen recovery for these two experiments. The %formation of the different degradation compounds contributing to the nitrogen balance, as calculated by equation 3, is given in Table 3.

Author name / Energy Procedia 00 (2013) 000–000 15
Table 3: % formation of the degradation compounds for the end samples from each experiment.
T (°C) O2 (%) HEF NH3 HEI HEGly OZD HEA HEPO BHEOX MEA SUM 55
6 0.59 0.16 0.10 0.27 0.08 0.03 0.05 0.05 81 82 21-P1 0.46 3.16a 0.10 0.15 0.08 0.01 0.02 0.07 84 88 21-P2 0.85 0.19 0.10 0.16 0.07 0.02 0.02 0.07 86 87 21-P3 0.93 0.54 0.25 0.20 0.08 0.02 0.02 0.08 90 92
49 1.84 0.26 0.21 0.17 0.14 0.03 0.03 0.15 83 86 98 1.90 1.02 0.38 0.15 0.21 0.04 0.03 0.21 74 78
65
6 0.60 0.26 0.29 0.64 0.05 0.06 0.09 0.04 75 77 21-P1 1.51 b 0.52 0.54 0.08 0.06 0.08 0.06 91 94 21-P2 1.08 0.95 0.75 0.37 0.10 0.05 0.07 0.09 78 81
49 2.18 2.07 1.29 0.21 0.42 0.15 0.08 0.15 45 51 98 2.59 2.54 2.55 0.15 0.32 0.10 0.06 0.20 48 57
75
6 0.84 0.43 0.87 1.17 0.04 0.09 0.11 0.03 66 69 21 0.73 2.15 0.72 0.19 0.22 0.17 0.15 0.06 39 44 49 1.83 1.56 1.34 0.20 0.54 0.27 0.08 0.09 29 35 98 2.75 1.80 3.65 0.34 0.30 0.25 0.18 0.10 33 42
aAnalyzed by GC-MS, believed to be too high, see discussion [2]. bNot analyzed Table 3 shows that HEF, HEI and NH3 in most cases are the three main degradation compounds contributing to
the nitrogen balance for the experiment from 21-98 % O2. For 6% O2, HEGly is the main contributor followed by these three. For the rest of the degradation compounds the order varies, but is seems like OZD has a higher influence at higher oxygen concentrations.
4. Conclusions
Liquid phase degradation of MEA and the formation of 8 degradation compounds were studied at 4 different oxygen concentrations (6-98% O2) and three different temperatures (55-75°C). Liquid phase total nitrogen was determined and compared with quantified remaining MEA and degradation compounds.
The first order rate constant for MEA degradation was determined and found to increase with both oxygen concentration and temperature. The scatter in the data introduces significant uncertainty in the rate constant determination and additional verification by re-testing is needed for some of the experiments. HEPO and HEGly are important degradation compounds in pilot samples, and their behaviour in the plant has previously not been captured by laboratory degradation experiments. Their formation rate as function of oxygen concentration and temperature might explain the formation seen in pilot samples. HEPO and HEGly formation are both dependent on temperature, but the effect is stronger for HEPO. The effect of oxygen level is more complex. In particular the behaviour at 6% oxygen level is interesting as the formation of HEPO is the lowest and of HEGly the highest with respect to oxygen level. This shows that accelerated tests at high oxygen concentrations may not give results representative of industrial conditions.
Temperature and oxygen dependence are also observed for OZD. Higher formation is observed with increasing temperature and oxygen concentration. The effects at both the high temperatures (65 and 75°C) and high oxygen concentrations (49-98% O2) are less pronounced.
At 55 and 65oC the formation of HEI and ammonia increases with increasing oxygen concentration. At 75oC the trend is a bit more unclear but the highest concentrations of HEI are clearly found at 98% oxygen and the lowest concentration of ammonia at 6% O2. Increase in HEI formation is observed with temperature, especially between

16 Author name / Energy Procedia 00 (2013) 000–000
55oC and the higher temperatures. Less increase is observed between 65 and 75°C for constant oxygen level of 21, 49 and 98% O2. For ammonia, the temperature seems to have low impact at 6% O2 concentration. For respectively 65 and 75°C similar ammonia formation is observed for 49 and 98 % O2 concentration.
Low temperature sensitivity was observed for HEF and BHEOX, but somewhat more significant for HEA. For BHEOX less formation was observed at higher temperature at 6% oxygen concentration. At 55°C, BHEOX, HEF and HEA formation seems to increase with oxygen concentration. At higher temperatures and oxygen concentrations both BHEOX and HEF seem to go through maxima or reach a plateau.
The behaviour of the different degradation compounds is still uncertain because the reaction chemistry is not completely mapped. A complete overview of how all degradation compounds relate to each other is still necessary; which reactions give the same degradation compound, how does a certain compound contribute to other compounds and which of the reactions are favourable under the various conditions.
The end sample liquid phase nitrogen balance is almost closed at 6% O2. The nitrogen accounted for decreases with increasing temperature. For 49 and 98% O2 the nitrogen accounted for seems to be mainly a result of temperature and not increasing oxygen concentration. However at 21% O2, both oxygen and temperature affect the nitrogen balance. Assuming that the nitrogen unaccounted for is a result of formation of still unknown products, these degradation product are best sought for at higher temperatures. The main contributors to the nitrogen balance, except for MEA, were HEF, HEI and NH3. At 6 % O2, HEGly dominates. OZD seems to have a higher influence at higher oxygen concentrations.
Acknowledgements
The work was done within the EU project OCTAVIUS FP7/295645 and the support is highly appreciated.
References
1. da Silva, E.F., et al., Understanding 2-Ethanolamine Degradation in Postcombustion CO2 Capture. Industrial & Engineering Chemistry Research, 2012. 51(41): p. 13329-13338.
2. Vevelstad, S.J., et al., Oxidative degradation of 2-ethanolamine: The effect of oxygen concentration and temperature on product formation. International Journal of Greenhouse Gas Control, 2013. 18(0): p. 88-100.
3. Sexton, A.J. and G.T. Rochelle, Reaction Products from the Oxidative Degradation of Monoethanolamine. Industrial & Engineering Chemistry Research, 2011. 50(2): p. 667-673.
4. Lepaumier, H., D. Picq, and P.-L. Carrette, New Amines for CO2 Capture. II. Oxidative Degradation Mechanisms. Industrial & Engineering Chemistry Research, 2009. 48(20): p. 9068-9075.
5. Vevelstad, S.J., et al., Oxidative degradation of amines using a closed batch system. International Journal of Greenhouse Gas Control, 2013. 18(0): p. 1-14.
6. Supap, T., et al., Kinetics of sulfur dioxide- and oxygen-induced degradation of aqueous monoethanolamine solution during CO2 absorption from power plant flue gas streams. International Journal of Greenhouse Gas Control, 2009. 3(2): p. 133-142.
7. Kjeldahl, J., A new method of determining nitrogen in organic substances. Zeits. Anal. Chem., 1883. 22: p. 366-82.
8. Vevelstad, S.J., CO2 absorbent degradation, in Chemical Engineering. 2013, Norwegian University of Science and Technology (NTNU): Trondheim.
9. Lepaumier, H., et al., Degradation of MMEA at absorber and stripper conditions. Chemical Engineering Science, 2011. 66(15): p. 3491-3498.
10. Eide-Haugmo, I., Environmental impacts and aspects of absorbents used for CO2 capture, in Department of Chemical Engineering. 2011, Norwegian University of Science and Technology: Trondheim. p. 365.

Author name / Energy Procedia 00 (2013) 000–000 17
Appendix A.
All rate constant was found by plotting ln(CMEA,0/CMEA) against t. Linear regression gave the slope of k as given
in Figure A1 for experiment at 75°C, Figure A1 for 65°C and Figure A3 for 55°C.
Figure A1: Plotting of ln(CMEA,0/CMEA) against t for experiment at 75°C.

18 Author name / Energy Procedia 00 (2013) 000–000
Figure A2: Plotting of ln(CMEA,0/CMEA) against t for experiment at 65°C.

Author name / Energy Procedia 00 (2013) 000–000 19
Figure A3: Plotting of ln(CMEA,0/CMEA) against t for experiment at 55°C.