Embed Size (px)
Citation preview

1
High temperature oxygen NEXAFS valence band spectra
and conductivity of LaFe3/4Ni1/4O3 from 300 K to 773 K
Artur Braun1,a, Selma Erat1,2, Ahmad K. Ariffin3,4
Recardo Manzke3, Hiroki Wadati5, Thomas Graule1,6, Ludwig J. Gauckler2
1Laboratory for High Performance Ceramics Empa. Swiss Federal Laboratories for Materials Science and Technology
CH-8600 Dübendorf, Switzerland
2Department for Materials, Nonmetallic Inorganic Materials ETH Zürich-Swiss Federal Institute of Technology, CH-8037 Zürich, Switzerland
3Institut für Physik, Humboldt-Universität zu Berlin D-12489 Berlin, Germany
4Jabatan Fizik, Universiti Pendidikan Sultan Idris 35900 Perak, Malaysia
5Department of Applied Physics and Quantum-Phase Electronics Center (QPEC)
University of Tokyo, Tokyo 113-0032, Japan
6Technische Universität Bergakademie Freiberg D-09596 Freiberg, Germany
a Corresponding author. Phone +41 (0) 58 765 4850, Fax +41 (0) 58 765 4150, email:

2
Abstract
LaFe3/4Ni1/4O3 was subjected to oxygen near edge x-ray absorption fine structure
(NEXAFS) spectroscopy for 300 K < T < 773 K. The spectra show in the pre-edge a
small hole doped peak originating from Ni substitution. The relative spectral weight
of this transition to the weight of the hybridized O(2p) - Fe(3d) transitions scales with
T and has a maximum at around 600 K. The characteristic energies of the thermal
activated spectral intensity and conductivity suggest that the concentration of charge
transferred electrons from O(2p) to Ni(3d) increases and that the pre-edges account in
part for the polaron activated transport.
3
Introduction
The electronic structure of materials relevant for solid oxide fuel cell cathodes such as
La1-xSrxMeO3 (Me=Mn, Fe, Co, Ni) has been subject of increasing interest in the last
decades [1]. Electronic structure studies are limited to ambient temperature in the
context of fuel cell materials, and even lower temperatures in the context of
condensed matter theory. There are numerous high temperature (T → 1200 K)
transport studies and studies which address the crystallographic structure and their
changes as a function of stoichiometry, temperature, and oxygen partial pressure, in
particular high temperature neutron diffraction and x-ray diffraction studies.
Interestingly, there are virtually no studies on the electronic structure of cathode
materials for the high operation temperatures.
We have recently reported valence band photoemission spectroscopy (VB PES)
studies on LaSrFe-based and LaSrFeNi-based perovskites in ultra-high vacuum at
temperatures up to 673 K and 831 K, respectively. In these studies could we find a
correlation of details in the spectral characteristic of the VB PES data and in the
transport characteristics, suggesting that VB PES is an adequate method to study the
transport properties of ceramics at high temperatures at the molecular level [2-4].
Because the valence band and the density of states near the Fermi level are the
relevant parameter for the functionalities of materials, we employed also near edge x-
ray absorption fine structure (NEXAFS) spectroscopy at the oxygen K-edge.
Encouraged by the finding that the ratio of spectral weight of electron hole states and
hybridized states in the pre-edges of the oxygen NEXAFS spectra of LaSrFe-based
materials scale quantitatively with their electronic conductivity [5], we performed
oxygen NEXAFS spectroscopy for LaFeNi-oxide at temperatures from 300 K to 773
4
K. Here we found that the intensity of the Ni derived states increase with increasing
temperature.
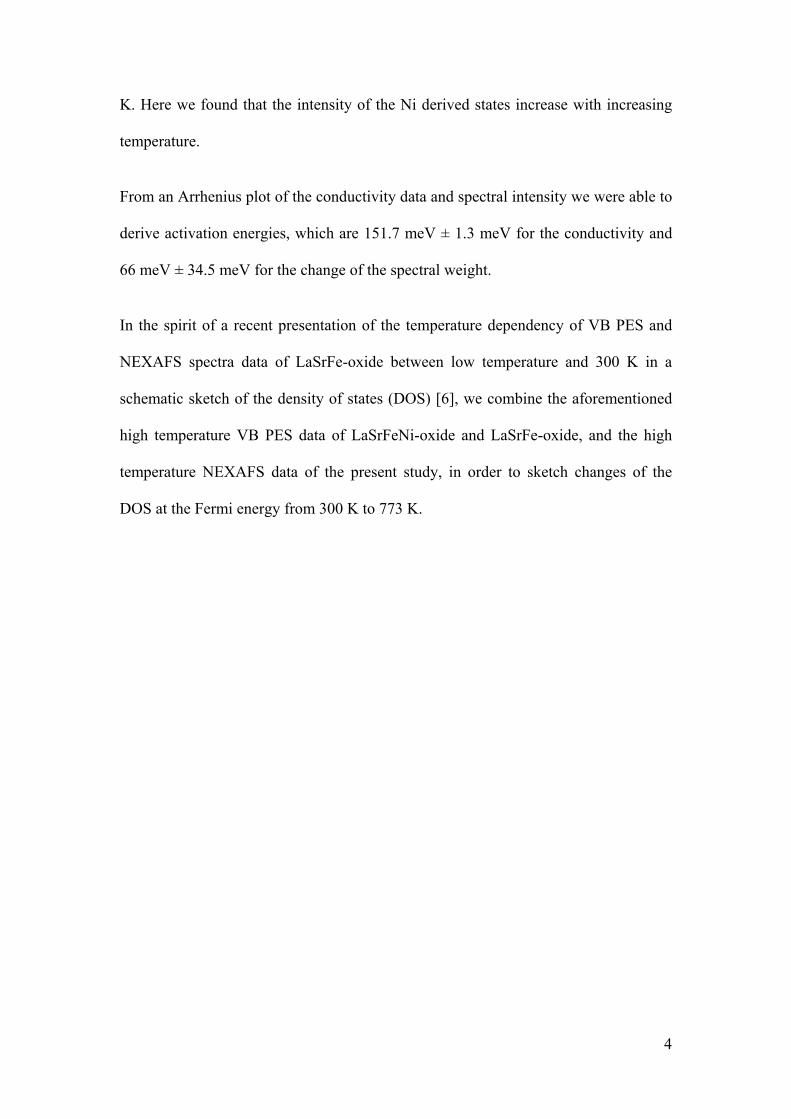
From an Arrhenius plot of the conductivity data and spectral intensity we were able to
derive activation energies, which are 151.7 meV ± 1.3 meV for the conductivity and
66 meV ± 34.5 meV for the change of the spectral weight.
In the spirit of a recent presentation of the temperature dependency of VB PES and
NEXAFS spectra data of LaSrFe-oxide between low temperature and 300 K in a
schematic sketch of the density of states (DOS) [6], we combine the aforementioned
high temperature VB PES data of LaSrFeNi-oxide and LaSrFe-oxide, and the high
temperature NEXAFS data of the present study, in order to sketch changes of the
DOS at the Fermi energy from 300 K to 773 K.

5
Experimental
Polycrystalline LaFe0.75Ni0.25O3-δ was prepared by conventional solid state reaction.
The precursors La2O3 (>99.99 %), SrCO3 (99.9 %), Fe2O3 (>99.0 %) and NiO (99.8
%) were mixed in stoichiometric proportions, calcined at 1473 K for 4 h and then
sintered at 1673 K for 12 h with 5 K/min heating/cooling rates. The powders were
pressed into 5 mm x 3 mm x 25 mm bars and sintered at 1673 K for 12 h with the
same heating/cooling rate [7].
The crystallographic structure has been determined by x-ray diffraction at 300 K:
LaFe0.75Ni0.25O3) has orthorhombic symmetry with space group Pbnm (62),
The 4-point DC conductivity of the samples was measured in a furnace in air at a
temperature range of 300 K to 1273 K [7].
Temperature dependent NEXAFS spectra were recorded at UE56/2-PGM1-beamline
at BESSY II using the BESSY/HU chamber, with the samples mounted on aluminum
sample holders and measured in vacuum with base pressure of about 10-8 mbar. Signal
detection was carried out in the total electron yield (TEY) mode. Temperature was
controlled by resistive heating of the sample holder and passive cooling, and
measured with a thermocouple in direct contact with the sample.
Background subtraction and normalization were performed by subtracting linear least
square fits for x-ray energies < 525 eV and > 550 eV. The relative uncertainties in the
peak height ratios, as determined by deconvolution of the spectra into Voigt functions
served as input for error propagation in order to obtain the uncertainty for the relative
spectral weight S (peak height ratio). Data reduction and analysis was performed with
WinXAS [9].

6
Results and Discussion
The crystallographic and electronic structure and the near edge x-ray absorption fine
structure (NEXAFS) spectrum at the oxygen K-shell absorption edge of the charge
transfer insulator LaFeO3 are well understood [5,10-12]. Figure 1 shows the oxygen
NEXAFS spectrum of LaFeO3 as reproduced after Wu et al. [10] and for comparison
our LaFe3/4Ni1/4O3 spectrum with deconvolution into particular resonances with
spectral assignment. LaFeO3 has a characteristic doublet in the valence band with
transitions from Fe3d-O2p hybridized states with spin up t2g and eg symmetry at
around 529 and 530 eV. Substitution on the A-site with Sr for example forms electron
holes which manifest in an extra transition with spin up eg symmetry just before this
doublet [13]. Similar holds for B-site substitution with Ni, for example [14], which we
notice upon close inspection of our spectrum of LaFe3/4Ni1/4O3 in Figure 1 (bottom),
where we see an extra small peak at about 527 eV which is absent in the spectrum of
LaFeO3 (top). The relative spectral weight ↑
↓ ↓ of the hole peak and the
doublet in LSF-based iron perovskites is quantitatively correlated with the electric
conductivity; this is particularly evident in systematic substitution studies such as
shown in [4] on Ta and Ti substituted LSF.
The oxygen NEXAFS spectra of LaFe3/4Ni1/4O3 in Figure 2 were recorded at
temperatures from 300 K to 773 K and precisely deconvoluted so as to be able to
accurately determine the relative peak heights and thus the relative spectral weight S.
The eg↑ peak at 300 K is barely visible and has an intensity of 0.08. The relative
intensities of the t2g↓ and eg↓ peaks are 1.600 and 1.338, respectively. We then find
that S ranges from 0.027 to 0.076 in the temperature range from 300 K to 773 K. The
7
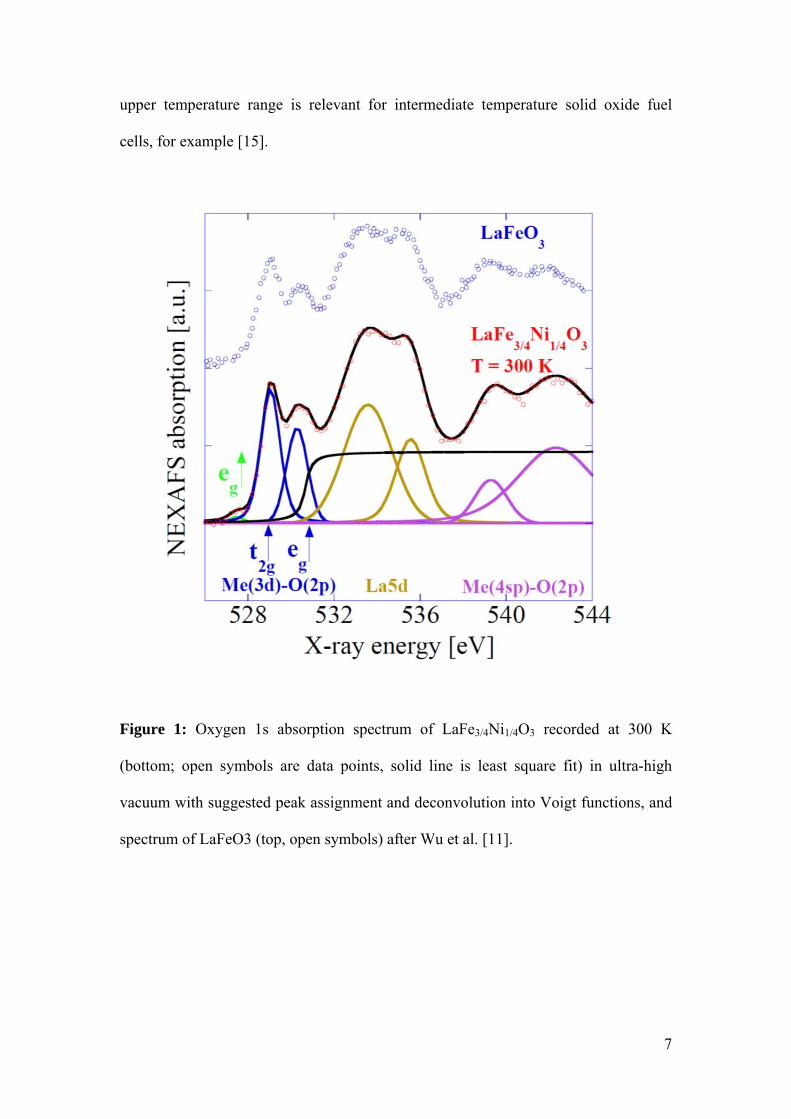
upper temperature range is relevant for intermediate temperature solid oxide fuel
cells, for example [15].
Figure 1: Oxygen 1s absorption spectrum of LaFe3/4Ni1/4O3 recorded at 300 K
(bottom; open symbols are data points, solid line is least square fit) in ultra-high
vacuum with suggested peak assignment and deconvolution into Voigt functions, and
spectrum of LaFeO3 (top, open symbols) after Wu et al. [11].

8
Figure 2: Oxygen 1s absorption spectra recorded at temperatures from 300 K to 773
K in ultra-high vacuum. Spectra are vertically offset by 1 unit for better comparison.
Numbers on the left show the relative peak height of eg↓; numbers on the right denote
the temperatures.
The electronic conductivity in LaSrFe-oxides [16] and LaSrFeNi-oxides and many
oxides are explained in term of thermally activated small polaron hopping [17,18],
which involves the trapping of an electron or electron hole at one crystallographic site
by the local lattice polarization which it causes [19]. The temperature dependent

9
conductivity σ(T) for small polaron hopping conductors is given by an exponential
relationship of the form σ·T exp(Ea/kBT) with activation Energy Ea and
Boltzmann’s constant k [20-24]. Figure 3 (top) shows the Arrhenius plot of
conductivity σ and relative spectral weight S for the sample. σ and S increase upon
temperature increase in the intermediate temperature range. σ starts to decrease at T >
895 K whereas S starts to decrease at lower temperature around T > 600 K.
Figure 3: Arrhenius plot for the conductivity (top, right axis) and spectral ratio S
(bottom, with error bars, left axis). Solid lines denote linear least square fits for the
determination of the activation energy.
The activation energy was determined in the temperature range of 305 K ≤ T ≤ 555 K
to around 151.7 meV.

10
LaFe0.75Ni0.25O3 has distorted orthorhombic symmetry in which the super exchange
angle <Fe/Ni–O–Fe/Ni> deviates from 180°. In addition it has completely Fe3+
configuration 3d5 at 300 K, where the hopping mechanism takes place in the super
exchange unit Fe3+–O–Fe3+ with antiferromagnetic super exchange interaction [8].
Since the hopping mechanism occurs via O bridge, the oxygen vacancies cause a
decrease in conductivity.
The symmetry of the lattice increases with temperature resulting in an increase in the
super exchange angle. This enhances overlapping between Fe/Ni (3d) and O (2p)
orbitals. The more overlapping of these orbitals decreases the electron-electron
interaction which is one of the reasons for resistivity.
The spectral ratio S in which eg↑ states are created due to hybridization between Ni
(3d) and O (2p) and the eg↓ + t2g↓ states are due to hybridization between Fe(3d) and
O (2p) increases with temperature up to 600 K, and then decreases. As we see in
Figure 2, the Ni derived empty eg↑ states are closer to EF than the two Fe derived
states. The Ni derived states are hence the more favourable states for charge transfer
mechanism which amounts to higher conductivity. This is the rational why LaFeO3 is
an insulator with 2 eV charge transfer band gap [5] whereas LaFe0.75Ni0.25O3 is a
semiconductor. Since the S ratio increases with increasing temperature, we conclude
that the concentration of charged transferred electrons from O(2p) to Ni(3d) (creating
an electron hole on O site) is increased by temperature up to 600 K. However, at
higher temperature the concentration of charge transferred electrons is reduced most
probably because of oxygen vacancies present. The temperature dependent changes in
S-ratio and in conductivity are not really paralleled. Therefore, it is worth to mention
that LaFe0.75Ni0.25O3 has two different mechanisms which contribute to the
conductivity: electron hopping and charge transfer.
Figure 4 shows the density of states for LaSrFeNi-oxide for temperatures from 300 K
to 773 K as derived from VB PES [1,2] and oxygen NEXAFS. Occupied (in
photoemission) and unoccupied states (in NEXAFS) are affected by temperature.
Interestingly, Sr doped LaFeO3 and Ni doped LaFeO3 show the eg↑ peak just above EF
virtually at the same energy. In the former case (heterovalent substitution), since La3+
is replaced by Sr which has lower valence (2+) the “new empty states” so called “hole
doped peak” are created. In the latter case (homovalent substitution), Ni affects the

11
unoccupied states and cause to redistribute these states and finally some states moved
towards EF. Further, these “redistributed states” increases up to 600 K.
Figure 4. Schematic for the density of states for LaSrFeNi-oxide for temperatures
from 300 K to 773 K as derived from VB PES [previous work in APL] and oxygen
NEXAFS. The red arrow represents increasing temperature and. The direction of the
arrow shows whether a structure increases/decreases in intensity, or shifts along the
energy axis [6].
Conclusion
LaFeO3 doped with Ni shows an extra pre peak due to Ni(3d)-O(2p) hybridization
observed in O K edge NEXAFS spectra and the intensity of this peak increases upon
temperature increase. In contrast to Sr doping, Ni doping does not create new hole
states but cause redistribution of empty states. The electric conductivity of
LaFe0.75Ni0.25O3 is explained by two different thermally activated mechanisms,
hopping process in Fe3+-O-Fe3+ chain and charge transfer process from O(2p) to
mainly Ni(3d). The temperature dependent spectral weight and conductivity shows

12
similar trend but not exactly the same which allows us to conclude that the differences
is because of the hopping process. The decrease in spectral weight is at lower
temperature than semiconducting to metallic like conductivity transition temperature.
This can be attributed to the differences in measurement environment: the O K edge
NEXAFS spectra were measured in UHV whereas conductivity was measured in open
air. The differences in the measurement environment affect the oxygen vacancies. The
vacancies are more easily created in vacuum than in air.
Acknowledgements
The research leading to these results received funding from the European
Community's Sixth Framework Marie Curie International Reintegration Programme
grant n°. 042095, Sixth Framework Programme (Real-SOFC n°. SES6-CT-2003-
502612), and Swiss National Science Foundation grant n°. 200021-116688. We
acknowledge Helmholtz-Zentrum Berlin - Electron storage ring BESSY II for
provision of synchrotron radiation at beamline MUSTANG UE-56 and are indebted to
A. Vollmer for supplying us with the high-temperature sample holder and W. Mahler,
M. Sperling B. Zada, T. Blume for support during the NEXAFS experiments.
References
[1] R. Chiba, F. Yoshimura, and Y. Sakurai, Solid State Ionics 152-153, 575, (2002).
[2] A. Braun, J. Richter, A. S. Harvey, S. Erat, A. Infortuna, A. Frei, E.
Pomjakushina, Bongjin S. Mun, P. Holtappels, U. Vogt, K. Conder, L. J. Gauckler,
and T. Graule. Appl. Phys. Lett. 93, 262103 (2008).
13
[3] A. Braun, X. Zhang, Y. Sun, U. Müller, Z. Liu, S. Erat, M. Ari, H. Grimmer, S. S.
Mao, and T. Graule. Appl. Phys. Lett. 95, 022107 (2009).
[4] A. Braun, S. Erat, R. Mäder, X. Zhang, Y. Sun, Z. Liu, Bongjin S. Mun, M. Ari,
H. Grimmer, E. Pomjakushina, S.S. Mao, K. Conder, L.J. Gauckler, and T. Graule. J.
Electron Spectr. Rel. Phenomena 181, 56-62 (2010).
[5] A. Braun, D. Bayraktar, S. Erat, A. S. Harvey, D. Beckel, J. A. Purton, Peter
Holtappels, L. J. Gauckler, and T. Graule. Appl. Phys. Lett. 94, 202102 (2009).
[6] H. Wadati, D. Kobayashi, A. Chikamatsu, R. Hashimoto, M. Takizawa, K. Horiba,
H. Kumigashira, T. Mizokawa, A. Fujimori, M. Oshima, M. Lippmaa, M. Kawasaki,
and H. Koinuma. J. Electron Spectr. Rel. Phenomena 144–147, 877–880 (2005).
[7] H. Wadati, A. Chikamatsu, R. Hashimoto, M. Takizawa, H. Kumigashira, A.
Fujimori, M. Oshima, M. Lippmaa, M. Kawasaki, H. Koinuma. J. Phys. Soc. Japan 75
(5), 054704 (2006).
[8] S. Erat, A. Braun, A. Ovalle, C. Piamonteze, Z. Liu, T. Graule, and L.J. Gauckler.
Appl. Phys. Lett., 95(17), 174108 (2009).
[9] S. Erat, A. Braun, C. Piamonteze, Z. Liu, A. Ovalle, H. Schindler, T. Graule, L. J.
Gauckler. J. Appl. Phys. 108, 124906 (2010).
[10] T. Ressler. J. Synchrotron Rad. 5 (2), 118-122 (1998).
[11] Jean-Claude Grenier, Norbert Ea, and Michel Pouchard. Mat. Res. Bull. 19,
1301-1309 (1984).

14
[12] Z. Y. Wu, M. Benfatto, M. Pedio, R. Cimino, S. Mobilio, S. R. Barman, K.
Maiti, and D. D. Sarma. Phys. Rev. B 56 (4), 2228-2233 (1997).
[13] M. Abbate, F. M. F. de Groot, J. C. Fuggle, A. Fujimori, O. Strebel, F. Lopez, M.
Domke, G. Kaindl, G. A. Sawatzky, M. Takano, Y. Takeda, H. Eisaki, and S. Uchida.
Phys. Rev. B 46, 4511–4519 (1992).
[14] A. Chainani, M. Mathew, D. D. Sarma. Phys. Rev. B 48, 14818–14825 (1993).
[15] D. D. Sarma, O. Rader, T. Kachel, A. Chainani, M. Mathew, K. Holldack, W.
Gudat, and W. Eberhardt. Phys. Rev. B 49, 14238–14243 (1994).
[16] E. Maguire, B. Gharbage, F.M.B. Marques, J.A. Labrincha. Solid State Ionics
127, 329–335 (2000).
[17] M.V. Patrakeeva, I.A. Leonidova, V.L. Kozhevnikova, and K.R. Poeppelmeier,
J. of Solid State Chem. 178, 921 (2005).
[18] K. Swierczek, J. Marzec, D. Palubiak, W. Zajac, and J. Molenda, Solid State
Ionics 177, 1811 (2006).
[19] E.V. Tsipis, E.A. Kiselev, V.A. Kolotygin, J.C. Waerenborgh, V.A. Cherepanov,
and V.V. Kharton, Solid State Ionics 179, 2170 (2008).
[20] P. A. Cox., Transition Metal Oxides; Oxford Science Publications: Oxford, U.K.,
1992.
[21] W. H. Jung, J. Mater. Sci. 41, 3143, (2006).
[22] W. H. Jung, J. Phys. Condens. Matter. 10, 8553 (1998).

15
[23] W. H. Jung, J. Mater. Sci. Lett. 17, 1317 (1998).
[24] W. H. Jung, E. Iguchi, J. Phys. D: Appl. Phys. 31, 794 (1998).