Embed Size (px)
Citation preview
University of Massachusetts Amherst University of Massachusetts Amherst
ScholarWorks@UMass Amherst ScholarWorks@UMass Amherst
Open Access Dissertations
2-2013
Effect of Colloidal Interactions on Formation of Glasses, Gels, Effect of Colloidal Interactions on Formation of Glasses, Gels,
Stable Clusters and Structured Films Stable Clusters and Structured Films
Anand Kumar Atmuri University of Massachusetts Amherst
Follow this and additional works at: https://scholarworks.umass.edu/open_access_dissertations
Part of the Chemical Engineering Commons
Recommended Citation Recommended Citation Atmuri, Anand Kumar, "Effect of Colloidal Interactions on Formation of Glasses, Gels, Stable Clusters and Structured Films" (2013). Open Access Dissertations. 680. https://doi.org/10.7275/349q-8v29 https://scholarworks.umass.edu/open_access_dissertations/680
This Open Access Dissertation is brought to you for free and open access by ScholarWorks@UMass Amherst. It has been accepted for inclusion in Open Access Dissertations by an authorized administrator of ScholarWorks@UMass Amherst. For more information, please contact [email protected].

EFFECT OF COLLOIDAL INTERACTIONS ONFORMATION OF GLASSES, GELS, STABLE CLUSTERS
AND STRUCTURED FILMS
A Dissertation Presented
by
ANAND KUMAR ATMURI
Submitted to the Graduate School of theUniversity of Massachusetts Amherst in partial fulfillment
of the requirements for the degree of
DOCTOR OF PHILOSOPHY
February 2013
Chemical Engineering
c© Copyright by Anand Kumar Atmuri 2013
All Rights Reserved
EFFECT OF COLLOIDAL INTERACTIONS ONFORMATION OF GLASSES, GELS, STABLE CLUSTERS
AND STRUCTURED FILMS
A Dissertation Presented
by
ANAND KUMAR ATMURI
Approved as to style and content by:
Surita R. Bhatia, Chair
Michael A. Henson, Member
Paul L. Dubin, Member
T. J. Mountziaris, Department ChairChemical Engineering

To my family.
ACKNOWLEDGEMENTS
First of all, I would like to thank The Almighty for all that He has given me. I
would like to thank all the people who have helped and inspired me during this study.
I am very thankful to my advisor, Prof. Surita R. Bhatia for her valuable guidance
and support. Her words during the meetings are constant source of support, encour-
aging and have always inspired me. Her wide knowledge and logical way of thinking
have been of great value for me. I would like to thank my committee; Prof. Michael
(Mike) Henson and Prof. Paul L. Dubin for their suggestions and remarks especially
towards the end of my thesis. I had the privilege to work with Mike and Paul on
different projects which gave me ample scope to learn new things and increased my
technical knowledge.
Financial support from NSF GOALI award (CBET- 0853551), the NSF-funded
Center for Hierarchical Manufacturing (CMMI-1025020) and Xerox Corporation are
highly appreciated without which this whole project would not have been feasible.
The coursework that I undertook at UMass has greatly improved my understanding
about fundamentals. I would like to thank the faculty of the Department of Chemical
Engineering, Chemistry and Polymer Science for the efforts they have undertaken
during these courses.
Lab is always a fun place to work, many thanks to my previous and current group
members Neha, Soumitra, Dave, Joe, Erika and Suhasini. I got the opportunity to
work with two undergrads George and Collin, I would like to thank them for the
time they put in to accomplish the project goals. I would like to express my deepest
gratitude to all my classmates, the grads in chemical engineering especially ELAB-II
people for creating pleasant atmosphere in lab and during social gatherings.
v

I also would like to thank Prof. Alexander Routh at University of Cambridge, his
group members and friends in the UK who made my stay a colourful and memorable
experience. I am grateful to the people in Xerox Corporation, Webster especially
Cheih-Min, Amy and Joo for their valuable inputs during my internship.
I would like to thank my masters advisors Prof. Devang Khakhar and late Prof.
Kartic Khilar without whom I would not be in the position where I am standing
now. My parents, family, friends back in India and here have always been my moral
support. I would like to thank them for their love and encouragement.
vi

ABSTRACT
EFFECT OF COLLOIDAL INTERACTIONS ONFORMATION OF GLASSES, GELS, STABLE CLUSTERS
AND STRUCTURED FILMS
FEBRUARY 2013
ANAND KUMAR ATMURI
B.Tech., JAWAHARLAL NEHRU TECHNOLOGICAL UNIVERSITY, INDIA
M.Tech., INDIAN INSTITUTE OF TECHNOLOGY BOMBAY, INDIA
Ph.D., UNIVERSITY OF MASSACHUSETTS AMHERST
Directed by: Professor Surita R. Bhatia
Colloidal suspensions are ubiquitous because of their vast industrial and house-
hold usage. We demonstrate that interactions between colloidal particles play a cru-
cial role in manipulating the phase behavior and thereby the macroscopic properties
of a variety of colloidal materials, including structured films, gels, glasses and stable
clusters. First, we examined films comprised of two different colloidal particles and
investigated the impact of colloidal interactions in manipulating the extent of segre-
gation in the dried films. A transport model was used to predict the volume fraction
profiles of the particles as a function of film thickness, which showed that segregation
could be altered by changing the particle interactions. Experimental studies were
carried out using different charged latex particles and varying the pH to change the
interactions, and the results from experiments and model show a very good agree-
ment to capture the extent of segregation. Second, we studied the effect of adding low
vii

molecular weight adsorbing and non-adsorbing polymers to suspensions to modify the
interparticle interactions. We studied the structural dynamics and bulk rheology of a
disk-shaped clay colloid, laponite R©, and polymer. Under basic conditions laponite R©
forms a repulsive colloidal glass. We show that low concentrations of an adsorbing
polymer retards glass formation, whereas at higher concentrations an attractive glass
is formed. Thus, we obtain a type of re-entrant glass transition, which is a first of
its kind observed in anisotropic colloids with adsorbing polymer. On the other hand
addition of a non-adsorbing polymer to laponite R© suspensions triggers the formation
of particle clusters, and increasing the concentration of polymer increases the strength
of attraction between the particles and the size of the clusters.
To further understand formation of stable clusters, we utilized population balance
equations (PBE) models to study aggregation of charged colloids under quiescent
conditions. We considered particles with a DLVO-type potential, where the interac-
tions are a sum of van der Waals attraction and electrostatic repulsion. Under certain
conditions, the net repulsion between large aggregates and a single particle acts as a
barrier against further aggregation, and clusters reach a stable size. The PBE model
was used to map out regimes of uncontrolled aggregation, controlled aggregation, and
no aggregation as a function of ionic strength and colloid weight fraction. The model
was tested using experimental data on charged latex particles with different colloid
weight fractions and ionic strengths. The model was able to predict the regime of
controlled aggregation and final size of aggregates very well. However, the rate of
aggregation predicted by the model was much faster than observed experimentally.
Finally, we explored aggregation of latex particles in a shear environment similar to
that used in industrial toner production processes. We studied the effect of temper-
ature, pH and coagulant concentration on aggregation and showed that there is a
optimum variable space to have aggregates of controlled size and distribution.
viii
TABLE OF CONTENTS
Page
ACKNOWLEDGEMENTS . . . . . . . . . . . . . . . . . . . . . . . . . . . . . . . . . . . . . . . . . . . v
ABSTRACT . . . . . . . . . . . . . . . . . . . . . . . . . . . . . . . . . . . . . . . . . . . . . . . . . . . . . . . . . vii
LIST OF TABLES . . . . . . . . . . . . . . . . . . . . . . . . . . . . . . . . . . . . . . . . . . . . . . . . . . . . xi
LIST OF FIGURES . . . . . . . . . . . . . . . . . . . . . . . . . . . . . . . . . . . . . . . . . . . . . . . . . . xii
CHAPTER
BACKGROUND INFORMATION . . . . . . . . . . . . . . . . . . . . . . . . . . . . . . . . . . . . 1
1. AUTO-STRATIFICATION IN DRYING COLLOIDALDISPERSIONS: EFFECT OF PARTICLEINTERACTIONS . . . . . . . . . . . . . . . . . . . . . . . . . . . . . . . . . . . . . . . . . . . . . . . 7
1.1 Introduction . . . . . . . . . . . . . . . . . . . . . . . . . . . . . . . . . . . . . . . . . . . . . . . . . . . . . 71.2 Numerical Analysis . . . . . . . . . . . . . . . . . . . . . . . . . . . . . . . . . . . . . . . . . . . . . . . 9
1.2.1 Effect of particulate interactions . . . . . . . . . . . . . . . . . . . . . . . . . . . . . 111.2.2 Effect of particle charge . . . . . . . . . . . . . . . . . . . . . . . . . . . . . . . . . . . . 171.2.3 Case with one particle type preferentially attracted to the top
surface . . . . . . . . . . . . . . . . . . . . . . . . . . . . . . . . . . . . . . . . . . . . . . . . 22
1.3 Experimental . . . . . . . . . . . . . . . . . . . . . . . . . . . . . . . . . . . . . . . . . . . . . . . . . . . 22
1.3.1 Materials . . . . . . . . . . . . . . . . . . . . . . . . . . . . . . . . . . . . . . . . . . . . . . . . . 221.3.2 Methods . . . . . . . . . . . . . . . . . . . . . . . . . . . . . . . . . . . . . . . . . . . . . . . . . 24
1.4 Results and Discussion . . . . . . . . . . . . . . . . . . . . . . . . . . . . . . . . . . . . . . . . . . . 251.5 Conclusion . . . . . . . . . . . . . . . . . . . . . . . . . . . . . . . . . . . . . . . . . . . . . . . . . . . . . 281.6 Acknowledgements . . . . . . . . . . . . . . . . . . . . . . . . . . . . . . . . . . . . . . . . . . . . . . . 29
ix
2. A RE-ENTRANT GLASS TRANSITION IN COLLOIDALDISKS WITH ADSORBING POLYMER . . . . . . . . . . . . . . . . . . . . . . 30
2.1 Introduction . . . . . . . . . . . . . . . . . . . . . . . . . . . . . . . . . . . . . . . . . . . . . . . . . . . . 302.2 Materials and Methods . . . . . . . . . . . . . . . . . . . . . . . . . . . . . . . . . . . . . . . . . . . 332.3 Results and Discussion . . . . . . . . . . . . . . . . . . . . . . . . . . . . . . . . . . . . . . . . . . . 352.4 Conclusion . . . . . . . . . . . . . . . . . . . . . . . . . . . . . . . . . . . . . . . . . . . . . . . . . . . . . 472.5 Supplementary information . . . . . . . . . . . . . . . . . . . . . . . . . . . . . . . . . . . . . . . 48
3. POLYMER-MEDIATED CLUSTERING OF CHARGEDANISOTROPIC COLLOIDS . . . . . . . . . . . . . . . . . . . . . . . . . . . . . . . . . . . 52
3.1 Introduction . . . . . . . . . . . . . . . . . . . . . . . . . . . . . . . . . . . . . . . . . . . . . . . . . . . . 523.2 Materials and Methods . . . . . . . . . . . . . . . . . . . . . . . . . . . . . . . . . . . . . . . . . . . 553.3 Results and Discussion . . . . . . . . . . . . . . . . . . . . . . . . . . . . . . . . . . . . . . . . . . . 563.4 Conclusion . . . . . . . . . . . . . . . . . . . . . . . . . . . . . . . . . . . . . . . . . . . . . . . . . . . . . 68
4. CONTROLLED AGGREGATION OF CONCENTRATEDCOLLOIDAL SUSPENSIONS IN A SHEARENVIRONMENT . . . . . . . . . . . . . . . . . . . . . . . . . . . . . . . . . . . . . . . . . . . . . . 70
4.1 Introduction . . . . . . . . . . . . . . . . . . . . . . . . . . . . . . . . . . . . . . . . . . . . . . . . . . . . 704.2 Materials and Methods . . . . . . . . . . . . . . . . . . . . . . . . . . . . . . . . . . . . . . . . . . . 714.3 Results and Discussion . . . . . . . . . . . . . . . . . . . . . . . . . . . . . . . . . . . . . . . . . . . 724.4 Conclusion . . . . . . . . . . . . . . . . . . . . . . . . . . . . . . . . . . . . . . . . . . . . . . . . . . . . . 774.5 Acknowledgements . . . . . . . . . . . . . . . . . . . . . . . . . . . . . . . . . . . . . . . . . . . . . . . 78
5. PROCESS MODELS TO PREDICT REGIMES OFCONTROLLED NANOPARTICLE AGGREGATION . . . . . . . . . . 79
5.1 Introduction . . . . . . . . . . . . . . . . . . . . . . . . . . . . . . . . . . . . . . . . . . . . . . . . . . . . 795.2 Materials and Methods . . . . . . . . . . . . . . . . . . . . . . . . . . . . . . . . . . . . . . . . . . . 825.3 Theory . . . . . . . . . . . . . . . . . . . . . . . . . . . . . . . . . . . . . . . . . . . . . . . . . . . . . . . . . 835.4 Results and Discussion . . . . . . . . . . . . . . . . . . . . . . . . . . . . . . . . . . . . . . . . . . . 85
5.4.1 Interaction potential between particles and aggregates . . . . . . . . . . 855.4.2 Aggregation experiments . . . . . . . . . . . . . . . . . . . . . . . . . . . . . . . . . . . 865.4.3 PBE modelling . . . . . . . . . . . . . . . . . . . . . . . . . . . . . . . . . . . . . . . . . . . 90
5.5 Conclusion . . . . . . . . . . . . . . . . . . . . . . . . . . . . . . . . . . . . . . . . . . . . . . . . . . . . . 965.6 Acknowledgements . . . . . . . . . . . . . . . . . . . . . . . . . . . . . . . . . . . . . . . . . . . . . . . 96
BIBLIOGRAPHY . . . . . . . . . . . . . . . . . . . . . . . . . . . . . . . . . . . . . . . . . . . . . . . . . . . 97
x

LIST OF TABLES
Table Page
3.1 Parameters from the fits of DLS data after 30 days of aging toequation (3.1) . . . . . . . . . . . . . . . . . . . . . . . . . . . . . . . . . . . . . . . . . . . . . . . 68
5.1 Fit parameters at different colloid weight fractions . . . . . . . . . . . . . . . . . . . 91
xi
LIST OF FIGURES
Figure Page
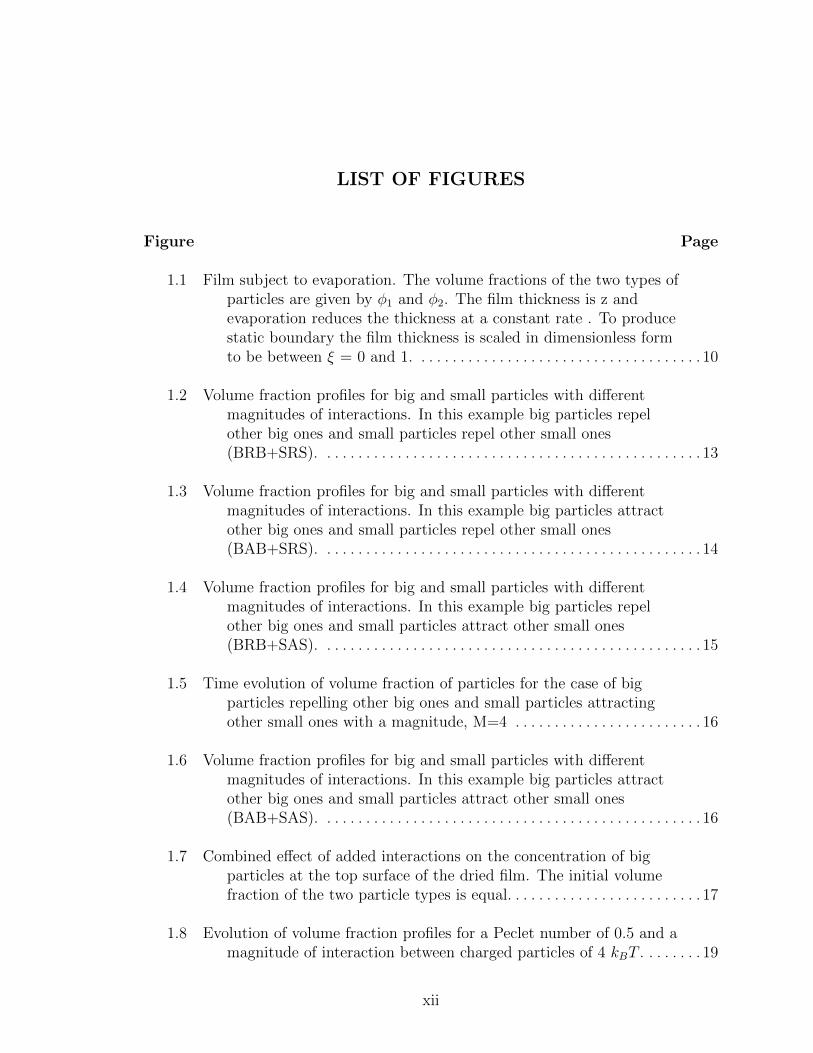
1.1 Film subject to evaporation. The volume fractions of the two types ofparticles are given by φ1 and φ2. The film thickness is z andevaporation reduces the thickness at a constant rate . To producestatic boundary the film thickness is scaled in dimensionless formto be between ξ = 0 and 1. . . . . . . . . . . . . . . . . . . . . . . . . . . . . . . . . . . . . 10
1.2 Volume fraction profiles for big and small particles with differentmagnitudes of interactions. In this example big particles repelother big ones and small particles repel other small ones(BRB+SRS). . . . . . . . . . . . . . . . . . . . . . . . . . . . . . . . . . . . . . . . . . . . . . . . . 13
1.3 Volume fraction profiles for big and small particles with differentmagnitudes of interactions. In this example big particles attractother big ones and small particles repel other small ones(BAB+SRS). . . . . . . . . . . . . . . . . . . . . . . . . . . . . . . . . . . . . . . . . . . . . . . . . 14
1.4 Volume fraction profiles for big and small particles with differentmagnitudes of interactions. In this example big particles repelother big ones and small particles attract other small ones(BRB+SAS). . . . . . . . . . . . . . . . . . . . . . . . . . . . . . . . . . . . . . . . . . . . . . . . . 15
1.5 Time evolution of volume fraction of particles for the case of bigparticles repelling other big ones and small particles attractingother small ones with a magnitude, M=4 . . . . . . . . . . . . . . . . . . . . . . . . 16
1.6 Volume fraction profiles for big and small particles with differentmagnitudes of interactions. In this example big particles attractother big ones and small particles attract other small ones(BAB+SAS). . . . . . . . . . . . . . . . . . . . . . . . . . . . . . . . . . . . . . . . . . . . . . . . . 16
1.7 Combined effect of added interactions on the concentration of bigparticles at the top surface of the dried film. The initial volumefraction of the two particle types is equal. . . . . . . . . . . . . . . . . . . . . . . . . 17
1.8 Evolution of volume fraction profiles for a Peclet number of 0.5 and amagnitude of interaction between charged particles of 4 kBT . . . . . . . . 19
xii
1.9 Volume fraction profiles for a Peclet number of 0.5 and variousmagnitudes of interaction between the charged particles. . . . . . . . . . . . 19
1.10 Evolution of volume fraction profiles for a Peclet number of 4 and amagnitude of interaction between charged particles of 4 kBT . . . . . . . . 20
1.11 Volume fraction profiles for a Peclet number of 4 and variousmagnitudes of interaction between the charged particles. . . . . . . . . . . . 20
1.12 Volume fraction profiles for M=4 at different Peclet numbers. . . . . . . . . . . 21
1.13 Cryo SEM image of dried film containing two particle types. Noticethe large accumulation of small particles at the film/air interfacewhich is not present even one particle layer below the surface. . . . . . . 23
1.14 Volume fraction profiles for big and small particles over the filmthickness after drying time of τ = 0.55. The large particles havean attraction for the top surface and hence an increase in thelarge particle volume fraction at the top. . . . . . . . . . . . . . . . . . . . . . . . . 23
1.15 Zeta potential of both particle types measured using a BrookhavenZetaPALS as a function of pH. The big particles have aniso-electric point around a pH of 3. . . . . . . . . . . . . . . . . . . . . . . . . . . . . . . 24
1.16 AFM image of a dried film prepared with a dispersion at pH=5(Image size 2 µm × 2µm). . . . . . . . . . . . . . . . . . . . . . . . . . . . . . . . . . . . . . 25
1.17 Fraction of big particles at the top surface, as measured by AFM, forvarious pH values after drying. Each film was measured at fourdifferent locations, the average and standard deviation shown. . . . . . . 26
2.1 Elastic modulus versus frequency for samples at 2 wt% laponite R© andvarious concentrations of polymer at (a) 21 days (b) 60 days and(c) 90 days after sample preparation. (Data for polymerconcentrations below the critical concentration of 1.25 wt% areshown in black, at 1.25 wt% in red, and above 1.25 wt% in blue).36
2.2 Elastic modulus at 1 Hz for various concentrations of polymer afterdifferent days of aging . . . . . . . . . . . . . . . . . . . . . . . . . . . . . . . . . . . . . . . . . 37
2.3 Normalized autocorrelation function for different polymerconcentration after 11 days of aging . . . . . . . . . . . . . . . . . . . . . . . . . . . . . 39
xiii

2.4 Normalized autocorrelation function for different polymerconcentrations after (a) 30 days (b) 50 days (c) 90 days of aging.For clarity, only every 10th data point is shown, and only selectedconcentrations are shown. Lines are guide to the eye. (Data withthe same designations as figure 2.1). . . . . . . . . . . . . . . . . . . . . . . . . . . . . . 40
2.5 Value of g2(∞) as a function of concentration after various days ofaging. . . . . . . . . . . . . . . . . . . . . . . . . . . . . . . . . . . . . . . . . . . . . . . . . . . . . . . . 41
2.6 Value of g2(∞) as a function of aging days for various concentrationsof polymer. . . . . . . . . . . . . . . . . . . . . . . . . . . . . . . . . . . . . . . . . . . . . . . . . . . 42
2.7 Schematic of laponite R© dispersions, showing initial structure (left)and structure after aging (right) for samples with (a) no polymer,(b) adsorbing polymer below the saturation concentration, and (c)adsorbing polymer above the saturation concentration. . . . . . . . . . . . . 44
2.8 (a) State diagram for 2 wt% laponite R© dispersions and varyingamounts of 20 kg/mol PEO, showing evolution of arrested stateswith aging time. (b) Proposed qualitative state diagram at longaging times for colloidal dispersions at a fixed particle volumefraction with adsorbing polymer. The gel and liquid phases shownare based on earlier studies of 2 wt% laponite R© with addedPEO.1 . . . . . . . . . . . . . . . . . . . . . . . . . . . . . . . . . . . . . . . . . . . . . . . . . . . . . . 46
2.9 Loss modulus versus frequency for samples at 2 wt% laponite R© andvarious concentrations of polymer at 21 days . . . . . . . . . . . . . . . . . . . . . 48
2.10 Loss modulus versus frequency for samples at 2 wt% laponite R© andvarious concentrations of polymer at 60 days . . . . . . . . . . . . . . . . . . . . . 49
2.11 Loss modulus versus frequency for samples at 2 wt% laponite R© andvarious concentrations of polymer at 90 days . . . . . . . . . . . . . . . . . . . . . 49
2.12 tan(δ) versus frequency for samples at 2 wt% laponite R© and variousconcentrations of polymer at 21 days . . . . . . . . . . . . . . . . . . . . . . . . . . . . 50
2.13 tan(δ) versus frequency for samples at 2 wt% laponite R© and variousconcentrations of polymer at 60 days . . . . . . . . . . . . . . . . . . . . . . . . . . . . 50
2.14 tan(δ) versus frequency for samples at 2 wt% laponite R© and variousconcentrations of polymer at 90 days . . . . . . . . . . . . . . . . . . . . . . . . . . . . 51
xiv

3.1 Normalized autocorrelation function for 3 wt% laponite R© anddifferent concentrations of polymer, cp, after (a) 1 day (b) 30 daysof aging. For clarity, every 10th data point is shown in each series.The lines for the data series with polymer are fits to equation(3.1). . . . . . . . . . . . . . . . . . . . . . . . . . . . . . . . . . . . . . . . . . . . . . . . . . . . . . . . 58
3.2 Normalized auto correlation for 2 wt% laponite R© and differentconcentrations of polymer after 30 days. For clarity, every 10thdata point is shown in each series. The lines for the data serieswith polymer are fits to equation (3.1). . . . . . . . . . . . . . . . . . . . . . . . . . . 59
3.3 Λ vs q2 for 2 wt% laponite R© and 0.25% polymer after aging for 300days. . . . . . . . . . . . . . . . . . . . . . . . . . . . . . . . . . . . . . . . . . . . . . . . . . . . . . . . . 60
3.4 First relaxation time, τ1, as a function of aging time for suspensionsof 3 wt% laponite R© at different polymer concentrations . . . . . . . . . . . . 61
3.5 Mean relaxation time, τm, as a function of aging time for suspensionsof 3 wt% laponite R© at different polymer concentrations . . . . . . . . . . . . 62
3.6 First relaxation time, τ1, as a function of polymer concentration fordifferent laponite R© concentrations for samples aged 30 days. . . . . . . . . 63
3.7 Mean relaxation time, τm, as a function of polymer concentration fordifferent laponite R© concentrations for samples aged 30 days. . . . . . . . . 64
3.8 Effective size of clusters derived from the mean relaxation time for 2wt% laponite R© at different polymer concentrations. . . . . . . . . . . . . . . . 65
3.9 Elastic modulus as a function of frequency for different polymerconcentrations(shown in the legend) for laponite R© concentrations: (a) 3 wt% (b) 2 wt% . . . . . . . . . . . . . . . . . . . . . . . . . . . . . . . . . . . . . . . . 66
3.10 tan(δ) as a function of frequency for different polymerconcentrations(shown in the legend) for laponite R© concentrations: (a) 3 wt% (b) 2 wt% . . . . . . . . . . . . . . . . . . . . . . . . . . . . . . . . . . . . . . . . 67
4.1 Effect of PAC concentration, in pph of solids, on aggregationkinetics. . . . . . . . . . . . . . . . . . . . . . . . . . . . . . . . . . . . . . . . . . . . . . . . . . . . . . 73
4.2 Evolution of particle size distribution for a PAC concentration of 0.13pph of solids . . . . . . . . . . . . . . . . . . . . . . . . . . . . . . . . . . . . . . . . . . . . . . . . . 74
4.3 Effect of temperature on aggregation kinetics for a PACconcentration of 0.13 pph of solids. . . . . . . . . . . . . . . . . . . . . . . . . . . . . . . 74
xv

4.4 Final particle size distribution at different temperatures at a PACconcentration of 0.18 pph of solids. . . . . . . . . . . . . . . . . . . . . . . . . . . . . . . 75
4.5 Mean size as a function of temperature at different PACconcentrations in pph of solids. . . . . . . . . . . . . . . . . . . . . . . . . . . . . . . . . . 75
4.6 Volume percent of coarse aggregates (diameter > 11.2 µm) as afunction of temperature at different PAC concentrations. . . . . . . . . . . . 76
4.7 Time evolution of aggregate size for different pHs at a PACconcentration of 0.18 pph of solids and temperature of 45◦C. . . . . . . . 77
4.8 Volume percent of aggregates in ”toner range” at different pHs at aPAC concentration of 0.18 pph of solids and temperature of45◦C. . . . . . . . . . . . . . . . . . . . . . . . . . . . . . . . . . . . . . . . . . . . . . . . . . . . . . . . 78
5.1 Interaction energy as a function of distance of separation withparameters A=3.08 × 10⁻²⁰J, ψ0 = 59mV , for a particle size of200 nm (a) ionic strength = 0.2 M (b) different ionic strengths . . . . . . 87
5.2 Total interaction energy as a function of distance of separationbetween a fixed particle size and particles of different size,parameters used are the same as in figure 5.1 at an ionic strengthof 0.2 M . . . . . . . . . . . . . . . . . . . . . . . . . . . . . . . . . . . . . . . . . . . . . . . . . . . . . 88
5.3 Experimental measurements of particle aggregation for a 5 wt%suspension at different salt concentrations. . . . . . . . . . . . . . . . . . . . . . . . 88
5.4 Experimental measurements of particle aggregation for a 10 wt%suspension at different salt concentrations . . . . . . . . . . . . . . . . . . . . . . . . 89
5.5 Experimental measurements of particle aggregation for a 15 wt%suspension at different salt concentrations. . . . . . . . . . . . . . . . . . . . . . . . 89
5.6 Comparison of size distribution model and experiment for a 5 wt%suspension at a salt concentration of 0.29 M. . . . . . . . . . . . . . . . . . . . . . 90
5.7 PBE model results for the mean size of aggregates at different saltconcentrations for 5 wt % suspension. . . . . . . . . . . . . . . . . . . . . . . . . . . . 91
5.8 PBE model results for the mean size of aggregates at different saltconcentrations for 10 wt % suspension. . . . . . . . . . . . . . . . . . . . . . . . . . . 93
5.9 PBE model results for the mean size of aggregates at different saltconcentrations for 15 wt % suspension. . . . . . . . . . . . . . . . . . . . . . . . . . . 93
xvi
5.10 Stable mean aggregate size as a function of ionic strength at differentcolloid weight fractions. . . . . . . . . . . . . . . . . . . . . . . . . . . . . . . . . . . . . . . . 94
xvii

BACKGROUND INFORMATION
Motivation
Colloids are mesoscopic particles dispersed in a continuous medium. Common
examples of colloidal dispersions include milk, paint, ink, cosmetic products and so
on. In this work we focus on suspensions comprising solid submicron sized particles
dispersed in a liquid medium. Colloidal suspensions have long been of interest to
researchers and scientists because of their vast industrial applications and interesting
underlying physics. By changing the nature/amplitude of interactions between the
particles, one can obtain gels, glasses, fluids of clusters and so on. So to control
the final state of the suspension, the underlying physics of the interactions between
the particles should be understood. This can also help in efficient processing and
handling of colloidal materials. In my thesis, we will explore the role of interparticle
interactions in determining the phase behaviour and structure in various systems
including glasses, gels and films.
When we think of colloidal systems, the simplest case are hard spheres in which
particles neither repel nor attract over distances greater than their diameter, but
cannot interpenetrate because of infinite repulsion when they touch each other.2 The
only control parameter in such a system is the particle volume fraction, φ. For φ <
0.49, the suspension is a fluid, for 0.545 < φ < 0.74, the equilibrium state is a crystal.3
In the intermediate volume fractions two phases co-exist, some particles crystallize
while some remain in the fluid with constant exchange between the two. But when
φ ∼ 0.58, if nucleation is avoided the system arrests to form a solid and is far from
the equilibrium ordered phase,4 and remains as disordered structurally. This frozen
1

state is termed as glass (also called as repulsive glass, because the kind of interactions
are repulsive). In hard sphere suspensions, particles are free to move and undergo
Brownian motion, so the time averaged properties are equal to the ensembled average,
such a system is called ergodic. By contrast, particles in a glass are bounded and are
able to move only in small regions of space within the cage created by crowding of
other particles. This is termed non-ergodic.5
The situation becomes complex when the particles have additional interactions
which can be purely repulsive, purely attractive, or a combination of both.6 When
the particles have a large enough surface charge, the interactions extend over large
distances greater than the diameter of the particles (described by the Debye screen-
ing length, the characteristic length or screening distance over which the Coulomb
repulsion decays). Many hard sphere analogies can be used to describe the behavior
of these systems, using a renormalized radius.7 On the other hand, when attraction
dominates, suspensions may become thermodynamically and kinetically unstable and
form aggregates, and an interconnected network or colloidal gels can be formed.4 The
system becomes even more complex when we have both attractions and repulsions
are present.
The simplest case in charged systems for by van der Waals attraction and elec-
trostatic repulsion arising from the charge on the surface. This is strongly influenced
by the counterions in the solution. The shape of the interaction potential between
the particles is treated as the sum of the two.8 Addition of enough salt screens the
electrostatic repulsion so the interaction potential is dominated by attractions. An-
other way of manipulating the interactions between the particles is by adjusting the
pH which changes the surface charge of the particles thereby affecting the overall
potential.9 In this thesis, chapter 1 explores this type of interaction as it relates to
drying film coatings where segregation of particles can be manipulated by varying the
2

interactions via adjusting the pH. This work was performed with Prof. Alexander F.
Routh, University of Cambridge.
An interplay between the attractions and repulsions play a major rule in the
kinetic and thermodynamic stability of these suspensions. Such a study of stability
is known as the DLVO theory (Derjaguin-Landau-Verwey-Overbeek). Using DLVO
theory, the dependence of colloid stability on various parameters, that determine
the shape and magnitude of interaction energy between the particles like the surface
potential, Hamaker constant and the ionic strength of the suspension can be studied
quantitatively.10 The role of these interactions in tuning the final aggregate size to
form a colloidal stable suspension under quiescent conditions is studied in chapter
5. This work was performed in collaboration with Prof. Michael A. Henson, UMass
Amherst. Such suspensions with a shear component that introduces breakage is
more industrially relevant for high throughput. Chapter 4 discusses the effect of
temperature, pH and strength of interaction between the particles on the formation of
dense stable clusters in a shear environment. This was a collaborative work performed
at Xerox Corporation.
It becomes more complicated when interactions are driven by polymer in solution.
When polymers are added to the colloidal suspension, it can either adsorb or not ad-
sorb onto the surface, depending on the type of polymer and its interaction with the
particle surface. In a suspension with a non-adsorbing polymer, attractions termed
as ”depletion attractions” arise because the net force generated due to the osmotic
pressure difference caused by excluded volume effect of polymer molecules, ”pushes”
the particles closer.11 In this case, we have three parameters governing the interac-
tion: the colloid volume fraction, the strength of the attraction (dependent on the
polymer concentration) and the range of attraction (related to the particle/polymer
size ratio). In the high volume fraction range of spherical colloids, many interest-
ing results have been published in which different dominating mechanisms determine
3

the phase of the suspension. In contrast to the glass phase driven by repulsions due
to crowding of particles, there can be an arrested phase because of the bonding ef-
fects.12,13 By tuning the strength of attractions one can obtain an ergodic fluid phase
even in these concentrated suspensions : competition arises between the bonding and
packing effects; i.e., suspensions that are initially in a repulsive glass state move to a
liquid state when a weak depletion attraction is introduced. Further increasing the
concentration of polymer increases the strength of attraction, and systems transition
to an attractive glass state, regaining their elasticity.14 This behavior is termed as
reentrant glass transition, and has also been observed in colloidal glasses of block
copolymer micelles,15 star polymers,16 and is predicted by mode coupling theory.17,18
In the case of spherical colloids with moderate to low colloid densities (φ < 0.5),
with a small range of attraction caused by depletion attraction, gelation of particles
is observed. This is initiated by spinodal decomposition, a thermodynamic instability
that triggers the formation of clusters that span the whole system.19 This does not
depend on microscopic system specific details and suggests that gelation is a purely
kinetic phenomenon.20
The situation becomes more complex when these short range attractions are com-
plimented by long range repulsions. A competition between the stabilizing role of
repulsion and aggregation has been observed. When the repulsion is short range (<
0.5σ, σ being the hardcore diameter of the particle), it was observed in experiments21
and simulations22,23 showed that elongated clusters of particles would form at low
enough temperature. But at large enough volume fraction (but less than 0.2), clus-
ters are found to merge into a percolating network. When the range of repulsion
is appreciably long (> σ) simulations24,25 show formation of Wigner fluids of clus-
ters form. Simulations also show that these fluids of clusters generate a low-density
disordered arrested phase, a glass transition driven by the repulsive interaction,24 in
contrast with the previous case. Contrary to general intuition that a purely attractive
4
system would either phase separate or form a gel, stable clusters of particles have been
observed even in the absence of long range electrostatic repulsion.26 The morphology
of the clusters formed is a function of the range of attraction. For large range of
attraction clusters are compact, and for a small range, clusters are open and show a
lower fractal dimension.26
An open question remains as to whether it is possible to achieve a true reentrant
glass transition in systems with adsorbing polymer. Previous studies in our group27
have shown that by adding adsorbing polymer to a suspension of laponite R©, a discotic
colloid, different phases can be observed, depending upon the length of the polymer
chains. Pure laponite R© suspensions form a repulsive glass at low ionic strengths and
at low volume fractions because of the repulsive interactions and the anisotropic of
particle shape.28 Addition of adsorbing polymer changes the dynamics of formation
of a repulsive glass, and results in a repulsive glass-liquid-gel progression of states as
polymer molecular weight is increased. In chapter 2, we explore this type of system
further, focusing on dispersions in which the polymer chains are too short to bridge
between the particles.
A different system is presented in chapter 3: laponite R© with addition of short non-
adsorbing polymer, sodium salt of poly(acrylic acid) (PAA). In this case we believe
that clusters of particles form because of depletion attractions. At low colloid volume
fraction, suspensions are a stable fluid whereas at higher volume fraction they undergo
a glass transition similar to what observed in spherical colloids.
Overview
My thesis is organized as follows. Chapter 1 discusses modelling of the segregation
of different sized charged particles in drying film coatings, followed by experimental
results to confirm the modelling part in which the interactions between the particles
are tuned by changing the pH using a buffer. Chapter 2 discusses the phase behav-
5

ior and aging behavior of suspensions of laponite R© as the samples age in which the
interactions are varied using an adsorbed polymer, poly(ethylene oxide). Chapter 3
explores the dynamics of laponite R© with a non-adsorbing polymer, sodium salt of
poly(acrylic acid). Chapter 4 shows the effect of temperature, pH and coagulant con-
centration in the formation of dense clusters in a shear environment in concentrated
spherical colloidal suspensions. Chapter 5 discusses the use of population balance
equation models to predict different regimes of aggregation in concentrated spheri-
cal colloids where interaction between the particles are varied by changing the salt
concentration, followed by the experimental verification.
6

CHAPTER 1
AUTO-STRATIFICATION IN DRYING COLLOIDALDISPERSIONS: EFFECT OF PARTICLE INTERACTIONS
1.1 Introduction
Latex films are typically encountered as paints and varnishes. They are applied
to substrates as colloidal dispersions and upon drying transform into a continuous
polymer film.29 To meet increasing demands such as corrosion resistance, there is
a need for multifunctional coatings which can protect the substrate and imparting
gloss. Another example, where a multifunctional coating is beneficial, is anti-bacterial
coatings in bathrooms and humid environments. The anti-bacterial property is only
required towards the top surface of the coating. To impart the required properties in
the coatings, a multistep deposition method can be used to give vertically structured
coatings. Alternatively, the same thing can be achieved in a single step,30 decreasing
production time and costs. To achieve this, a dispersion of particles with various
functionalities can be cast. When particles differing in size or charge are mixed
and cast, vertical segregation is an inevitable phenomenon in the produced films.
Nikiforow et al.30 studied self-stratification in films of latex dispersions, where one of
the components in the dispersion is charged and the other is neutral and observed
vertical segregation of particles across the film. Luo et al.31 dried latex coatings that
contained smaller silica nanoparticles and observed by cryo-SEM, an enrichment of
the nanoparticles at the surface. Non-uniform surfactant distributions across films
has also been observed32,33 and modeled.34,35 Harris et al.36,37 performed a slightly
different segregation. By placing a mask over a drying film they create a horizontal
7

flux towards the evaporative region. This flow can lead to lateral segregation in
bimodal dispersions.
The film formation process is typically thought of as a four-stage process with
three transformations between the stages.29,38,39 The first transformation occurs with
evaporation of solvent to bring the particles into close packing.40 Subsequently the
particles deform and then interdiffuse to give the final film.41,42 Here we concentrate
on the first step - drying - and aim to produce films that auto-stratify.
Routh and Zimmerman43 performed modeling work on the vertical drying of a
dispersion of single sized particles cast as a film and showed an accumulation of
particles near the film-air interface. The distribution during drying is determined by
the Peclet number, which is the rate of evaporation divided by the rate of diffusion
and is given as
Pe =6πηRHE
kBT(1.1)
Where η is the solvent viscosity, R is the particle radius, H is the initial film thick-
ness, E is the rate of evaporation, kB is Boltzmann constant and T is the temperature.
For Pe� 1 diffusion is not relevant and a stratification is observed. Trueman et al.44
expanded on this idea by considering a film with two different particle sizes, and
hence two Peclet numbers. When such a dispersion of particles is cast the individual
Peclet numbers determine the final concentration profiles in the dried film. If the
Peclet numbers of the particles lie on either side of unity, the dominant mechanism
will be different for the two particle types, so a self-segregating film can be made.
Big particles (which have higher Peclet numbers) tend to accumulate close to the top
surface.
The work of Trueman et al.44 assumed that the chemical potential of the particles
was entirely entropic. The lack of colloidal interactions means that the concentration
profiles are completely determined by particle diffusion. This is the scenario for only
8
hydrodynamic interactions between the particles. When the surfaces of the particles
are charged (inducing attractions or repulsions), there are additional mechanisms of
particle segregation. The present report concentrates on this occurrence, films formed
with dispersions of particles in which the particles interact and hence self-segregate.
1.2 Numerical Analysis
Modelling auto-stratification in drying latex films was carried out by Trueman et
al.44 In this model a film is composed of two types of particles and solvent. Evapo-
ration from the top surface reduces the film height and the particles distribute them-
selves according to simple diffusional laws. The problem of predicting the volume
fraction evolution is solved by writing the diffusional flux of each component as being
driven by the gradient in chemical potential. As dispersions become more concen-
trated the motion of particles become hindered and this is captured within a sedimen-
tation coefficient, K(φ1, φ2). The Gibbs-Duhem equation asserts that the chemical
potentials of the two particle species and the solvent (taken as water) are linked. This
results in a coupling between the three chemical potentials. The chemical potential
of the water is related to the osmotic pressure and this diverges as the particles come
into close packing. The functional form of this divergence is contained within the
compressibility Z(φ1, φ2). In principle both the compressibility, Z(φ1, φ2) and the
sedimentation coefficient, K(φ1, φ2), are measurable quantities. An implicit assump-
tion in the model is that the dispersion remains colloidally stable throughout the
concentration range.
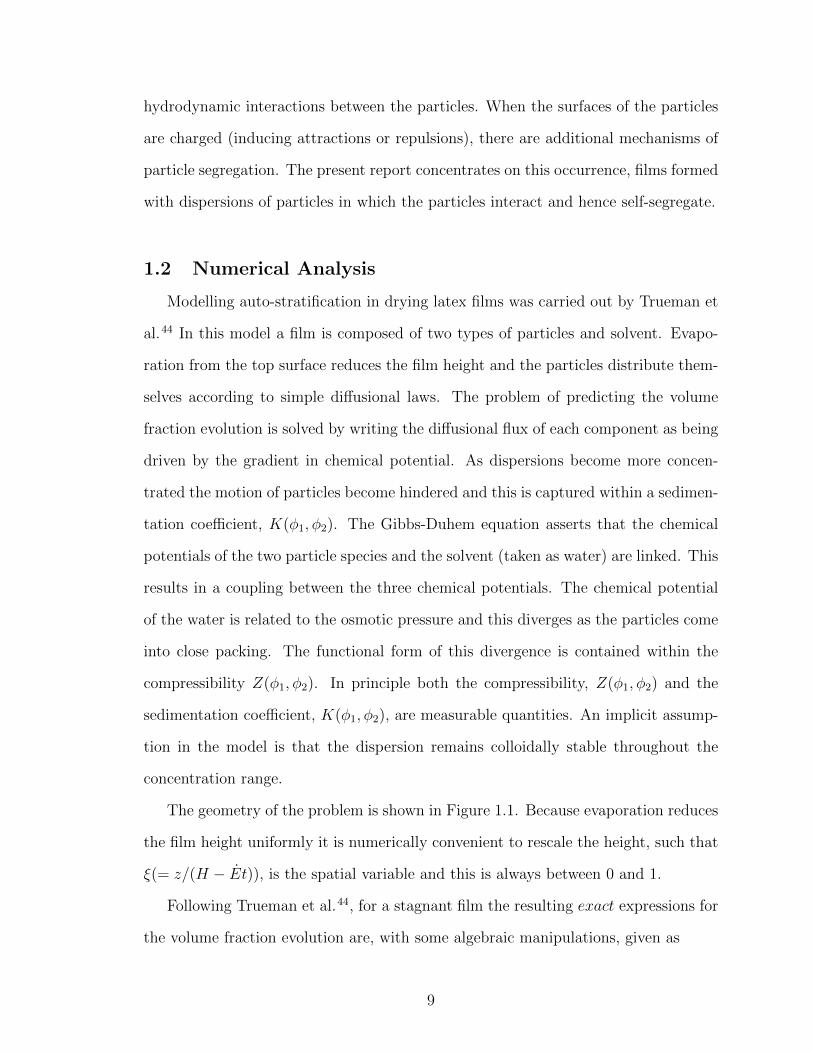
The geometry of the problem is shown in Figure 1.1. Because evaporation reduces
the film height uniformly it is numerically convenient to rescale the height, such that
ξ(= z/(H − Et)), is the spatial variable and this is always between 0 and 1.
Following Trueman et al.44, for a stagnant film the resulting exact expressions for
the volume fraction evolution are, with some algebraic manipulations, given as
9

Figure 1.1. Film subject to evaporation. The volume fractions of the two types ofparticles are given by φ1 and φ2. The film thickness is z and evaporation reduces thethickness at a constant rate . To produce static boundary the film thickness is scaledin dimensionless form to be between ξ = 0 and 1.
∂φ1
∂τ+
ξ
1− τ∂φ1
∂ξ=
1
Pe1(1− τ)2∂
∂ξ
K(φ1, φ2)φ1(1− φ1 − φ2)
∂µp1/∂ξ
∂µp2/∂ξ
(1− φ1)
(φ1
∂µp1/∂ξ
∂µp2/∂ξ+ φ2
(Pe1Pe2
)3)
∂
∂ξ
[(φ1 +
(Pe1Pe2
)3
φ2
)Z(φ1, φ2)
]] (1.2)
∂φ2
∂τ+
ξ
1− τ∂φ2
∂ξ=
1
Pe2(1− τ)2∂
∂ξ
K(φ1, φ2)φ2(1− φ1 − φ2)
∂µp2/∂ξ
∂µp1/∂ξ
(1− φ2)
(φ2
∂µp2/∂ξ
∂µp1/∂ξ+ φ1
(Pe2Pe1
)3)
∂
∂ξ
[(φ2 +
(Pe2Pe1
)3
φ1
)Z(φ1, φ2)
]] (1.3)
where φ represents the volume fraction, ξ the scaled film thickness, τ time,
Z(φ1, φ2) the compressibility factor, K(φ1, φ2) the sedimentation coefficient and µp
the particle chemical potential. Pe1 and Pe2 are the Peclet numbers of the two
particles and are defined as in equation (1.1)
10

Equations (1.2) and (1.3) are exact. To derive them we simply state that the
particulate flux is down a gradient on chemical potential. To provide solutions to the
equations one must assume functional forms for the various parameters. The effect
of the hydrodynamics is examined in Trueman et al.44 and the interesting finding is
that the sedimentation coefficient K(φ1, φ2) is relatively unimportant in determining
any segregation. Hence a physically reasonable, monotonically decreasing function,
which reverts to the accepted one component case is used
K(φ1, φ2) = (1− φ1 − φ2)6.55 (1.4)
The compressibility Z(φ1, φ2) is the thermodynamic function that drives the segre-
gation. We have good experimental data for one component systems and in principle
the compressibility can be measured for any given system. The important part of the
function is the form of the divergence and we take this to be of the same order as the
single component case.
Z(φ1, φ2) =
(1− φ1 + φ2
φm
)−1(1.5)
where φm is the volume fraction at close packing. In practice φm is a function of
the different particle radii and also the rate of evaporation. Here we take the simplest
form possible that fits the single component limit, which is φm=0.64.
The effect of the hydrodynamics was considered previously.44 In this work we
examine the effect of the interactions between particles. This is captured in the
particulate chemical potentials.
1.2.1 Effect of particulate interactions
We wish to examine the effect of interactions between the particles which enter in
the form of the chemical potentials of the particles. There are many expressions for
11

the chemical potentials of colloidal mixtures.45 Here we simplify greatly and take the
chemical potentials as
µp1 = kBT(lnφ1 ±Mφ2
1
)(1.6)
µp2 = kBT(lnφ2 ±Mφ2
2
)(1.7)
where M represents the magnitude of interaction. When using more complex
forms for the chemical potentials we found that the lnφ term was required to allow
solutions to be obtained and the other terms had minimal effect on solutions. The
interaction between particles was taken as a simple φ2 term with the magnitude of
interaction characterized by M . In reality it is necessary to deal with the range and
magnitude of interactions but to simplify we take the most basic form possible. When
the value of M is positive the particles repel particles of their own type and when M is
negative, an attraction is present. We consider four different scenarios: Where the big
particles repel other big ones and the small ones repel other small ones (i.e the value
of M is positive for both equations (1.6) and (1.7)). We call this scenario Big repel big
and small repel small (BRB+SRS); If the value of M in equation (1.6) is positive yet
negative in equation (1.7) then the big particles attract other big ones whilst small
particles repel other smalls (BAB+SRS); The opposite case is when the big particles
repel other big ones (M positive in equation (1.7)) and small particles attract other
small ones (M negative in equation (1.6)) (BRB+SAS). The final scenario is where M
is negative in both equations (1.6) and (1.7). In this case big particles attract other
big ones and small particles attract other small ones (BAB+SAS). The results are
compared with the system with no added interactions (M = 0), allowing a comment
to be made on the effect of added interactions on segregation. To simplify the results
analysis, in all the simulations shown here the initial volume fractions of the two
components are the equal and each set at 0.08.
We note that we have missed out the cross terms, where big particles can attract
small ones etc. This is merely to allow a reasonable number of scenarios to be inves-
12

Figure 1.2. Volume fraction profiles for big and small particles with different mag-nitudes of interactions. In this example big particles repel other big ones and smallparticles repel other small ones (BRB+SRS).
tigated and the other cases will be examined in future work. It is also important to
mention that cases with attraction are included in this work. Whilst any industrially
useful system must be colloidally stable, the situations we investigate comprise at-
tractions of typically 2 kBT . Such a dispersion will form transient dimers and these
will then break apart on a timescale determined by the Brownian energetics of the
particles. We estimate that the largest particles with an attraction of 2 kBT will
result in flocs that persist for less than one second and therefore our assumption of a
stable dispersion remains valid.9
Figure 1.2 represents the spatial evolution of volume fractions of the particles for
the case of BRB+SRS; different colours show the magnitude of added interactions.
The profiles are shown after the films are completely dried. M=0 represents no
interactions between the particles, so particles arrange themselves in a way dominated
by their Peclet numbers. From figure 1.2 it is clear that, in this scenario, the effect
of interactions is very small.
13
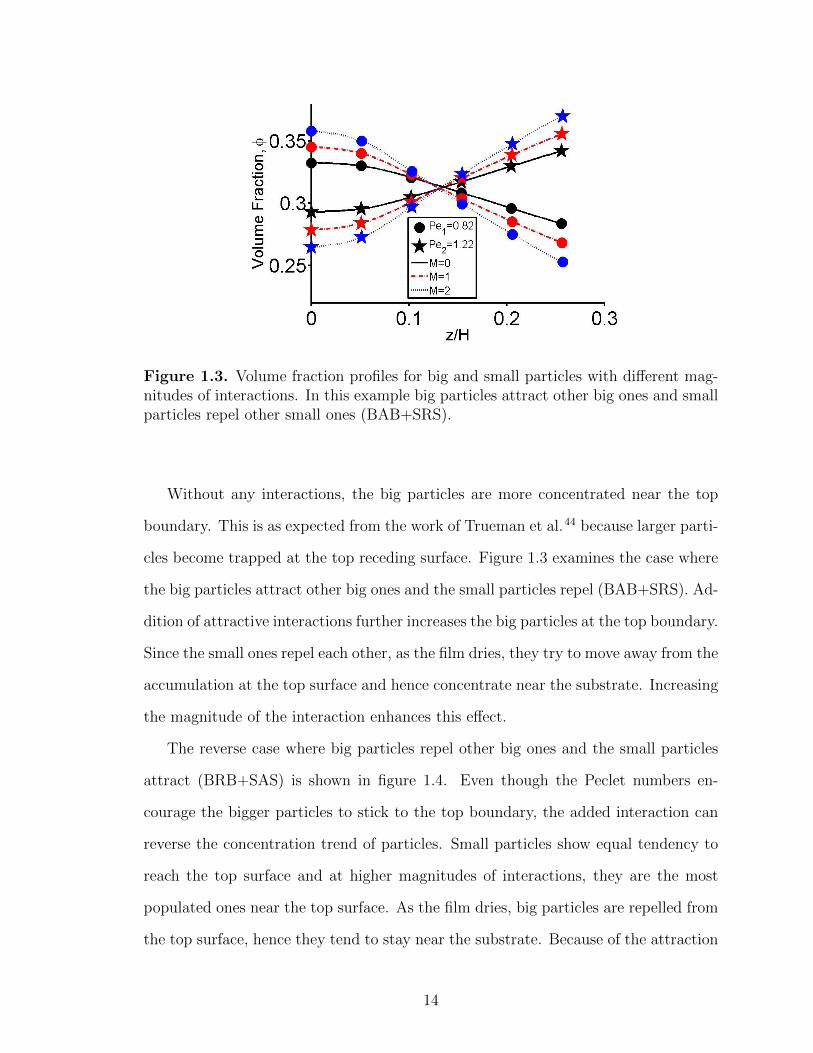
Figure 1.3. Volume fraction profiles for big and small particles with different mag-nitudes of interactions. In this example big particles attract other big ones and smallparticles repel other small ones (BAB+SRS).
Without any interactions, the big particles are more concentrated near the top
boundary. This is as expected from the work of Trueman et al.44 because larger parti-
cles become trapped at the top receding surface. Figure 1.3 examines the case where
the big particles attract other big ones and the small particles repel (BAB+SRS). Ad-
dition of attractive interactions further increases the big particles at the top boundary.
Since the small ones repel each other, as the film dries, they try to move away from the
accumulation at the top surface and hence concentrate near the substrate. Increasing
the magnitude of the interaction enhances this effect.
The reverse case where big particles repel other big ones and the small particles
attract (BRB+SAS) is shown in figure 1.4. Even though the Peclet numbers en-
courage the bigger particles to stick to the top boundary, the added interaction can
reverse the concentration trend of particles. Small particles show equal tendency to
reach the top surface and at higher magnitudes of interactions, they are the most
populated ones near the top surface. As the film dries, big particles are repelled from
the top surface, hence they tend to stay near the substrate. Because of the attraction
14

Figure 1.4. Volume fraction profiles for big and small particles with different mag-nitudes of interactions. In this example big particles repel other big ones and smallparticles attract other small ones (BRB+SAS).
between the smaller ones they tend to accumulate Figure 1.4 shows the effect of the
magnitude of interactions between the particles on final volume fraction profiles.
For interactions with M higher than 4, small particles are more concentrated
near the top boundary than the big ones, which is exactly opposite to the case when
there are no interactions between the particles. Figure 1.5 shows the time evolution of
volume fraction profiles in such a case. In the initial stages of drying big particles reach
the top surface, but as the concentration near the top boundary starts to increase,
they tend to repel the further movement of big particles to the top boundary and
small particles tend to accumulate at the top boundary.
In the case where both the big and small particles are attractive (BAB+SAS),
both the particles compete to stick to the top boundary, because of which the effect
of the added interactions is not profound. Figure 1.6 shows the profiles for different
magnitudes of interactions.
Figure 1.7 represents the fraction of big in the total particular surface at the top
boundary for a dispersion of particles with various interactions, as a function of mag-
15

Figure 1.5. Time evolution of volume fraction of particles for the case of big par-ticles repelling other big ones and small particles attracting other small ones with amagnitude, M=4
Figure 1.6. Volume fraction profiles for big and small particles with different mag-nitudes of interactions. In this example big particles attract other big ones and smallparticles attract other small ones (BAB+SAS).
16

Figure 1.7. Combined effect of added interactions on the concentration of big parti-cles at the top surface of the dried film. The initial volume fraction of the two particletypes is equal.
nitude. Here the axis is based on the interactions between the big particles, so for
attractive systems M is negative and for repulsive ones M is positive. In the case
of BRB+SRS the effect of interactions is negligible. In the case of BAB+SRS, big
particles concentrate more near the top boundary because of the attractions, and
small particles stay away from the surface. In the case of BRB+SAS, because of
the repulsions, big particles try to stay away from the surface and as small attracts
small, they tend to concentrate near the top boundary. As the magnitude of interac-
tions increase, the small particles concentrate at the top surface, as the interactions
dominate over the diffusional segregation. In the case of BAB+SAS, both particles
compete to reach the top surface. The big particles dominate at the top surface but
the increase is not that dramatic.
1.2.2 Effect of particle charge
An interesting case to examine is when the particles have the same size but one
type is charged and hence repels other charged ones. This was examined experi-
17

mentally by Nikiforow et al.30 and we compare our theoretical predictions to their
experimental findings. We distinguish between the charged and neutral particles
through the chemical potentials, which are given by
µp1 = kBT(lnφ1 +Mφ2
1
)(1.8)
µp2 = kBT (lnφ2) (1.9)
where M represents the magnitude of interactions. The equations are solved with
a forward in time and centered in space algorithm using MATLAB with the Peclet
numbers of 0.5, 1, 2, 4 with an initial volume fraction of 0.1 for both the particles.
When M = 0, the two particle types are identical and there is no segregation in
the film. Figure 1.8 represents the evolution of concentration profiles over the film
thickness for a Peclet number of 0.5 and a magnitude of interaction M of 4. In
this case diffusion has a strong influence on the drying process. In the initial stages
of drying, both the particles tend to reach the top surface, and there is no sign of
stratification, since diffusion is dominant. As the particles concentrate near the top
boundary, these added interactions induce the charged particles to move away from
the interface. So, a self-segregated film can be seen after the film completely dries,
with neutral particles concentrated near the top boundary. Figure 1.9 represents the
volume fraction profiles over the film thickness for a Peclet number of 0.5 for different
magnitudes of interaction after complete drying. As expected for higher magnitudes
of repulsion the degree of segregation increases.
Figure 1.10 represents the evolution of volume fraction profiles for a Peclet num-
ber of 4, in which diffusion becomes negligible. After the drying time of 0.1, the
particles reach close packing and the segregation begins. Figure 1.11 shows the effect
of different magnitude of interactions on segregation for this case of Pe=4.
An alternative way to view the same data is to see the volume fraction profiles for
different Peclet numbers at a fixed magnitude of interaction. This has been plotted
18

Figure 1.8. Evolution of volume fraction profiles for a Peclet number of 0.5 and amagnitude of interaction between charged particles of 4 kBT .
Figure 1.9. Volume fraction profiles for a Peclet number of 0.5 and various magni-tudes of interaction between the charged particles.
19
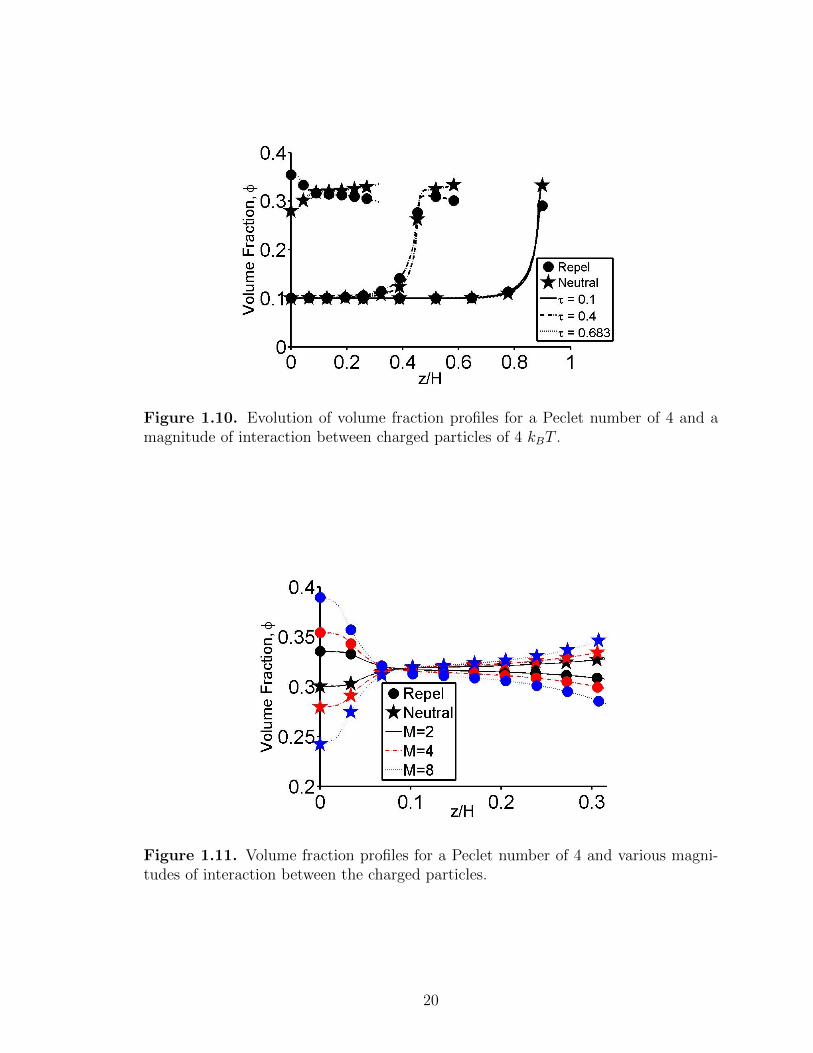
Figure 1.10. Evolution of volume fraction profiles for a Peclet number of 4 and amagnitude of interaction between charged particles of 4 kBT .
Figure 1.11. Volume fraction profiles for a Peclet number of 4 and various magni-tudes of interaction between the charged particles.
20

Figure 1.12. Volume fraction profiles for M=4 at different Peclet numbers.
in figure 1.12 for M = 4 and three different Peclet numbers. Whilst there is minimal
effect at the top surface the accumulation of charged particles near the substrate for
larger Peclet numbers is evident.
For a Peclet number of unity, both evaporation and diffusion are equally dominant,
as the Peclet number is increased, the magnitude of diffusion is reduced. Particles
reach close packing near the surface more quickly because particles do not have ample
time to diffuse away from the surface. This then initiates the repulsion between the
charged particles and the packed top layer initiating the segregation.
Nikiforow et al.30 observed an auto-stratification behaviour experimentally using
confocal microscopy. Their results demonstrated an accumulation of neutral particles
at the air-film interface, whilst our predictions are for a more noticeable accumulation
of charged particles towards the substrate. The model proposed by Nikiforow et al.30
is similar to ours in that the diffusion of the particles is driven by gradients in chemical
potential and equations (1.6) and (1.7) above are merely explicit derivations of the
collective diffusion coefficient tensor.
21

1.2.3 Case with one particle type preferentially attracted to the top sur-
face
A common observation in multi-component films is for the top surface to be unrep-
resentative of the film immediately below. Trueman et al.46 presented some cryo-SEM
images of films comprising two particle types. A further image is shown in figure 1.13
and it can be readily seen that an accumulation of small particles occurs at the surface
with a different composition in the bulk. One possible explanation for this observa-
tion is that one particle type is preferentially attracted to the air interface. To model
this scenario, simulations were run for the case with a surface attraction. In this case
the chemical potential for the big particles is given by µp2 = kBT (lnφ2 + H(ξ − 1)),
where H(ξ − 1) is a unit step function applicable at ξ = 1. For the small particles,
the chemical potential is as previously given by µp1 = kBT lnφ1. The equations are
solved with a forward in time and centered in space algorithm using MATLAB with
the Peclet numbers of 0.82 and 1.22 for small and big particles respectively (with ini-
tial volume fractions set at 0.1 for both the particles). Figure 1.14 represents a plot
of volume fraction of the particles over the entire film thickness after a drying time
of =0.55. The dramatic effect at the top surface is evident with the large particles
actually reaching complete coverage. It is also evident from figure 1.14 that there is
not much of a difference in the concentration profiles over the film thickness, other
than right at the surface
1.3 Experimental
1.3.1 Materials
Polystyrene latex particles were kindly donated from Kodak. Their diameters
(measured through Dynamic Light Scattering) were 240 nm and 161 nm. The zeta
potential of the particles was measured using a Broohaven Zeta PALS at various pHs
using buffer solutions from Sigma-Aldrich. Figure 1.15 show a plot of zeta potential
22

Figure 1.13. Cryo SEM image of dried film containing two particle types. Noticethe large accumulation of small particles at the film/air interface which is not presenteven one particle layer below the surface.
Figure 1.14. Volume fraction profiles for big and small particles over the film thick-ness after drying time of τ = 0.55. The large particles have an attraction for the topsurface and hence an increase in the large particle volume fraction at the top.
23
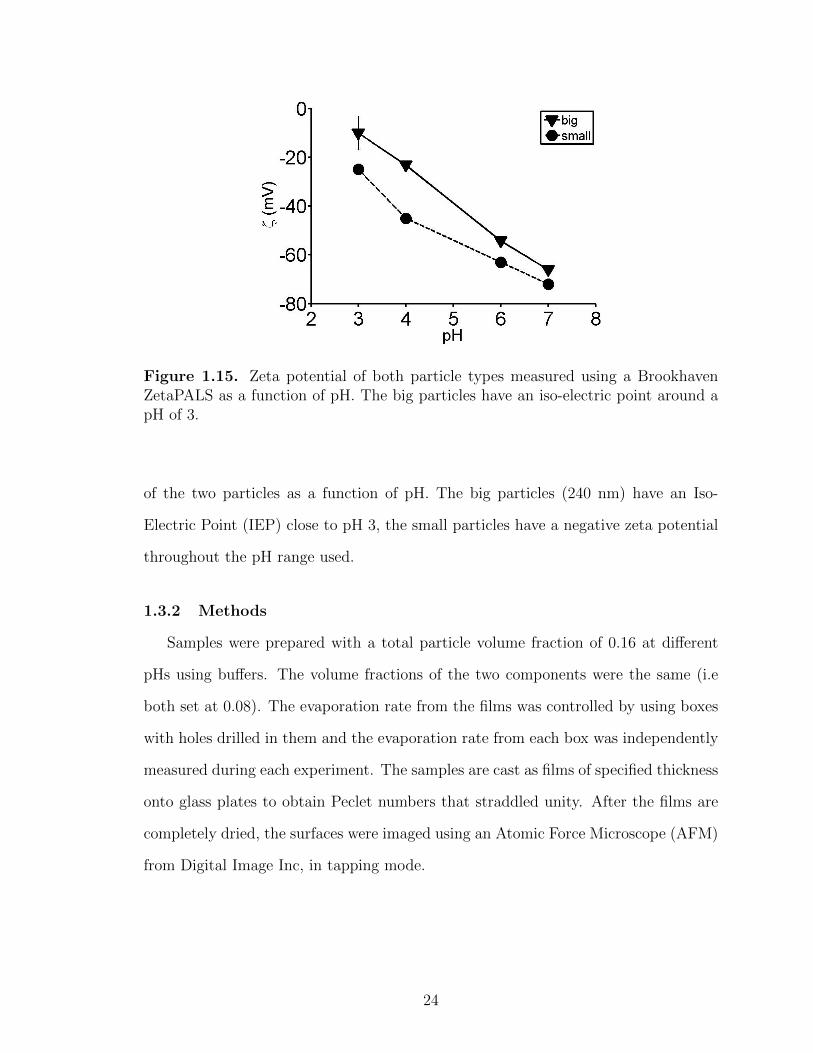
Figure 1.15. Zeta potential of both particle types measured using a BrookhavenZetaPALS as a function of pH. The big particles have an iso-electric point around apH of 3.
of the two particles as a function of pH. The big particles (240 nm) have an Iso-
Electric Point (IEP) close to pH 3, the small particles have a negative zeta potential
throughout the pH range used.
1.3.2 Methods
Samples were prepared with a total particle volume fraction of 0.16 at different
pHs using buffers. The volume fractions of the two components were the same (i.e
both set at 0.08). The evaporation rate from the films was controlled by using boxes
with holes drilled in them and the evaporation rate from each box was independently
measured during each experiment. The samples are cast as films of specified thickness
onto glass plates to obtain Peclet numbers that straddled unity. After the films are
completely dried, the surfaces were imaged using an Atomic Force Microscope (AFM)
from Digital Image Inc, in tapping mode.
24

Figure 1.16. AFM image of a dried film prepared with a dispersion at pH=5 (Imagesize 2 µm × 2µm).
1.4 Results and Discussion
Figure 1.16 shows the surface image of a 2 µm × 2 µm sample. To understand the
results in a quantitative way, the image was analyzed using the watershed method in
the image analysis software from Gwyddion (http : //gwyddion.net/). This gives a
count of the number of each type of particle, from which the fraction of the particles
of interest can be calculated. Figure 1.17 shows the fraction of big particles as a
function of pH, each point in the graph is an average over four measurements at
different positions on the films surface. As the pH is increased there is a decrease in
the fraction of big particles on the top surface.
The modeling section demonstrates that the interactions between particles will
have an effect on the profile within a dry film. This is an entirely expected result and
shows how profiles in films can potentially be manipulated through the use of different
particle types. The numerics allow the particle interactions to be made attractive or
repulsive. A system with significant attractive interactions will lead to aggregation
and the implicit assumption of colloidal stability is no longer valid. In the cases
25
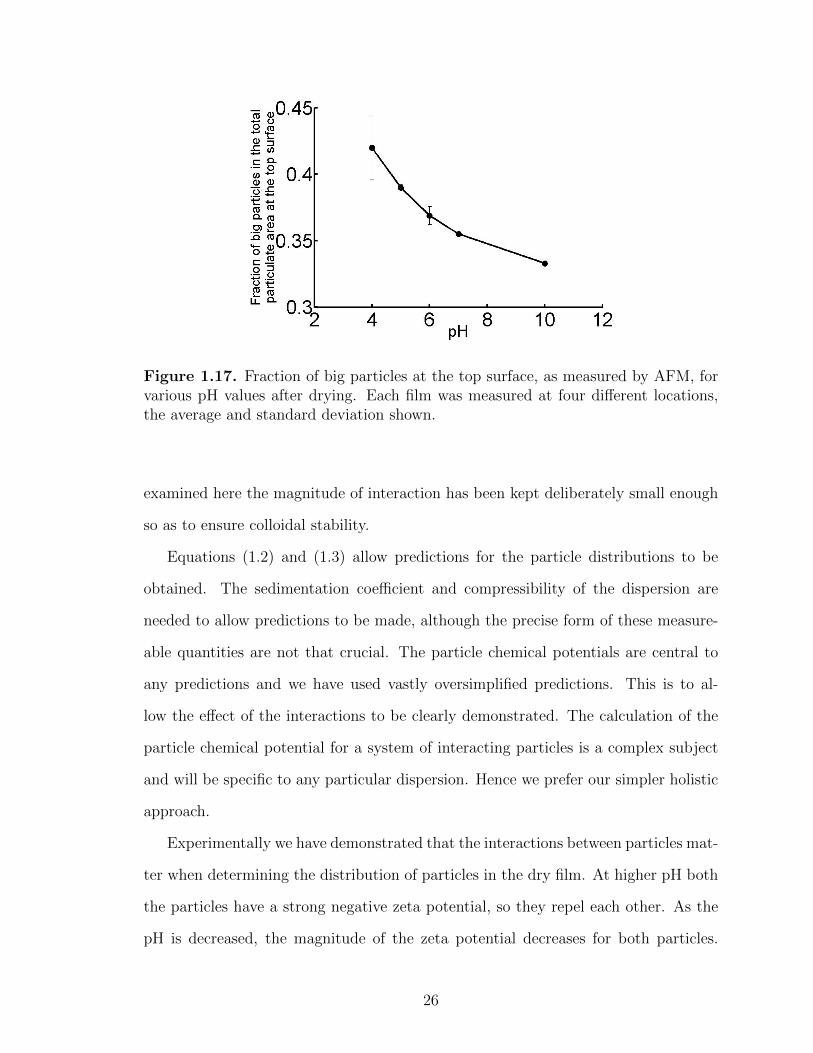
Figure 1.17. Fraction of big particles at the top surface, as measured by AFM, forvarious pH values after drying. Each film was measured at four different locations,the average and standard deviation shown.
examined here the magnitude of interaction has been kept deliberately small enough
so as to ensure colloidal stability.
Equations (1.2) and (1.3) allow predictions for the particle distributions to be
obtained. The sedimentation coefficient and compressibility of the dispersion are
needed to allow predictions to be made, although the precise form of these measure-
able quantities are not that crucial. The particle chemical potentials are central to
any predictions and we have used vastly oversimplified predictions. This is to al-
low the effect of the interactions to be clearly demonstrated. The calculation of the
particle chemical potential for a system of interacting particles is a complex subject
and will be specific to any particular dispersion. Hence we prefer our simpler holistic
approach.
Experimentally we have demonstrated that the interactions between particles mat-
ter when determining the distribution of particles in the dry film. At higher pH both
the particles have a strong negative zeta potential, so they repel each other. As the
pH is decreased, the magnitude of the zeta potential decreases for both particles.
26

This is however a bigger effect for the large particles. Hence by changing the pH of
the solution, the interactions between the particles can be varied. In the initial stages
of drying, particles move to the top boundary, based on the balance between the
evaporation and diffusion rates. As they become concentrated near the top bound-
ary, these added interactions induce particle flow either away from or towards the
interface. At higher pH, since both the particles repel, particles of each type do not
concentrate near the top boundary and particles of both type compete to stay away
from the surface. In this case the balance between evaporation and diffusion decides
the volume fraction profiles over the thickness of the film. As the pH is lowered, the
magnitude of the electrostatic repulsion decreases, so there is less repulsion between
large particles. The result is that more and more big particles are concentrated near
the top surface.
One consequence of the cryo-SEM result is that surface imaging techniques such
as AFM, whilst simple and easy to apply, may not be that accurate in measuring
segregation in multi-component films. It is certainly the case that any quantitative
volume fraction information from the top surface of a film will be incredibly sensitive
to any film-air interaction and hence AFM data should be used qualitatively at best.
In addition the effect of pH is to alter the repulsion between both the sets of particles.
It is possible to run simulations with different interactions between the different sets
of particles. These will agree qualitatively with the results in figure 1.17 although
the results are of course sensitive to the values of M used. Rather than curve fitting
we prefer to make the general statement that as the repulsion between large particles
is increased there is less accumulation of large particles at the top surface. This is
found experimentally and is entirely consistent with all our modeling work.
27
1.5 Conclusion
We have reported the effect of particle interactions during drying in latex films.
The systems studied are: (i) charged particles with different Peclet numbers (ii)
charged particles with same Peclet numbers. In the first system, various cases have
been considered based on the interactions between the particles (repulsion/attraction).
For M=0, Peclet numbers solely determine the particle distribution in the dried films.
In the case of BRB+SRS, the effect of interparticle interactions is very small. In the
case of BAB+SRS, large particles are more concentrated near the film/air interface
by increasing the magnitude of interactions. In the case of BRB+SAS, increasing the
magnitude reverses the trends in the particle distribution across the film i.e., small
particles are more concentrated near the top boundary, so the interactions weaken
the dominance of Peclet numbers in this case. In the case of BAB+SAS, large par-
ticles are more concentrated near the top surface by increasing the magnitude of
interactions, but the effect is not huge as both the particles compete to reach the top
surface.
To confirm the theoretical observations, experiments have been carried out with
particles with different charged surfaces. The particles have different zeta potentials,
so by changing the pH of the dispersion the interactions between the particles can
be varied. The top surface of the dried film has been characterized using AFM in
tapping mode. Lowering the pH, decreases the electrostatic repulsion, so the fraction
of large particles increases. The same trend has been observed theoretically.
The other system studied is particles of the same size, but one of the particles
is charged and the other is neutral. The effect of Peclet number and magnitude of
interactions have been studied. Because of the repulsion the charged particles always
try to move away from the top boundary. For a given Peclet number, increasing the
magnitude of interaction increases the degree of segregation in the system. Increasing
the Peclet number decreases segregation as the time given for the particles to feel the
28

interactions was lowered because of the increase in the evaporation rate. Nikiforow
et al.30 worked on the similar system experimentally. The results from our model
predict similar concentration profiles.
1.6 Acknowledgements
This work has been done during an internship in the University of Cambridge,
UK on a collaborative project with Professor Alexander F. Routh. This chapter
has been published in Langmuir, with co-author Surita R. Bhatia and corresponding
author Alexander F. Routh.47 We are very grateful to Professor Joe Keddie at the
University of Surrey and Simon Emmett, Martin Murray and Elsa Lago Domingues
at Akzo Nobel for helpful discussions.
29

CHAPTER 2
A RE-ENTRANT GLASS TRANSITION IN COLLOIDALDISKS WITH ADSORBING POLYMER
2.1 Introduction
Colloid-polymer suspensions are ubiquitous in diverse application areas, and the
control of suspension flow properties is critical to the design of number of industrial
products, including ceramics, foods, paintings, consumer products and so on. A ma-
terial commonly used to modify the rheology for various applications is the synthetic
clay laponite R©, which is a disc shaped particle with a 30 nm diameter and 1 nm
thickness. The laponite R© crystal comprises ∼ 1500 unit cells48 with the empirical
formula Na+0.7[(Si8Mg5.5Li0.3)O22(OH)4]−0.7.
Many studies suggest that laponite R© discs have a negative charge on the face
and a slight positive charge along the rim for pH < 9, while at pH > 9, the disc
has a negative charge on both faces and edges.49 These conditions correspond to
interparticle repulsive electrostatic interactions.50 In aqueous dispersions at pH > 9,
laponite R© forms a disordered soft solid. There has been a much debate on whether the
structural arrest arises due to the repulsions from overlapping of double layers or from
aggregation due to attractive interactions between the edges and faces. Evidence from
scattering (SAXS, SANS and light) confirms that this phase is a repulsive colloidal
glass.51,52 A recent analysis suggests that while roughly 10% of the edge groups may
be positively charged,53 the solid phase present with no added salt and concentrations
of laponite R© > 1.8 wt% is a repulsive glass.53
By changing the nature of the particle interactions, for example by the addition of
polymer or salt, one can tailor the dynamics and the mechanism of structural arrest.
30

Several groups have worked on the aging dynamics54,55 and mechanism of structural
arrest in laponite R© suspensions with added salt.56,57,58,59 For example, Joshi and
coworkers have studied aging in laponite R© suspensions in shear flow60 and creep61
and have observed a universal scaling in aging behavior. They also demonstrate that
at high salt concentration, the recovery behavior showed a large viscous deformation
implying a state of less homogeneity, which suggests that particles experience a weak
interparticle attraction with the addition of salt. Addition of polymer led to different
effects on the particle interactions, and different types of laponite R© glasses and gels.
Lal and Auvray62 first reported that PEO adsorbs on to laponite R© surfaces and
characterized the suspensions using SANS. They calculated the adsorbed amount
and the layer thickness, but assume that the scattering arises from an adsorbed layer
on the face of the particle. Later, Nelson and Cosgrove63 used a core-shell model
for SANS spectra that accounted for PEO chains extending out past the edge of the
particle. They found that the adsorbed amount showed a weak power law increase
with molecular weight.
Addition of moderate to high molecular weight PEO chains to laponite R© disper-
sions results in gels that are based on a polymer-particle network, whereby the PEO
chains form bridges between laponite R© particles. Schmidt and coworkers first re-
ported this and have carried out extensive studies on the microstructure64 and the
effect of shear65 on systems with PEO chains of 1000 kg/mol and longer. Walker and
coworkers66,67 found evidence of ”shake gels” in samples containing 300 kg/mol PEO
chains, where gelation and formation of a laponite R© -PEO network could be induced
by shaking the samples. Our group1 has previously studied long term aging effects on
laponite R©-PEO suspensions with PEO molecular weights of 163 kg/mol and higher.
We have found that the dynamics of aging in such systems depends on the ratio of
free polymer chains to laponite R© surface area. In a related study, Zulian et al.68
followed the aging of the repulsive laponite R© glass with addition of high molecular
31
weight PEO (200 kg/mol). They observed a slowing of the aging dynamics upon ad-
dition of polymer, but have used a low concentration of polymer in their suspensions
(<0.5%).
There are only a few studies on laponite R©-PEO systems where the PEO chains are
too short to bridge particles. We have previously studied dispersions with PEO chains
ranging from 13 kg/mol-360 kg/mol27 for periods up to 90 days after preparation.
We find the interesting phenomenon that addition of low molecular PEO chains melts
the laponite R© glass, causing a dramatic decrease in elasticity and viscosity.69 When
the ratio between the interparticle spacing and end-to-end distance of the polymer is
close to 1, the system again behaves as a soft elastic solid, presumably through the
mechanism of polymer chains forming interparticle bridges. We interpret the melting
of the repulsive glass in terms of theories developed for the re-entrant glass transition
in colloidal dispersions, whereby free chains of PEO cause a weak depletion attraction
between laponite R© particles.27 This weak depletion attraction causes clustering of
particles, which decreases the effective volume fraction of particles, allowing for flow.
A similar type of transition from a glass to a liquid was first experimentally ob-
served in hard-sphere colloids with non-adsorbing polymers.12,13,14 Systems that are
initially in a repulsive glass state transition to a liquid state when a weak depletion
attraction, induced by addition of non-adsorbing polymer, are introduced. Further
increasing the concentration of polymer increases the strength of attraction, and sys-
tems transition to an attractive glass state, regaining their elasticity. This behavior
has also been observed in colloidal glasses of block copolymer micelles,15 star poly-
mers,16 and predicted by mode coupling theory.17,18 There are important differences
between the re-entrant behavior described in these studies and what we observed in
our work on laponite R©-PEO dispersions of varying molecular weight. In the case of
hard-sphere colloids with non-adsorbing polymer, as attractions are increased, sys-
tems can progress from repulsive glasses, to liquids, to attractive glasses. This is
32

experimentally realized by increasing the concentration of polymer. In our earlier
work,27 we held the polymer concentration constant by increased molecular weight.
The second soft solid phase that we observe is driven by polymer chains bridging be-
tween particles, and thus we may characterize the progression of phases as repulsive
glass-liquid-gel as attractions are increased.
An open question that remains is whether it is possible to achieve a true re-entrant
glass transition in systems with adsorbing polymer; that is, can we achieve systems
that go from repulsive glass, to liquid, to attractive glass by increasing the concentra-
tion of polymer in a system where the polymer adsorbs onto the particle surface. To
our knowledge, this has not been explored in either spherical or disk-like colloids. In
addition, as dynamics in these glassy states are slow, we are interested in experimen-
tally exploring how the repulsive glass-liquid-attractive glass state boundaries may
change as samples age. In this study, we examine the dynamics and rheology for a
suspension of discotic laponite R© clay at 2 wt%, with addition of various concentra-
tions of low molecular weight PEO (20 kg/mol). Based on the interparticle distance
of laponite R© at a particle concentration of 2 wt%, we expect that this polymer will
be too short to form bridges between particles,27 so any attractions induced by the
chains will be due to free chains in solution. We follow the rheology and dynamics of
these systems for 90 days and explore how the state diagram changes as samples age.
2.2 Materials and Methods
Laponite R© RD was obtained from Southern Clay Products (Gonzales, TX, USA).
PEO with monomethyl end groups, an average Mn = 20 kg/mol, and Mw/Mn ∼ 1.2
was purchased from Sigma-Aldrich. Laponite R© solutions were prepared by adding
the clay to Millipore water adjusted to a pH of 10 by the addition of NaOH. A T25
Basic UltraTurrax homogenizer was used for about 1 min to fully disperse the clay
and break up any large aggregates. After 20 min, the dispersions were filtered using a
33

0.45 µm filter. Polymer is added directly to the suspension of laponite R© and water to
obtain the desired concentrations. Samples were then stirred for 5-10 minutes until
the polymer was dissolved, as determined by visual observation. We consider aging
time t = 0 to be the time after the polymer is completely dissolved and stirring has
been stopped. The samples were all capped and stored at 25◦C. Samples remained
capped and were not exposed to the environment.
Rheological tests were performed at different days of aging. Oscillatory rheological
experiments were conducted using a AR-2000 stress controlled rheometer from TA
instruments. Dynamic stress sweeps were performed at 1 Hz to determine the linear
viscoelastic region (LVE) and then the frequency sweep was done within the bounds
of LVE.
Dynamic light scattering was performed at different days of aging to get the nor-
malized autocorrelation function g2(τ). A 200-mW Innova Ar-ion laser of wavelength
of 488 nm with a Brookhaven Instruments BI-9000AT correlator was used. Each
sample was at an incident angle of 90◦ and sampled for 30 s with delay times of 0.1
to 106µs. The normalized autocorrelation function is calculated using the channel
contents. The ensemble average of g2(τ) at each delay time is calculated by averaging
the values obtained from several different positions in the sample.70 All samples were
given a slight rotation after each run to obtain data at 20-50 different positions for
each sample. The average of the ensemble is reported. For such measurements on
non-ergodic systems, the number of positions that need to be sampled to get an ac-
curate value of g2(τ) is system-dependent, with some systems requiring as few as 10
positions sampled71 and others requiring several hundred. Experimentally, we found
20-50 sample positions sufficient to yield an ensemble average that did not appreciably
change with additional measurements.
34

2.3 Results and Discussion
In our discussion of the rheology, we have chosen to focus primarily on the elastic
modulus, G′. Accurate classification of samples rheologically requires analysis of both
G′ and loss modulus, G′′, or equivalently tan δ = G′′/G′. In addition, the frequency
dependence of G′′ can sometimes provide additional insight into the state or dynamics
of samples. A minima was observed in G′′ for some samples, supporting our assertion
below that these samples are glasses. However, this effect was fairly weak. Thus, for
brevity we focus on below G′ and provide G′′ and tan δ in the Supporting Information
at the end of this chapter.
Figure 2.1 shows G′ as a function of frequency at different times after sample
preparation. Polymer concentrations in the range of 0.25 wt% to 2 wt% by weight
were used. The legend in each figure represents the concentration of polymer in the
sample for a fixed laponite R© concentration of 2 wt%. After an aging time of 21 days
(figure 1a), samples with polymer concentrations of 0-0.75 wt% behave rheologically
as gels, with G′ fairly independent of frequency. Here we use the term ”gel” in the
rheological sense, and not implying anything about the structure of the system. The
magnitude of G′ decreases until a polymer concentration of 1.00 wt%, at which point
the suspension behaves as a viscoelastic liquid. At polymer concentrations greater
than 1.25 wt%, the system reverts back to a soft solid, behaving rheologically as a
gel again. Samples prepared at 2.5 wt% polymer initially behaved as gels (data not
shown) but showed macrophase separation by an aging time of 30 days.
As the samples age (figures 2.1b and 2.1c), the magnitude of elastic modulus
increases for all samples. At an aging time of 60 days, the sample at 1.00 wt% has
formed a gel, and only the sample at 1.25 wt% polymer remains a viscoelastic liquid.
Interestingly, at an aging time of 90 days, all samples behave as gels, although the
elastic modulus of the sample at 1.25 wt% polymer remains significantly lower than
the other samples. To show this trend more clearly, we plot G′ at 1 Hz for various
35

(a)
(b)
(c)
Figure 2.1. Elastic modulus versus frequency for samples at 2 wt% laponite R© andvarious concentrations of polymer at (a) 21 days (b) 60 days and (c) 90 days aftersample preparation. (Data for polymer concentrations below the critical concentra-tion of 1.25 wt% are shown in black, at 1.25 wt% in red, and above 1.25 wt% inblue).
36

Figure 2.2. Elastic modulus at 1 Hz for various concentrations of polymer afterdifferent days of aging. Lines are guides for the eye.
concentrations of polymer after different days of aging (figure 2.2). From these data,
it appears as though samples at shorter aging times do indeed display a re-entrant
transition that can be controlled by polymer concentration, similar to what is seen
in hard-sphere colloids with non-adsorbing polymer. However, at very long aging
times, all samples behave rheologically as elastic gels. Again, here we use the term
gel in a rheological sense. As discussed further below, these samples are not gels in
a structural sense in that there is no particle-particle or particle-polymer network
giving rise to elasticity; rather, structurally the samples are glasses and the elasticity
arises from crowding of particles.
Pham et al.72 have observed similar rheology in glasses of polydisperse hard-
sphere colloids with non-absorbing polymer, wherein addition of polymer results in
a decrease of G′ but not in complete melting of the glass. They refer to this as a
sort of re-entrance and attribute the fact that their glasses do not completely melt
to polydispersity in the particle size. It is possible that a similar effect may be
responsible in our system; polydispersity in PEO chain length may translate into an
effective polydispersity in the size of laponite R© particles decorated with adsorbing
37

chains. However, the polydispersity of the PEO chains used here is comparable to
that used in our previous studies27 of laponite R©-PEO dispersions, and as described
further below, we have previously found some systems with a liquid phase that persists
even after long aging times.
Dynamic light scattering (DLS) measurements were performed on the samples af-
ter various days of aging to gain further insight into dynamics and structure. Average
scattered intensities were similar for all samples; however, dramatic differences were
observed in the dynamics. Figure 2.3 shows the normalized autocorrelation function,
11 days after sample preparation. For clarity, every 10th data point is plotted, and
only selected polymer concentrations are shown. For the pure laponite R© suspension,
the autocorrelation function does not decay to zero and flattens out at to a value of
approximately 0.5 at long delay times. This is to be expected, as we are in the regime
where we expect laponite R© to form a repulsive glass. The system shows non-ergodic
behavior, with g2(τ) varying at different positions in the sample (data not shown).
Addition of polymer speeds dynamics in the system. The time scale for decay de-
pends on polymer concentration. However, for all samples containing polymer, the
autocorrelation function decays to zero and the system behaves ergodically, with no
variation in g2(τ) with sample position (data not shown).
As the samples age, the DLS results mirror the rheology, to a certain extent.
Samples at polymer concentrations above 1.25 wt% transition to a non-ergodic state
after 30 days of aging (figure 2.4a) and begin to show evidence of multiple relaxation
processes. The first relaxation process at short time scales characterizes fast dynamics
and, for glassy systems, is usually interpreted as the thermal rattling of a single
particle in a cage of neighbours.73 Intermediate and slow processes, characteristic
of glassy dynamics, also begin to appear. We also observe some crossovers in the
autocorrelation functions at aging times of 30-50 days; in other words, points where
systems with otherwise very slow dynamics (e.g., samples with 0 - 1.0 wt% polymer)
38

Figure 2.3. Normalized autocorrelation function for different polymer concentrationafter 11 days of aging. For clarity, only every 10th data point is shown, and onlyselected polymer concentrations are shown. Lines are guides for the eye. (Data withthe same designations as figure 2.1).
appear to have smaller fast relaxation times than the more liquid-like samples (e.g.,
at 1.25 wt%). While we want to be careful not to over-interpret this effect, we expect
this to be due to inhomogeneities in the structure, or local variations in the particle
concentration, as described further below and depicted in figure 2.7. Areas with a
lower local volume fraction of particles initially will display faster dynamics. We
expect that this effect will disappear as samples age and the structure become more
homogeneous, which is what we observe.
By 90 days of aging, all samples transition to glasses (figure 2.4c), and there are no
more crossovers in g2(τ). Additionally, for all non-ergodic samples, the value of g2(τ)
at long delay times, g2(∞), increases with aging time. This value is typically inter-
preted as the fraction of frozen-in density fluctuations; in other words, it is a measure
of the probability that caged particles in an arrested state can straddle around their
metastable equilibrium positions.14 So as aging time increases, all samples tend to
become more frozen or deeper in the glassy state. Similar trends have been observed
39

(a)
(b)
(c)
Figure 2.4. Normalized autocorrelation function for different polymer concentrationsafter (a) 30 days (b) 50 days (c) 90 days of aging. For clarity, only every 10th datapoint is shown, and only selected concentrations are shown. Lines are guide to theeye. (Data with the same designations as figure 2.1).
40

Figure 2.5. Value of g2(∞) as a function of concentration after various days of aging.Lines are guides for the eye.
in aging studies of pure laponite R© suspensions of various concentrations with added
salt.74
While it is possible to quantify DLS data from glassy systems by fitting the data
to different functional forms to obtain relaxation times, here we interpret our results
in terms g2(∞). This quantifies how deep samples are in the glassy state while elimi-
nating any unphysical parameters that may arise from data fitting. Figure 2.5 shows
the value of g2(∞) as a function of polymer concentration at different days of aging.
Initially, with the addition of polymer, the formation of a laponite R© glass is retarded;
i.e., the plateau value goes to zero. As the samples age, it is again apparent that the
polymer concentration of 1.25 wt% represents some type of critical concentration in
the system. Above and below this concentration, the plateau value increases sharply
with aging time. The rate at which samples age also displays interesting behaviour
close to this critical polymer concentration. Figure 2.6 shows g2(∞) as a function of
aging time. Samples above and below the critical concentration progress to a glassy
state by 10-30 days of aging, with g2(∞) > 0.4 for these samples. By contrast, at the
critical concentration, a rise in g2(∞) does not occur until 50-60 days of aging.
41

Figure 2.6. Value of g2(∞) as a function of aging days for various concentrationsof polymer. Lines are guides for the eye. (Data with the same designations as figure2.1).
How do we understand the significance of the critical concentration of PEO for this
system, and why it affects aging of the samples in the above manner? As mentioned
previously, PEO chains adsorb on the surface of the laponite R© discs,62,63 with some
fraction of chains adsorbed to the surface and some present as free chains in solution.
Nelson and Cosgrove63 performed a detailed SANS study on laponite R© dispersions
with varying PEO concentrations and have fit their SANS data to calculate the con-
centration of PEO chains needed to saturate the laponite R© surface. From their work,
for PEO with a molecular weight of 20 kg/mol, the saturation concentration is ap-
proximately 0.6 mg/m2, and laponite R© has a specific surface area of 900 m2/g. Thus,
in a mixed solution of laponite R© and 20 kg/mol PEO, the weight ratio of polymer
to laponite R© will be equal to (900 m2/g) × (0.6 mg/m2) × (1 g/1000 mg) = 0.54
g polymer/g laponite R© at saturation. Thus, for our samples at 2 wt% laponite R©,
we estimate the saturation concentration to be 1.1 wt% PEO. Below this concentra-
tion, there will be a very small number of free chains in solution, with the number
of free chains increasing above this concentration. The time scale over which aging
of samples occurs (e.g., tens of days) may give some indication of the mechanism of
42

aging. We expect adsorption of PEO chains onto laponite R© surfaces to occur rapidly,
as compared to the time scale for aging. Laponite R© particles have a layered silicate
structure. Previous work by Fu and Santore75 on the adsorption onto silica surfaces
for various molecular weight PEO chains suggests a time scale of approximately 10
minutes for saturation of bare silica surfaces by 20 kg/mol PEO chains. Once surfaces
become saturated, there are other dynamic processes to consider, including rearrange-
ment of chains on the surface and exchange between adsorbed chains and those in
solution. Although these processes are slower than the initial adsorption step, they
are still expected to be rapid compared to the time scale for aging that we observe in
our systems. For example, data from Mubarekyan and Santore76 imply a time scale
of 1-10 hours for self-exchange of 20 kg/mol PEO chains on saturated silica surfaces.
Thus, we need to consider mechanisms by which the structure changes that have
much longer time scales, on the order of days. Previous studies on neat laponite R©
dispersions54,77 show a two-step aging process, with the slow process occurring over
several hours or days. It is known that upon initial dispersion in water, some clusters
of laponite R© are present, and that the structure of neat laponite R© dispersions be-
comes more homogeneous as the samples age.77 This is accompanied by an increase
in G′. Thus, the slow aging process occurring in neat laponite R© dispersions is of-
ten ascribed to particles that are initially in clusters diffusing away or rearranging,
resulting in a system with a higher effective volume fraction and stronger elasticity
(figure 2.7a). Another way to consider this is in terms of the inhomogeneity of the
structure; initially, because of cluster formation there are regions with a locally lower
particle volume fraction that cannot support stress as effectively. If the slow break-
up of clusters is what controls the time scale for aging in our systems, how can we
understand the impact that added polymer has on the dynamics? This work and our
previous studies,27,69 as well as very recent work of Tong and co-workers78 show that
the presence of low molecular weight PEO significantly slows aging. For samples at
43
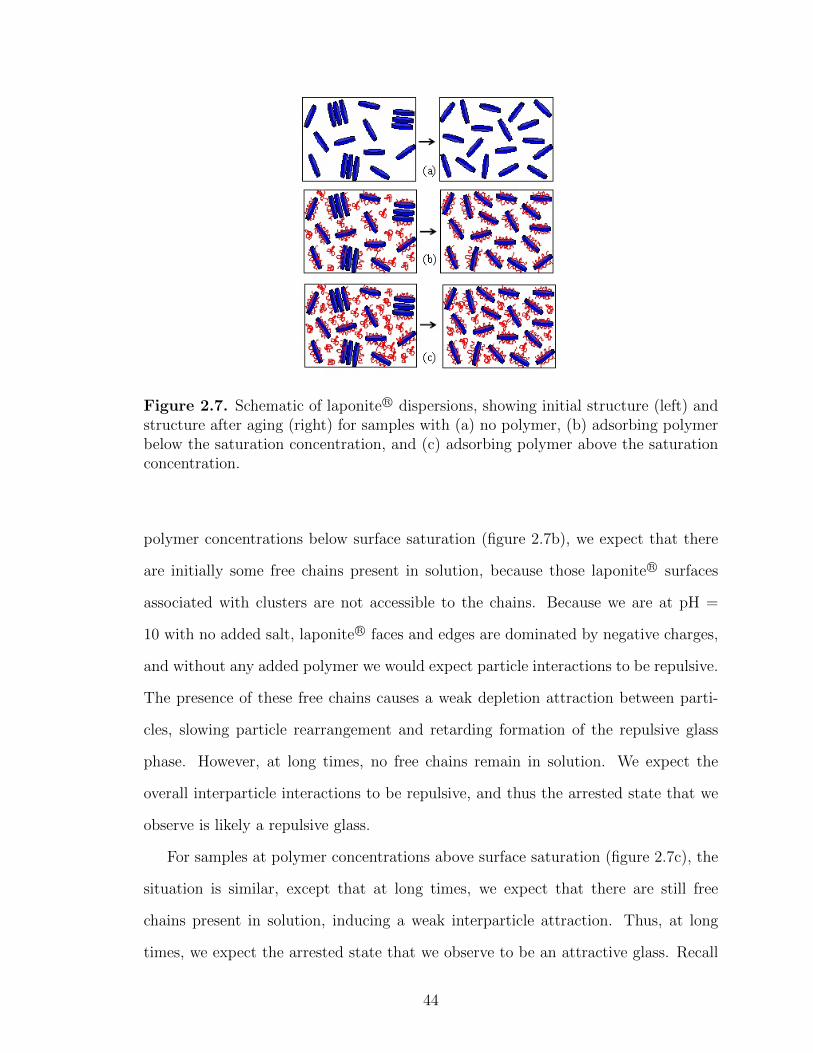
Figure 2.7. Schematic of laponite R© dispersions, showing initial structure (left) andstructure after aging (right) for samples with (a) no polymer, (b) adsorbing polymerbelow the saturation concentration, and (c) adsorbing polymer above the saturationconcentration.
polymer concentrations below surface saturation (figure 2.7b), we expect that there
are initially some free chains present in solution, because those laponite R© surfaces
associated with clusters are not accessible to the chains. Because we are at pH =
10 with no added salt, laponite R© faces and edges are dominated by negative charges,
and without any added polymer we would expect particle interactions to be repulsive.
The presence of these free chains causes a weak depletion attraction between parti-
cles, slowing particle rearrangement and retarding formation of the repulsive glass
phase. However, at long times, no free chains remain in solution. We expect the
overall interparticle interactions to be repulsive, and thus the arrested state that we
observe is likely a repulsive glass.
For samples at polymer concentrations above surface saturation (figure 2.7c), the
situation is similar, except that at long times, we expect that there are still free
chains present in solution, inducing a weak interparticle attraction. Thus, at long
times, we expect the arrested state that we observe to be an attractive glass. Recall
44

that our chains are well below the length needed to form interparticle bridges in 2
wt% laponite R© dispersions, which we previously estimated to be approximately 80
kg/mol.27 Thus, we believe the mechanism for structural arrest in laponite R©-PEO
systems above surface saturation to be similar to that seen in attractive colloidal
glasses, rather than due to formation of a particle-polymer network. The dependence
of the rheology and dynamics on polymer concentration at shorter aging times (figure
2.1a and figure 2.5) shows some similarity to the re-entrant glass transition observed in
colloids with non-adsorbing polymer. However, we obtain the interesting result that
this behaviour does not persist at long aging times, where all of the samples examined
here evolve to an arrested state. We have summarized this in figure 2.8a, which shows
a state diagram for the system as a function of polymer concentration and aging time.
Figure 2.8a also shows a tentative line for phase separation, based on our observations
of macrophase separation for samples at polymer concentrations greater than 2 wt%
at longer times. Ideally, one would be able to confirm clusters the clusters depicted in
figure 2.7 in samples containing polymer above the saturation concentration, either
via electron microscopy or perhaps via ultra-small angle neutron or x-ray scattering
techniques. For instance, Bippus et al.79 have previously used SEM/TEM along
with other characterization techniques to analyze the structure of pure laponite R©
and laponite R©-surfactant microparticles processed by spray drying and proposed a
mechanism to explain the formation of microspheres where the adsorbed surfactant on
the particle surface fill the interlayer space to form nanocomposites. For our aqueous
samples, the most appropriate technique to visualize the clusters will likely be cryo-
TEM, and studies are underway in our laboratory to quantify microstructure via
ultra-small-angle neutron scattering and cryo-TEM. Nevertheless, we emphasize that
the states shown in figure 2.8a are based on the dynamics of the system as observed
via rheology and DLS. Liquid, attractive glass, and repulsive glass states are all dense,
disordered states and are thus difficult to discern from structural measurements alone.
45

(a)
(b)
Figure 2.8. (a) State diagram for 2 wt% laponite R© dispersions and varying amountsof 20 kg/mol PEO, showing evolution of arrested states with aging time. (b) Pro-posed qualitative state diagram at long aging times for colloidal dispersions at a fixedparticle volume fraction with adsorbing polymer. The gel and liquid phases shownare based on earlier studies of 2 wt% laponite R© with added PEO.1
46

However, the dynamics and rheology of liquids and glasses are dramatically different.
Thus, even without direct structural characterization, we are confident there is clear
evidence for the states shown in fig 2.8a.
Although the liquid phase that is initially observed for the 20 kg/mol PEO does
not appear to be an equilibrium phase, our earlier work has shown a liquid phase for
2 wt% laponite R© samples with 2 wt% PEO with molecular weights of 49 kg/mol and
63 kg/mol that persists for 80-90 days, and a gel phase comprising a particle-polymer
network for molecular weights greater than 83 kg/mol.27 The state diagram shown in
figure 2.8a obviously varies with polymer molecular weight in a complicated manner.
figure 2.8b shows a qualitative state diagram for long aging times that includes the
liquid and gel phases found in earlier studies. Obviously, additional experiments must
be performed to obtain a complete quantitative state diagram in terms of polymer
concentration and molecular weight. Additionally, based on the work of Pham et al.72
we expect that the presence of the liquid state to be dependent upon both particle and
polymer polydispersity. Still, we believe even a qualitative description of the system is
useful to aid in the design and processing of multicomponent particle-polymer systems
with high particle loadings.
2.4 Conclusion
DLS and rheology have been performed on laponite R©-PEO suspensions at a fixed
laponite R© concentration of 2 wt% with 20 kg/mol PEO at varying concentrations.
The addition of polymer to laponite R© suspension retards the formation of a glassy
state. Samples initially show a progression of repulsive glass-liquid-attractive glass
behaviour as polymer concentration is increased, reminiscent of the re-entrant glass
transition observed in colloids with non-adsorbing polymer. However, as samples age
they all transition to an arrested state. The concentration at which polymer chains
saturate the particle surface is key to both the kinetics of aging and the type of
47

Figure 2.9. Loss modulus versus frequency for samples at 2 wt% laponite R© andvarious concentrations of polymer at 21 days
arrested state eventually formed. Close to this critical concentration, samples initially
form ergodic liquid that age very slowly to glassy states. Below this concentration,
we believe the arrested state to be a repulsive glass, and above it, an attractive glass
with interparticle attractions arising from free polymer chains in solution.
2.5 Supplementary information
Figures 2.9, 2.10, 2.11 show the loss modulus for the samples after different days
of aging. For detailed discussion please refer to section 2.3.
48

Figure 2.10. Loss modulus versus frequency for samples at 2 wt% laponite R© andvarious concentrations of polymer at 60 days
Figure 2.11. Loss modulus versus frequency for samples at 2 wt% laponite R© andvarious concentrations of polymer at 90 days
49

Figure 2.12. tan(δ) versus frequency for samples at 2 wt% laponite R© and variousconcentrations of polymer at 21 days
Figure 2.13. tan(δ) versus frequency for samples at 2 wt% laponite R© and variousconcentrations of polymer at 60 days
50

Figure 2.14. tan(δ) versus frequency for samples at 2 wt% laponite R© and variousconcentrations of polymer at 90 days
51

CHAPTER 3
POLYMER-MEDIATED CLUSTERING OF CHARGEDANISOTROPIC COLLOIDS
3.1 Introduction
The existence of dense colloidal aggregates that are stable in size has garnered
significant interest. From a fundamental point of view, the specific shape and type
of interparticle potentials that lead to phases of stable clusters, rather than the more
widely-seen fractal aggregates or phase separation, remains an active area.24,26,80
There are also current and emerging applications that rely on controlled aggregation
of nanoparticles into stable dense clusters, including assemblies for digital printing,81
biosensors and cellular imaging,82,83 drug delivery,84 and energy storage.85 For these
applications, it is important to understand the physical parameters that can be used
to control cluster size and morphology.
Although clustering has been seen in purely repulsive systems,86,87 the literature
on attractive colloids is more relevant to the systems that we study. There have been a
number of studies devoted to hard-sphere colloids with non-adsorbing polymer, which
have a short-range attraction. At low colloid volume fractions, experiments20,26 and
numerical simulations19 show gelation that occurs with a spinodal decomposition pro-
cess. At higher volume fractions, two different types of glassy arrested states can be
present.12,13,14 A different scenario is seen in particles with short range attraction
complimented by long range repulsion. In this case, competition between aggregation
from the attractive portion of the potential and the stabilizing role of repulsion has
been observed. When the repulsion is short-range (< 0.5σ, where σ hardcore diameter
52

of the particle), it was observed in experiments21 and simulations22,23 that elongated
clusters of particles would form at low enough temperature. But, at larger volume
fraction (but less than 0.2), clusters are found to merge into a percolating network.
When the range of repulsion is appreciably long (> σ), simulations24,25 show forma-
tion of both Wigner fluids of clusters and a glass transition driven by the repulsive
interaction.
In all the cases studied above, particles are spherical and the polymer is uncharged.
Here we report clustering, dynamics, and rheology in a model disk-shaped colloid with
a charged non-adsorbing polymer. The colloid we use is laponite R©, a disk-shaped
particle with a diameter of 30 nm and 1 nm thick. The laponite R© crystal is composed
of -1500 unit cells48 with the empirical formula Na+0.7[(Si8Mg5.5Li0.3)O22(OH)4]−0.7.
Many studies suggest that laponite R© disks have a slight positive charge along the rim
and slowly dissociate when pH is less than 9, while the pH > 9, the disk has a uniform
negative charge.49 These conditions correspond to repulsive electrostatic interparticle
interactions.50 In aqueous dispersions at pH > 9, laponite R© forms a disordered gel-like
solid. Evidence from scattering (SAXS, SANS and light) confirms that this phase is
a repulsive colloidal glass.51,52 However, a recent analysis suggests there may be some
positive charge on the edge even at higher pH, with roughly 10% of the edge groups
being positively charged and slightly decreasing with increasing pH for pH < 11.53
As the surface charge is pH dependent, there has been a much debate on whether the
structural arrest arises due to the repulsions from overlapping of double layers or from
aggregation due to attractive interactions between the edges and faces.52 But, several
studies from the literature now generally agree that, with no added salt, laponite R©
at basic pH forms a repulsive glass.53
The interactions between laponite R© particles can be tuned with the addition of
salt or polymer. Ruzicka et al have done a kinetic study on the aging dynamics on
laponite R© at different particle concentrations88 with added salt89 and have observed
53
different routes for structural arrest. At low concentrations of colloids and high salt
concentrations, suspensions form a gel driven by attractions, whereas at higher colloid
concentration and low salt concentration, the structural arrest is driven by repulsive
interactions and a glassy phase is observed. Mongodry et al.90 observed slowing
down of the formation of laponite R© gels with salt in the presence of pyrophosphate
and poly(ethylene oxide) (PEO). In the former case the rim charge is screened by
adsorption of four valence ions, which increases the activation energy for binding,
whereas steric hindrance of chains adsorbed onto the laponite R© particles slows down
aggregation in the latter case. Similarly, Zulian et al.68 have done a kinetic study
on the aging dynamics of the repulsive laponite R© glass with addition of PEO and
observed a slowing of the aging dynamics upon addition of polymer. Labanda and
Llorens91 developed phase diagram for a system of laponite R©-sodium polyacrylate at
different ionic strengths, and in the presence of salt they also observed a variation
of viscoelastic properties of the suspension with different molecular weights92 and
concentrations93 because of the change in the electrostatic interaction between the
particles.94
In our previous studies of laponite R© with an adsorbing polymer, PEO, we have
explored long-term aging dynamics by varying the length27 and concentration95 of
polymer chains and have observed a type of re-entrant behavior, where elasticity is
lost or decreased upon addition of polymer. However, the presence of bridging chains
complicates analysis of these systems. In this chapter we present a dynamic light scat-
tering (DLS) and rheology study of the aging dynamics of discotic clay particles with
a low molecular weight non-adsorbing polymer, the sodium salt of poly(acrylic acid)
(PAA). We consider this polymer to be non-adsorbing, as the surface of laponite R© is
dominated by negative charges at the conditions of this study (pH = 10),53 and the
polymer is anionic and nearly fully charged at this pH. Because addition of PAA re-
sults in an increase in the ionic strength of the solution, the effects of PAA addition on
54

the interparticle interactions are complex. However, comparison of our data with pre-
vious studies on laponite R© dispersions with added salt59,74,89 suggest that the results
we observe are primarily due to a depletion attraction caused by the polymer, and
are not the result of electrostatic screening. Some of the behavior we observe appears
to be analogous to phenomena seen in glasses of spherical colloids with short-range
attractions caused by non-adsorbing polymer.96,97
3.2 Materials and Methods
Laponite R© RD was obtained from Southern Clay Products (Gonzales, TX, USA).
PAA with a molecular weight 5.1 kg/mol was purchased from Sigma-Aldrich. Samples
were prepared by first adding the clay to nanopure water adjusted to a pH of 10 by
the addition of NaOH. A T25 Basic UltraTurrax homogenizer was used for about 1
minute to fully disperse the clay and break up any large aggregates. Suspensions were
then stirred for 20 min using a magnetic stirrer and filtered using a 0.45 µm filter.
PAA was then added to obtain the desired polymer concentration, cp, and samples
were again stirred for 1-2 min to dissolve the polymer. Samples were prepared at two
concentrations of laponite R© (2 wt% and 3 wt%) and cp varying from 0-0.75 wt%.
Addition of PAA results in an increase in the ionic strength of the solutions; the
concentrations we have chosen lead to samples with an ionic strength of 0.1 mM 1.5
mM. We consider aging time t = 0 to be the time after the polymer is completely
dissolved and stirring has been stopped.
Dynamic light scattering (DLS) was performed to obtain the normalized auto
correlation function g2(τ). A 200-mW Innova Ar-ion laser of wavelength of 488 nm
with a Brookhaven Instruments BI-9000AT correlator was used. Data was taken at
an incident angle of 90◦ and sampled for 1 minute with delay times of 0.1 to 107
µs. All samples were given a slight rotation after each run to obtain data at 20-50
different positions for each sample. The average of the ensemble is reported.70 For
55

such measurements on non-ergodic systems, the number of positions that need to be
sampled to get an accurate value of g2(τ) is system-dependent, with some systems
requiring as few as 10 positions sampled71 and others requiring several hundred. Ex-
perimentally, we found 20-50 sample positions sufficient to yield an ensemble average
that did not appreciably change with additional measurements. Following Bonn and
co-workers,58,74 we can define the ergodic break point as the aging time when the
time-average correlation function is no longer equal to the ensemble-average correla-
tion function.
Oscillatory shear rheological experiments were conducted using a ARG2 stress-
controlled rheometer from TA Instruments. Dynamic stress sweeps were performed
at 1 Hz to determine the linear viscoelastic region (LVE), and then a frequency sweep
was performed within the bounds of LVE.
3.3 Results and Discussion
Figure 3.1 shows the ensemble-averaged normalized autocorrelation function, g2(τ),
for a fixed laponite R© concentration of 3 wt% and varying cp, after 1 day and 30 days
of aging. For clarity, every tenth data point in each series is plotted. After 1 day, the
neat laponite R© dispersion shows dynamics of an arrested state. The system shows
non-ergodic behavior (data not shown), and g2(τ) plateaus to a value of approxi-
mately 0.4 at long delay times. The plateau value can be interpreted as the fraction
of frozen-in density fluctuations in a glass, in other words, it is the probability that
caged particles in an arrested state can straddle around their metastable equilibrium
positions.14 Addition of polymer dramatically changes the state of the suspension.
At t = 1 day, all samples with polymer behave as ergodic fluids, and g2(τ) decays to
zero (figure 3.1a). The dynamics are dependent upon the concentration of polymer
in the system. As the samples age, g2(τ) at long delay times becomes non-zero and
samples become non-ergodic, suggesting that for a laponite R© concentration of 3 wt%,
56

even samples with polymer age to a structurally arrested state over sufficiently long
times (figure 3.1b).
Figure 3.2 shows g2(τ) for samples at 2 wt% laponite R© and varying cp after 30
days of aging. Samples with polymer are still fluids with ergodic behavior, whereas
the neat laponite R© suspension at this concentration is a soft elastic solid. Thus, for
the same cp, samples at high laponite R© concentration eventually age to an arrested
nature, while those at a lower concentration remain liquids over the time period we
have studied.
The formation of a liquid phase upon addition of PAA is similar to behavior ob-
served in repulsive glasses of hard-sphere colloids,14 where addition of small amounts
of non-adsorbing polymer induces a weak depletion attraction that speeds dynamics
and melts the glass into a liquid state. As noted above, addition of PAA also increases
the ionic strength of the solution, so PAA modifies the interparticle interactions in a
complex manner. The free PAA chains will increase the attraction between laponite R©
particles due to depletion effects. The increase in ionic strength will also cause an
effective increase in the interparticle attraction, as the additional counterions present
will partially screen electrostatic repulsion between laponite R© particles. However,
contrasting the behavior we observe with that seen in laponite R© dispersions with
added salt highlights some differences in the system physics. The phase behaviour
of laponite R© with added salt has been explored by many groups.28,53,74,89,98 Although
there have been some differences in the detailed phase diagrams reported, it is impor-
tant to note that none of them show a transition from an arrested state to a liquid
state as the salt concentration is increased. Rather, most studies show transitions
between two types of arrested states (e.g., a transition from a repulsive glass/Wigner
glass to either an attractive glass or a gel as ionic strength increases).53 The ionic
strengths explored in these studies have been in the range of 0.1-10 mM, comparable
to or higher than the ionic strength that we estimate in our laponite R©-PAA disper-
57

(a)
(b)
Figure 3.1. Normalized autocorrelation function for 3 wt% laponite R© and differentconcentrations of polymer, cp, after (a) 1 day (b) 30 days of aging. For clarity, every10th data point is shown in each series. The lines for the data series with polymerare fits to equation (3.1).
58

Figure 3.2. Normalized auto correlation for 2 wt% laponite R© and different concen-trations of polymer after 30 days. For clarity, every 10th data point is shown in eachseries. The lines for the data series with polymer are fits to equation (3.1).
sions. Additionally, while added salt acts to speed the aging from an ergodic to a
non-ergodic state as compared to laponite R© dispersions with no added salt,59,74 for
our systems the addition of polymer slows the aging process as compared to neat
laponite R©.
To develop a physical interpretation of our DLS data, we must understand the
nature of the multiple dynamic processes that are present. For the 2 wt% series of
samples, which remain ergodic fluids over long periods of time, we performed DLS at
different angles after a set period of aging. To simplify the interpretation, we analyzed
the data as having two distinct relaxation processes, a fast and slow mode. Figure 3.3
shows a representative set of data for the decay rate, Λ, for the fast and slow mode,
as a function of the scattering vector q, for 2 wt% laponite R© with 0.25 wt% polymer
after aging for 300 days. (Note that the decay rate is typically given the symbol
Γ in light scattering literature; here we use the symbol Λ to avoid confusion with
the mathematical gamma function used in equation 3.2, below). Figure 3.3 shows
that Λ varies linearly with q2, indicating that both relaxation processes are diffusive
59

Figure 3.3. Λ vs q2 for 2 wt% laponite R© and 0.25% polymer after aging for 300days. Lines are guide to the eye.
in nature. We surmise that the fast mode describes motion of single particles of
laponite R©, whereas the slow mode describes movement of larger clusters of particles.
To quantify the dynamics, we fit g2(τ) for the samples containing polymer to a
stretched sum of exponential decays:27
g2(τ) = A
[pe
(− ττ1
)+ (1− p) e
(−(ττ2
)β)]2+ C (3.1)
where A, p, τ1, τ2, β, C are fitting parameters. Note that this data fitting was
only performed for samples containing polymer; the dynamics of neat laponite R© are
such that fitting this type of model over the data range that we have would yield
unphysical results. Lines in figures 3.1 and 3.2 are the fits of the data to equation 3.1.
The goodness of the fit is evident. Values and uncertainties of all fit parameters can
be found in the Supporting Information at the end of this chapter. The parameter
τ1 is the first relaxation time, representing dynamic processes that occur at short
time scales. For glassy systems, τ1 describes the movement of a particle in a cage
of neighbours.68 Thus, a higher value of τ1 indicates slower movement of individual
60

Figure 3.4. First relaxation time, τ1, as a function of aging time for suspensions of3 wt% laponite R© at different polymer concentrations. The vertical lines indicate theergodic break point, as defined by Bonn and co-workers.58,74
particles and can be related to an increase in the depth of attraction between particles.
Dynamic processes that occur on a longer time scale are described by a stretched
exponential function, characterized by the parameters τ2 and β. The mean relaxation
time τm associated with the slow dynamics which can be used to quantify the non-
ergodicity of the system is calculated as59,88,73
τm = τ21
βΓ
(1
β
)(3.2)
where Γ is the gamma function.
Figure 3.4 shows the first relaxation time, τ1, for various cp at a fixed laponite R©
concentration of 3 wt% at different days of aging. The ergodic break point is indicated
with a small vertical line. For the samples with polymer, τ1 increases slightly as
the samples age until the ergodic breaking point is reached. After this time, there
is no increase in τ1. As cp increases, particle motion retards gradually, and when
an arrested state is reached, the value of τ1 saturates. This is consistent with aging
behavior seen in attractive glasses of spherical colloids97 and in laponite R© suspensions
with added salt.74 Increasing cp increases the strength of attraction between particles
61

Figure 3.5. Mean relaxation time, τm, as a function of aging time for suspensions of3 wt% laponite R© at different polymer concentrations. The vertical lines indicate theergodic break point, as defined by Bonn and co-workers.74,58
via a depletion mechanism, hindering particle diffusion and leading to a higher value
of τ1 (i.e., slower particle diffusion). For the case of 0.25 wt% polymer, the system
reaches the arrested state at approximately 30 days, and hence there is a monotonic
increase in this relaxation time until this point. The mean relaxation time for this
same series of samples, varying cp at a fixed laponite R© concentration of 3 wt%, is
shown in figure 3.5. This mean relaxation time has a low value when the sample is
ergodic. As the sample gradually transforms from an ergodic liquid to an non-ergodic
phase, τm increases by orders of magnitude. The small vertical lines in figure 3.5
show the ergodic break point for the systems studied, which can be viewed as the
aging time after which the suspension can no longer be considered as ergodic fluid.
As can be seen from the figure, this point is dependent on the polymer concentration.
Samples with a higher cp need less time to undergo structural arrest. The trends in
this mean relaxation are consistent with the relaxation time observed in laponite R©
with salt.59,73
62

Figure 3.6. First relaxation time, τ1, as a function of polymer concentration fordifferent laponite R© concentrations for samples aged 30 days.
To compare the relaxation processes for different laponite R© concentrations, we
have plotted τ1 and τm as a function of cp for both laponite R© concentrations in figure
3.6 and 3.7. Figure 3.6 shows that the behavior of single particles progressively
departs from free diffusion as the interparticle attraction increases,13 as evidenced by
an increase in τ1 with cp for both 2 wt% and 3 wt% laponite R©. Interestingly, the
magnitude of τ1 and its dependence on cp are similar for both the 2 wt% and 3 wt%
series of samples, even though their overall behavior and bulk rheology (discussed
below) are drastically different. Thus, the local environment seen by a particle in
the 2 wt% series is similar to that experienced by a particle in the more crowded 3
wt% series. This is in sharp contrast to the behavior of τm, which is 3-4 orders of
magnitude slower for the 3 wt% series than for the 2 wt% series (figure 3.7).
Neat laponite R© dispersions at pH = 10 are dominated by repulsive forces and
form a glass at both 2 wt% and 3 wt%.28,53,74,89,98 The addition of non-adsorbing
PAA causes an effective increase in interparticle attractions, likely through both a
depletion mechanism and electrostatic screening. The suspension transforms from a
state in which single platelet of laponite R© acts as single entity in the non-ergodic
63

Figure 3.7. Mean relaxation time, τm, as a function of polymer concentration fordifferent laponite R© concentrations for samples aged 30 days.
state (repulsive glass) to a state in which the clusters of particles formed with the
addition of polymer acts as the basic entity. For the samples with polymer, τ1 is
weakly dependent on the laponite R© concentration and is mainly determined by the
amount of polymer. Thus, the strength of the attraction between particles and the
structure of particle clusters is similar for both the 2 wt% and 3 wt% series. The
mean relaxation time represents the cluster-cluster dynamics, and the presence of
neighboring clusters affects these dynamics. It is very clear from figure 3.7 that this
slow relaxation process is orders of magnitude higher for the 3 wt% laponite R© samples.
In the 3 wt% series of samples, movement of clusters is hindered, and the suspensions
undergo structural arrest.
In the 2 wt% series, the samples with PAA remain in the liquid state for long
times, and it appears that the clusters that are present undergo diffusive motions
(figure 3.3). We can calculate an effective size of the cluster from m using the Stokes-
Einstein equation, and figure 3.8 shows that this effective size is stable over long
periods of time, up to 120 days. Thus, the 2 wt% samples with added PAA are
liquids comprised of large, stable clusters that are free to diffuse in solution. Again,
64

Figure 3.8. Effective size of clusters derived from the mean relaxation time for 2wt% laponite R© at different polymer concentrations.
interestingly, this is different than what is observed in laponite R© dispersions with
added salt,28,53,74,89,98 even though both salt and non-adsorbing polymer lead to an
increase in the interparticle attractions. Parameters obtained from the fit of the DLS
data taken after 30 days of aging to equation (3.1) is given in table (3.1).
We have performed rheological characterization of these samples to confirm the
results from DLS. Figure 3.9 shows the variation of elastic modulus with frequency
for different polymer concentrations and different laponite R© concentrations after 30
days of aging. For the same polymer concentration, samples at 3 wt% laponite R© with
added PAA are weak elastic solids, while samples at 2 wt% laponite R© with added
PAA behave as viscoelastic liquids. Figure 3.10 shows tan(δ), which is the ratio of
viscous modulus to elastic modulus. If elastic effects dominate, tan(δ) has a value
less than one, which is what we obtain in the case of 3 wt% laponite R© and its samples
with polymer and for 2 wt% laponite R© with no polymer. However, if viscous effects
dominate, tan(δ) has a value greater than one, which is seen for 2 wt% laponite R© with
polymer. These results confirm the behavior observed in DLS. So, both laponite R©
and polymer concentration effect the elasticity of the suspension. After the system
reaches the arrested state, the elastic modulus depends strongly on the concentration
65

(a)
(b)
Figure 3.9. Elastic modulus as a function of frequency for different polymer con-centrations(shown in the legend) for laponite R© concentrations : (a) 3 wt% (b) 2 wt%
of polymer, but to reach the arrested state, both laponite R© and polymer concentration
play a crucial role.
A balance between the short range attractions induced by the addition of polymer
and long range electrostatic repulsion plays a crucial role in the dynamics of these
complex systems. In the case of suspensions with 3wt% laponite R©, with the addition
of polymer, clusters of particles are formed, but the movement of clusters is hindered
because of the presence of other clusters. In other words, we have a glass of clusters;
the clusters themselves are caged by neighbours and the whole system reaches the
arrested state. By contrast, suspensions at 2 wt% laponite R© with polymer behave
66

(a)
(b)
Figure 3.10. tan(δ) as a function of frequency for different polymer concentra-tions(shown in the legend) for laponite R© concentrations : (a) 3 wt% (b) 2 wt%
67

Laponite R©-Polymer(wt %) A p C τ1(µs) τ2(µs) β2-0.25 0.99±0.003 0.418±0.04 0.0003±0.002 127.81±5.29 295.66±21.46 0.589±0.02962-0.5 1.06±0.004 0.29±0.028 0.004±0.003 175.47±11.1 808.39±80.42 0.638±0.0242-0.75 1.01±0.001 0.247±0.005 0.0038±0.001 245.32±5.1 1.59E3±29.14 0.642±0.0063-0.25 1.11±0.011 0.217±0.004 0.031±0.001 177.715±4.5 3.90E4±2.7E3 0.2±0.0043-0.5 0.983±0.01 0.217±0.005 0.139±0.002 265.47±10.6 3.99E4±4E3 0.194±0.0053-0.75 1.03±0.01 0.215±0.005 0.103±0.003 338.53±15.7 9.00E4±1.1E4 0.188±0.006
Table 3.1. Parameters from the fits of DLS data after 30 days of aging to equation(3.1)
as fluids of clusters, with clusters that are stabilized with long-range electrostatic
repulsions up to 120 days.
3.4 Conclusion
Introduction of a non-adsorbing polymer, PAA, to repulsive glasses of laponite R©
changes the structure, dynamics, and rheology. The polymer causes initially causes a
transition from the glassy phase to an ergodic fluid; for samples at 3 wt% laponite R©
the fluid eventually ages to a weak arrested state, but samples at 2 wt% laponite R©
remain as fluids. This transition can be seen in both the DLS and rheology data. We
find that the polymer increases the fast relaxation time, signaling that attractions
have been introduced between particles. While increasing the ionic strength will also
result in an effective increase in interparticle attractions, the aging behavior and glass-
fluid transition we observe have not been seen in previous studies of laponite R© with
added salt, suggesting that depletion plays a role in the phenomena we observe. The
fast relaxation time is similar for both concentrations of laponite R© we explored, while
the slow relaxation time is orders of magnitude higher for the 3 wt% laponite R© sam-
ples. In the ergodic samples, both the fast and slow mode were found to be diffusive
in nature, suggesting that the samples of 2 wt% laponite R© with PAA are fluids of
stable clusters that are electrostatically stabilized. For 3 wt% laponite R© with PAA,
clusters (as opposed to particles) are trapped within repulsive cages of neighboring
68

clusters, and the glass transition of these clusters is responsible for structural arrest.
Our results also show that, in the 2 wt% series, the cluster size is stable over long
periods of time, and the concentration of PAA can be used to control the cluster
size. This may have implications for development of products and processes based on
dense assemblies of nanoparticles.
69

CHAPTER 4
CONTROLLED AGGREGATION OF CONCENTRATEDCOLLOIDAL SUSPENSIONS IN A SHEAR
ENVIRONMENT
4.1 Introduction
Study of aggregation in fine particle suspensions has long been of interest in col-
loidal science because of their industrial applications such as mineral processing, wa-
ter treatment, toner processing and environmental issues.99 Stability of suspensions
is required for ease of transportation and storage.100 On the other hand, aggregation
is often required for separation processes, such as flocculation of wastes from waste
water,101 and so on. More recently, processes have been developed that rely on the
formation of stable, dense aggregates that remain suspended in solution rather than
large flocs that precipitate.102 We refer to this as controlled aggregation. Applications
include toner for digital printing,81 microparticles for drug delivery,84 and probes for
cellular imaging.82
Aggregation arising from a number of different mechanisms has been explored in
the literature, including addition of salt103,104/non-adsorbing polymer,26,105 polymer
bridging,106 ”patchy” elctrostatic interactions.107 In colloidal systems with short range
attraction and long range repulsion, there is competition between aggregation from
the attractive part of the potential and stabilization from the repulsive part. This
can lead to the formation of stable clusters at low volume fractions,24,21 but at higher
volume fractions, suspensions undergo structural arrest, either via percolation23 or
glass transition25 depending on the range of repulsion. Stable clusters of particles
have been observed in system with short range attraction and screened long range
70

repulsion.26,107 and in systems with purely repulsive interactions.86,87 More complex
means of tuning interactions to induce clustering, such as coating toner particles with
small inorganic nanoparticles, have also been explored.108,109,110
Most of the above studies have explored the phase behavior under quiescent con-
ditions. However, when samples are sheared during processing, there is an additional
component of cluster breakage due to hydrodynamics. There are some studies on ag-
gregation of particles in a shear environment, although several are at volume fractions
below those used in typical industrial processes.111,112,113,114 Most relevant to our work
is the study of Nienow and coworkers.102,115 These authors examined a toner produc-
tion process whereby a 15 wt% suspension of 100 nm polymer latices was aggregated
by lowering the pH, leading to formation of very large aggregates and gelation. The
gel structure was then broken into unstable smaller aggregates (∼ 5-15 µm) that
were rendered stable by increasing the pH. This is a multi-step process, requiring
aggregation into a gel state, followed by shear breakage and final stabilization of the
microparticles.
Here, we report on a one-step process to form stable microparticles from a dense
dispersion of nanoparticles. Aggregation is triggered by addition of a commercial salt,
PAC. The salt decreases repulsions between the particles, leading to aggregation.
However, the resulting interparticle potential is such that we obtain a controlled
aggregation process. After a certain aggregate size, we find no further growth of
aggregates. In other words, the aggregates are found to reach a final stable size, and no
additional step is necessary for stabilization. We also show the effect of temperature
and pH on the aggregation dynamics and the final aggregate size distribution.
4.2 Materials and Methods
Suspensions of polystyrene latex particles at 40 wt% with a mean size of 165 nm,
supplied by Xerox, were diluted to obtain a weight fraction of 15% in a 2 liter glass
71

reactor with a single P4 − 45◦ impeller. To ensure that no initial aggregates were
present, the suspension was agitated at 500 rpm for 2 mins. Then, the suspension
was set to the required temperature at a agitator speed of 300 rpm, under which
conditions the reactor flow is the turbulent shear regime. Then, any pH adjustments
and/or destabilizer (PAC) addition was performed. Time t = 0 corresponds to the
time at which PAC addition occurred. Samples were taken out periodically from the
reactor and the size distribution was analyzed using Malvern Instruments Mastersizer
2000. We have reported the effect of PAC concentration, pH and temperature on
aggregation kinetics and final cluster size. We present the number mean size of the
aggregates and the volume percent of aggregates. A desirable range for aggregate
diameter used in toner is 3.5 - 11.2 µm. We term aggregates of this size toner range
and aggregates larger than 11.2 µm as coarse aggregates.
4.3 Results and Discussion
Figure 4.1 shows the time evolution of aggregate size at different PAC concentra-
tions. The legend shows the PAC concentration in pph of solids and the aggregation
temperature is 25◦C. For a given PAC concentration, the aggregate size increases for
a certain amount of time, and then levels off. All of the aggregates obtained are in
the range appropriate for digital toner. Clearly, decreasing the concentration of PAC
decreases the size of the final stable aggregates, but increases the time to attain the
steady aggregate size. At a very low PAC concentration, no significant aggregation
occurs, and the suspension is dominated by primary particles.
Addition of PAC decreases the electrostatic repulsion between the particles, which
triggers the aggregation process. At high PAC concentration, attractions are dom-
inant, so aggregates grow bigger in size, but once they reach a critical size, shear
breakage dominates. As the PAC concentration is decreased, repulsion increases
which hinders aggregation. The system needs more time to reach a final steady size
72

Figure 4.1. Effect of PAC concentration, in pph of solids, on aggregation kinetics.
where the shear breakage balances further growth. Figure 4.2 shows the evolution
of Particle Size Distribution (PSD) for a PAC concentration of 0.13 pph of solids.
From this figure, after some stipulated time there is no change in the PSD of the
suspension, essentially showing that the aggregates have reached a final steady state,
that the size and distribution do not change with time anymore.
Figure 4.3 shows the effect of temperature on aggregation kinetics at a PAC con-
centration of 0.13 pph of solids. With temperature, there is an increase in the mean
size of aggregates and also the kinetics of aggregation speeds up. However, at higher
PAC concentration and higher temperatures, a population of very large coarse ag-
gregates appears. Figure 4.4 shows PSD after steady state is reached for different
temperatures with a PAC concentration of 0.18 pph. This clearly shows formation of
a population of aggregates in the 20-100 µm range.
To summarize, we plot the final mean size of aggregates as a function of tempera-
ture for various PAC concentrations (figure 4.5). Increasing the temperature increases
the mean stable aggregate size, but the increase is higher at lower PAC concentra-
tions, which is clear from figure 4.3 . At the lowest PAC concentration studied, even
with an increase in temperature, suspension remain as primary particles.
73

Figure 4.2. Evolution of particle size distribution for a PAC concentration of 0.13pph of solids. After 20 minutes, the particle size distribution remains constant.
Figure 4.3. Effect of temperature on aggregation kinetics for a PAC concentrationof 0.13 pph of solids.
74

Figure 4.4. Final particle size distribution at different temperatures at a PACconcentration of 0.18 pph of solids.
Figure 4.5. Mean size as a function of temperature at different PAC concentrationsin pph of solids.
75

Figure 4.6. Volume percent of coarse aggregates (diameter > 11.2 µm) as a functionof temperature at different PAC concentrations.
In figure 4.6 we plot the volume percent of coarse aggregates as a function of tem-
perature at different PAC concentrations. It is clear from the figure that production
of coarse increases with temperature and also with PAC concentration. Since the
increase in coarse percent is higher for 0.18 pph PAC, there is no substantial increase
in mean size as compared to the other PAC concentrations (figure 4.5) .
The above experiments have been done without any adjustment of the pH. The
initial pH of the suspension is approximately 2.15. We next explored the effect of pH
on aggregation kinetics with a PAC concentration of 0.18 pph and at a temperature
of 45◦C. Figure 4.7 shows the mean size as a function of time at different pHs. For
the pHs of 2.15 and 3, suspension is dominated by aggregates and the mean size is
greater than 4 µm. On the other hand, suspensions above pH 4 are dominated by
primary particles. As the pH of the suspension is increased, surface chemistry of latex
particles undergo a drastic change which results in the hindrance of aggregation.
In figure 4.8 we plot the volume percent of aggregates in the toner range (diameter
3.5 - 11.2 µm) at different pHs. At the lowest pH employed, aggregation is fast as
compared to higher pH. Although some aggregates in the toner range are formed,
76

Figure 4.7. Time evolution of aggregate size for different pHs at a PAC concentrationof 0.18 pph of solids and temperature of 45◦C.
there is also a significant population of coarse aggregates (roughly 25% by volume, as
shown figure 4.6). At pH 3, although aggregation is slower than at pH 2.15, a higher
percentage of the final product is in toner range. But, as the pH is increased to 4
and above, aggregation ceases and the population of the suspension is dominated by
primary particles.
Thus, to obtain a product of dense aggregates with a narrow size distribution,
there is a optimum variable space of temperature, pH, PAC concentration and shear
rate. An increase in the temperature, an increase in the PAC concentration, or a
decrease in the pH speeds aggregation but triggers the production of coarse aggregates
at a given shear rate. On the other hand, increasing the pH above 4 drastically
changes the surface chemistry of the primary particles which increases the magnitude
of repulsion, effectively shutting down aggregation.
4.4 Conclusion
We have investigated the effect of coagulant concentration (PAC), pH, and tem-
perature on aggregation dynamics of latex particles in a shear environment, where
77

Figure 4.8. Volume percent of aggregates in ”toner range” at different pHs at aPAC concentration of 0.18 pph of solids and temperature of 45◦C.
competition between aggregation and shear controls the final aggregate size and dis-
tribution. Decreasing the PAC concentration decreases the rate of aggregation, and
at the lowest PAC studied, suspension is dominated by primary particles. Increasing
the temperature increases the production of coarse aggregates, and this effect is most
significant at the highest PAC concentration employed. Increasing the pH of the
suspension above 4 hinders the aggregation, and in this case even with the highest
PAC concentration and the highest temperature employed, suspension is dominated
by primary particles. This study gives the basic idea for designing the schemes for
controlled particle aggregation in a shear environment for dense suspensions.
4.5 Acknowledgements
This work has been done during an intern in Xerox Corporation, NY with Amy
Grillo and Chieh-Min Cheng as collaborators. We are very grateful to Steven Qi at
Xerox Corporation for his helpful discussions and the particle characterization group
for support.
78

CHAPTER 5
PROCESS MODELS TO PREDICT REGIMES OFCONTROLLED NANOPARTICLE AGGREGATION
5.1 Introduction
Aggregation of colloids has long been studied for processes such as formation of
large flocs for water treatment.100 and formation of fractal colloidal gels. A relatively
new phenomenon is the formation of dense, finite-sized clusters of colloidal particles
for applications such as toner for digital printing,81 microparticles for drug delivery,84
and probes for cellular imaging.82 We refer to processes leading to these dense clusters
as controlled aggregation, as conditions must be such that aggregates grow to a certain
desired size and then remain stable in size.
The interaction potential between particles plays a major role in determining the
nature and rate of aggregation in colloidal systems. Clustering and aggregation arising
from a number of different mechanisms has been explored in the literature, includ-
ing addition of salt103,104/non-adsorbing polymer,26,105 polymer bridging,106 ”patchy”
elctrostatic interactions.107 In colloidal systems with short range or moderate-range
attraction and long range repulsion, there is competition between aggregation from
the attractive part of the potential and stabilization from the repulsive part. This can
lead to the formation of stable clusters at low volume fractions,21,24 but at higher vol-
ume fractions, suspensions undergo structural arrest, either via percolation23 or glass
transition25 depending on the range of repulsion. Interestingly, stable clusters of par-
ticles have also been observed in systems with short-range attractions and a screened
long-range repulsion26,107 and in systems with purely repulsive interactions.86,87
79
In this study we focus on a process-level description of aggregation of charged
particles that are destabilized with addition of a salt. We use a DLVO-type potential
to describe interactions between particles, which includes a van der Waals attraction
between particles and a repulsive component arising from overlapping electrical double
layers.9,8 Addition of a salt screens the repulsive component of the potential, leading
to aggregation. There are several model experimental systems that show stability and
aggregation behavior that are well-described by the classical DLVO theory.8 Under
certain conditions, additional interactions which cannot be explained by DLVO theory
sometimes referred as non-DLVO forces. These include short range hydration forces,
capillary condensation and specific ion adsorption.9 However, due to the difficulty in
quantifying these forces and experimentally determining the additional parameters
that would be needed to describe these forces, their utilization in process models is
less feasible.116
Work by Smoluchowski117 laid the foundation for the use of particle population
balance models to describe aggregation in colloidal suspensions. The two impor-
tant functions in the population balance equation (PBE) are collision frequency fac-
tor or collision kernel and collision efficiency factor or stability ratio. These ker-
nels take into account the aggregation/breakage of aggregates due to brownian mo-
tion/shear106,111,114,118 and there are some kernels that account for differential set-
tling,106 In In our present study, we focus on aggregation that occurs under quiescent
conditions.119 Throughout the chapter, we refer ”particles” as both primary particles
and aggregates as well.
In the case of particles with a DLVO-type potential, under certain conditions
particles need to cross a barrier in order to join with other particles. So, every
collision experienced by particle need not make it to stick to its collision partner, and
this is governed in part by the height of the barrier. To take this into account, we use
the stability ratio, which is defined as the rate of aggregation when the interaction
80

is diffusion-limited (i.e., no energy barrier) to the rate when particle interactions are
present. Thus, a higher value represents a less efficient collision. We can also consider
this in the context of two commonly-considered limits of aggregation phenomena,
diffusion-limited cluster aggregation (DLCA) and reaction-limited cluster aggregation
(RLCA). For DLCA, the collision efficiency is very high, whereas for RLCA it is
lower.120 For the DLCA regime, the stability ratio is close to one,121 whereas for the
RLCA regime it is higher.
Morbidelli and co-workers have done extensive experiments,103,122 modeling119,123,124
and simulations125 to understand kinetics of aggregation and structure of the result-
ing aggregates. However, these and other studies99,106,121,126 have generally focused on
aggregation leading to gel phases, and the time scale reported is typically on the order
of a few minutes or for some studies up to a few hours. Thus, formation of finite-sized
clusters is not discussed, and the time scales are such that it is difficult to determine
whether the aggregate size would remain stable over longer times. Additionally, these
models generally have several parameters that need to be fit to experimental data.
For example, in some studies the stability ratio must be fit at different conditions.
This makes it difficult to extend the model to a larger variable space and use the
model in a predictive manner. Additionally, some studies106,121,116 report PBE-type
models of colloidal aggregation using the stability ratio only for the primary particles.
These types of models do not allow the stability ratio to change as the aggregate size
increases, and do not predict a regime of controlled aggregation.
Detailed simulations of clustering phenomena24,25,127,128,129 yield some insight into
the type of physics that must be incorporated into a PBE model in order to predict
the formation of stable clusters. Some simulation studies involved renormalizing the
radius of the cluster24,25 in order to account for changes in interactions as the ag-
gregation process proceeds. Most relevant to our work, Groenwold and Kegel127,128
predicted the existence of stable clusters of charged colloids, driven by the increasing
81

unfavorable energetics of adding additional particles to large clusters. These sim-
ulations emphasize that any process-level model must account for the interaction
potential between aggregates and particles, and hence the stability ratio, changing as
aggregate size increases.
Here we describe our experimental and modeling efforts to develop a PBE model
with a minimum number of fit parameters capable of mapping out three regimes of
aggregation: uncontrolled aggregation, controlled aggregation, and no aggregation
(a stable suspension of primary particles). By uncontrolled aggregation, we refer to
systems where aggregates continue to grow until either gelation occurs, meaning that
the aggregates are large enough to span the system, or precipitation occurs, meaning
that very large aggregates form that are too large to remain suspended in solution.
By controlled aggregation, we refer to systems where aggregates grow to a specified
size and remain that size, and remain suspended in solution. We have performed
experiments on systems with moderate particle concentrations of 5 - 15 wt%, relevant
to some industrial processes that rely on controlled aggregation. Recently, we reported
experimental evidence of controlled aggregation in a shear environment,130 but here
we focus on aggregation under quiescent conditions. In the quiescent case, there is
no breakage term in the PBE model. The particles aggregate irreversibly to form
clusters and final size of clusters is solely determined by the interaction potential.
5.2 Materials and Methods
Aqueous suspensions of electrostatically-stabilized latex particles with a mean
diameter of 200 nm and a colloid weight fraction of 45 wt%, supplied by Xerox
Corporation, were used for the aggregation experiments. Potassium Chloride was
used to destabilize the latex suspension. Colloid weight fractions of 5, 10 and 15
wt% at different ionic strengths have been prepared by diluting the stock suspension
with the required amount of water. The pH of the suspensions was not altered.
82
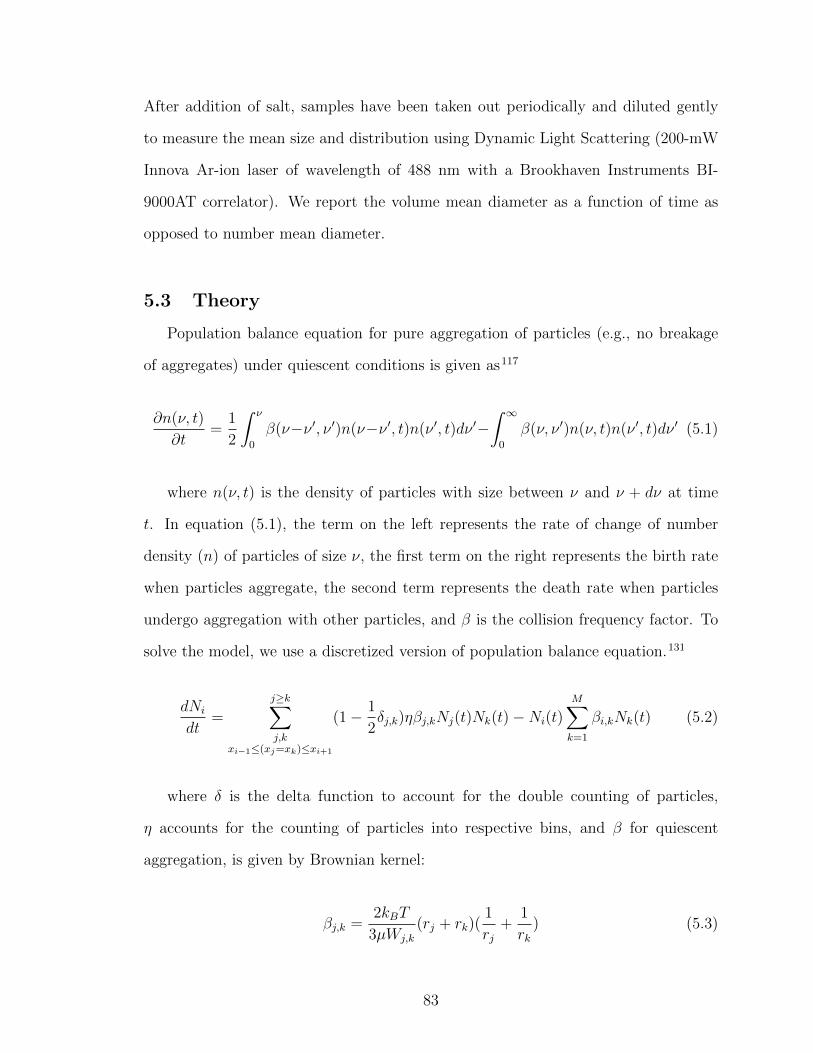
After addition of salt, samples have been taken out periodically and diluted gently
to measure the mean size and distribution using Dynamic Light Scattering (200-mW
Innova Ar-ion laser of wavelength of 488 nm with a Brookhaven Instruments BI-
9000AT correlator). We report the volume mean diameter as a function of time as
opposed to number mean diameter.
5.3 Theory
Population balance equation for pure aggregation of particles (e.g., no breakage
of aggregates) under quiescent conditions is given as117
∂n(ν, t)
∂t=
1
2
∫ ν
0
β(ν−ν ′, ν ′)n(ν−ν ′, t)n(ν ′, t)dν ′−∫ ∞0
β(ν, ν ′)n(ν, t)n(ν ′, t)dν ′ (5.1)
where n(ν, t) is the density of particles with size between ν and ν + dν at time
t. In equation (5.1), the term on the left represents the rate of change of number
density (n) of particles of size ν, the first term on the right represents the birth rate
when particles aggregate, the second term represents the death rate when particles
undergo aggregation with other particles, and β is the collision frequency factor. To
solve the model, we use a discretized version of population balance equation.131
dNi
dt=
j≥k∑j,k
xi−1≤(xj=xk)≤xi+1
(1− 1
2δj,k)ηβj,kNj(t)Nk(t)−Ni(t)
M∑k=1
βi,kNk(t) (5.2)
where δ is the delta function to account for the double counting of particles,
η accounts for the counting of particles into respective bins, and β for quiescent
aggregation, is given by Brownian kernel:
βj,k =2kBT
3µWj,k
(rj + rk)(1
rj+
1
rk) (5.3)
83

where kB is Boltzman’s constant, T is temperature and µ is the solvent viscosity. The
stability ratio Wj,k, defines the efficiency of aggregation when particles of radii rj and
rk collide and is governed by the interaction potential between the particles and is
given by132
Wj,k = (rj + rk)
∞∫rj+rk
exp( VTkBT
)
R2dR (5.4)
VT represents the total interaction potential, and in our present case using DLVO
theory is given as the sum of van der Waals attraction (VA) and electrostatic repulsion
(VE). The attractive part of the potential is given by
VA = −A6
(2r1r2
R2 − (r1 + r2)2+
2r1r2R2 − (r1 − r2)2
+R2 − (r1 + r2)
2
R2 − (r1 − r2)2
)(5.5)
where A represent the Hamaker constant, R is the center-to-center distance between
the particles. The electrostatic repulsion part is given by
VE = 64πεrε0
(kBT
zce
)2
tanh
(zceψ01
4kBT
)tanh
(zceψ02
4kBT
)(r1r2r1 + r2
)exp(−κ(R−r1−r2))
(5.6)
where e is elementary charge and zc is valence of the counterion and ε0 and εr are di-
electric constants of vacuum and solvent, respectively. The Debye-Huckel parameter κ
is a function of electrolyte concentration, valence of electrolyte ions and temperature.
The surface potential ψ0 depends on pH and temperature. The unknown parameters
in equations (5.5) and (5.6) are the Hamaker constant and surface potential. In our
study, we have used these as fitting parameters.
In our model, we consider aggregates as particles with a larger radius, and thus use
equations (5.5) and (5.6) to compute the interaction potential not only between pri-
mary particles, but also between aggregates and single particles, between aggregates
of different sizes, and so on. As discussed further below, this yields an interparticle
potential, and hence a stability ratio, that varies as the aggregation process proceeds.
84

The discretized PBE model (equation (5.2)) was solved numerically using the fixed
pivot technique133 with 64 node points for discretizing particle size. This method
was chosen due to its relatively low computational cost and ability to calculate the
particle size distribution with great precision.131 The PBE model has been discretized
at every node point, yielding 64 nonlinear ordinary differential equations (ODEs) in
time which were integrated in time with the Matlab code ode15s to calculate the
number distribution at each node point and then convert to the volume distribution134
to calculate the volume mean diameter, which has been fit to the experimental data
at a particular salt concentration.
5.4 Results and Discussion
5.4.1 Interaction potential between particles and aggregates
Figure 5.1a shows an example interaction potential between equal-sized particles
given by equations (5.5) and (5.6). Under certain conditions, the DLVO-type po-
tential results in an energy barrier that must be crossed before particles begin to
aggregate. The size of this barrier impacts the aggregation efficiency of colliding par-
ticles. Addition of salt decreases the magnitude of electrostatic repulsion and hence
the barrier height decreases which enhances aggregation (figure 5.1b).
Figure 5.2 shows the total interaction potential energy between a single particle,
fixed in size and particles of different size as a function of their distance of separation.
Many groups106,116,121 have performed PBE-type modeling of colloidal aggregation
using the stability ratio only for the primary particles. However, as the interparticle
potential is dependent on size, the stability ratio changes as aggregation proceeds.
This physics is important in understanding the mechanism of controlled aggregation of
charged colloids.127,128 As the aggregates grow in size, although the surface potential
remains the same, the effective repulsion increases because of the increased number of
particles in the aggregate. This increases the barrier against aggregation, so particles
85

find it increasingly difficult to add to an aggregate as its size increases. As mentioned
above, this mechanism of formation of stable clusters has been detailed by Groenwold
and Kegel.127,128 This highlights the need to include the complete calculation of the
stability ratio in our PBE model.
5.4.2 Aggregation experiments
Aggregation experiments were carried out at different colloid weight fractions 5,
10 and 15 wt % and at different salt concentrations. Addition of salt decreases elec-
trostatic repulsion and thus triggers aggregation. Figure 5.3 represent the evolution
of mean aggregate size as a function of time for salt concentrations of 0.2 - 0.3 M at
a colloid weight fraction of 5 wt%. At the highest salt concentration used, 0.3 M,
the suspension undergo uncontrolled aggregation and forms a gel phase. We stopped
measuring particle size when we see the gel phase. Suspensions with ionic strengths
in the range of 0.24 - 0.29 M show aggregation that ceases after the clusters reach
stable size. At ionic strength of 0.2 M and less (data not shown), we do not observe
any aggregation and the suspension remain as primary particles.
Similar results were observed for other particle concentrations. Figure 5.4 shows
the aggregation data for a 10 wt% sample at different salt concentrations. This
system also displays uncontrolled aggregation at 0.3 M, controlled aggregation with
aggregates of a stable size at 0.22 - 0.28 M, and no aggregation at 0.2 M. For higher
particle concentrations (figure 5.5), uncontrolled aggregation occurs at a lower ionic
strength, and the window of conditions leading to controlled aggregation narrows.
Figure 5.5 shows that 15 wt% suspensions begin to show uncontrolled aggregation at
a salt concentration of 0.26 M, and display controlled aggregation in the range of 0.20
- 0.24 M. This is to be expected, since particle collisions will occur more frequently
in denser suspensions, increasing the likelihood of aggregation and formation of large
aggregates.
86

(a)
(b)
Figure 5.1. Interaction energy as a function of distance of separation with parame-ters A=3.08 × 10⁻²⁰J, ψ0 = 59mV , for a particle size of 200 nm (a) ionic strength =0.2 M (b) different ionic strengths
87

Figure 5.2. Total interaction energy as a function of distance of separation betweena fixed particle size and particles of different size, parameters used are the same as infigure 5.1 at an ionic strength of 0.2 M
Figure 5.3. Experimental measurements of particle aggregation for a 5 wt% sus-pension at different salt concentrations. Uncontrolled aggregation is observed at 0.3M (red data series), controlled aggregation is observed for 0.24-0.29 M (black dataseries), and no aggregation is observed for 0.2 M (blue data series).
88

Figure 5.4. Experimental measurements of particle aggregation for a 10 wt% sus-pension at different salt concentrations. Uncontrolled aggregation is observed at 0.3M (red data series), controlled aggregation is observed for 0.22-0.28 M (black dataseries), and no aggregation is observed for 0.2 M (blue data series).
Figure 5.5. Experimental measurements of particle aggregation for a 15 wt% sus-pension at different salt concentrations. Uncontrolled aggregation is observed at 0.26M (red data series), controlled aggregation is observed for 0.20 - 0.24 M (black dataseries), and no aggregation is observed for 0.19 M (blue data series).
89

Figure 5.6. Comparison of size distribution model and experiment for a 5 wt%suspension at a salt concentration of 0.29 M.
5.4.3 PBE modelling
To utilize the PBE model, we fit experimental data of the final aggregate size at
a particle concentration of 5 wt% and a salt concentration of 0.29 M to obtain fitted
values of the Hamaker constant and surface potential, which were 3.08 × 10²⁰ J and
59.5 mV, respectively (Table 5.1). These values are reasonable agreement within the
values cited in literature for similar latex particles.8 Figure 5.6 shows the experimental
and model size distribution of aggregates after they reach stable size. The experi-
mental distribution is broader than the distribution from model. In our case, one
possible cause of the mismatch in the experimental and predicted size polydispersity
is that the PBE model assumes the aggregates formed are compact and spherical. Any
fractal structure in the aggregates would likely broaden the experimentally-measured
distribution.
Using the fit parameters from 0.29 M, the PBE model was used to predict the
mean aggregate size for 5 wt% suspensions at different ionic strengths (figure 5.7).
At a salt concentration of 0.3 M, the mean size of aggregates monotonically increases
with time very rapidly, and the aggregate size exceeds the maximum grid size used
90

Figure 5.7. PBE model results for the mean size of aggregates at different saltconcentrations for 5 wt % suspension.
Parameter ValueHamaker constant 3.08 × 10⁻²⁰ J
Surface potential, ψ0 (5 wt% suspension) -59.5 mVSurface potential, ψ0 (10 wt% suspension) -59 mVSurface potential, ψ0 (15 wt% suspension) -57 mV
Table 5.1. Fit parameters at different colloid weight fractions
(unlike other ionic strengths). At low ionic strengths of 0.24 - 0.28 M, aggregates
that reach a stable, finite size are predicted, in good agreement with our experimental
observations.
As noted above, similar stable clusters have been observed in suspensions with
short range attraction and screened electrostatic repulsion26 and in charged colloids
with short range attractions and long range repulsion.105,24 At an ionic strength of 0.2
M, no aggregation is predicted, again in good agreement with our experimental data.
It should be noted that the Hamaker constant and surface potential were fit at only
one ionic strength, 0.29 M, and these fit values were used to predict the mean size and
aggregation behaviour at different ionic strengths. The PBE model clearly captures
the phenomenon of controlled aggregation and can predict the different regimes of
91
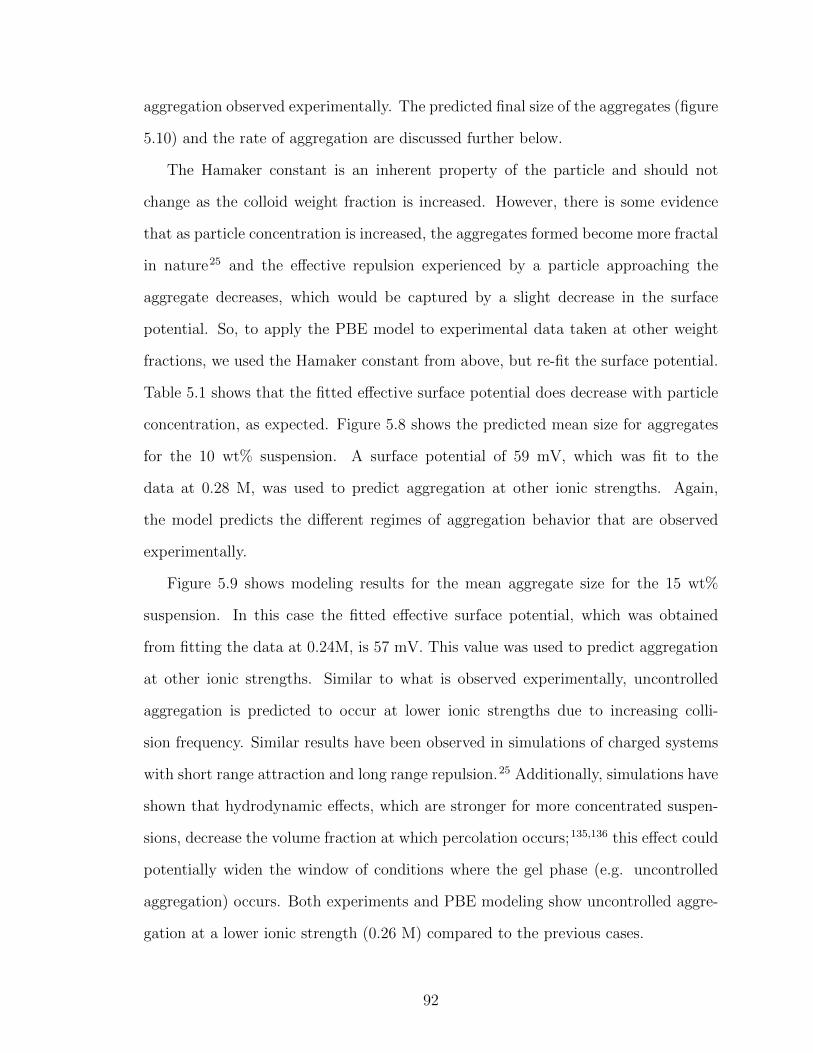
aggregation observed experimentally. The predicted final size of the aggregates (figure
5.10) and the rate of aggregation are discussed further below.
The Hamaker constant is an inherent property of the particle and should not
change as the colloid weight fraction is increased. However, there is some evidence
that as particle concentration is increased, the aggregates formed become more fractal
in nature25 and the effective repulsion experienced by a particle approaching the
aggregate decreases, which would be captured by a slight decrease in the surface
potential. So, to apply the PBE model to experimental data taken at other weight
fractions, we used the Hamaker constant from above, but re-fit the surface potential.
Table 5.1 shows that the fitted effective surface potential does decrease with particle
concentration, as expected. Figure 5.8 shows the predicted mean size for aggregates
for the 10 wt% suspension. A surface potential of 59 mV, which was fit to the
data at 0.28 M, was used to predict aggregation at other ionic strengths. Again,
the model predicts the different regimes of aggregation behavior that are observed
experimentally.
Figure 5.9 shows modeling results for the mean aggregate size for the 15 wt%
suspension. In this case the fitted effective surface potential, which was obtained
from fitting the data at 0.24M, is 57 mV. This value was used to predict aggregation
at other ionic strengths. Similar to what is observed experimentally, uncontrolled
aggregation is predicted to occur at lower ionic strengths due to increasing colli-
sion frequency. Similar results have been observed in simulations of charged systems
with short range attraction and long range repulsion.25 Additionally, simulations have
shown that hydrodynamic effects, which are stronger for more concentrated suspen-
sions, decrease the volume fraction at which percolation occurs;135,136 this effect could
potentially widen the window of conditions where the gel phase (e.g. uncontrolled
aggregation) occurs. Both experiments and PBE modeling show uncontrolled aggre-
gation at a lower ionic strength (0.26 M) compared to the previous cases.
92

Figure 5.8. PBE model results for the mean size of aggregates at different saltconcentrations for 10 wt % suspension.
Figure 5.9. PBE model results for the mean size of aggregates at different saltconcentrations for 15 wt % suspension.
93
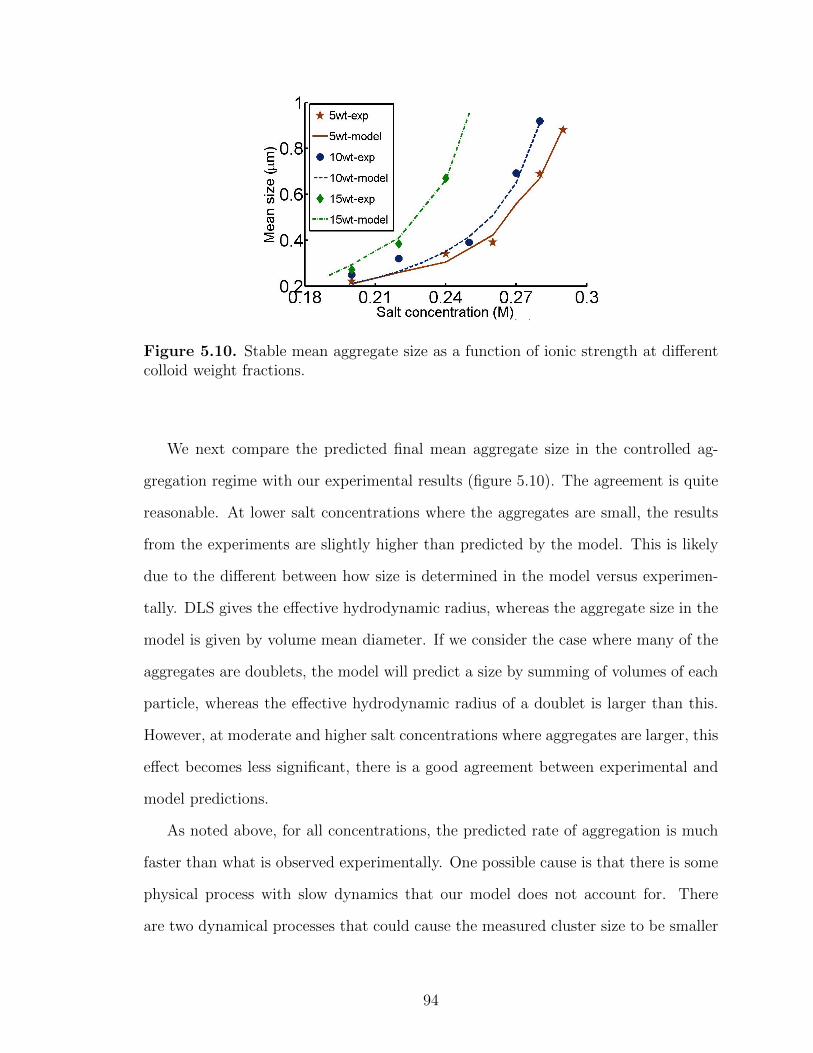
Figure 5.10. Stable mean aggregate size as a function of ionic strength at differentcolloid weight fractions.
We next compare the predicted final mean aggregate size in the controlled ag-
gregation regime with our experimental results (figure 5.10). The agreement is quite
reasonable. At lower salt concentrations where the aggregates are small, the results
from the experiments are slightly higher than predicted by the model. This is likely
due to the different between how size is determined in the model versus experimen-
tally. DLS gives the effective hydrodynamic radius, whereas the aggregate size in the
model is given by volume mean diameter. If we consider the case where many of the
aggregates are doublets, the model will predict a size by summing of volumes of each
particle, whereas the effective hydrodynamic radius of a doublet is larger than this.
However, at moderate and higher salt concentrations where aggregates are larger, this
effect becomes less significant, there is a good agreement between experimental and
model predictions.
As noted above, for all concentrations, the predicted rate of aggregation is much
faster than what is observed experimentally. One possible cause is that there is some
physical process with slow dynamics that our model does not account for. There
are two dynamical processes that could cause the measured cluster size to be smaller
94

than the predicted cluster size. One is that particles may be stuck reversibly, so they
may break free from the cluster and diffuse away due to thermal motions. This could
arise from patchiness on the particle surface, which is most certainly present (e.g.,
regions on the surface that have more charge than others, so they feel a stronger
repulsion). So even if the overall attraction between particles is strong enough that
we would expect particles to be irreversibly stuck, there may be local regions that
are not experiencing as strong of an attraction. The second process that we do not
account for is that particles that have already joined a cluster may re-arrange within
the cluster. This again could be due to patchiness. A particle that is stuck to a
cluster may have some freedom to roll into a position that makes the cluster denser
and could potentially be more energetically favourable. If either of these processes
occurs on a time scale that is slower than aggregation, the effect would be that the
final aggregate size would be the same, but the formation rate seen experimentally
would be slower than predicted by the model.
An alternate explanation is that hydrodynamic effects, which are also not ac-
counted for in the PBE model, may be acting to slow the aggregation process. Recent
Stokesian dynamics simulations of charge-stabilized particles performed by Morris136
show that hydrodynamic effects slow movement of particles into the primary min-
imum and make particle rearrangement difficult at small interparticle separations.
This impacts the aggregate structure and percolation volume fraction, but also the
overall rate of aggregation. Although our PBE model does not capture these phe-
nomena and does not predict the rate of aggregation accurately, it is able to predict
the final aggregate mean size at different ionic strengths, using only one experimental
data set to fit the Hamaker constant and surface potential. Thus, the model may
provide useful in designing processes and products based on stable aggregation of
nanoparticles.
95

5.5 Conclusion
We present experimental and process modeling results of aggregation of charge-
stabilized colloids. Although classical colloidal aggregation processes are well-studied,
here we explore the phenomena of controlled aggregation; e.g., aggregates that grow to
a fixed, stable size as a opposed to uncontrolled aggregation into fractal gels or flocs.
Experimentally, we observe three regimes of aggregation behavior as ionic strength
is increased: uncontrolled aggregation, controlled aggregation, and no aggregation.
Our PBE model includes the full calculation of the stability ratio as well as variations
in the interactions between particles and aggregates as aggregates grow in size. In-
corporation of this physics into the PBE model is important to its ability to predict
controlled aggregation. As the aggregates reach a certain size, the effective repulsion
between the aggregate and a single particle becomes large enough to prevent any
further addition of particles. The model shows good agreement with experiments
in predicting the three regimes of aggregation behavior and is also able to quanti-
tatively capture the final mean aggregate size. However, the model predicts a much
faster aggregation rate than is observed experimentally. We believe this could be due
to hydrodynamic effects, a slow breakage process (i.e., reversible aggregation), or a
slow re-arrangement process within the cluster.
5.6 Acknowledgements
This work has been done in collaboration with Prof. Michael A. Henson, UMass
Amherst
...
96

BIBLIOGRAPHY
[1] H. A. Baghdadi, J. Parrella, and S. R. Bhatia, “Long-term aging effects onthe rheology of neat laponite and laponite - poly(ethylene oxide) dispersions”,Rheologica Acta 47, pp. 349–357 (2008).
[2] J. P. Hansen and I. R. McDonald, Theory of Simple Liquids, Academic Press(2006).
[3] P. N. Pusey, W. Van Megen, S. M. Underwood, P. Bartlett, and R. H. Ottewilla,“Colloidal fluids, crystals and glasses”, Physica A 176, pp. 16–27 (1991).
[4] F. Sciortino and P. Tartaglia, “Glassy colloidal systems”, Advances in Physics54, pp. 471–524 (2005).
[5] P. N. Pusey and W. Van Megen, “Dynamic light scattering by non-ergodicmedia”, Physica A 157, pp. 705–741 (1989).
[6] A. Vrij, M. H. G. M. Penders, P.W. Rouw, C. G. Kruif, J. K. G. Dhont, C. Smits,and H. N.W. Lekkerkerker, “Phase-transition phenomena in colloidal systemswith attractive and repulsive particle interactions”, Faraday Discussions 90,pp. 31–40 (1990).
[7] M. O. Robbins, K. Kremer, and G. S. Grest, “Phase diagram and dynamics ofyukawa systems”, Journal of Chemical Physics 88, pp. 3286–3312 (1988).
[8] P. C. Hiemenz and R. Rajagopalan, Principles of colloid and surface chemistry,Marcel Decker Inc (1997).
[9] W. B. Russel, D. A. Saville, and W. R. Schowalter, Colloidal Dispersions,Cambridge University Press (1989).
[10] J. N. Israelachvili, Intermolecular and surface forces, Academic Press (1997).
[11] S. M. Ilett, A. Orrock, W. C. K. Poon, and P. N. Pusey, “A comprehensivestudy of the phase behavior of a model colloid-polymer mixture”, PhysicalReview E 51, pp. 1344–1352 (1995).
[12] K. N. Pham, A. M. Puertas, J. Bergenholtz, S. U. Egelhaaf, A. Moussaid, P. N.Pusey, A. B. Schofield, M. E. Cates, M. Fuchs, and W. C. K. Poon, “Multipleglassy states in a simple model system”, Science 296, pp. 104–106 (2002).
97

[13] K. N. Pham, S. U. Egelhaaf, P. N. Pusey, and W. C. K. Poon, “Glasses in hardspheres with short-range attraction”, Physical Review E 69, pp. 011503 (2004).
[14] T. Eckert and E. Bartsch, “Re-entrant glass transition in a colloid-polymermixture with depletion attractions”, Physical Review Letters 89, pp. 125701(2002).
[15] S. H. Chen, W. R. Chen, and F. Mallamace, “The glass-to-glass transition andits end point in a copolymer micellar system”, Science 300, pp. 619–622 (2003).
[16] E. Stiakakis, D. Vlassopoulos, C. N. Likos, J. Roovers, and G. Meier, “Polymer-mediated melting in ultrasoft colloidal gels”, Physical Review Letters 89, pp.208302 (2002).
[17] E. Zaccarelli, G. Foffi, K. A. Dawson, F. Sciortino, and P. Tartaglia, “Mechan-ical properties of a model of attractive colloidal solutions”, Physical Review E63, pp. 031501 (2001).
[18] E. Zaccarelli, G. Foffi, K. A. Dawson, S. V. Buldyrev, F. Sciortino, andP. Tartaglia, “Confirmation of anomalous dynamical arrest in attractive col-loids: A molecular dynamics study”, Physical Review E 66, pp. 041402 (2002).
[19] E. Zaccarelli, P. J. Lu, F. Ciulla, D. A. Weitz, and F. Sciortino, “Gelation asarrested phase separation in short-ranged attractive colloid-polymer mixtures”,Journal of Physics 20, pp. 494242 (2008).
[20] P. J. Lu, E. Zaccarelli, F. Ciulla, A. B. Schofield, F. Sciortino, and D. A. Weitz,“Gelation of particles with short-range attraction”, Nature Letters 453, pp.499–503 (2008).
[21] A. I. Campbell, V. J. Anderson, J. S. van Duijneveldt, and P. Bartlett, “Dynam-ical arrest in attractive colloids: The effect of long-range repulsion”, PhysicalReview Letters 94, pp. 208301 (2005).
[22] J. Bergenholtz, W. C. K. Poon, and M. Fuchs, “Gelation in model colloid-polymer mixtures”, Langmuir 19, pp. 4493–4503 (2003).
[23] F. Sciortino, P. Tartaglia, and E Zaccarelli, “One dimensional cluster growthand branching gels in colloidal systems with short-range depletion attractiveand screened electrostatic repulsion”, Journal of Physical Chemistry B 109,pp. 21942–21953 (2005).
[24] F. Sciortino, S. Mossa, E. Zaccarelli, and P. Tartaglia, “Equilibrium clusterphases and low-density arrested disordered states: The role of short-range at-traction and long-range repulsion”, Physical Review Letters 93, pp. 055701(2004).
98

[25] J. C. F. Toledano, F. Sciortino, and E. Zaccarelli, “Colloidal systems withcompeting interactions: From an arrested repulsive cluster phase to a gel”, SoftMatter 5, pp. 2390–2398 (2009).
[26] P. J. Lu, J. C. Conrad, H. M. Wyss, A. B. Schofield, and D. A. Weitz, “Fluids ofclusters in attractive colloids”, Physical Review Letters 96, pp. 028306 (2006).
[27] H. A. Baghdadi, E. C. Jensen, N. Easwar, and S. R. Bhatia, “Evidence of re-entrant behavior in laponite - poly(ethylene oxide) systems”, Rheologica Acta47, pp. 121–127 (2008).
[28] H. Tanaka, J. Meunier, and D. Bonn, “Nonergodic states of charged colloidalsuspensions: Repulsive and attractive glasses and gels”, Physical Review E 69,pp. 031404 (2004).
[29] J. Keddie and A. F Routh, Fundamentals of latex film formation, Springer(2010).
[30] I. Nikiforow, J. Adams, A. M. Konig, A. Langhoff, K. Pohl, A. Turshatov, andD. Johannsmann, “Self-stratification during film formation from latex blendsdriven by differences in collective diffusivity”, Langmuir 26, pp. 13162–13167(2010).
[31] H. Luo, C.M. Cardinal, L.E. Scriven, and L.F. Francis, “Ceramic nanoparti-cle/monodisperse latex coatings”, Langmuir 24, pp. 5552–5561 (2008).
[32] O. Vorobyova and M. A. Winnik, “Morphology of poly(2 ethylhexyl methacry-late) : Poly(butyl methacrylate) latex blend films”, Macromolecules 34, pp.2298–2314 (2001).
[33] A. Du Chesne, B. Gerharz, and G. Lieser, “The segregation of surfactant uponfilm formation of latex dispersions : An investigation by energy filtering trans-mission electron microscopy”, Polymer International 43, pp. 187–196 (1997).
[34] V. R. Gundabala, W. B. Zimmerman, and A. F. Routh, “A model for surfactantdistribution in latex coatings”, Langmuir 20, pp. 8721–8727 (2004).
[35] W. P. Lee, V. R. Gundabala, B. Akpa, M. L. Johns, C. Jeynes, and A. F.Routh, “Distribution of surfactants in latex films : Rutherford backscatteringstudy”, Langmuir 22, pp. 5314–5320 (2006).
[36] D. J. Harris, H. Hu, J. C. Conrad, and J. A. Lewis, “Patterning colloidal filmsvia evaporative lithography”, Physical Review Letters 98, pp. 148301 (2007).
[37] D. J. Harris and J. A. Lewis, “Marangoni effects on evaporative lithographicpatterning of colloidal films”, Langmuir 24, pp. 3681–3685 (2008).
[38] J. L. Keddie, “Film formation of latex”, Materials Science and EngineeringR-Reports 21, pp. 101–170 (1997).
99

[39] S. Kiil, “Drying of latex films and coatings : Reconsidering the fundamentalmechanisms”, Progress in Organic Coatings 57, pp. 236–250 (2006).
[40] A. F. Routh and W. B. Russel, “Horizontal drying fronts during solvent evap-oration from latex films”, AIChE Journal 44, pp. 236–250 (1998).
[41] A. F. Routh and W. B. Russel, “A process model for latex film formation :Limiting regimes for individual driving forces”, Langmuir 15, pp. 7762–7773(1999).
[42] A. F. Routh and W. B. Russel, “Deformation mechanisms during latex filmformation : experimental evidence”, Industrial and Engineering ChemistryResearch 40, pp. 4302–4308 (2001).
[43] A. F. Routh and W. B. Zimmerman, “Distribution of particles during sol-vent evaporation from films”, Chemical Engineering Science 59, pp. 2961–2968(2004).
[44] R. E. Trueman, E. L. Domingues, S. N. Emmett, M. Murray, and A. F. Routh,“Auto-stratification in drying colloidal dispersions: A diffusive model”, Journalof Colloid and Interface Science 377, pp. 207–212 (2012).
[45] J. L. Lebowitz and S. Rowlinson, “Thermodynamic properties of mixtures ofhard spheres”, Journal of Chemical Physics 41, pp. 133–138 (1964).
[46] R. E. Trueman, E. L. Domingues, S. N. Emmett, M. Murray, and A. F.Routh, “Autostratification in drying colloidal dispersions: Experimental in-vestigations”, Langmuir 28, pp. 3420–3428 (2012).
[47] A. K. Atmuri, S. R. Bhatia, and A. F. Routh, “Auto-stratification in dryingcolloidal dispersions: Effect of particle interactions”, Langmuir 28, pp. 2652–2658 (2012).
[48] R. G. Avery and J. D. F. Ramsay, “Colloidal properties of synthetic hectoriteclay dispersions”, Journal of Colloid and Interface Science 109, pp. 448–454(1986).
[49] Y. Mori, K. Togashi, and K. Nakamura, “Colloidal properties of synthetichectorite clay dispersion measured by dynamic light scattering and small anglex-ray scattering”, Advance Powder Technology 12, pp. 45–59 (2001).
[50] S. Bhatia, J. Barker, and A. Mourchid, “Scattering of disk like particle suspen-sions: evidence for repulsive interactions and large length scale structure fromstatic light scattering and ultra-small-angle-neutron-scattering”, Langmuir 19,pp. 532–535 (2001).
[51] D. Bonn, H. Kellay, H. Tanaka, G. Wegdam, and J. Meunier, “Laponite: whatis the difference between gel and a glass?”, Langmuir 15, pp. 7534–7536 (1999).
100

[52] D. Bonn, H. Tanaka, G. Wegdam, H. Kellay, and J. Meunier, “Aging of acolloidal ”wigner” glass”, Europhysics Letters 45, pp. 52–57 (1999b).
[53] B. Ruzicka and E. Zaccarelli, “A fresh look at laponite phase diagram”, SoftMatter 7, pp. 1268–1286 (2011).
[54] M. Bellour, J. L. Knaebel, A. Harden, F. Lequeux, and J. P. Munch, “Agingprocesses and scale dependence in soft glassy colloidal suspensions.”, PhysicalReview E 67, pp. 031405 (2003).
[55] R. Bandyopadhyay, D. Liang, H. Yardimci, D. A. Sessoms, M. A. Borthwick,S. G. J. Mochrie, J. L. Harden, and R. L. Leheny, “Evolution of particle-scaledynamics in an aging clay suspension”, Physical Review Letters 93, pp. 228302(2004).
[56] T. Nicolai and S. Cocard, “Structure of gels and aggregates of disk-like colloids”,European Physical Journal 5, pp. 221–227 (2001).
[57] M. Kroon, G. H. Wegdam, and R. Sprik, “Dynamic light scattering studies onthe sol-gel transition of a suspension of anisotropic colloidal particles”, PhysicalReview E 54, pp. 6541–6549 (1996).
[58] S. Jabbari-Farouji, G. Wegdam, and D. Bonn, “Gels and glasses in a singlesystem: evidence for an intricate free-energy landscape of glassy materials”,Physical Review Letters 99, pp. 065701 (2007).
[59] H. Tanaka, S. Jabbari-Farouji, J. Meunier, and D. Bonn, “Kinetics of ergodic-to-nonergodic transitions in charged colloidal suspensions: Aging and gelation”,Physical Review E 71, pp. 021402 (2005).
[60] G. R. K. Reddy and Y. M. Joshi, “Ageing under stress and mechanical fragilityof soft solids of laponite”, Journal of Applied Physics 104, pp. 094901 (2008).
[61] G. R. K. Reddy and Y. M. Joshi, “Aging in a colloidal glass in creep flow:Time-stress superposition”, Physical Review E 77, pp. 021501 (2008).
[62] J. Lal and L. Auvray, “Interaction of polymer with discotic clay particles”,Molecular Crystals and Liquid Crystals 356, pp. 503–515 (2001).
[63] A. Nelson and T. Cosgrove, “A small-angle neutron scattering study of adsorbedpoly(ethylene oxide) on laponite”, Langmuir 20, pp. 2298–2304 (2003).
[64] E. Loizou, P. Butler, L. Porcar, E. Kesselman, Y. Talmon, A. Dundigalla, andG. Schmidt, “Large scale structures in nanocomposite hydrogels”, Macro-molecules 38, pp. 2047–2049 (2005).
[65] G. Schmidt, A. I. Nakatani, P. D. Butler, and C. C. Han, “Small-angle neutronscattering from viscoelastic polymer-clay solutions”, Macromolecules 35, pp.4725–4732 (2002).
101

[66] D. C. Pozzo and L. M. Walker, “Reversible shear gelation of clay-polymerdispersions”, Colloids and Surfaces A 240, pp. 187–198 (2004).
[67] J. Zebrowski, V. Prasad, W. Zhang, L. M. Walker, and D. A. Weitz, “Shearinduced gelation of laponite - poly(ethylene oxide) mixtures”, Colloids andSurfaces A 213, pp. 189–197 (2003).
[68] L. Zulian, B. Ruzicka, and G. Ruocco, “Influence of an adsorbing polymer onthe aging dynamics of laponite clay suspensions”, Philosophical Magazine 88,pp. 4213–4221 (2008).
[69] H. A. Baghdadi, H. Sardinha, and S. R. Bhatia, “Rheology and gelation kineticsin laponite dispersions containing poly(ethylene oxide)”, Journal of PolymerScience, Part B 43, pp. 233–240 (2005).
[70] W. V. Megen and S. M. Underwood, “Glass transition in colloidal hard spheres:Measurement and mode-coupling-theory analysis of the coherent intermediatescattering function”, Physical Review E 49, pp. 4206 (1994).
[71] A. M. Kulkarni, N. M. Dixit, and C. F. Zukoski, “Ergodic and non-ergodicphase transitions in globular protein suspensions”, Faraday Discussions 123,pp. 37–50 (2003).
[72] K. N. Pham, G. Petekidis, D. Vlassopoulos, S. U. Egelhaaf, W. C. K. Poon, andP. N. Pusey, “Yielding behavior of repulsion and attraction dominated colloidalglasses”, Journal of Rheology 52, pp. 649–676 (2008).
[73] Y. M. Joshi, “A model for cage formation in colloidal suspension of laponite”,Journal of Chemical Physics 127, pp. 081102 (2007).
[74] S. Jabbari-Farouji, H. Tanaka, G. Wegdam, and D. Bonn, “Multiple nonergodicdisordered states in laponite suspensions: A phase diagram”, Physical ReviewE 78, pp. 061405 (2008).
[75] Z. Fu and M. M. Santore, “Kinetics of competitive adsorption of poly(ethyleneoxide) chains with different molecular weights”, Macromolecules 31, pp. 7014–7022 (1998).
[76] E. Mubarekyan and M. M. Santore, “Influence of molecular weight and layerage on self exchange kinetics for saturated layers of poly(ethylene oxide) in agood solvent”, Macromolecules 34, pp. 4978–4986 (2001).
[77] A. Knaebel, M. Bellour, J. P. Munch, V. Viasnoff, F. Lequeux, and J. L. Harden,“Aging behavior of laponite clay particle suspensions”, Europhysics Letters 52,pp. 73–79 (2000).
[78] W. X. Sun, Y. R. Yang, T. Wang, H. H. Huang, X. X. Liu, and Z. Tong, “Effectof adsorbed poly(ethylene glycol) on the gelation evolution of laponite suspen-sions: Aging time-polymer concentration superposition”, Journal of Colloidand Interface Science 376, pp. 76–82 (2012).
102

[79] L. Bippus, M. Jaber, and B. Lebeau, “Laponite and hybrid surfactant/laponiteparticles processed as spheres by spray-drying”, New Journal of Chemistry 33,pp. 1116–1126 (2009).
[80] H. Shin, G. M. Grason, and C. D. Santangelo, “Mesophases of soft-sphereaggregates”, Soft Matter 5, pp. 3629–3638 (2009).
[81] A. J. Turner, S. Nair, Z. Lai, C-M. Cheng, and S. R. Bhatia, “Controlledaggregation of colloidal particles for toner applications”, Journal of AppliedPolymer Science 122, pp. 1358–1363 (2011).
[82] L. L. Ma. et al., “Small multifunctional nanoclusters (nanoroses) for targetedcellular imaging and therapy”, ACS Nano 3, pp. 2686–2696 (2009).
[83] S. Tang, X. Wang, J. Lei, Z. Hu, S. Deng, and H. Ju, “Pt-dispersed flower-likecarbon nano sheet aggregation for low-over potential electrochemical biosens-ing”, Biosensors and Bioelectronics 26, pp. 432–436 (2010).
[84] Y. H. Kim, S. H. Gihm, C. R. Park, K. Y. Lee, T. W. Kim, I. C Kwon,H. Chung, and S. Y Jeong, “Structural characteristics of size-controlled self-aggregates of deoxycholic acid-modified chitosan and their application as a dnadelivery carrier”, Bioconjugate Chemistry 12, pp. 932–938 (2001).
[85] S. Zhang, J. Lee, and S. Sun, “Controlled synthesis of monodisperse magneticnanoparticles in solution phase”, The Open Surface Science Journal 4, pp.26–34 (2012).
[86] N. Osterman, D. Babic, I. Poberaj, J. Dobnikar, and P. Ziherl, “Observationof condensed phases of quasiplanar core- softened colloids”, Physical ReviewLetters 99, pp. 248301 (2007).
[87] K. Larson-Smith and D.C. Pozzo, “Scalable synthesis of self-assemblingnanoparticle clusters based on controlled steric interactions”, Soft Matter 7,pp. 5339–5347 (2011).
[88] B. Ruzicka, L. Zulian, and G. Ruocco, “Routes to gelation in a clay suspension”,Physical Review Letters 93, pp. 258301 (2004a).
[89] B. Ruzicka, L. Zulian, and G. Ruocco, “Ageing dynamics in laponite dispersionsat various salt concentrations”, Philosophical Magazine 87, pp. 449–458 (2007).
[90] P. Mongondry, T. Nicolai, and J. F. Tassin, “Influence of pyrophosphate orpolyethylene oxide on the aggregation and gelation of aqueous laponite disper-sions”, Journal of Colloid and Interface Science 275, pp. 191–196 (2004).
[91] J. Labanda and J. Llorens, “Rheology of laponite colloidal dispersions modifiedby sodium polyacrylates.”, Colloids and Surfaces A 249, pp. 127–129 (2004).
103

[92] J. Labanda and J. Llorens, “Influence of sodium polyacrylate on the rheologyof aqueous laponite dispersions”, Journal of Colloid and Interface Science 289,pp. 86–93 (2005).
[93] J. Labanda, J. Sabate, and J. Llorens, “Rheology changes of laponite aqueousdispersions due to the addition of sodium polyacrylates of different molecularweights”, Colloids and Surfaces A 301, pp. 8–15 (2007).
[94] A. Shahin and Y. M. Joshi, “Hyper-aging dynamics of nano-clay suspension”,Langmuir 28, pp. 5826–5833 (2012).
[95] A. K. Atmuri, G. A. Plakaris, S. Kishore, and S. R. Bhatia, “A re-entrantglass transition in colloidal disks with adsorbing polymer”, Soft Matter 8, pp.8965–8971 (2012).
[96] G. Foffi, E. Zaccarelli, S. Buldyrev, F. Sciortino, and P. Tartaglia, “Agingin short-ranged attractive colloids: A numerical study”, Journal of ChemicalPhysics 120, pp. 8824–8830 (2004).
[97] A. M. Puertas, M. Fuchs, and M. E. Cates, “Aging in attraction-driven colloidalglasses”, Physical Review E 75, pp. 031401 (2007).
[98] A. Mourchid, E. Lecolier, H. Van Damme, and P. Levitz, “On viscoelastic,birefringent, and swelling properties of laponite clay suspensions: Revisitedphase diagram”, Langmuir 14, pp. 4718–4723 (1998).
[99] R. Amal, J. R Coury, J. A. Raper, W.P. Walsh, and T.D. Waite, “Structureand kinetics of aggregating colloidal haematite”, Colloids and Surfaces A 46,pp. 1–19 (1990).
[100] A. D. Karathanasis and D. M. C. Johnson, “Stability and transportabilityof biosolid colloids through undisturbed soil monoliths”, Geodarma 130, pp.334–345 (2006).
[101] A. Pinotti, A. Bevilacqua, and N. Zaritzky, “Optimization of the flocculationstage in a model system of a food emulsion waste using chitosan as polyelec-trolyte”, Journal of Food Engineering 32, pp. 69–81 (1997).
[102] P. Ding, A. W. Pacek, K. Abinhava, S. Pickard, M.R. Edwards, and A. W.Nienow, “A process for the manufacture of chemically produced toner : Evolu-tion of structure and rheology.”, Industrial and Engineering Chemistry Research44, pp. 6004–6011 (2005).
[103] P. Sandkuhler, J. Sefcik, and M. Morbidelli, “Kinetics of aggregation and gelformation in concentrated polystyrene colloids”, Journal of Physical ChemistryB 108, pp. 20105–20121 (2004).
104

[104] P. Sandkuhler, J. Sefcik, and M. Morbidelli, “Kinetics of gel formation in dilutedispersions with strong attractive particle interactions”, Advances in Colloidand Interface Science 108-109, pp. 133–143 (2004).
[105] A. K. Atmuri and S. R. Bhatia, “Polymer-mediated clustering of chargedanisotropic colloids”, submitted to Langmuir (2012).
[106] V. Runkana, P. Somasundaran, and P.C. Kapur, “A population balance modelfor flocculation of colloidal suspensions by polymer bridging”, Chemical Engi-neering Science 61, pp. 182 –191 (2006).
[107] J. Sabin, G. Prieto, and F. Sarmiento, “Stable clusters in liposomic systems”,Soft Matter 8, pp. 3212–3222 (2012).
[108] H. A. Zhang, W.Q. Ding, K. Y. Law, and C. Cetinkaya, “Adhesion propertiesof nanoparticle-coated emulsion aggregation toner”, Powder Technology 208,pp. 582–589 (2011).
[109] H. Zhang, W.Q. Ding, and C. Cetinkaya, “Effects of nanoparticle coverage onthe adhesion properties of emulsion aggregation toner particles”, Journal ofImage Science and Technology 54, pp. 1–8 (2010).
[110] X. R. Tong, W. Q. Ding, and C. Cetinkaya, “Effects of nanoparticle coatingon the adhesion of emulsion aggregation toner particles”, Journal of AdhesionScience and Technology 24, pp. 371–387 (2010).
[111] M. Soos, J. Sefcik, and M. Morbidelli, “Investigation of aggregation, breakageand restructuring kinetics of colloidal dispersions in turbulent flows by pop-ulation balance modeling and static light scattering”, Chemical EngineeringScience 61, pp. 2349 –2363 (2006).
[112] M. Kobayashi, T Maekita, Y. Adachi, and H. Sasaki, “Colloid stability andcoagulation rate of polystyrene latex particles in a turbulent flow”, InternationalJournal of Mineral Processing 73, pp. 177–181 (2004).
[113] T. Serra and X. Casamitjana, “Effect of shear and volume fraction on the ag-gregation and breakup of particles”, AIChE Journal 44, pp. 1724–1730 (1998).
[114] P.T. Spicer and S. E. Pratsinis, “Shear induced flocculation : The evolutionof floc structure and the shape of the size distribution at steady state”, WaterResearch 30, pp. 1049–1056 (1996).
[115] P. Ding, A. W. Pacek, K. Abinhava, S. Pickard, M.R. Edwards, and A. W.Nienow, “A process for the manufacture of chemically produced toner (cpt). ii.effect of operating conditions”, Industrial and Engineering Chemistry Research44, pp. 6012–6021 (2005).
105

[116] L. Ehrl, Z. Jia, H. Wu, M. Lattuada, M. Soos, and M. Morbidelli, “Roleof counterion association in colloidal stability”, Langmuir 25, pp. 2696–2702(2009).
[117] Mv. Smoluchowski, “Versuch einer mathematischen theorie der koagulationskinetik kolloider losungen”, Zietschrift fur Physikalische Chemie 92, pp. 129–168 (1917).
[118] S. N. Maindarkar, N. B. Raikar, P. Bongers, and M. A Henson, “Incorporatingemulsion drop coalescence into population balance equation models of highpressure homogenization”, Colloids and Surfaces A 396, pp. 63–73 (2012).
[119] P. Sandkuhler, J. Sefcik, M. Lattuada, H. Wu, and M. Morbidelli, “Model-ing structure effects on aggregation kinetics in colloidal dispersions”, AIChEJournal 49, pp. 1542–1555 (2003).
[120] M. Y. Lin, H. M. Lindsay, R. C. Weitz, D. A. Ball, R. Klein, and P. Meakin,“Universality in colloid aggregation”, Nature 339, pp. 360–362 (1989).
[121] V. Runkana, P. Somasundaran, and P. C. Kapur, “Reaction-limited aggregationin presence of short-range structural forces”, AIChE Journal 51, pp. 1233–1245(2005).
[122] P. Sandkuhler, M. Lattuada, J. Wu, H. Sefcik, and M. Morbidelli, “Furtherinsights into the universality of colloidal aggregation”, Advances in Colloid andInterface Science 113, pp. 65–83 (2005).
[123] Z. Jia, H. Wu, and M. Morbidelli, “Application of the generalized stabilitymodel to polymer colloids stabilized with both mobile and fixed charges”, In-dustrial and Engineering Chemistry Research 46, pp. 5357–5364 (2007).
[124] M. Lattuada, P. Sandkuhler, J. Wu, H. Sefcik, and M. Morbidelli, “Kineticmodeling of aggregation and gel formation in quiescent dispersions of polymercolloids”, Macromolecular Symposia 206, pp. 307–320 (2004).
[125] M. Lattuada, P. Sandkuhler, J. Wu, H. Sefcik, and M. Morbidelli, “Aggrega-tion kinetics of polymer colloids in reaction limited regime: Experiments andsimulations”, Advances in Colloid and Interface Science 103, pp. 33–56 (2003).
[126] E. V. Golikova, Y. M. Chernoberezhskii, V. S. Grigorev, and M. P. Semov, “Ag-gregate stability of the sol prepared from crystalline quartz in aqueous solutionsof potassium chloride”, Glass Physics and Chemistry 32, pp. 646–655 (2006).
[127] J. Groenewold and W. K. Kegel, “Anomalously large equilibrium clusters ofcolloids”, Journal of Physical Chemistry B 105, pp. 11702–11709 (2001).
[128] J. Groenewold and W. K. Kegel, “Colloidal cluster phases, gelation and nuclearmatter”, Journal of Physics Condensed Matter 16, pp. 4877–4886 (2004).
106

[129] A. J. Archer, C. Ionescu, D. Pini, and L. Reatto, “Theory for the phase be-haviour of a colloidal fluid with competing interactions”, Journal of Physics:Condensed Matter 20, pp. 415106 (2008).
[130] A. K. Atmuri, A. Grillo, C-M. Cheng, and S. R. Bhatia, “Controlled aggregationof concentrated colloidal suspensions in a shear environment”, Unpublishedmanuscript (2012).
[131] M. Tourbin and C. Frances, “Experimental characterization and populationbalance modelling of the dense silica suspensions aggregation process”, Chem-ical Engineering Science 63, pp. 5239–5251 (2008).
[132] G. H. Bogush and C. F. Zukoski, “Uniform silica particle precipitation: Anaggregative growth model”, Journal of Colloid and Interface Science 142, pp.19–34 (1991).
[133] S. Kumar and D. Ramkrishna, “On the solution of population balance equationsby discretization-i. a fixed pivot technique”, Chemical Engineering Science 51,pp. 1311–1332 (1996).
[134] N. B. Raikar, S. R. Bhatia, M. F. Malone, and M. A. Henson, “Experimentalstudies and population balance equation models for breakage prediction of emul-sion drop size distributions”, Chemical Engineering Science 64, pp. 2433–2337(2009).
[135] A. Furukawa and H. Tanaka, “Key role of hydrodynamic interactions in colloidalgelation”, Physical Review Letters 104, pp. 245702 (2010).
[136] X. J. Cao, H.Z. Cummins, and J. F. Morris, “Hydrodynamic and interparticlepotential effects on aggregation of colloidal particles”, Journal of Colloid andInterface Science 368, pp. 86–96 (2012).
107