Embed Size (px)
Citation preview

Spray formation under the effect of micro scale cavitation
and its biomedical applications
by
Taher Abbasiasl
Submitted to the Graduate School of Natural Science and Engineering
In partial fulfillment of the requirement for the degree of
Master of Science
Sabanci University
December 2020

Spray formation under the effect of micro scale cavitation and its
biomedical applications
APPROVED BY:
DATE OF APPROVAL: 25/12/2020

© Taher Abbasiasl 2020
All Right Reserved

iv
ABSTRACT
Spray formation under the effect of micro scale cavitation and its
biomedical applications
TAHER ABBASIASL
Mechatronics Engineering, M.Sc. Thesis, December 2020
Thesis Supervisor: Prof. Ali Koşar & Dr. Morteza Ghorbani
Keywords: Hydrodynamic Cavitation, Spray Atomization, PVA MBs, Biomedical Treatment,
Cancer Tissue
Hydrodynamic cavitation is characterized by the formation of bubbles inside the flow due to
local reduction of pressure below the vapor saturation pressure, growth, and violent collapse of
bubbles leading to a huge amount of released energy. This energy is extensively studied and
implemented in different fields, namely, surface cleaning, heat transfer enhancement, food
industry, wastewater treatment, and chemical reactions. It is experimentally proven that
hydrodynamic cavitation inside the nozzle enhances the atomization characteristics of the
emerging spray. In this study, cavitating flows inside a transparent cylindrical nozzle with an inner
diameter of 0.9 mm were visualized, and the effect of cavitation on atomization characteristics of
emerging sprays was investigated by processing the captured images using a developed in-house
code, the effect of cavitation on spray characteristics was investigated. By changing the working
fluid from water to poly(vinyl alcohol) microbubbles (PVA MBs) suspension and roughening the
inner wall of the nozzle, we were able to reduce the required injection pressure for cavitation
inception. Moreover, the atomization characteristics of the emerging jet was enhanced
considerably. A cystoscope, which houses a cavitation probe to exploit the energy released during

v
cavitation bubble collapse for the treatment of urinary stones and cancer tissues, was designed and
fabricated. The developed biomedical device utilizes a novel control system to locate the precise
region and apply the cavitating flow. In vitro experiments showed that the device possesses a high
capability of locating and ablating cancer tissues.

vi
ÖZET
Mikro ölçekli kavitasyon etkisi altında sprey oluşumu ve biyomedikal
uygulamaları
TAHER ABBASIASL
Mekatronik Mühendisliği YÜKSEK LİSANS TEZİ, Aralık 2020
Tez Danışmanı: Prof. Dr. Ali Koşar & Dr. Morteza Ghorbani
Anahtar Kelimeler: Hidrodinamik kavitasyon, Sprey Atomizasyon, PVA MB’ler,
Biyomedikal Tedavi, kanser dokusu
Hidrodinamik kavitasyon, basıncın buhar doyma basıncının altına indirilmesi nedeniyle akış
içinde kabarcıkların oluşması, büyümesi ve kabarcıkların şiddetli şekilde çökerek büyük bir
enerjinin açığa çıkması ile karakterize edilir. Kabarcıkların çökmesiyle oluşan oluşan bu enerji,
yüzey temizleme, ısı transferini iyileştirme, gıda endüstrisi, atık su arıtma ve kimyasal reaksiyonlar
gibi farklı alanlarda kapsamlı bir şekilde incelenir ve uygulanır. Nozül içindeki hidrodinamik
kavitasyonun, ortaya çıkan spreyin atomizasyon özelliklerini geliştirdiği deneysel olarak
kanıtlanmıştır. Bu çalışmada, iç çapı 0.9 mm olan şeffaf silindirik bir nozül içindeki kavitasyonlu
akışlar görselleştirilmiş ve ortaya çıkan spreylerin atomizasyon özelliklerine kavitasyonun etkisi
araştırılmıştır. Geliştirdiğimiz bir kod ile görüntü işlemeyi kullanarak, kavitasyonun sprey
özellikleri üzerindeki etkisi incelenmiştir. Çalışma sıvısını su yerine poli(vinil alkol) mikro
kabarcıklar (PVA MB’ler) süspansiyonu kullanarak ve nozülün iç duvarını pürüzlendirerek,
kavitasyon başlangıcı için gerekli enjeksiyon basıncı azaltabilmiştir. Ayrıca, ortaya çıkan jetin
atomizasyon özellikleri önemli ölçüde geliştirilmiştir. İdrar taşlarının ve kanser dokularının
tedavisi için kavitasyon kabarcıklarının çökmesi sırasında açığa çıkan enerjiden yararlanmak için
bir kavitasyon sondası barındıran bir sistoskop tasarlanmış ve üretilmiştir. Geliştirilen biyomedikal

vii
cihaz, hassas bölgeyi bulmak ve kavitasyon akışını uygulamak için yeni bir kontrol sistemi
kullanmıştır. In vitro deneyler, cihazın kanser dokularını tespit etme ve tahrip etme konusunda
yüksek bir kapasiteye sahip olduğunu göstermiştir.

viii
ACKNOWLEDGEMENTS
I would like to thank my beloved family for their unconditional love and support through this
process. Copping and overcoming the multiple academic obstacles would not be possible without
their mental support.
I want to thank Professor Ali Koşar and Dr. Morteza Ghorbani for offering their unlimited
support guidance, and sharing their valuable experiences and knowledge during my masters.
Finally, a special thanks to all my friends and colleagues, who were always there for me through
up and downs.
This work was supported by TUBITAK (The Scientific and Technological Research Council
of Turkey) Support Program for Scientific and Technological Research Project (Grant Nos.
118S040 and 217M869) and the Sabanci University Internal Project Grant (Grant No. I.A.CF-18-
01877). Equipment utilization support from the Sabanci University Nanotechnology Research and
Applications Center (SUNUM) is gratefully appreciated.

ix
This thesis is dedicated to my beloved family

TABLE OF CONTENTS
LIST OF FIGURES .......................................................................................................... xii
LIST OF TABLES ............................................................................................................ xv
1 CHAPTER ONE: INTRODUCTION ...................................................... 1
1.1 Overview of hydrodynamic cavitation .................................................................. 1
1.2 Effect of cavitation on spray atomization characteristics in micro scale .............. 1
1.3 Cavitation-based devices for biomedical treatment .............................................. 4
2 CHAPTER TWO: EXPERIMENTAL APPARATUS AND
PROCEDURE ....................................................................................................... 7
2.1 Cavitation visualization and spray characterization .............................................. 7
2.1.1 Experimental setup ........................................................................................... 7
2.1.2 Surface modification ........................................................................................ 9
2.1.3 Protocol for PVA MBs fabrication ................................................................ 10
2.1.4 Experimental procedure ................................................................................. 11
2.2 Design and fabrication of cystoscope and cavitation probe ................................ 12
2.2.1 Experimental setup ......................................................................................... 13
2.2.2 Control system design .................................................................................... 16
2.2.3 Experimental procedure for tissue experiments ............................................. 17
2.2.4 Tissue preparation .......................................................................................... 19
3 CHAPTER THREE: THEORY, NUMERICAL MODELING, AND
IMAGE PROCESSING .....................................................................................21
3.1 Flow inside the cavitation probe ......................................................................... 21
3.2 Numerical Modelling .......................................................................................... 22

3.2.1 Physical model and mesh generation: ............................................................ 22
3.2.2 Numerical approach: ...................................................................................... 22
3.3 Image processing ................................................................................................. 24
4 CHAPTER THREE: RESULTS AND DISCUSSION .........................27
4.1 Effect of intensified cavitation on spray atomization characteristics in microscale
27
4.1.1 Flow regimes .................................................................................................. 27
4.1.2 Spray cone angle ............................................................................................ 30
4.1.3 Atomization and droplet size distribution ...................................................... 32
4.1.4 Droplet velocity distribution .......................................................................... 36
4.2 Tissue ablation using the developed biomedical device ..................................... 40
4.2.1 Numerical analysis ......................................................................................... 40
4.2.2 Hydraulic characterization of the cavitation probe ........................................ 42
4.2.3 Tissue experiments ......................................................................................... 44
5 CHAPTER FOUR: CONCLUSIONS ....................................................47
5.1 Effect of intensified cavitation on spray characterization ................................... 47
5.2 Fabrication of a cystoscope for biomedical treatment of urinary stones and cancer
tissues 48
5.3 Future research directions ................................................................................... 48
BIBLIOGRAPHY ............................................................................................................. 50

xii
LIST OF FIGURES
Figure 2.1. Schematic of the experimental setup. ...................................................................... 8
Figure 2.2. Schematic of the test nozzle. ................................................................................... 8
Figure 2.3. SEM image of the layer-by-layer assembled surface on a quartz plate. ................ 10
Figure 2.4. Schematic of the cavitation-based device for biomedical treatment. .................... 13
Figure 2.5. Final design of the cavitation-based device for medical treatment. The blue arrow
shows the direction of the liquid inside the hydrodynamic cavitation section of the device. ....... 14
Figure 2.6. Detailed schematic and information about (a) Cavitation probe, (b) main probe. 14
Figure 2.7. Final device after assembly. (a) Overall system with every section included, (b)
Main probe head, (c) Cavitation stage with seven holes corresponding to the seven pieces inserted
in the main probe, (d) Servo motors used for the control of probe direction, and (e) Linear actuator
used for moving the probe forward and backward. ...................................................................... 17
Figure 2.8. Design of visualization chamber and the stage used for tissue ablating experiments.
....................................................................................................................................................... 19
Figure 2.9. Prostate (left) and bladder (right) cancer mouse model......................................... 19
Figure 3.1. The geometry used for numerical modeling. (a) 2D physical model, (b) Mesh
generation. ..................................................................................................................................... 22
Figure 3.2. Position of the window used for spray visualization during droplet measurements.
....................................................................................................................................................... 25
Figure 3.3. Location of two different droplets in two successive frames: (a) frame 1, (b) frame
2 (D1: droplet 1, D2: droplet 2). Note: The time difference between the frames is approximately
41.5 µs. .......................................................................................................................................... 25
Figure 3.4. Spray cone angle (θ). ............................................................................................. 26
Figure 4.1. Cavitating flow development inside the circular transparent quartz tube with a
nozzle diameter of 0.9 mm for water. ........................................................................................... 28

xiii
Figure 4.2. Different flow regimes and flow rate in the nozzle at different injection pressures.
....................................................................................................................................................... 29
Figure 4.3. Cavitating flow development inside the circular transparent quartz tube with a
nozzle diameter of 0.9 mm with roughened surface for working fluid of PVA MBs suspension. 30
Figure 4.4. Measured cone angles. ........................................................................................... 32
Figure 4.5. Droplet recognition during the image processing using MATLABTM 2018a
software. (a) Raw image, (b) Threshold image, (C) Final processed image with boundaries for each
recognized image. ......................................................................................................................... 33
Figure 4.6. Effect of cavitation on total counted droplets. ....................................................... 34
Figure 4.7. Effect of cavitation on droplet size distribution. ................................................... 35
Figure 4.8. Effect of cavitation on overall SMD. ..................................................................... 36
Figure 4.9. Raw and processed images to locate the droplets on two successive frames. (a) and
(b): raw images, (c) and (d): respected processed images. ........................................................... 37
Figure 4.10. Velocity distribution of the departed droplets from the water jet immediately before
and during cavitating flow inside the nozzle. ............................................................................... 38
Figure 4.11. Velocity distribution of the departed droplets from the PVA MBs suspension jet
immediately before and during cavitating flow inside the roughened nozzle. ............................. 39
Figure 4.12. Comparison between numerical and experimental results for: (a) Flowrate and (b)
Discharge coefficient. ................................................................................................................... 41
Figure 4.13. Variation of cavitation number with respect to the injection pressure. ............... 42
Figure 4.14. Discharge coefficient against the cavitation number. .......................................... 42
Figure 4.15. Exposing the cancer tissues to cavitating jet: (right) the interaction between
cavitating jet and cancer tissues, (left) created shockwave and micro-jet during cavitation bubble
collapse. ........................................................................................................................................ 44
Figure 4.16. Effect of hydrodynamic cavitation on mice prostate and bladder tumor tissues.
Tissues were exposed for 5, 10 and 15 min to hydrodynamic cavitation produced by 1034 kPa
injection pressure, then stained with DAPI (upper panel), Calcein/PI (lower panel). Non-exposed

xiv
counterpart of tissues was used as control. Similar results were obtained in four independent
experiments. .................................................................................................................................. 46
Figure 5.1. Testing the diameter of the probe and capability of control system in penetrating
and advancing into the urinary system of pig. .............................................................................. 49

xv
LIST OF TABLES
Table 2.1. Detailed specifications of the test nozzle. ................................................................. 9
Table 2.2. The AFM results of smooth and modified surfaces. (Superscripts: 1. Height
difference between maximum and minimum, 2. Surface area difference between actual and
projected surface, 3. Root mean square roughness of surface, 4. An arithmetic average of the
absolute values of the roughness). ................................................................................................ 10
Table 2.3. Physical properties of the working fluid. ................................................................ 12
Table 2.4. Specifications of FISBA FISCam biomedical camera. ........................................... 15
Table 4.1. Comparison in the injection pressures for the different flow regimes. ................... 30
Table 4.2. Selected pressures to capture the images of the spray for droplet size and velocity
determination. ............................................................................................................................... 33
Table 4.3. Comparison of numerical results for different grids for injection pressure of 1034
kPa................................................................................................................................................. 40

1
1 CHAPTER ONE: INTRODUCTION
1.1 Overview of hydrodynamic cavitation
The progressive cycle of bubble formation, growth, and violent implosion of the bubbles inside
a liquid medium is called hydrodynamic cavitation. When the local static pressure of liquid falls
below the saturation vapor pressure at a roughly constant temperature, the rupture of liquid occurs
and hydrodynamic cavitation bubbles are formed [1–3]. Cavitation bubble collapse leads to
significant rise in pressure (20-30000 bars) and temperature (2000-5000 K) in the vicinity of
cavitation bubbles, and the energy density of released energy could reach as high as 1018 kW/m3
[3,4]. Destructive aspects of hydrodynamic cavitation including flow choking, serious damage to
turbomachinery systems, and lowering the energy efficiency raises serious concerns and offers a
hot topic being widely investigated by numerous researchers [1,2,5].
1.2 Effect of cavitation on spray atomization characteristics in micro scale
The cavitation phenomenon results in phase change inside liquid and formation of several
bubbles, and it has significant effects on many processes such as atomization and break-up of
liquid jet [6]. Understanding the behavior of cavitating flow regimes in micro scale is a challenging
task, and the amount of related data in the literature is not as abundant as that corresponding to
macro or mini scale. In this regard, Mishra and Peles [7] experimentally investigated
hydrodynamic cavitation in a short microchannel, and they showed that cavitation phenomenon
was different in micro scale. There are also some numerical studies about cavitating flows in micro
scale [8,9]. The collapse of cavitation bubbles at the outlet of nozzle enhances spray atomization.
Therefore, researchers attempt to move the cavitation bubbles to the end of the nozzle to reduce
the length of liquid jet just after the nozzle. According to the studies by Payri and co-workers,
cavitating flows lead to a rise in spray cone angle as well as in the speed of the injected flow
[10,11]. During the past decade, several studies have focused on the cavitation phenomenon inside
transparent nozzles and its impact on spray characteristics [12–15]. As an example, Suh et al. [16]
investigated the impact of cavitation on diesel fuel atomization in 2D transparent acrylic resin
nozzles with different length to width ratios. They studied the flow inside the nozzle and the spray

2
morphology under different experimental conditions. There are other similar studies on the
importance of cavitation and its effect on spray characteristics [12,17].
To be able to exploit the effect of cavitation on spray formation, it is crucial to have a better
understanding about the atomization quality, droplet size, cone angle, and other important
parameters of the spray. For this purpose, several experimental and numerical studies have
concentrated on the effect of cavitating flows on spray formation over a wide variety of operating
conditions [18–21]. In this regard, Nurick [22] proposed an experimental model to explain the
behavior of discharge coefficient within sharp-edged circular and rectangular orifices. The mixing
uniformity of spray was established at different conditions, during cavitating and non-cavitating
flows. Cavitation was shown to reduce the mixing uniformity for circular orifice elements. Since
most of the atomization nozzles are of micro or mini scale (tens to several hundred micrometers),
it is a challenging task to optically investigate cavitating flows inside the nozzle and its effect on
the spray. As a result, there are numerous numerical studies on cavitating flows in nozzles and its
impact on the atomization quality of sprays. Örley et al. [23] performed a large eddy simulation of
cavitating flows inside rectangular nozzles. They did their numerical study based on the
experimental configuration of Sou et al. [17]. There was a good agreement between the simulation
and experimental results. According to the numerical results, the main mechanisms, which
promote primary break-up, are turbulent fluctuations caused by the collapse of cavitation bubbles
near the nozzle exit, gas entrainment into the nozzle, and collapse events inside the liquid jet
adjacent to the liquid gas interface.
Most of the experimental studies focusing on the effect of cavitating flows on jet atomization
and spray characteristics have utilized 2D rectangular nozzles so that they could allow
visualization of cavitating flows inside nozzles. As a result, there is still a considerable lack of
information about the influence of cavitation inside 3D nozzles (e.g., cylindrical nozzles) on spray
formation. Some studies employed nozzles with circular cross sections to investigate different
stages of cavitation development inside the nozzle. However, they did not offer any noticeable
information about the atomization features of sprays [14,24].
The majority of studies on the transition from liquid jet to spray with separated droplets
considered flow regimes inside macro scale nozzles to examine the impact of cavitation on the
spray performance [12,16,17,24–26], while the number of studies focusing on the effect of
cavitating flows inside micro-nozzles on spray properties are rather scarce [15,19,27]. Besides, in

3
most of investigations on spray behavior in micro scale, there are limited visualization efforts for
observing the development of cavitating flows inside nozzles, and the captured images are not very
clear to distinguish different stages of cavitation and its effect on liquid jets and atomization of
sprays [27–30].
In order to intensify cavitating flows of water inside nozzles and to reduce the required injection
pressure for cavitation inception, some studies proposed roughened surfaces [31] and droplets [32]
or microbubbles [31] in the working fluid. Aghdam et al. [33] modified the inner surface of
microchannels using layer-by-layer assembled SLIPS. This technique of surface modification
reduced the inception pressure greatly. Moreover, in the roughened microchannel, supercavitation
conditions could be achieved for all the microchannels at lower upstream pressure, whereas, for
the non-roughened surfaces supercavitation conditions did not occur for a number of
microchannels in the same range of upstream pressures. Ghorbani et al. [31] implemented both
roughened microchannels and microbubbles (poly(vinyl alcohol) microbubbles) for the purpose of
intensifying cavitation conditions and lowering the required pressure for cavitation inception and
they achieved promising results in this regard.
Even though the dominant role of supercavitation in changing the flow regimes inside
micro/macro channels has been already shown [17,24,34], there is still lack of information about
the effect of supercavitation on sprays. For example, while Suh et al. [16] compared atomization
characteristics of sprays in cavitating and turbulent flows, the effect of supercavitation was not
discussed in that study. There are some studies addressing the impact of supercavitation on sprays;
however, they did not offer detailed data related to droplet count, size distribution and velocity
[9,12]. In their study, Li et al. [35] investigated the effect of cavitating flows inside a micro size
single-hole diesel injector on sprays, nevertheless, they did not provide sufficient information
about atomization characteristics.
In the first part of this thesis, cavitating flows inside a micro-nozzle made of transparent quartz
are visualized, and the effect of cavitation on emerging spray is investigated in terms of
atomization characteristics and velocity of the departed droplets. Then, inspired by the above-
mentioned studies, water suspensions of poly(vinyl alcohol) microbubbles (PVA MBs) are
employed as another working fluid to study the effect of intensified cavitation on the properties of
the spray. This study illustrates the potential of PVA MBs as cheap, stable, chemically versatile,
and non-toxic suspensions in spray atomization. Moreover, the inner surface of the nozzle is also

4
roughened to further intensify cavitation and to lower the required injection pressure for cavitation
inception. Enhanced atomization characteristics of the spray are achieved as a result of cavitating
flows and by using PVA MBs suspension inside the nozzle with surface roughness enhanced
cavitation. The dominant role of supercavitation in atomization properties of the emerging spray
is also discussed in detail.
1.3 Cavitation-based devices for biomedical treatment
Even though hydrodynamic cavitation is generally considered as an undesired phenomenon,
destructive nature of the released energy due to the bubbles collapse constitutes an important
research topic, especially for therapeutic and biomedical applications [36–38]. This energy could
be exploited in many applications such pharmaceutical and food industries [39], heat transfer
[40,41], energy harvesting [42,43], and wastewater treatment [44]. To this end, some attempts have
been made to intensify the hydrodynamic cavitation, which could be highly beneficial for
improving spray atomization in injector nozzles [31,45]. Acoustic cavitation is another type of
cavitation, where the formation and bubble collapse are induced by intense ultrasound irradiation.
Similar to hydrodynamic cavitation, acoustic cavitation has many applications such as food
freezing [46], heat transfer enhancement [47,48], wastewater treatment [49], surface cleaning [50],
and biomedical applications [51,52]. Further details about the applications of hydrodynamic and
acoustic cavitation could be found elsewhere [41,53].
In a general sense, when using acoustic cavitation for biomedical applications, a cavitation
bubble or encapsulated contrast agent bubble is induced by an ultrasonic field. Acoustic streaming,
liquid microjets, and shock waves might result from the ultrasonic field, thereby causing
mechanical damage to the nearby tissues or cells. Acoustic cavitation has been extensively used
for several applications in biomedicine including sonothrombolysis [54], tumor angiogenesis
disruption [55], delivery of various drugs and genetic materials [56], and acoustic cavitation
imaging [57].
Although acoustic cavitation is a non-invasive treatment, some limitations are raised targeting
to an abnormal tissue or kidney stone. To address this issue, phased array probes, which consist of
several small ultrasonic elements, are currently being used [58–60]. However, despite the
relatively good targeting of the location of tissue or other samples, the treatment results in
undesired generated heat, which causes serious side effects of ultrasound treatments such as local

5
pain, stress urinary incontinence, fistula formation, or erectile dysfunction [61]. In addition to the
above-mentioned limitations and side effects, ultrasound treatment should not be applied to certain
parts of the body such as female breasts and eyes [62]. There are several newly-developed methods
to reduce these side effects such as histotripsy, where the collapse of microbubbles, produced by
high-pressure pulses, are responsible for tissue treatment rather than thermal mechanisms [63,64].
HIFU (High Intensity Focused Ultrasound) and histotripsy have been extensively used to develop
several biomedical tools for ablation of benign or malignant tumors localized to various tissues
including liver, prostate, kidney, pancreas, breast and uterus [56]. Lithotripsy is another
ultrasound-based non-invasive method, which offers many benefits when treating renal and
ureteral stones [65], and is being widely used for treatment of solitary, uncomplicated, and small
upper urinary tract calculi. However, this treatment may not be useful for some types of stones
such as brushite and calcium oxalate monohydrate, and incomplete stone breakage may result in
extra clinical treatments on the patients. Moreover, it is proven that the wave exposure during
shock wave lithotripsy (SWL), during which high-energy sound waves with short pulses are
transmitted through the skin to break the kidney stones, could be harmful for the healthy cells
around the kidney stones [66,67]. Employing SWL could pose other side effects like blood vessel
rupture and severe acute renal injury.
HIFU has shown promising non-invasive results in the therapy of malignancies (prostate,
breast, liver, bone, and renal tumor), particularly widespread or inoperable ones. However, the
application of HIFU has its challenges and limitations. To reach the tumors, lungs and bones would
oppose the penetration of ultrasound waves and it could be hard for the beam to reach the tumor.
In addition, gas in the bowel cannot be penetrated by ultrasound, and the waves are reflected back,
leading to tissue damage in their way back [4]. Therefore, there is always room for developing
new approaches and techniques, which could pave the way to more robust and less harmful
technologies and medical apparatus.
Hydrodynamic cavitation could be considered as a cost-effective and energy efficient solution
for both kidney stones treatment and tissue ablation. There are extensive studies on developing
microfluidic devices based on hydrodynamic cavitation as an alternative for acoustic cavitation
[68,69]. As discussed above, the bubbles generated by hydrodynamic cavitation are highly
destructive. If targeted accurately, these cavitation bubbles could be an efficient technique to
destroy urinary stones or abnormal tissue (benign prostate hyperplasia (BPH) or tumor) ablation,

6
with minimal invasion to other parts. As mentioned above, in acoustic cavitation, wave reflection
could lead to serious damage to the healthy tissues. By using hydrodynamic cavitation, this
drawback could be completely eliminated. Moreover, since the employed cavitation probe would
have a very small head (less than a millimeter), it offers very precise locating of the target. In
hydrodynamic cavitation, the ablating bubbles are much more than acoustic cavitation, which
could reduce the treatment time considerably.
A flexible cystoscope prototype was designed and fabricated for the purpose of kidney and
bladder stone treatment, and ablation of tumor tissues, exploiting the energy released from the
bubble implosion in hydrodynamic cavitation. The fabricated cystoscope as a main medical probe
contains a cavitation probe, a hole to insert the biomedical camera, a suction tube section and four
holes housing the control system tendons. The cavitation probe guides the cavitating flow induced
by the restrictive element at the probe head towards the target. Targeting the tissue and the
direction of the probe is controlled via tendon cables inserted in the probe. The prototype is
equipped with a biomedical camera to give the operator visual feedback when locating the target.
It is already shown in our previous studies that hydrodynamic cavitation could successfully destroy
kidney stones and kill cancer cells [36,38]. In this study, the cystoscope was developed to generate
more facile hydrodynamic cavitation bubbles at lower pressures. Moreover, different than the
previous prototype [36], the current one houses a suction tube, and it can be controlled smoothly.
The material used in this cystoscope is biocompatible and the clinical tests will be done as a future
study. Here, we used the designed prototype for ablating of prostate and bladder cancer tumors by
in vitro hydrodynamic cavitation experiments. The device is able to locate the tissue perfectly, and
could expose bubbly flow to the targets for a long time.
Compared to the non-exposed tissues, the device was able to fine-target cavitating flow to the
tissue and to cause significant damage in the tissue within short time. In the light of the results
obtained in this study, the designed biomedical device could successfully use hydrodynamic
cavitation as a promising alternative of acoustic cavitation when treating tumor tissues.

7
2 CHAPTER TWO: EXPERIMENTAL APPARATUS AND PROCEDURE
2.1 Cavitation visualization and spray characterization
In this section, a schematic of the setup used for spray characterization is presented. All the
information regarding the setup along with experimental procedure is thoroughly discussed. The
visualization and image processing methodologies are also presented in detail. The important
parameters affecting the flow regimes inside the nozzle and the emerging jet are included. To
intensify cavitation, the inner wall of the nozzle was roughened and different working fluids were
employed.
2.1.1 Experimental setup
Figure 2.1 shows a schematic of the experimental setup. A high-pressure nitrogen tank was
used to provide the desired injection pressure of the working fluid. A micro-filter was employed
to eliminate the particles larger than 15 μm from the liquid. Pressure gauges were placed at
different locations of the system to monitor the pressure. One pressure gauge was mounted
immediately before the nozzle in order to measure the injection pressure of the working fluid. All
the parts before the transparent tube were made of stainless steel to avoid any chemical reaction
with the working fluid. The nozzle was made of transparent quartz to allow visualization of
cavitating flows inside the nozzle. The geometry of the quartz nozzle is illustrated in Figure 2.2,
and the detailed dimensions of the nozzle are presented in Table 2.1. The inner and outer diameters
of the first part of the nozzle were exactly the same as the stainless-steel tube to have negligible
pressure losses along the experimental setup. Before performing the experiments, in order to
minimize the gas content in the working fluids, degassing was performed by exposing the working
fluids to vacuum conditions. The first part of the quartz tube was long enough to provide sufficient
time for observing the working fluid and make sure there is no undesired disturbance in the
working fluid before entering the nozzle (Figure 2.2). The experiments were conducted at ambient
pressure of 1 atm and temperature of 293 K. Various injection pressures were tested to investigate
the cavitating flow inside the nozzle.
A high-speed camera (Phantom V9.1) was used to capture the real-time images of cavitating
flows as well as liquid jets, and a Veritas miniConstellation 120.28° LED light source was

8
employed as the illumination system. The light source generates white light flashes, and the pulse
duration could be as short as 2 µs with a maximum pulse rate of 100 kHz. The Shadowgraphy
method was implemented to observe the flows inside the transparent nozzle and its effect on the
emerged spray. The high-speed camera was connected to a PC to record the real-time images of
the experiments using PCC software version 3.4.788.0 (AMETEK Inc., Berwyn, PA). The
resolution of the captured images was 1280×800 pixel for cavitation visualization inside the
nozzle. But for the spray studies, the resolution of 192×192 pixel was chosen to be able to capture
the droplets with high velocity as clear as possible. Exposure time was adjusted to the value of 2
µs.
Figure 2.1. Schematic of the experimental setup.
Figure 2.2. Schematic of the test nozzle.

9
Table 2.1. Detailed specifications of the test nozzle. L (Total length of the quartz tube) 6 cm
LN (Length of the nozzle section of the tube) 4 mm
D1 (Outer diameter of the tube) 6.35 mm
D2 (Inner diameter of the upstream section of the tube) 3.05 mm
DN (Inner diameter of the nozzle part of the tube) 0.9 mm
2.1.2 Surface modification
The inner surface of the nozzle part of the tubes was treated to have SLIPS (Slippery Liquid
Induced Porous Surfaces) coatings to enhance cavitating flows and to reduce the probability of the
collapse of the bubbles, which are generated upon cavitation, before leaving the nozzle [33]. For
this purpose, by using the layer-by-layer (LBL) assembly technique, five by layers of positively
charged poly(allylamine hydrochloride), average molecular weight of 50,000 (PAH) and
negatively charged poly(sodium 4-styrenesulfonate), average molecular weight of 70,000 (SPS)
were assembled on the surface of the nozzle and then 10 by layers of PAH polyelectrolyte and
homemade silica nanoparticles with 40 nm and 80 nm in diameter were deposited on the surface
of the nozzle. The LBL assemblies were applied using the fluidic assembly technique as described
in our previous work [32]. The affinity of the surface was modified using 1H,1H,2H,2H-
perfluorodecyltriethoxysilane 97% (PFDTS), which was applied by chemical vaper deposition and
was followed by heat treatment to increase the stability of the fluorinated surface. Finally, the
Slippery Liquid-Infused Porous Surfaces (SLIPS) were formed by entrapping a fluorinated
lubricant within the pores of the assembled surface. The surface modification increases the chance
of the Fomblin YLVAC 25/6, average molecular weight of 3,300 (PFPE) to be trapped within the
pores of the surface. SEM (Scanning Electron Microscopy) image of the LBL assembled surface
on a quartz plate is shown in Figure 2.3. The detailed description of the surface modification
process and achieving SLIPS was described in our previews studies [32,33].
The AFM results of smooth and rough surfaces are reported in Table 2.2. The height difference
between the maximum and minimum points of the rough surface is six times of the smooth ones.
Projected surface shows surface increase due to the increased roughness, which has reached
12.8%. Rq or RMS value of the surface is the highest reported value in the literatures. This value
of the rough surfaces is 30 times more than the smooth ones.

10
Table 2.2. The AFM results of smooth and modified surfaces. (Superscripts: 1. Height
difference between maximum and minimum, 2. Surface area difference between actual and
projected surface, 3. Root mean square roughness of surface, 4. An arithmetic average of the
absolute values of the roughness). Smooth surface Rough surface
Z range1 (nm) 13.2 97.4
Surface %2 0.423 12.8
Rq3 (nm) 0.583 15.3
Ra4 (nm) 0.427 12.2
Figure 2.3. SEM image of the layer-by-layer assembled surface on a quartz plate.
2.1.3 Protocol for PVA MBs fabrication
The fabrication protocol of PVA MBs was described by Cavalieri et al. [70]. 4 g PVA was
dissolved in 200 mL Milliq-water and was heated up to 80 °C. 380 mg NaIO4 was added into the
solution to form telechelic PVA at temperature of 80 °C for 1 h. The telechelic PVA solution was
then cooled down to room temperature. A homogenizer (UltraTurrax, IKA, Königswinter
Germany) equipped with a stainless-steel tip S 25 N - 25 G (UltraTurrax, IKA, Königswinter
Germany) was employed to apply sharing force at the air/water interface of the telechelic PVA
solution to cross-link the telechelic PVA under room temperature for 2 h. The resulting PVA MBs
were harvested and washed for 10 times. The PVA MBs have relatively a narrow size distribution
below 10 µm with the average diameter (normalized by volume) of 3.5±0.77 µm and a

11
concentration of 2.72×10⁸ ml-1. The volume fraction of the master suspension is estimated as
3.5×10⁻⁴.
In our study, an aqueous suspension of stable air-filled microbubbles was prepared at room
temperature at pH 5 using 2% W/V telechelic PVA aqueous solution. The surface tension of 2%
PVA solution is approximately 0.055 N/m [71]. The density of the PVA powder used in our study
is 1269 kg/m3 [72]. The vapor pressure of water in the PVA aqueous solution is 3.54 kPa [73],
while the vapor pressure of pure water is 2.33 kPa. The higher value of the vapor pressure for the
PVA aqueous solution is depicted in the earlier arrival of the cavitation inception for the case of
PVA suspension.
PVA microbubbles were prepared separately and then injected into the system for testing. PVA
alone is a water-soluble powder that was not subject of the investigation here. Microbubbles with
PVA shell were suspended in water. All PVA fragments or broken, formed or unformed shells
were removed from the fabrication solution during 10 days filtering procedure using separation
funnel. The fabrication and filtering protocol and complete physical characteristics of the PVA
MBs were reported in our previous work [31].
The PVA MBs will float to the top if the suspension stands still. Moreover, the PVA MBs has
a high echogenicity under ultrasound imaging. Those evidences suggest that the PVA MBs have a
core with low density, great mechanical impedance mismatch with solid (liquid), and a high
compressibility. Therefore, the core of MBs cannot be solid or liquid; it must be gas. Furthermore,
Kothapalli et al. [74] reported pumping-out fracturing mechanism of PVA MBs. They observed
that under high pressure ultrasound wave, the shell of MBs will crack and the gas of PVA MBs
core will leak out form a shell-less bubble and finally dissolved in the water.
The size of PVA MBs was obtained by microscope in this study. Similar results were obtained
by confocal laser microscopy [75] and dynamic light scattering [76].
2.1.4 Experimental procedure
Water and PVA MBs suspensions were used as the working fluids to study the effect of
cavitation on flow inside the nozzle and spray atomization. The physical properties of PVA MBs
suspensions are included in Table 2.3.
12
Table 2.3. Physical properties of the working fluid. Working fluid Suspension of PVA MBs
Temperature (K) 293
Density (kg.m-3) 1269
Viscosity (mPa.s) 1.00
Vapor Pressure (kPa) 3.54
Experiments were conducted under various test conditions (various Reynolds numbers (Re) and
cavitation numbers (σ)). Cavitation number, which is an indicator of the intensity of cavitation, is
defined as:
( )i v
2
P P
V 2
− =
2.1
where Pi, Pv, ρ, and V are the injection pressure, vapor pressure, density of the working fluid and
velocity in the nozzle, respectively. The velocity of the fluid is the ratio of the flow rate to cross-
sectional area of the nozzle.
Reynolds number is defined as:
VDRe
=
2.2
where D and μ are nozzle diameter and viscosity of the working fluid, respectively.
Sauter mean diameter, which is used in atomization studies, is defined as:
2.3
where D32 is Sauter mean diameter (SMD), ni is number of droplets in size range i, di is diameter
of droplet in size range i.
2.2 Design and fabrication of cystoscope and cavitation probe
In this section, the design and control system of the fabricated device, which uses hydrodynamic
cavitation for tissue ablation purpose and treatment of urinary stones, is presented in detail. The
methodology of conducted experiments for tissue ablating purpose is included. Since the cavitation
probe is made of stainless steel and it is not possible to visualize the flow inside the nozzle, a
D32
=n
id
i
3ån
id
i
2å

13
numerical modeling effort is also included to make sure whether cavitation occurs inside the probe
at the pressure, at which we carried out the tissue ablating experiments.
2.2.1 Experimental setup
Figure 2.4 shows the schematic of the biomedical apparatus, which includes the cystoscope as
a main probe and auxiliary equipment for tissue ablation and kidney and bladder stone treatment.
The device consists of four main parts: 1) Hydrodynamic cavitation generation system, 2) Control
system, 3) Suction, and 4) Imaging system. In the cavitation section, a high-pressure nitrogen tank
is used to provide the required pressure for cavitation. A stainless-steel liquid container (Swagelok)
is installed after the nitrogen tank to be filled with working fluid. To eliminate the fine particles
from the liquid, a 15 μm micro-filter is installed in the path (Swagelok). The fluid flowrate is
measured using a flow meter, when conducting the experiments. Several pressure gauges (Omega,
USA) are installed at different locations of the device to monitor the pressure variation of the
system. Fine control valves (Swagelok) are employed to control the flowrate. Figure 2.5 shows the
different parts of the device assembled together on a surgical table.
Figure 2.4. Schematic of the cavitation-based device for biomedical treatment.

14
Figure 2.5. Final design of the cavitation-based device for medical treatment. The blue arrow
shows the direction of the liquid inside the hydrodynamic cavitation section of the device.
Figure 2.6. Detailed schematic and information about (a) Cavitation probe, (b) main probe.
The cavitation probe is connected to the end of the cavitation section, which is inserted inside
the main probe. Figure 2.6(a) and (b) show the cavitation and the main probe, respectively. The
cavitation probe is a microchannel designed and fabricated using stainless steel microtubes. The
total length of the cavitation probe is 31.7 cm. The inner diameter and length of the first part of

15
the cavitation probe are 0.71 mm and 31.5 cm, respectively. The second part of the cavitation
probe- the restrictive element- is another microtube with an inner diameter of 0.3 mm and length
of 2 mm, which is connected to the first part and is completely welded and sealed to prevent any
leakage during the experiments. More detailed information about the cavitation probe can be found
in Figure 2.6(a).
As mentioned before, the cavitation probe itself is inserted inside the main probe.
Stereolithography (SLA) 3D printing (Formlabs, USA) was used to fabricate the main probe.
Figure 3(b) presents detailed information about the length and diameter of the main probe. 3D
CAD software, SolidWorks, was used to design the main probe. Seven holes were opened inside
the main probe for different parts, which will be used during the treatment. Apart from the
cavitation probe, four of the holes are for the stainless-steel tendon cables, one hole for the
biomedical camera, and another hole for the suction tube. The stainless-steel cables were inserted
in north, south, west, and east locations of the main probe (as can be seen in Figure 2.6(b)) to be
able to bend the probe toward different directions. Since during the in-vivo experiments, water
flows through the cavitation probe, a stainless-steel suction tube is inserted in the main probe to
suck the water out. The length of the suction tube is 31.5 cm, and the outer and inner diameters are
1.067 mm and 0.86 mm, respectively. The suction tube is connected to an OB2012 FA medical
suction unit (OSCAR BOSCAROL) to provide the required vacuum pressure.
A FISBA FISCam micro camera module is used to be able to monitor the location and direction
of the probe when performing in-vivo experiments. The visual feedback given by the camera helps
the operator in locating the target. As can be seen in Figure 2.6(b), the biomedical camera is nested
at the center of the main probe, which helps in reducing the diameter of main probe and gives a
wider view with respect to the probe head when locating the target. Table 2.4 provides some
important details about the utilized biomedical camera.
Table 2.4. Specifications of FISBA FISCam biomedical camera. Diameter without illumination 1.6 mm Field of view (diagonal) 120°
Diameter with illumination 1.95 mm Bit depth 24
Length without illumination ≤ 4 mm Resolution 400 × 400 px
Length with illumination ≤ 6 mm
A control system is designed and integrated to the medical system to control the movement of
the cystoscope in different directions. It will be further discussed in section 2.2.2.

16
In addition to the biomedical camera, a high-speed camera (VEO 710) is used for visualization
of the cavitation-induced liquid jet when hitting the samples. Real-time images of the high-speed
camera with the resolution of 1280×720 are recorded on a personal computer (PC) by using PCC
software version 3.4.788.0 (AMETEK, Inc., Berwyn, PA). The exposure time was set to 2 μs
during the visualization. Veritas miniConstellation 120.28° light emitting diode (LED) was used
as the light source. The illumination system generates white light flashes, with the pulse duration
as short as 2 μs and maximum pulse rate of 100 kHz.
2.2.2 Control system design
Probe mechanism is designed as a single arm segment continuum manipulator. To be able to
control the direction of the main probe using four antagonistic stainless-steel tendons, which are
fixed at distal end of probe, are used along with two Servo Motors. One pair of antagonistic tendons
are manipulated by servo motor 1 to control and bend the probe head in x direction. Other pair of
antagonistic tendons, which are positioned by 90 degree relative to the first pair, are manipulated
by servo motor 2 to control and bend the probe head in y direction. Tendon lengths are controlled
by the actuation of servo motors stepwise. To control the movement of the probe in z direction
(advancing and receding), a DC linear actuator in rotating screw configuration is used. All motors
can be activated and controlled via a joystick, which is connected to a microcontroller as I/O unit
and processor.
An overall view of the control system can be seen in Figure 2.7. Stop sleeves are used to fix the
tendons at the probe head (Figure 2.7(b)). As mentioned before, the tendon cables are connected
to two servo motors to control the direction of probe head. For this purpose, a pair of loop sleeves
were used for each tendon cable to perfectly fix the tendons on the servo motors (Figure 2.7(d)).
Servo motor (Savox SV-1272SG) are preferred for probe head manipulation due to their high-
torque output (30 kg/cm). The servo motors are capable of pulling the tendon cables very smoothly
with an angular sensitivity of 0.1 degree. The servo motors can bend the probe head in x and y
axes independently.
Locomotion of probe system in z axis is accomplished using the dedicated DC motor, which
drives the whole probe holder system in forward and backward directions on a rotating screw rail
at a constant speed. There are two stop switches at the beginning and at the end of the screw rail
in order to guarantee the safety of working environment.

17
Figure 2.7. Final device after assembly. (a) Overall system with every section included, (b)
Main probe head, (c) Cavitation stage with seven holes corresponding to the seven pieces
inserted in the main probe, (d) Servo motors used for the control of probe direction, and (e)
Linear actuator used for moving the probe forward and backward.
Raspberry Pi 4 is used as the microcontroller due to its I/O capabilities, moderate execution
speed, being an all-in-one board, and ease-of-programming with Python. Python is used as the
software programming language due to its ease of syntax and code readability, open source and
object-oriented, and extensive library options. All of the electrical signal lines of servo and DC
motors are connected to the GPIO pins of Raspberry Pi 4 microcontroller. I/O signals are directed
by codes, which are written using RPi.GPIO library. Position and torque control of servo motors
are achieved by the codes written using Adafruit ServoKit library. A joystick is connected to
Raspberry Pi 4 microcontroller via Bluetooth, which controls every activity of the medical device
by its buttons.
2.2.3 Experimental procedure for tissue experiments
The working fluid for the experiments was water and the experiments were carried out at room
temperature. After filling the liquid container with water, it is pressurized by the high-pressure
nitrogen tank to the desired pressure. Using the fine control valve, flowrate and pressure of
injecting water could be controlled. For tissue experiments, a transparent chamber was designed
18
with a stage that the samples could be fixed on (Figure 2.8). After the cavitating flow hits the
samples, it could leave the chamber through the outlet hole. Since at this stage we performed the
in vitro tissue ablation experiments to investigate the viability of the developed device and method,
we did not use the suction tube. It will be used for our future in vivo experiments. However, to
assess the ability of the suction system to suck the cavitating liquid out of system, we performed
one experiment in a completely filled chamber. The suction tube could easily suck the cavitating
liquid out of chamber for the examined injection pressures. The interaction between the cavitating
jet and the samples could be visualized by the high-speed camera.
The injection pressure for the tissue ablating experiments was 1034 kPa. As water flows
forward through the cavitation probe, its velocity increases due to the sudden change in diameter
at the probe head. This leads to a dramatic decrease in static pressure. As a result, cavitation
bubbles start to appear inside the liquid jet due to vaporization. When the cavitating flow leaves
the probe, the emerging bubbly jet could be targeted onto the samples. As the liquid jet collides
with the sample, the collapse and self-destruction of the cavitation bubbles cause tissue ablation.
At the final stages of bubble implosion, the bubble wall velocity could reach as high as the speed
of sound, and it makes shock waves inside the liquid [1,2]. It should be noted that the upstream
pressure is required to generate cavitation bubbles and after the generation of the cavitation
bubbles, the pressure recovery happens along the constriction element and the cavitating flow
applies to the target in the atmospheric pressure. The moderate upstream pressure is converted to
low velocity of the cavitating flow at the outlet of the cavitation probe, which is controlled via
control tendon cables precisely.

19
Figure 2.8. Design of visualization chamber and the stage used for tissue ablating
experiments.
2.2.4 Tissue preparation
For tissue experiments, prostate and bladder cancer mouse model were established by injection
of PC3 (Human prostate adenocarcinoma) and RT4 (Human urinary bladder) cell line in immune-
deficient mice. Mice experiments were approved by the Bogazici and Gebze Technical University
Animal Experiment Ethical Committee and conform to the guide for care and use of laboratory
animals. Initially, PC3 and RT4 cells were cultured in Dulbecco’s modified Eagle’s medium
(DMEM) supplemented with 10% (v/v) fetal bovine serum (FBS), 2mmol/L L-glutamine and
antibiotics (100 mg penicilin/100U streptomycin) in a 5% CO2-humidified incubator at 37⁰C.
Then, mice were subcutaneously injected with 100μl of cell suspension in 1:1 Matrigel: PBS at
1 × 10⁶ cells/per animal concentrations. Tumors were assessed by measuring length and width
using calipers twice per week for up to 16 weeks. Tumors were excised when they reached an
estimated volume of 100 mm3 (Figure 2.9).
Figure 2.9. Prostate (left) and bladder (right) cancer mouse model.
20
Hydrodynamic cavitation was applied for durations of 5, 10 and 15 min. Following exposure,
tissues were embedded in optimal cutting temperature (OCT) compound prior to frozen sectioning
on a microtome-cryostat (CryoStar™ NX50 Cryostat, Thermo Fisher Scientific). 5μm thick tissue
sections were obtained from the OCT blocks and then the sections were first morphologically
analyzed by DAPI (4′,6-diamidino-2-phenylindole) staining and then with Calcein AM and PI
(propidium iodide) staining that are commonly used for live/death cell/tissue analyses. The tissue
sections were visualized by using confocal microscopy (Carl Zeiss LSM 710).

21
3 CHAPTER THREE: THEORY, NUMERICAL MODELING, AND
IMAGE PROCESSING
3.1 Flow inside the cavitation probe
In order to establish different flow regimes inside the cavitation probe, different values of
injection pressure (Pin) were applied, while the pressure was always atmospheric at the nozzle
(flow restriction) outlet. When the valve was opened, a short stabilization time was needed for
steady flow conditions to be achieved inside the probe. Then the fluid flowrate could be measured,
and by combining the mass conservation equation and Bernoulli equation the discharge coefficient
(Cd) could be calculated. In a nozzle, discharge coefficient is defined as the ratio of actual mass
flowrate to the theoretical mass flowrate, and is calculated as:
( )d
l in out
mC
A 2 P P=
−
3.1
where m, ρl, A, Pin, and Pout are the effective mass flowrate, orifice cross-sectional area, liquid
density, inlet, and outlet pressure, respectively.
The major parameter in cavitation, cavitation number (K), which is based on the pressure
difference across the orifice, is defined as [22]:
i v
i b
P PK
P P
−=
−
3.2
where Pv and Pb are the vapor pressure and back pressure.
For cavitating flows inside the orifice, Kcritical is defined as the cavitation number, at which
cavitation incepts. When the pressure drop reaches to the value corresponding to the critical
cavitation number, despite the further increase in pressure drop, the fluid flowrate remains almost
constant as a result of choking. Therefore, in order to initiate cavitation, the cavitation number
needs to be lower than Kcritical. In this study, the following equation is used to analyze the cavitation
number for different injection pressures:
i v
2
l
2(P P )K
v
−=
3.3
where Pi and v are the injection pressure and fluid velocity, respectively.
22
3.2 Numerical Modelling
3.2.1 Physical model and mesh generation:
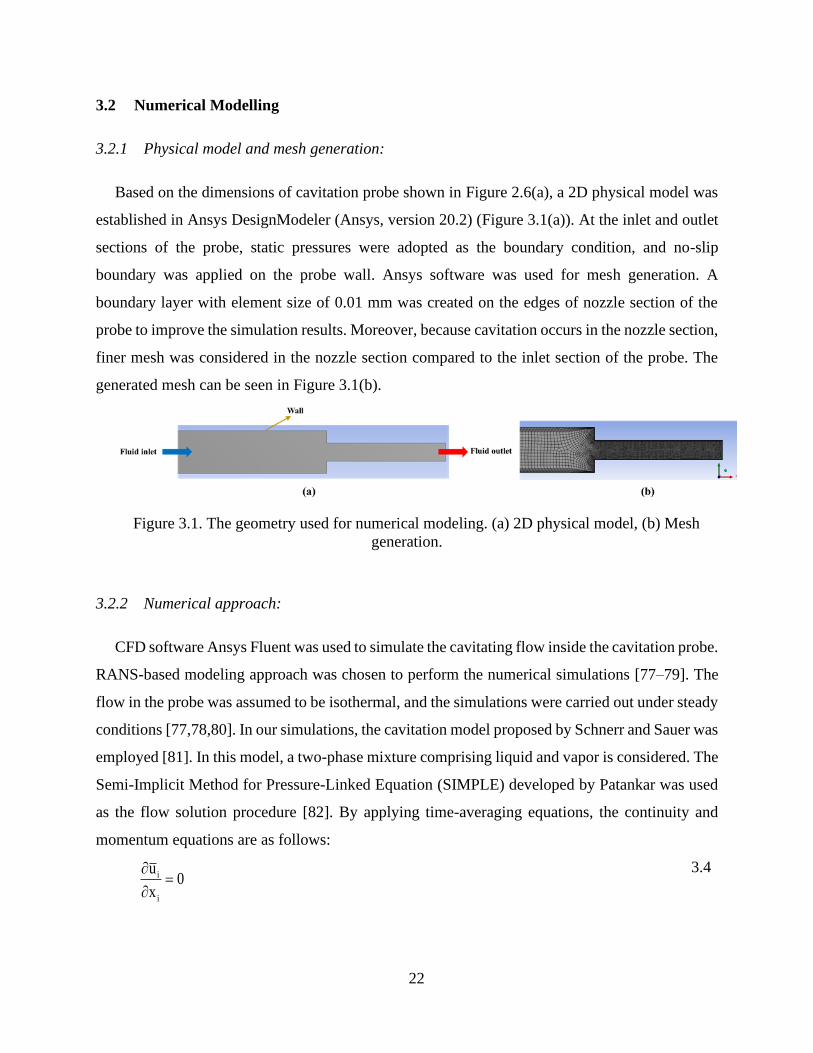
Based on the dimensions of cavitation probe shown in Figure 2.6(a), a 2D physical model was
established in Ansys DesignModeler (Ansys, version 20.2) (Figure 3.1(a)). At the inlet and outlet
sections of the probe, static pressures were adopted as the boundary condition, and no-slip
boundary was applied on the probe wall. Ansys software was used for mesh generation. A
boundary layer with element size of 0.01 mm was created on the edges of nozzle section of the
probe to improve the simulation results. Moreover, because cavitation occurs in the nozzle section,
finer mesh was considered in the nozzle section compared to the inlet section of the probe. The
generated mesh can be seen in Figure 3.1(b).
Figure 3.1. The geometry used for numerical modeling. (a) 2D physical model, (b) Mesh
generation.
3.2.2 Numerical approach:
CFD software Ansys Fluent was used to simulate the cavitating flow inside the cavitation probe.
RANS-based modeling approach was chosen to perform the numerical simulations [77–79]. The
flow in the probe was assumed to be isothermal, and the simulations were carried out under steady
conditions [77,78,80]. In our simulations, the cavitation model proposed by Schnerr and Sauer was
employed [81]. In this model, a two-phase mixture comprising liquid and vapor is considered. The
Semi-Implicit Method for Pressure-Linked Equation (SIMPLE) developed by Patankar was used
as the flow solution procedure [82]. By applying time-averaging equations, the continuity and
momentum equations are as follows:
i
i
u0
x
=
3.4

23
( ) 2i j
i i
j i j j
u uu uP
t x x x x
+ = − +
3.5
where iu , P , are time-averaged velocity of the fluid in
ix direction, pressure, and density,
respectively. According to the literature, using different turbulence models did not affect the results
considerably, and k-ε model is widely used as the turbulence model [78,83,84]. Therefore, the
standard k-ε turbulence model was incorporated to account for the large pressure gradients:
( ) ti k
i j k j
kku G
x x x
= = + + −
3.6
( ) ( )2
ti 1 k 2
i j j
u C G Cx x x k k
= + + −
3.7
By combining k and ε, turbulent viscosity is computed as follows:
2
t
kC =
3.8
In the above equations, Gk represents the turbulence kinetic energy generation, and C1ε, C2ε, and
Cμ are constants with the default values of 1.44, 1.92, and 0.09, respectively. σε and σk are turbulent
Prandtl numbers for ε and k, and have the values of 1.3 and 1, respectively [85].
As mentioned before, Schnerr and Sauer was employed as the cavitation model. The final form
of this model can be written as:
For vP P :
( )( )vv l
e
B l
P P3 2R 1
3
− = −
3.9
For vP P :
( )( )vv l
c
B l
P P3 2R 1
3
− = −
3.10
where Re and Rc are mass transfer source terms connected to the growth and collapse of the vapor
bubbles, respectively. B , α,
l , v , Pv and P are bubble radius, vapor volume fraction, liquid
density, vapor density, saturation vapor pressure, and local far-field pressure, respectively.

24
3.3 Image processing
In order to obtain spray atomization characteristics and the effect of cavitation on droplet size
and velocity distribution, spray visualization experiments were conducted at a location as near as
possible to the emerging liquid jet [16]. Figure 3.2 demonstrates the precise location of the window
with respect to the nozzle and liquid jet, which was used to capture images for droplet size and
velocity calculations. For water experiments, four injection pressures corresponding to four
different flow regimes inside the nozzles were chosen to investigate the atomization
characteristics, namely: 1- non-cavitating flow, 2- cavitation inception, 3- developed cavitation,
and 4- supercavitation. According to the results of atomization study for the case of water (section
4.1.3), supercavitation has the dominant effect on enhancing atomization, and as a result,
atomization study was not performed for developed cavitation of PVA MBs suspension. Spray
was observed with a sampling speed of 24096 images per second. For droplet size distribution at
different pressures, 250 frames with a time difference of 830 µs were selected so that the time
difference between the frames could be long enough to avoid appearance of the same droplet on
two different frames. The selected images were processed using an in-house developed code in
MATLABTM 2018a (MathWorks Inc., Natick, MA) to recognize the droplets on each frame and
to determine their diameters. For better understanding of the droplet size distribution during non-
cavitating and cavitating flows, Sauter mean diameter (SMD) was calculated from the measured
droplet diameters.
For droplet velocity calculations, 300 pairs of successive frames were selected. These frame
pairs were selected in such a way that none of them shared the same droplets. After processing the
frames and determining the location of the same droplet on each frame of the pairs, the
displacement of the droplet was found and used to obtain the velocity of the droplet. Figure 3.3
shows typical locations of two different droplets in two successive frames, which were used for
velocity calculations. After finding the displacement of the droplets, the velocity could be easily
calculated using the time step of the image capturing experiments. Another code was developed in
MATLABTM 2018a to find the velocity of droplets. For all the selected pressures, the spray
visualization for droplet calculations was performed at exactly the same location so that the results
could be comparable. In this study, only x and y components of the velocity of the droplets were
calculated, and the velocity in z direction for the recognized droplets in the selected frames was
considered to be zero. The selection of the frames for velocity studies was made in such a way that

25
the same droplet could be recognizable in two successive frames with the same size. However, if
the droplets have a slight velocity in z direction, the same droplet might not be recognized in the
second frame. This method of frame selection for velocity studies ruled out many of the captured
images. Since the nozzle has a symmetrical circular cross-section, it is valid to assume that if we
consider all of the droplets, x and z components of the droplet velocities will be approximately the
same.
Figure 3.2. Position of the window used for spray visualization during droplet measurements.
Figure 3.3. Location of two different droplets in two successive frames: (a) frame 1, (b) frame
2 (D1: droplet 1, D2: droplet 2). Note: The time difference between the frames is approximately
41.5 µs.
Spray cone angles of the liquid jets were measured from the captured images in the proximity
of the nozzle exit (15 mm downstream the nozzle exit, similar to the study of Sou et al. [17]). For
each injection pressure, 20 frames of the liquid jets with time difference of approximately 5 ms
were used to determine the spray angle as shown in Figure 3.4, and the average of the 20 measured
angles was reported as the spray cone angle at each injection pressure. The method presented in
the study of Ghorbani et al. [86] was implemented to measure the spray cone angles.

26
Figure 3.4. Spray cone angle (θ).

27
4 CHAPTER THREE: RESULTS AND DISCUSSION
4.1 Effect of intensified cavitation on spray atomization characteristics in microscale
4.1.1 Flow regimes
Flow regimes for the case of water in the nozzle with an inner diameter of 0.9 mm are shown
in Figure 4.1. For cavitation numbers (σ) greater than 1.086, no cavitation bubbles are observed
inside the nozzle, and the liquid jet outside the nozzle forms a “wavy jet”. For cavitation number
of 1.086 (P=690 kPa), cavitation bubbles appear around the edge of the nozzle entrance. The
inception inside the nozzle switches to developed cavitation at the cavitation number of 1.069. The
transition from inception to developed cavitation is very quick, which implies that the cavitation
bubbles could reach to the end of the nozzle within a short time after the cavitation inception. In
developed cavitating flow regime, the liquid outside the nozzle still has the form of “wavy jet”.
With a further increase in the injection pressure, the flow inside the channel becomes
supercavitation, where cavitation region inside the nozzle is extended to near the nozzle exit
(1.059<σ<1.069). Under supercavitation conditions, enhanced atomization of the liquid jet can be
seen, which causes the formation of more droplets and ligaments. This morphology of liquid jet is
named as “spray”, which has a wider angle compared to “wavy jet”. For injection pressures higher
than 1725 kPa, the nozzle flow exhibits hydraulic flip behavior, where formation of “flipping jet”
outside the nozzle is observed.

28
Figure 4.1. Cavitating flow development inside the circular transparent quartz tube with a
nozzle diameter of 0.9 mm for water.
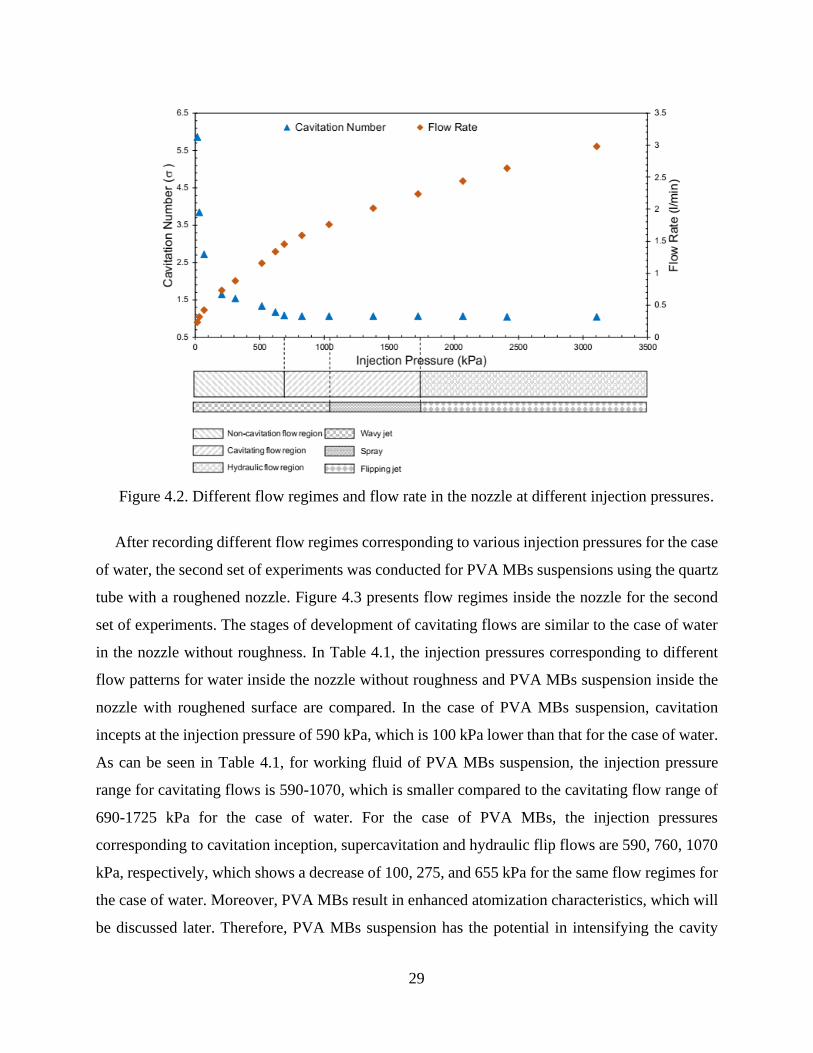
Figure 4.2 shows the effect of injection pressure on liquid flow rate and cavitation number. As
can be seen, an increase in the injection pressure results in higher liquid flow rates. The flow rate
increases sharply at low injection pressures compared to higher injection pressures until the
hydraulic flip region, at which the flow rate starts to rise more steeply. This behavior is
demonstrated in Figure 4.2, as the cavitation number is inversely proportional to the square of the
liquid velocity. In addition, Figure 4.2 demonstrates different regimes of liquid jets. As mentioned
before, both non-cavitation and developed cavitation flow regions correspond to wavy jet flows,
while supercavitation forces the jet to acquire spray form. The spray velocity increases
aggressively after supercavitation, which is depicted in the flow rate profile beyond the injection
pressure of 1035 kPa. This fact implies that the discharge has a significant effect on the flow pattern
in the hydraulic flip region.
29
Figure 4.2. Different flow regimes and flow rate in the nozzle at different injection pressures.
After recording different flow regimes corresponding to various injection pressures for the case
of water, the second set of experiments was conducted for PVA MBs suspensions using the quartz
tube with a roughened nozzle. Figure 4.3 presents flow regimes inside the nozzle for the second
set of experiments. The stages of development of cavitating flows are similar to the case of water
in the nozzle without roughness. In Table 4.1, the injection pressures corresponding to different
flow patterns for water inside the nozzle without roughness and PVA MBs suspension inside the
nozzle with roughened surface are compared. In the case of PVA MBs suspension, cavitation
incepts at the injection pressure of 590 kPa, which is 100 kPa lower than that for the case of water.
As can be seen in Table 4.1, for working fluid of PVA MBs suspension, the injection pressure
range for cavitating flows is 590-1070, which is smaller compared to the cavitating flow range of
690-1725 kPa for the case of water. For the case of PVA MBs, the injection pressures
corresponding to cavitation inception, supercavitation and hydraulic flip flows are 590, 760, 1070
kPa, respectively, which shows a decrease of 100, 275, and 655 kPa for the same flow regimes for
the case of water. Moreover, PVA MBs result in enhanced atomization characteristics, which will
be discussed later. Therefore, PVA MBs suspension has the potential in intensifying the cavity

30
clouds with the consideration of the surface and geometrical characteristics. Our previous study
proves that the pressure can be reduced to much smaller values (below to the vapor saturation
pressure) for the case of PVA MBs suspension [31]. This characteristic causes earlier arrival of
different patterns of the cavitation compared to the case of water. The flow pattern transitions to
supercavitation condition at 1070 kPa for the case of PVA MBs, which is a comparatively low
injection pressure for engineering and industrious applications.
Figure 4.3. Cavitating flow development inside the circular transparent quartz tube with a
nozzle diameter of 0.9 mm with roughened surface for working fluid of PVA MBs suspension.
Table 4.1. Comparison in the injection pressures for the different flow regimes. Water (nozzle without
roughness)
PVA MBs (nozzle with
roughness)
No Cavitation - 690 (kPa) - 590 (kPa)
Cavitating flow 690 - 1725 (kPa) 590 - 1070 (kPa)
Hydraulic flip 1725 - (kPa) 1070 - (kPa)
4.1.2 Spray cone angle
The spray cone angles for water and PVA MBs suspensions were averaged and plotted against
the injection pressure in Figure 4.4. According to Figure 4.4(a), at very low values of injection
pressures, water liquid jet is completely flat and has a cone angle of 0o. With an increase in the
injection pressure, waves start to appear on the liquid jet and raises the cone angle (0°<θ<2°). At
the pressure of 690 kPa, which corresponds to the cavitation inception, spray cone angle begins to
increase with a higher rate until the pressure of 1725 kPa, at which hydraulic flip region makes the
cone angle drop at a considerable rate. To observe the effect of PVA MBs on cone angle, the same

31
approach was implemented to measure the spray cone angle of the liquid jet of PVA MBs. As can
be seen in Figure 4.4(b), the measured cone angles of PVA MBs liquid jet have a similar trend as
the case of water. As mentioned in the previous section, for PVA MBs, cavitation incepts at a
lower pressure, which leads to a steep increase in spray cone angle at a lower pressure compared
to the case of water. Although the measured cone angle of PVA MBs is bigger than the case of
water, there is not any considerable difference between the spray cone angles of water and PVA
MBs suspensions. According to Figure 4.4, for both water and PVA MBs suspensions, the highest
spray cone angle was when the flow inside the nozzle is in supercavitation conditions. In
supercavitation conditions, the cavitation bubbles could reach to near the nozzle exit region, and
the collapse of these bubbles causes a significant energy release, which results in the detachment
of more droplets from the mother jet leading to larger spray cone angle.

32
(a) Working fluid of water (nozzle without roughness)
(b) Working fluid of PVA MBs suspensions (nozzle with roughness)
Figure 4.4. Measured cone angles.
4.1.3 Atomization and droplet size distribution
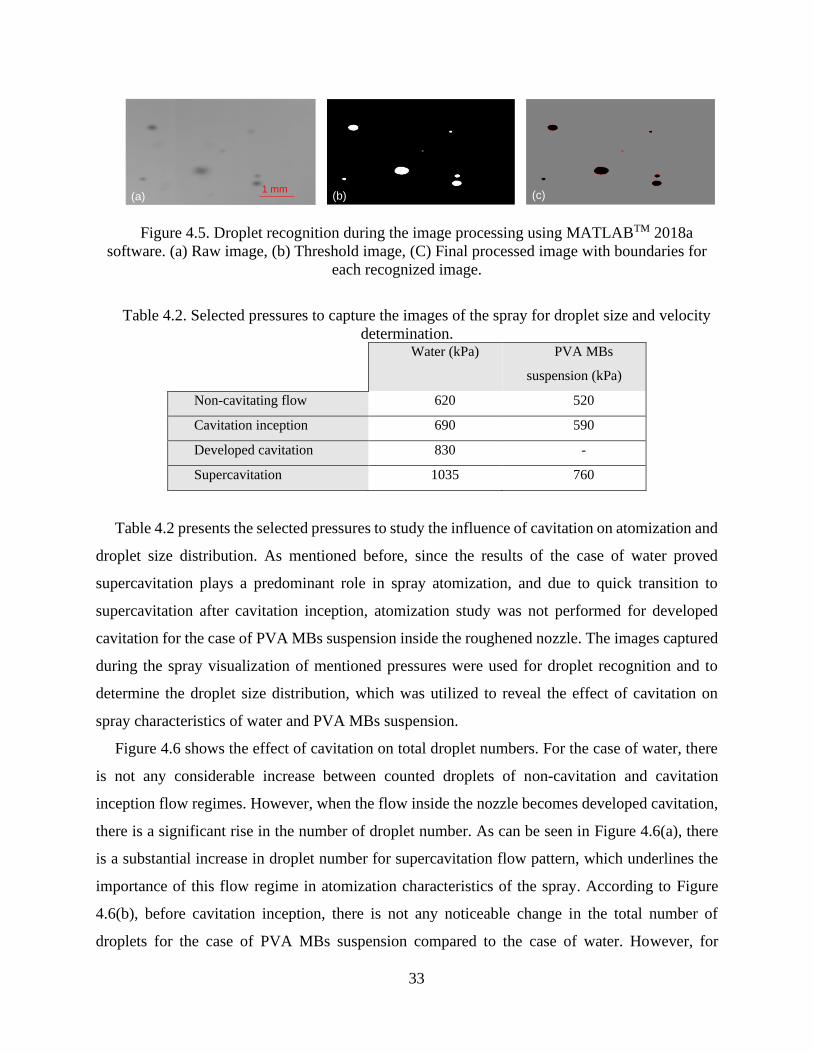
Figure 4.5 shows the steps of image processing for a sample frame and the recognized droplets
by the developed in-house code after processing. As can be seen, the developed code has a high
capability of spotting the droplets with an acceptable accuracy. A certain threshold was specified
so that the method of counting the droplets on all of the pictures for all the pressures was the same.
0
1
2
3
4
5
6
7
8
0 500 1000 1500 2000 2500 3000 3500
Spra
y C
on
e A
ngle
(de
gre
e)
Injection Pressure (kPa)
Cavitation Inception
Hydraulic flip
No Cavitation
Developing cavitation
Super cavitation
0
1
2
3
4
5
6
7
8
300 400 500 600 700 800 900 1000 1100 1200
Spra
y C
on
e A
ngle
(de
gre
e)
Injection Pressure (kPa)
No Cavitation
Cavitation Inception
Developing cavitation
Super cavitation
Hydraulic flip
33
Figure 4.5. Droplet recognition during the image processing using MATLABTM 2018a
software. (a) Raw image, (b) Threshold image, (C) Final processed image with boundaries for
each recognized image.
Table 4.2. Selected pressures to capture the images of the spray for droplet size and velocity
determination. Water (kPa) PVA MBs
suspension (kPa)
Non-cavitating flow 620 520
Cavitation inception 690 590
Developed cavitation 830 -
Supercavitation 1035 760
Table 4.2 presents the selected pressures to study the influence of cavitation on atomization and
droplet size distribution. As mentioned before, since the results of the case of water proved
supercavitation plays a predominant role in spray atomization, and due to quick transition to
supercavitation after cavitation inception, atomization study was not performed for developed
cavitation for the case of PVA MBs suspension inside the roughened nozzle. The images captured
during the spray visualization of mentioned pressures were used for droplet recognition and to
determine the droplet size distribution, which was utilized to reveal the effect of cavitation on
spray characteristics of water and PVA MBs suspension.
Figure 4.6 shows the effect of cavitation on total droplet numbers. For the case of water, there
is not any considerable increase between counted droplets of non-cavitation and cavitation
inception flow regimes. However, when the flow inside the nozzle becomes developed cavitation,
there is a significant rise in the number of droplet number. As can be seen in Figure 4.6(a), there
is a substantial increase in droplet number for supercavitation flow pattern, which underlines the
importance of this flow regime in atomization characteristics of the spray. According to Figure
4.6(b), before cavitation inception, there is not any noticeable change in the total number of
droplets for the case of PVA MBs suspension compared to the case of water. However, for
1 mm(a) (b) (c)

34
cavitating flows, the total droplet number significantly increases, which proves the beneficial
impact of PVA MBs and surface roughness in droplet break-up and improving the atomization
characteristics of cavitating flows in addition to lowering the pressure required to incept the
cavitating flow inside the nozzle.
(a) Total counted droplets for working fluid of water (nozzle without roughness)
(b) Total counted droplets for working fluid of PVA MBs suspension (nozzle with roughness)
Figure 4.6. Effect of cavitation on total counted droplets.
Figure 4.7 displays the droplet size distribution for non-cavitating flow and different stages of
cavitating flows. According to Figure 4.7(a), for the case of water, the percentage of droplets with
diameter smaller than 200 µm increases considerably for supercavitation flows compared to non-
cavitation flows (89.2% for non-cavitation and 94.9% for supercavitation). For the case of PVA
343417
890
2217
0
500
1000
1500
2000
2500
620 690 830 1035
Tota
l C
oun
ted d
rople
ts
Injection Pressure (kPa)
431
959
3047
0
500
1000
1500
2000
2500
3000
3500
520 590 760
To
tal C
oun
ted d
rople
ts
Injection Pressure (kPa)

35
MBs suspension (Figure 4.7(b)), even though the percentage of droplets with diameter smaller
than 200 µm noticeably increases during non-cavitation flows compared to water (from 89.2% to
97.4%), it is roughly the same during supercavitation flows for both cases (94.9% for water and
95.2% for PVA MBs suspension). This outcome indicates the effect of the PVA MBs suspension
in increasing the quality of the spray atomization. As a result, larger impact pressures produced by
the MBs suspension leads to reduction in the liquid jet length and smaller droplets sizes during the
primary and secondary breakups [31].
(a) Droplet size distribution for working fluid of water (nozzle without roughness)
(b) Droplet size distribution for working fluid of PVA MBs suspension (nozzle with roughness)
Figure 4.7. Effect of cavitation on droplet size distribution.
160 146
342 1 0
202171
394 1 0
466
370
459 0 0
1253
851
85
16 9 30
200
400
600
800
1000
1200
1400
0-100 100-200 200-300 300-400 400-500 500-600
Cou
nt
Droplet diameters (µm)
620 kPa
690 kPa
830 kPa
1035 kPa
Injection pressure:
337
83
11 0 0
628
271
537 0
1217
1683
143
4 00
200
400
600
800
1000
1200
1400
1600
1800
2000
0-100 100-200 200-300 300-400 More
Co
un
t
Droplet diameters (µm)
520 kPa
590 kPa
760 kPa
Injection pressure:

36
(a) Water (nozzle without roughness) (b) PVA MBs suspension (nozzle with roughness)
Figure 4.8. Effect of cavitation on overall SMD.
Figure 4.8 presents the overall SMD distributions for non-cavitating and cavitating flows. As
shown, for both water and PVA MBs suspension, the SMD for cavitating flow is lower than that
of non-cavitating flow, which implies the dominant role of cavitation in enhancing the atomization.
This is due to the high energy release and localized shock waves from bubble collapse, which leads
to fine atomization. When the collapse of cavitation bubbles happens, the energy stored on the
surface of the cavitation bubbles turns into a divergent breakup energy, which leads to enhanced
atomization. As can be seen in Figure 4.8(b), the overall SMD of PVA MBs suspension is
noticeably lower compared to the SMD of water for both non-cavitation and cavitating flow
conditions, which suggests the intensified liquid atomization as a result of using PVA MBs.
4.1.4 Droplet velocity distribution
Figure 4.9 shows an example of two successive frames processed by the developed code in
MATLABTM 2018a, which were used to find the locations of the droplets in each frame so that the
velocity of the droplets could be calculated based on the method explained in section 3.3.
165
167
169
171
173
175
177
179
181
183
185
400 500 600 700 800 900 1000 1100
SM
D(µ
m)
Injection Pressure (kPa)
134
136
138
140
142
144
146
148
150
400 450 500 550 600 650 700 750 800
SM
D(µ
m)
Injection Pressure (kPa)

37
Figure 4.9. Raw and processed images to locate the droplets on two successive frames. (a) and
(b): raw images, (c) and (d): respected processed images.
After performing the same image processing on all the selected frames, the extracted data were
used to find the velocity of the droplets. Figure 4.10(a) and (b) exhibit the water droplet velocities
in x and y directions, respectively, for all the injection pressures presented in Table 4.2. Increasing
the injection pressure results in higher liquid flow rates leading to larger velocities of the injected
liquid jet. The velocity of droplets in x direction is much lower than that in y direction, which
indicates the low spray cone angle. As can be seen in Figure 4.10(a), after cavitation inception, the
distance between velocity trendlines increases compared to the distance between velocity trendline
before cavitation inception (620 kPa and 690 kPa trendlines), which is the reason for the steep
increase in the spray cone angle upon cavitation inception in Figure 4.4(a). Looking at Figure
4.10(a) and (b), it can be noted that during supercavitation, both x and y components of the velocity
of droplets increase considerably. This implies that the supercavitation flow inside the nozzle plays
a dominant role in enhancing spray atomization besides making the spray have a larger cone angle.
Suh et al. [16] used a Phase Doppler particle analyzer to measure the velocity at the nozzle exit
as well as the velocity of the droplets. They presented mean droplet velocities for turbulent flows,
cavitating and flipping jet flow regions. The trend and increasing rate of the velocity of the droplets
in different flow regions in this study are consistent with the results of their study.
The velocity fluctuations of the droplets with different diameters are shown as range bars in
Figure 4.10 (which also can be found in Figure 4.11). Velocity fluctuations ranges roughly from
0.05 to 0.15 m/s in x direction and 0.5 to 1.5 m/s in y direction.
(a) (b)
(c) (d)
Frame 1, t=0 s Frame 2, t≈41.5 µs
Frame 1, t=0 s Frame 2, t≈41.5 µs
D1
D2
D1
D2
D2D1
D1
D2

38
(a)
(b)
Figure 4.10. Velocity distribution of the departed droplets from the water jet immediately
before and during cavitating flow inside the nozzle.
Figure 4.11 presents x and y components of the droplet velocity of the case of PVA MBs in the
roughened nozzle, respectively. The magnitude and trend in the velocity of the suspension droplets
in x direction are similar to those of water droplets in x direction. Nonetheless, there is a minor
increase in the magnitude, which explains the larger spray cone angle of PVA MBs suspension
compared to water. Comparing the y components of the velocity of the suspension droplets with
water droplets in cavitating flow regime, it can be realized that there is a considerable increase in
0
0.5
1
1.5
2
2.5
3
3.5
4
4.5
0-50 50-100 100-150 150-200 200-250 250-
Vx (
m/s
)
Droplet Diameter (µm)
620 kPa
690 kPa
830 kPa
1035 kPa
05101520253035 0-5050-100 100-150150-200 200-250250-Vy (m/s) Droplet Diameter (µm)620 kPa"690 kPa830 kPa1035 kPa
0
5
10
15
20
25
30
35
0-50 50-100 100-150 150-200 200-250 250-
Vy (
m/s
)
Droplet Diameter (µm)
620 kPa
690 kPa
830 kPa
1035 kPa

39
the velocity of the droplets in y direction for the PVA MBs suspension droplets. The y component
of the droplets for the case of PVA MBs could reach as high as approximately 40 m/s at injection
pressure of 760 kPa, while this value is nearly 30 m/s at injection pressure of 1035 for the case of
water. It can be deduced that the presence of PVA MBs not only results in lowering the required
injection pressure for development of cavitation flow in the nozzle, it also leads to higher rate of
atomization with larger velocities at lower pressure.
(a)
(b)
Figure 4.11. Velocity distribution of the departed droplets from the PVA MBs suspension jet
immediately before and during cavitating flow inside the roughened nozzle.
0
0.5
1
1.5
2
2.5
3
3.5
4
0-50 50-100 100-150 150-200 200-250 250-
Vx (
m/s
)
Droplet Diameter (µm)
520 kPa
590 kPa
760 kPa
0510152025303540 0-5050-100100-150 150-200200-250 250-Vy (m/s) Droplet Diameter (µm)75 psig85 psig110 psig
0
5
10
15
20
25
30
35
40
0-50 50-100 100-150 150-200 200-250 250-
Vy (
m/s
)
Droplet Diameter (µm)
520 kPa
590 kPa
760 kPa

40
4.2 Tissue ablation using the developed biomedical device
4.2.1 Numerical analysis
Mesh independency:
Several grids with different element numbers were created in the Ansys environment for the
mesh independency study. The fluid average velocity, vapor volume fraction, and discharge
coefficient were compared for the generated grids. The injection pressure for mesh independency
studies was 1034 kPa. The results are presented in Table 4.3. As can be seen, the average fluid
velocity does not change significantly when increasing the element number. On the other hand,
increasing the mesh number leads to increased vapor volume fraction. The results remain almost
the same for element numbers of 34475 and 74086. Therefore, the rest of simulations were carried
out for the element number of 34475.
Table 4.3. Comparison of numerical results for different grids for injection pressure of 1034
kPa. Element number 1228 1742 2385 4672 7332 11606 34475 74086
Average velocity at nozzle outlet 35.82 35.31 35.51 36.33 36.55 36.8 37.33 37.33
Average vapor fraction at nozzle outlet 0.06 0.07 0.088 0.114 0.125 0.139 0.1587 0.1598
Discharge coefficient 0.9480 0.9472 0.9469 0.9467 0.9466 0.9464 0.9462 0.9462
Model validation:
In order to validate the numerical model, the simulation results were compared with the
experimental results. Figure 4.12(a) and (b) show the comparison between experimental and
numerical results for flowrate and discharge coefficient. To assess the validity of the numerical
model, the mean absolute percentage error (MAPE) is utilized:
Mi i
i 1 i
ˆy y1MAPE 100
ˆM y=
−=
4.1
where iy ,
iy are the predicted values via numerical simulation and the experimental results,
respectively.
As can be seen in Figure 4.12(a), increasing injection pressure induces an increase in flowrate.
This increase continues until a point, where the flowrate starts to reach a steady flow. This
stabilization is a result of cavitation inception and corresponds to the critical cavitation number
(Kcritical). The critical cavitation numbers calculated from experimental and numerical results

41
were 1.32 and 1.37, respectively. According to this figure, numerical model predicts the flowrate
with an acceptable agreement (MAPE of about 6%).
For non-cavitating flows, the discharge coefficient increases with Re number up to a critical
value (critical Re). This critical value strongly depends on the geometry of orifice. At this point,
the discharge coefficient could reach its maximum value (close to 95%), beyond which the increase
is negligible [69,87–89]. Since Reynolds number is a function of fluid velocity in the orifice and
therefore depends on the square root of pressure drop, the mentioned parameters are directly
proportional. On the other hand, for cavitating flows, the discharge coefficient only depends on
the cavitation number, and it is calculated as [69]:
d cC C K= 4.2
where Cc is the coefficient of contraction in the nozzle because of cavitation.
Comparing the experimental and numerical results for non-cavitating flows in Figure 4.12(b),
good agreement between simulation and experimental results (with an MAPE of 0.4%) could be
seen. As shown, the discharge coefficient increases to a value of approximately 0.92 for both
experimental results and numerical simulation. Beyond this value, the growth in discharge
coefficient is almost negligible. When the injection pressure is further increased, cavitation starts
to appear, and the discharge coefficient drops. This will be discussed in detail in section 4.2.2.
(a) (b)
Figure 4.12. Comparison between numerical and experimental results for: (a) Flowrate and
(b) Discharge coefficient.

42
Figure 4.13. Variation of cavitation number with respect to the injection pressure.
Figure 4.14. Discharge coefficient against the cavitation number.
4.2.2 Hydraulic characterization of the cavitation probe
To be able to characterize the flow regimes inside the cavitation probe and the characteristics
of the emerging jet, the variation of cavitation number with respect to the injection pressure is
shown in Figure 4.13. The injection pressure varies between 69-1724 kPa, while the pressure at
the probe exit is always atmospheric. As can be seen, in this study, the cavitation number varies
between 1.02-1.77 for experimental results and 1.12-1.85 for numerical simulations. As shown in
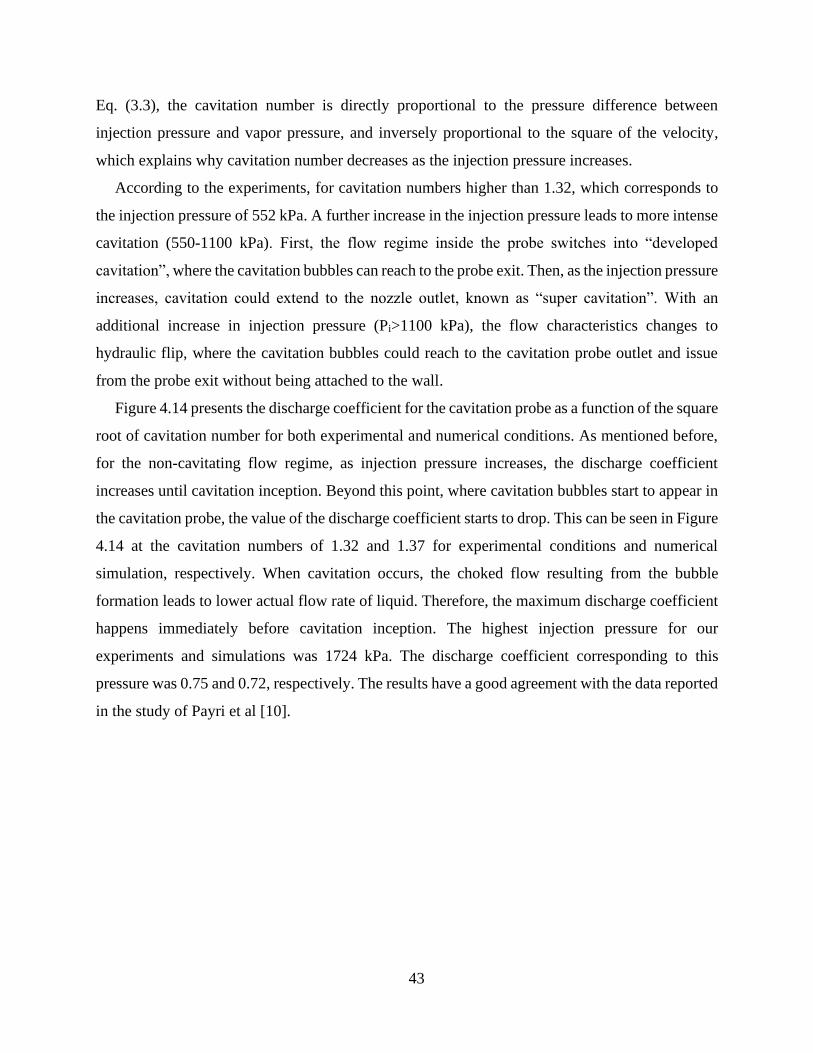
43
Eq. (3.3), the cavitation number is directly proportional to the pressure difference between
injection pressure and vapor pressure, and inversely proportional to the square of the velocity,
which explains why cavitation number decreases as the injection pressure increases.
According to the experiments, for cavitation numbers higher than 1.32, which corresponds to
the injection pressure of 552 kPa. A further increase in the injection pressure leads to more intense
cavitation (550-1100 kPa). First, the flow regime inside the probe switches into “developed
cavitation”, where the cavitation bubbles can reach to the probe exit. Then, as the injection pressure
increases, cavitation could extend to the nozzle outlet, known as “super cavitation”. With an
additional increase in injection pressure (Pi>1100 kPa), the flow characteristics changes to
hydraulic flip, where the cavitation bubbles could reach to the cavitation probe outlet and issue
from the probe exit without being attached to the wall.
Figure 4.14 presents the discharge coefficient for the cavitation probe as a function of the square
root of cavitation number for both experimental and numerical conditions. As mentioned before,
for the non-cavitating flow regime, as injection pressure increases, the discharge coefficient
increases until cavitation inception. Beyond this point, where cavitation bubbles start to appear in
the cavitation probe, the value of the discharge coefficient starts to drop. This can be seen in Figure
4.14 at the cavitation numbers of 1.32 and 1.37 for experimental conditions and numerical
simulation, respectively. When cavitation occurs, the choked flow resulting from the bubble
formation leads to lower actual flow rate of liquid. Therefore, the maximum discharge coefficient
happens immediately before cavitation inception. The highest injection pressure for our
experiments and simulations was 1724 kPa. The discharge coefficient corresponding to this
pressure was 0.75 and 0.72, respectively. The results have a good agreement with the data reported
in the study of Payri et al [10].
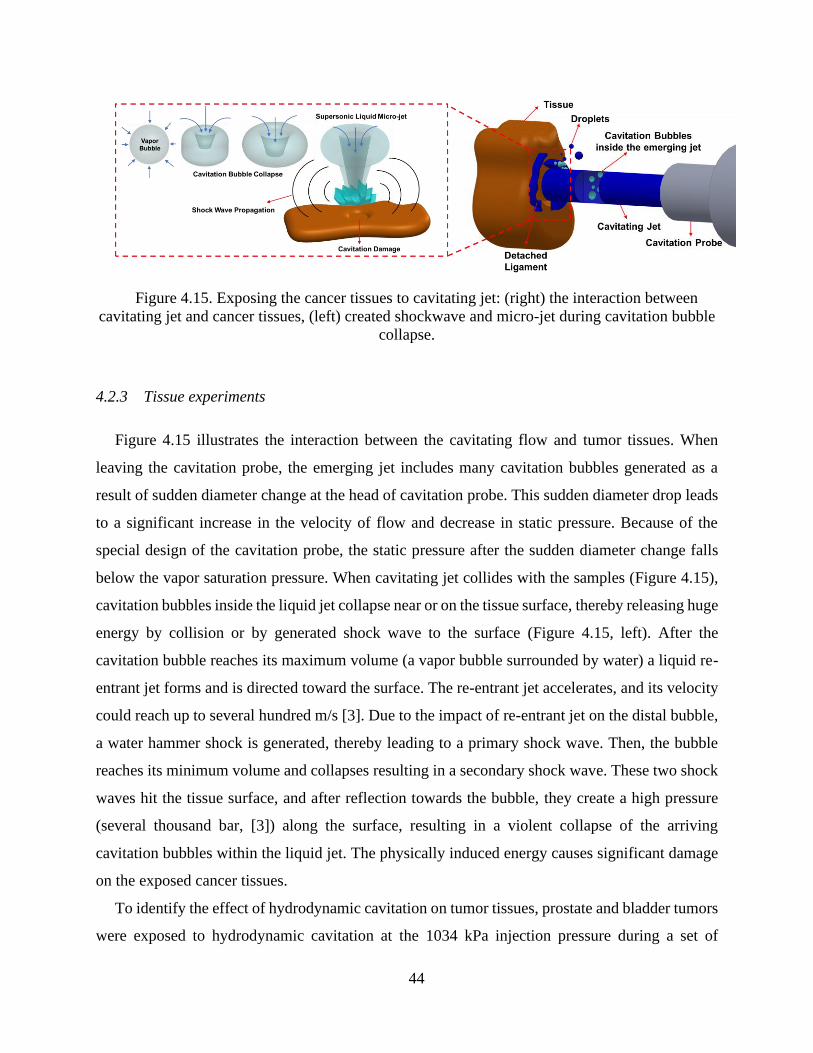
44
Figure 4.15. Exposing the cancer tissues to cavitating jet: (right) the interaction between
cavitating jet and cancer tissues, (left) created shockwave and micro-jet during cavitation bubble
collapse.
4.2.3 Tissue experiments
Figure 4.15 illustrates the interaction between the cavitating flow and tumor tissues. When
leaving the cavitation probe, the emerging jet includes many cavitation bubbles generated as a
result of sudden diameter change at the head of cavitation probe. This sudden diameter drop leads
to a significant increase in the velocity of flow and decrease in static pressure. Because of the
special design of the cavitation probe, the static pressure after the sudden diameter change falls
below the vapor saturation pressure. When cavitating jet collides with the samples (Figure 4.15),
cavitation bubbles inside the liquid jet collapse near or on the tissue surface, thereby releasing huge
energy by collision or by generated shock wave to the surface (Figure 4.15, left). After the
cavitation bubble reaches its maximum volume (a vapor bubble surrounded by water) a liquid re-
entrant jet forms and is directed toward the surface. The re-entrant jet accelerates, and its velocity
could reach up to several hundred m/s [3]. Due to the impact of re-entrant jet on the distal bubble,
a water hammer shock is generated, thereby leading to a primary shock wave. Then, the bubble
reaches its minimum volume and collapses resulting in a secondary shock wave. These two shock
waves hit the tissue surface, and after reflection towards the bubble, they create a high pressure
(several thousand bar, [3]) along the surface, resulting in a violent collapse of the arriving
cavitation bubbles within the liquid jet. The physically induced energy causes significant damage
on the exposed cancer tissues.
To identify the effect of hydrodynamic cavitation on tumor tissues, prostate and bladder tumors
were exposed to hydrodynamic cavitation at the 1034 kPa injection pressure during a set of

45
increasing time points (5 min, 10 min, and 15 min), while non-cavitating counterparts of tissues
were used as the control sample. In fact, the size and shape of the nucleus are tightly regulated
with the physiological condition of cells and tissues, indicating that altered nuclear morphology is
correlated with the cell death and disease conditions. Therefore, the effects of cavitation on tumor
tissues were first assessed by morphological analysis of the nucleus stained with DAPI (4′,6-
diamidino-2-phenylindole), a fluorescent dye that binds strongly to DNA in cell nucleus.
Compared to the non-exposed control samples, cavitation causes a prominent damage to the
exposed tissues on both prostate and bladder tumors, clearly seen by the spheroid and decomposed
shape of tissues cell nucleus. We also observed the disruptive effect of cavitation when increasing
the exposure duration (Figure 4.16, upper panel).
We have previously reported changes in cell viability for various human cancer cells exposed
to hydrodynamic cavitation [37,38], however, its effect on tumor tissues remain unrevealed.
Therefore, the next step was to investigate the effect of hydrodynamic cavitation on cell death in
tumor tissues. The injection pressure was set to 1034 kPa, and the tumor tissues were exposed to
cavitation for 5, 10, and 15 min. After the exposure, cell death was determined by Calcein AM/PI
(Propidium iodide) staining. Calcein AM is a non-fluorescent, hydrophobic compound that easily
permeates intact, live cells. The hydrolysis of Calcein AM by intracellular esterases produces
calcein, which is a hydrophilic fluorescent compound that stains cell cytoplasm. In contrast, PI is
a small fluorescent molecule, able to bind DNA only in damaged or dying cells that lose their
membrane integrity, because PI cannot pass through an intact plasma membrane. The results
revealed that cavitation causes a dramatic decrease in the number of live cells in both prostate and
bladder tumors. The damage affected a significant proportion of cells and increased with exposure
time, which could be clearly seen by the attenuation of Calcein signal at 10 and 15 min exposure.
(Figure 4.16, lower panel).
We have previously shown that hydrodynamic cavitation leads to a decrease in two different
types of prostate cell numbers (PC3 and DU145) in a pressure and time-dependent manner [38].
However, in culture conditions, hydrodynamic cavitation destroyed cells instantly and the
remaining recovered live cells did not show any further activation of programmed cell death. In
the same study, we also analyzed the effect of cavitation on surgically removed human BPH
(Benign prostatic hyperplesia) tissues and showed that hydrodynamic cavitation with an inlet
pressure 10000 kPa for 15 min causes a penetrating effect into the depth of BPH tissue.

46
Figure 4.16. Effect of hydrodynamic cavitation on mice prostate and bladder tumor tissues.
Tissues were exposed for 5, 10 and 15 min to hydrodynamic cavitation produced by 1034 kPa
injection pressure, then stained with DAPI (upper panel), Calcein/PI (lower panel). Non-exposed
counterpart of tissues was used as control. Similar results were obtained in four independent
experiments.
In line with others and our data in the literature, in this study, we enhanced the capability of our
prototype and analyzed the effects of hydrodynamic cavitation on mouse models of human prostate
and bladder cancer tumors for the first time. Our results strongly indicated that, hydrodynamic
cavitation caused a serious damage to tumor tissues by destroying cellular structure even at a short
time exposure (5 min) and the destructive effect was more significant at longer time periods (10
and 15 min) of cavitation exposure. Cell death mechanisms could be induced by various internal
and external stress factors in tissues and, in fact, these mechanisms are strictly controlled and
regulated via a cascade of cellular proteins and signaling [90]. Since, tumor tissues are solid
structures, the results of our experiments strongly suggest that the short-term effects of cavitation
are similar to necrotic programmed cell death, which is an irreversible mechanism occurring due
to injury, radiation, chemicals, etc. Thus, these biological effects of hydrodynamic cavitation on
both prostate and bladder tumor tissues proved that this technology could have the potential use
for therapeutic applications in cancer.

47
5 CHAPTER FOUR: CONCLUSIONS
5.1 Effect of intensified cavitation on spray characterization
In the first part of this thesis, a transparent quartz nozzle with an inner diameter of 0.9 mm was
utilized to visualize cavitating flows of water inside the nozzle and investigate the effect of
cavitation on spray atomization characteristics in terms of count, size and velocity of the droplets.
Another series of experiments were performed using a suspension of PVA MBs in a nozzle with
modified surfaces to intensify cavitation and examine its influence on the spray. The obtained
conclusions are as follows:
1- Cavitating flows inside the cylindrical nozzle can be classified into the following regimes:
(1) non-cavitation flow; (2) developed cavitation; (3) supercavitation; (4) hydraulic flip.
2- For the case of water, the injection pressures corresponding to cavitation inception,
supercavitation and hydraulic flip are 690, 1035, and 1725 kPa, respectively. Using PVA
MBs lowers the injection pressure for the same flow regimes by 100, 275, and 655 kPa,
respectively.
3- In micro scale, there is not any noticeable difference in the cavitation numbers
corresponding to cavitation inception and hydraulic flip flow condition.
4- Cavitating flow increases the spray cone angle considerably, while using PVA MBs does
not have any significant effect on the spray cone angle. In the hydraulic flip regime, the
spray cone angle drops and it could have a value even smaller than that corresponding to
cavitation inception.
5- For both cases of water and PVA MBs suspension, cavitation enhanced the droplet count.
The number of counted droplets for the case PVA MBs is higher compared to the case of
water, which proves the important effect of PVA MBs and modified surface in enhancing
atomization characteristics of sprays. Supercavitation increases the percentage of droplets
with smaller diameter than 200 µm from 89.2% to 94.9% for the case of water. This
percentage for supercavitation flow is 95.2%, which is roughly the same as the case of
water. Cavitating flow lowers the overall SMD noticeably for both cases, and the overall
SMD is smaller for the case of PVA MBs compared to the case of water.

48
6- Super cavitating flow has a significant influence on increasing the velocity of droplets. For
the case of PVA MBs, in the supercavitation regime, the y component of the velocity of
droplets is larger compared to the case of water.
5.2 Fabrication of a cystoscope for biomedical treatment of urinary stones and cancer
tissues
A biomedical device capable of exploiting the destructive energy of cavitating flows was
designed and developed. The developed device includes a biomedical camera to give visual
feedback during in vivo experiments, a suction system to suck the liquid out after exposure, a
control system to actuate the movement of the cystoscope in different directions, and a probe,
which exposes the cavitating flow on the target.
According to the experiments and numerical simulations, the flow inside the cavitation probe
was under “supercavitation” conditions at the injection pressure of 1034 kPa. A Further increase
in the injection pressure led to “hydraulic flip” regime inside the cavitation probe, which would
cause lower damage compared to the supercavitation conditions. Therefore, the tissue ablating
experiments were carried out at the injection pressure of 1034 kPa. Prostate and bladder cancer
tissues were exposed to cavitating flows for 5, 10, and 15 min. Microscopic images confirmed the
potential of the developed device and cavitation probe in destroying the cancerous tissues within
a short time.
The results of our experiments demonstrated that the developed device possesses a great ability
of precise locating and targeting cavitating flows onto the target for a long time without causing
damage to the healthy organs nearby. It can be concluded that with some slight modifications, the
biomedical device could be considered as a promising alternative to ultrasound devices for
treatment of urinary stones and cancerous tissues.
5.3 Future research directions
Our fabricated device showed a great penitential in exploiting the energy of hydrodynamic
cavitation in targeting and destroying the cancer tissues in a very short time. However, the
developed device needs some modification to make it more user-friendly, so that one operator (the
surgeon) could handle everything alone. A 10-inch touch screen could be integrated to the control

49
system with an interface so that the surgeon can control the direction of the probe and other
command by the use of only a finger.
Figure 5.1. Testing the diameter of the probe and capability of control system in penetrating
and advancing into the urinary system of pig.
For this study, we only performed in vitro experiments. Nonetheless, the fabricated cystoscope
showed a great capability of penetrating and advancing in pig’s urinary system (Figure 5.1). Our
future work is directed toward modifying the current device, making it more user-friendly, and
starting the in vivo experiments.
These studies could be carried out in organ on chips to gain a better understanding of the
interaction between hydrodynamic cavitation and kidney stones or cancer tissues.
Clot on chips could be developed to study the effect of hydrodynamic cavitation on breaking
down the blood clots.

50
BIBLIOGRAPHY
[1] C.E. Brennen, C.E. Brennen, Fundamentals of multiphase flow, Cambridge university
press, 2005.
[2] C.E. Brennen, Cavitation and bubble dynamics, Cambridge University Press, 2014.
[3] J. Ozonek, Application of hydrodynamic cavitation in environmental engineering, CRC
Press, 2012.
[4] Y.-F. Zhou, High intensity focused ultrasound in clinical tumor ablation, World J. Clin.
Oncol. 2 (2011) 8.
[5] C.T. Crowe, Multiphase flow handbook, CRC press, 2005.
[6] W. Bergwerk, Flow pattern in diesel nozzle spray holes, Proc. Inst. Mech. Eng. 173 (1959)
655–660.
[7] C. Mishra, Y. Peles, Cavitation in flow through a micro-orifice inside a silicon
microchannel, Phys. Fluids. 17 (2005) 13601.
[8] C.P. Egerer, S. Hickel, S.J. Schmidt, N.A. Adams, Large-eddy simulation of turbulent
cavitating flow in a micro channel, Phys. Fluids. 26 (2014) 85102.
[9] M. Jia, M. Xie, H. Liu, W.-H. Lam, T. Wang, Numerical simulation of cavitation in the
conical-spray nozzle for diesel premixed charge compression ignition engines, Fuel. 90
(2011) 2652–2661.
[10] F. Payri, V. Bermúdez, R. Payri, F.J. Salvador, The influence of cavitation on the internal
flow and the spray characteristics in diesel injection nozzles, Fuel. 83 (2004) 419–431.
[11] R. Payri, J.M. García, F.J. Salvador, J. Gimeno, Using spray momentum flux measurements
to understand the influence of diesel nozzle geometry on spray characteristics, Fuel. 84
(2005) 551–561.
[12] B. Abderrezzak, Y. Huang, A contribution to the understanding of cavitation effects on
droplet formation through a quantitative observation on breakup of liquid jet, Int. J.
Hydrogen Energy. 41 (2016) 15821–15828.
[13] F. Liu, Z. Li, Z. Wang, X. Dai, X. He, C.-F. Lee, Microscopic study on diesel spray under
cavitating conditions by injecting fuel into water, Appl. Energy. 230 (2018) 1172–1181.
[14] J. Cui, H. Lai, K. Feng, Y. Ma, Quantitative analysis of the minor deviations in nozzle
internal geometry effect on the cavitating flow, Exp. Therm. Fluid Sci. 94 (2018) 89–98.
[15] R. Payri, F.J. Salvador, J. Gimeno, O. Venegas, Study of cavitation phenomenon using
different fuels in a transparent nozzle by hydraulic characterization and visualization, Exp.
Therm. Fluid Sci. 44 (2013) 235–244.
[16] H.K. Suh, C.S. Lee, Effect of cavitation in nozzle orifice on the diesel fuel atomization
characteristics, Int. J. Heat Fluid Flow. 29 (2008) 1001–1009.
[17] A. Sou, S. Hosokawa, A. Tomiyama, Effects of cavitation in a nozzle on liquid jet
atomization, Int. J. Heat Mass Transf. 50 (2007) 3575–3582.
[18] M.T. Shervani-Tabar, S. Parsa, M. Ghorbani, Numerical study on the effect of the cavitation
phenomenon on the characteristics of fuel spray, Math. Comput. Model. 56 (2012) 105–
117.
[19] M. Ghorbani, G. Alcan, A.K. Sadaghiani, A. Mohammadi, M. Unel, D. Gozuacik, A. Koşar,
Characterization and pressure drop correlation for sprays under the effect of micro scale
cavitation, Exp. Therm. Fluid Sci. 91 (2018) 89–102.
[20] R. Payri, F.J. Salvador, J. Gimeno, L.D. Zapata, Diesel nozzle geometry influence on spray
liquid-phase fuel penetration in evaporative conditions, Fuel. 87 (2008) 1165–1176.
[21] S. Som, A.I. Ramirez, S.K. Aggarwal, A.L. Kastengren, E. El-Hannouny, D.E. Longman,

51
C.F. Powell, P.K. Senecal, Development and validation of a primary breakup model for
diesel engine applications, SAE Technical Paper, 2009.
[22] W.H. Nurick, Orifice cavitation and its effect on spray mixing, (1976).
[23] F. Örley, T. Trummler, S. Hickel, M.S. Mihatsch, S.J. Schmidt, N.A. Adams, Large-eddy
simulation of cavitating nozzle flow and primary jet break-up, Phys. Fluids. 27 (2015)
86101.
[24] A. Sou, M.I. Maulana, S. Hosokawa, A. Tomiyama, Ligament formation induced by
cavitation in a cylindrical nozzle, J. Fluid Sci. Technol. 3 (2008) 633–644.
[25] Z. He, W. Zhong, Q. Wang, Z. Jiang, Z. Shao, Effect of nozzle geometrical and dynamic
factors on cavitating and turbulent flow in a diesel multi-hole injector nozzle, Int. J. Therm.
Sci. 70 (2013) 132–143.
[26] Z. He, Z. Shao, Q. Wang, W. Zhong, X. Tao, Experimental study of cavitating flow inside
vertical multi-hole nozzles with different length–diameter ratios using diesel and biodiesel,
Exp. Therm. Fluid Sci. 60 (2015) 252–262.
[27] J.M. Desantes, R. Payri, F.J. Salvador, J. De la Morena, Influence of cavitation phenomenon
on primary break-up and spray behavior at stationary conditions, Fuel. 89 (2010) 3033–
3041.
[28] P.G. Aleiferis, J. Serras-Pereira, A. Augoye, T.J. Davies, R.F. Cracknell, D. Richardson,
Effect of fuel temperature on in-nozzle cavitation and spray formation of liquid
hydrocarbons and alcohols from a real-size optical injector for direct-injection spark-
ignition engines, Int. J. Heat Mass Transf. 53 (2010) 4588–4606.
[29] J. Serras-Pereira, Z. Van Romunde, P.G. Aleiferis, D. Richardson, S. Wallace, R.F.
Cracknell, Cavitation, primary break-up and flash boiling of gasoline, iso-octane and n-
pentane with a real-size optical direct-injection nozzle, Fuel. 89 (2010) 2592–2607.
[30] A.K. Agarwal, S. Som, P.C. Shukla, H. Goyal, D. Longman, In-nozzle flow and spray
characteristics for mineral diesel, Karanja, and Jatropha biodiesels, Appl. Energy. 156
(2015) 138–148.
[31] M. Ghorbani, H. Chen, L.G. Villanueva, D. Grishenkov, A. Koşar, Intensifying cavitating
flows in microfluidic devices with poly (vinyl alcohol)(PVA) microbubbles, Phys. Fluids.
30 (2018) 102001.
[32] M. Ghorbani, A.S. Aghdam, M.T. Gevari, A. Koşar, F.Ç. Cebeci, D. Grishenkov, A.J.
Svagan, Facile hydrodynamic cavitation ON CHIP via cellulose nanofibers stabilized
perfluorodroplets inside layer-by-layer assembled SLIPS surfaces, Chem. Eng. J. 382
(2020) 122809.
[33] A.S. Aghdam, M. Ghorbani, G. Deprem, F.Ç. Cebeci, A. Koşar, A New Method for Intense
Cavitation Bubble Generation on Layer-by-Layer Assembled SLIPS, Sci. Rep. 9 (2019)
11600. https://doi.org/10.1038/s41598-019-48175-4.
[34] R. Xue, Y. Ruan, X. Liu, F. Cao, Y. Hou, The influence of cavitation on the flow
characteristics of liquid nitrogen through spray nozzles: A CFD study, Cryogenics (Guildf).
86 (2017) 42–56. https://doi.org/https://doi.org/10.1016/j.cryogenics.2017.07.003.
[35] D. Li, S. Liu, Y. Wei, R. Liang, Y. Tang, Numerical investigation on transient internal
cavitating flow and spray characteristics in a single-hole diesel injector nozzle: A 3D
method for cavitation-induced primary break-up, Fuel. 233 (2018) 778–795.
https://doi.org/https://doi.org/10.1016/j.fuel.2018.06.103.
[36] M. Ghorbani, C. Sozer, G. Alcan, M. Unel, S. Ekici, H. Uvet, A. Koşar, Biomedical device
prototype based on small scale hydrodynamic cavitation, AIP Adv. 8 (2018) 35108.

52
[37] A. Koşar, M. Şeşen, O. Oral, Z. Itah, D. Gozuacik, Bubbly cavitating flow generation and
investigation of its erosional nature for biomedical applications, IEEE Trans. Biomed. Eng.
58 (2011) 1337–1346.
[38] Z. Itah, O. Oral, O.Y. Perk, M. Sesen, E. Demir, S. Erbil, A.I. Dogan-Ekici, S. Ekici, A.
Kosar, D. Gozuacik, Hydrodynamic cavitation kills prostate cells and ablates benign
prostatic hyperplasia tissue, Exp. Biol. Med. 238 (2013) 1242–1250.
[39] L. Albanese, R. Ciriminna, F. Meneguzzo, M. Pagliaro, Beer-brewing powered by
controlled hydrodynamic cavitation: Theory and real-scale experiments, J. Clean. Prod. 142
(2017) 1457–1470.
[40] B. Schneider, A. Koşar, C.-J. Kuo, C. Mishra, G.S. Cole, R.P. Scaringe, Y. Peles, Cavitation
enhanced heat transfer in microchannels, (2006).
[41] M.T. Gevari, T. Abbasiasl, S. Niazi, M. Ghorbani, A. Koşar, Direct and indirect thermal
applications of hydrodynamic and acoustic cavitation: A review, Appl. Therm. Eng. 171
(2020). https://doi.org/10.1016/j.applthermaleng.2020.115065.
[42] M.T. Gevari, M. Ghorbani, A.J. Svagan, D. Grishenkov, A. Kosar, Energy harvesting with
micro scale hydrodynamic cavitation-thermoelectric generation coupling, AIP Adv. 9
(2019) 105012.
[43] M. Ghorbani, A. Mohammadi, A.R. Motezakker, L.G. Villanueva, Y. Leblebici, A. Koşar,
Energy harvesting in microscale with cavitating flows, ACS Omega. 2 (2017) 6870–6877.
[44] M. Dular, T. Griessler-Bulc, I. Gutierrez-Aguirre, E. Heath, T. Kosjek, A.K. Klemenčič, M.
Oder, M. Petkovšek, N. Rački, M. Ravnikar, Use of hydrodynamic cavitation in (waste)
water treatment, Ultrason. Sonochem. 29 (2016) 577–588.
[45] T. Abbasiasl, S. Niazi, A.S. Aghdam, H. Chen, F.Ç. Cebeci, M. Ghorbani, D. Grishenkov,
A. Koşar, Effect of intensified cavitation using poly(vinyl alcohol) microbubbles on spray
atomization characteristics in microscale, AIP Adv. 10 (2020).
https://doi.org/10.1063/1.5142607.
[46] B. Li, D.-W. Sun, Effect of power ultrasound on freezing rate during immersion freezing of
potatoes, J. Food Eng. 55 (2002) 277–282.
[47] Dw. Zhou, Heat transfer enhancement of copper nanofluid with acoustic cavitation, Int. J.
Heat Mass Transf. 47 (2004) 3109–3117.
[48] J. Cai, X. Huai, S. Liang, X. Li, Augmentation of natural convective heat transfer by
acoustic cavitation, Front. Energy Power Eng. China. 4 (2010) 313–318.
[49] S. Drakopoulou, S. Terzakis, M.S. Fountoulakis, D. Mantzavinos, T. Manios, Ultrasound-
induced inactivation of gram-negative and gram-positive bacteria in secondary treated
municipal wastewater, Ultrason. Sonochem. 16 (2009) 629–634.
[50] N.S.M. Yusof, B. Babgi, Y. Alghamdi, M. Aksu, J. Madhavan, M. Ashokkumar, Physical
and chemical effects of acoustic cavitation in selected ultrasonic cleaning applications,
Ultrason. Sonochem. 29 (2016) 568–576.
[51] R. Hofmann, P. Olbert, J. Weber, S. Wille, Z. Varga, Clinical experience with a new
ultrasonic and LithoClast combination for percutaneous litholapaxy, BJU Int. 90 (2002) 16–
19.
[52] E. Pourian, S. Javanshir, Z. Dolatkhah, S. Molaei, A. Maleki, Ultrasonic-assisted
preparation, characterization, and use of novel biocompatible core/shell Fe3O4@ GA@
isinglass in the synthesis of 1, 4-dihydropyridine and 4 H-pyran derivatives, ACS Omega.
3 (2018) 5012–5020.
[53] M. Ghorbani, O. Oral, S. Ekici, D. Gozuacik, A. Koşar, Review on lithotripsy and cavitation

53
in urinary stone therapy, IEEE Rev. Biomed. Eng. 9 (2016) 264–283.
[54] G.J. Shaw, J.M. Meunier, S.-L. Huang, C.J. Lindsell, D.D. McPherson, C.K. Holland,
Ultrasound-enhanced thrombolysis with tPA-loaded echogenic liposomes, Thromb. Res.
124 (2009) 306–310.
[55] Z. Liu, S. Gao, Y. Zhao, P. Li, J. Liu, P. Li, K. Tan, F. Xie, Disruption of tumor
neovasculature by microbubble enhanced ultrasound: a potential new physical therapy of
anti-angiogenesis, Ultrasound Med. Biol. 38 (2012) 253–261.
[56] M.R. Bailey, V.A. Khokhlova, O.A. Sapozhnikov, S.G. Kargl, L.A. Crum, Physical
mechanisms of the therapeutic effect of ultrasound (a review), Acoust. Phys. 49 (2003) 369–
388.
[57] M. Wan, Y. Feng, G. ter Haar, Cavitation in biomedicine, Springer, 2015.
[58] C.M.C. Tempany, N.J. McDannold, K. Hynynen, F.A. Jolesz, Focused ultrasound surgery
in oncology: overview and principles, Radiology. 259 (2011) 39–56.
[59] K. Hynynen, R.M. Jones, Image-guided ultrasound phased arrays are a disruptive
technology for non-invasive therapy, Phys. Med. Biol. 61 (2016) R206.
[60] A. Payne, U. Vyas, N. Todd, J. de Bever, D.A. Christensen, D.L. Parker, The effect of
electronically steering a phased array ultrasound transducer on near‐field tissue heating,
Med. Phys. 38 (2011) 4971–4981.
[61] C.R. Merritt, Ultrasound safety: what are the issues?, Radiology. 173 (1989) 304–306.
[62] E.J. Halpern, High-intensity focused ultrasound ablation: Will image-guided therapy
replace conventional surgery?, Radiology. 235 (2005) 345–346.
[63] T.U. Rehman, J. Khirallah, E. Demirel, J. Howell, E. Vlaisavljevich, Y. Yuksel Durmaz,
Development of acoustically active nanocones using the host–guest interaction as a new
histotripsy agent, ACS Omega. 4 (2019) 4176–4184.
[64] Y. Yuksel Durmaz, E. Vlaisavljevich, Z. Xu, M. ElSayed, Development of nanodroplets for
histotripsy-mediated cell ablation, Mol. Pharm. 11 (2014) 3684–3695.
[65] J.E. Lingeman, J. Woods, P.D. Toth, A.P. Evan, J.A. McAteer, The role of lithotripsy and
its side effects, J. Urol. 141 (1989) 793–797.
[66] J.A. McAteer, A.P. Evan, The acute and long-term adverse effects of shock wave
lithotripsy, in: Semin. Nephrol., Elsevier, 2008: pp. 200–213.
[67] C.D. Scales, J.C. Lai, A.W. Dick, J.M. Hanley, J. van Meijgaard, C.M. Setodji, C.S. Saigal,
Comparative effectiveness of shock wave lithotripsy and ureteroscopy for treating patients
with kidney stones, JAMA Surg. 149 (2014) 648–653.
[68] C. Mishra, Y. Peles, An experimental investigation of hydrodynamic cavitation in micro-
Venturis, Phys. Fluids. 18 (2006) 103603.
[69] C. Soteriou, R. Andrews, M. Smith, Direct injection diesel sprays and the effect of
cavitation and hydraulic flip on atomization, SAE Trans. (1995) 128–153.
[70] F. Cavalieri, A. El Hamassi, E. Chiessi, G. Paradossi, R. Villa, N. Zaffaroni, Tethering
Functional Ligands onto Shell of Ultrasound Active Polymeric Microbubbles,
Biomacromolecules. 7 (2006) 604–611. https://doi.org/10.1021/bm050723g.
[71] A. Bhattacharya, P. Ray, Studies on surface tension of poly(vinyl alcohol): Effect of
concentration, temperature, and addition of chaotropic agents, J. Appl. Polym. Sci. 93
(2004) 122–130. https://doi.org/https://doi.org/10.1002/app.20436.
[72] Sigma-Aldrich, Poly(vinyl alcohol), version 6.2 safety data sheet, revised 18 January 2015.,
(n.d.).
[73] M. OKAZAKI, K. SHIODA, K. MASUDA, R. TOEI, DRYING MECHANISM OF

54
COATED FILM OF POLYMER SOLUTION, J. Chem. Eng. Japan. 7 (1974) 99–105.
https://doi.org/10.1252/jcej.7.99.
[74] S.V.V.N. Kothapalli, V. Daeichin, F. Mastik, L.A. Brodin, B. Janerot-Sjoberg, G.
Paradossi, N. de Jong, D. Grishenkov, Unique pumping-out fracturing mechanism of a
polymer-shelled contrast agent: an acoustic characterization and optical visualization, IEEE
Trans. Ultrason. Ferroelectr. Freq. Control. 62 (2015) 451–462.
https://doi.org/10.1109/TUFFC.2014.006732.
[75] D. Grishenkov, C. Pecorari, T.B. Brismar, G. Paradossi, Characterization of Acoustic
Properties of PVA-Shelled Ultrasound Contrast Agents: Linear Properties (Part I),
Ultrasound Med. Biol. 35 (2009) 1127–1138.
https://doi.org/https://doi.org/10.1016/j.ultrasmedbio.2009.02.002.
[76] F. Cavalieri, A. El Hamassi, E. Chiessi, G. Paradossi, Stable Polymeric Microballoons as
Multifunctional Device for Biomedical Uses: Synthesis and Characterization, Langmuir.
21 (2005) 8758–8764. https://doi.org/10.1021/la050287j.
[77] A. Hassanzadeh, M. Saadat Bakhsh, A. Dadvand, Numerical study of the effect of wall
injection on the cavitation phenomenon in diesel injector, Eng. Appl. Comput. Fluid Mech.
8 (2014) 562–573.
[78] F. Echouchene, H. Belmabrouk, L. Le Penven, M. Buffat, Numerical simulation of wall
roughness effects in cavitating flow, Int. J. Heat Fluid Flow. 32 (2011) 1068–1075.
[79] M. Ghorbani, A.K. Sadaghiani, M. Yidiz, A. Koşar, Experimental and numerical
investigations on spray structure under the effect of cavitation phenomenon in a
microchannel, J. Mech. Sci. Technol. 31 (2017) 235–247.
[80] B. Mohan, W. Yang, S. Chou, Cavitation in injector nozzle holes–a parametric study, Eng.
Appl. Comput. Fluid Mech. 8 (2014) 70–81.
[81] G.H. Schnerr, J. Sauer, Physical and numerical modeling of unsteady cavitation dynamics,
in: Fourth Int. Conf. Multiph. Flow, ICMF New Orleans, 2001.
[82] S. Patankar, Numerical heat transfer and fluid flow, Taylor & Francis, 2018.
[83] X. Margot, S. Hoyas, A. Gil, S. Patouna, Numerical modelling of cavitation: validation and
parametric studies, Eng. Appl. Comput. Fluid Mech. 6 (2012) 15–24.
[84] A. Andriotis, M. Gavaises, C. Arcoumanis, Vortex flow and cavitation in diesel injector
nozzles, J. Fluid Mech. 610 (2008) 195–215.
[85] B E Launder; D B Spalding, Lectures in Mathematical Models of Turbulence, Academic
Press, London, 1972.
[86] M. Ghorbani, G. Alcan, M. Unel, D. Gozuacik, S. Ekici, H. Uvet, A. Sabanovic, A. Kosar,
Visualization of microscale cavitating flow regimes via particle shadow sizing imaging and
vision based estimation of the cone angle, Exp. Therm. Fluid Sci. 78 (2016) 322–333.
https://doi.org/https://doi.org/10.1016/j.expthermflusci.2016.04.026.
[87] T.R. Ohrn, D.W. Senser, A.H. Lefebvre, Geometrical effects on discharge coefficients for
plain-orifice atomizers, At. Sprays. 1 (1991).
[88] A. Lichtarowicz, R.K. Duggins, E. Markland, Discharge coefficients for incompressible
non-cavitating flow through long orifices, J. Mech. Eng. Sci. 7 (1965) 210–219.
[89] J.C. Kent, G.M. Brown, Nozzle exit flow characteristics for square-edged and rounded inlet
geometries, Combust. Sci. Technol. 30 (1983) 121–132.
[90] C.D. Gregory, C.A. Ford, J.J.L.P. Voss, Microenvironmental effects of cell death in
malignant disease, in: Apoptosis Cancer Pathog. Anti-Cancer Ther., Springer, 2016: pp. 51–
88.


![Influence of cavitation on near nozzle exit spray · [8] Gavaises, M., 2007 Link Between Cavitation Development and Erosion Damage in Diesel Injector Nozzles. SAE paper 2007-01-0246](https://img.dokumen.tips/doc/110x75/5e92b3be382f4f4711475c88/influence-of-cavitation-on-near-nozzle-exit-spray-8-gavaises-m-2007-link-between.jpg)


![Visualization of Unsteady Behavior of Cavitation in ... · cavitation state, transition-cavitation state, and super-cavitation state in the orifice throat [5]. Under relative high](https://img.dokumen.tips/doc/110x75/5b4f673e7f8b9a166e8c4c74/visualization-of-unsteady-behavior-of-cavitation-in-cavitation-state-transition-cavitation.jpg)