Embed Size (px)
Citation preview
EELE 5490, Fall, 2009EELE 5490, Fall, 2009
Wireless CommunicationsWireless Communications
Ali S. Afana
Department of Electrical Engineering
Class 6
Dec. 4th, 2009

OutlineOutline Review
– Propagation mechanism: too theoretical for practice use. concept Reflection Diffraction Scattering
– Log-distance path loss model and log-normal shadowing: too simple
Tradeoff between simplicity and accuracy– Outdoor propagation models– Indoor propagation models
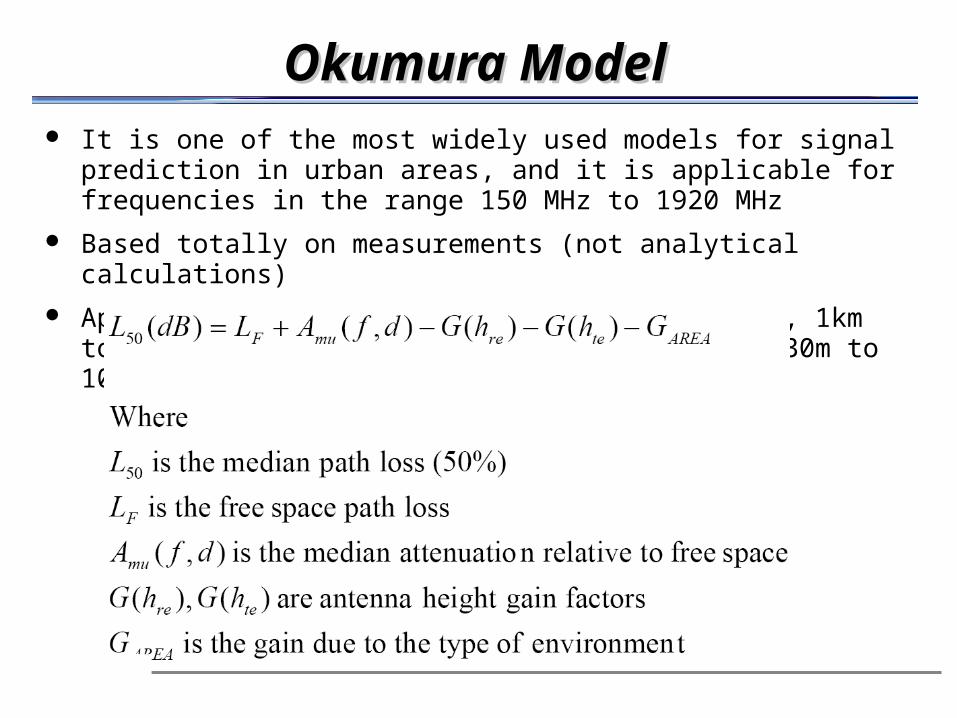
Okumura ModelOkumura Model It is one of the most widely used models for signal prediction in urban areas,
and it is applicable for frequencies in the range 150 MHz to 1920 MHz
Based totally on measurements (not analytical calculations)
Applicable in the range: 150MHz to ~ 2000MHz, 1km to 100km T-R separation, Antenna heights of 30m to 100m
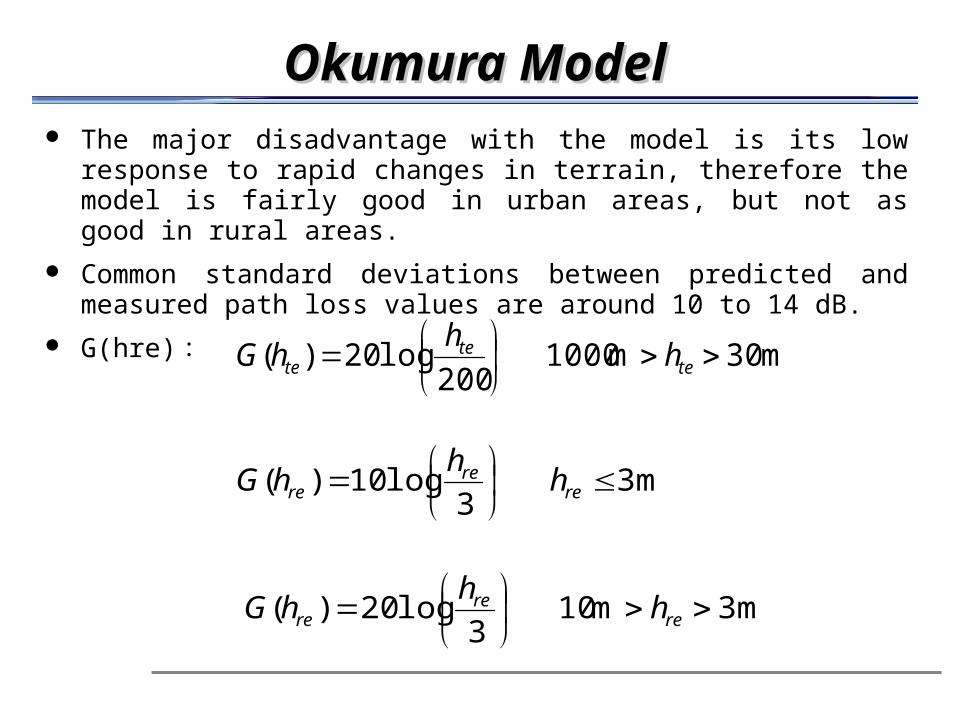
Okumura ModelOkumura Model The major disadvantage with the model is its low response to rapid changes
in terrain, therefore the model is fairly good in urban areas, but not as good in rural areas.
Common standard deviations between predicted and measured path loss values are around 10 to 14 dB.
G(hre):m30m1000
200log20)(
te
tete h
hhG
m33
log10)(
re
rere h
hhG
m3m103
log20)(
re
rere h
hhG
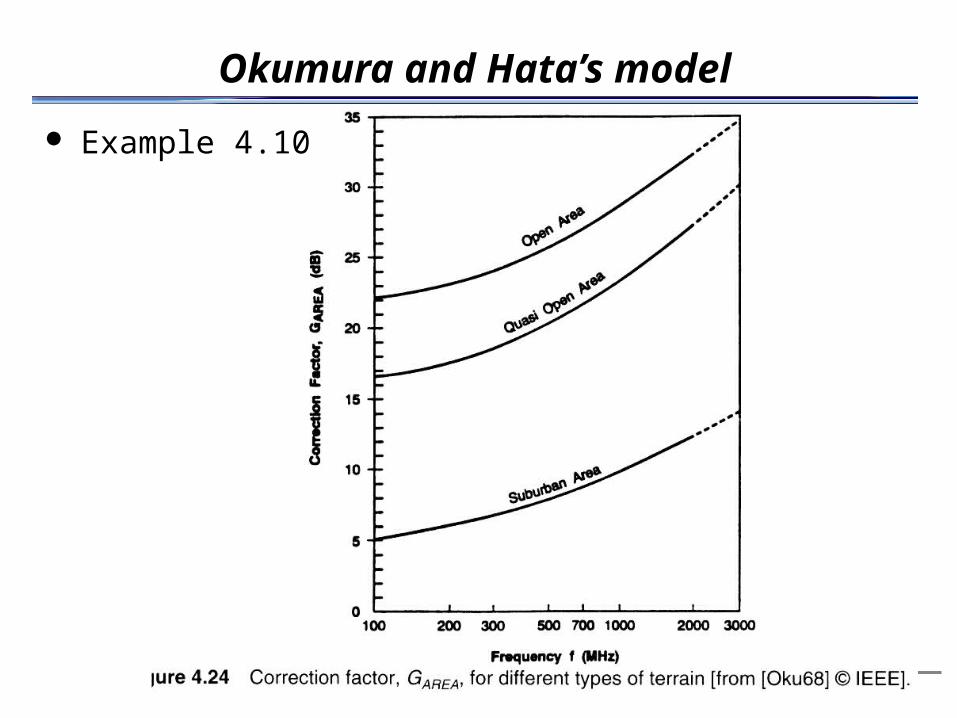
Okumura and Hata’s model
Example 4.10

Hata ModelHata Model Empirical formulation of the graphical data in the Okamura model.
Valid 150MHz to 1500MHz, Used for cellular systems The following classification was used by Hata:
■Urban area
■Suburban area
■Open area
EdBALdB logCdBALdB log
DdBALdB log
bhfA 82.13log16.2655.69
bhB log55.69.44
94.40log33.18)28/log(78.4 2 ffD
4.5))28/(log(2 2 fC
MHzfhE m 300 cities, largefor 97.4))75.11(log(2.3 2
MHzfhE m 300 cities, largefor 1.1))54.1(log(29.8 2
cities small tomediumfor )8.0log56.1()7.0log11.1( fhfE m
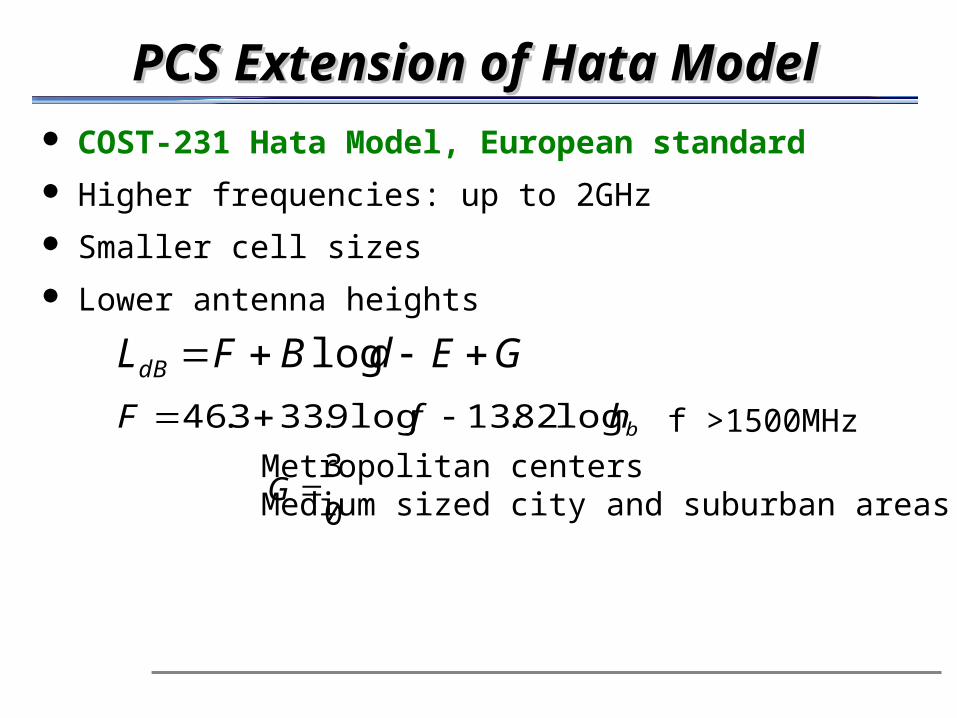
PCS Extension of Hata ModelPCS Extension of Hata Model COST-231 Hata Model, European standard
Higher frequencies: up to 2GHz
Smaller cell sizes
Lower antenna heights
GEdBFLdB log
bhfF log82.13log9.333.46 f >1500MHz
0
3G
Metropolitan centersMedium sized city and suburban areas
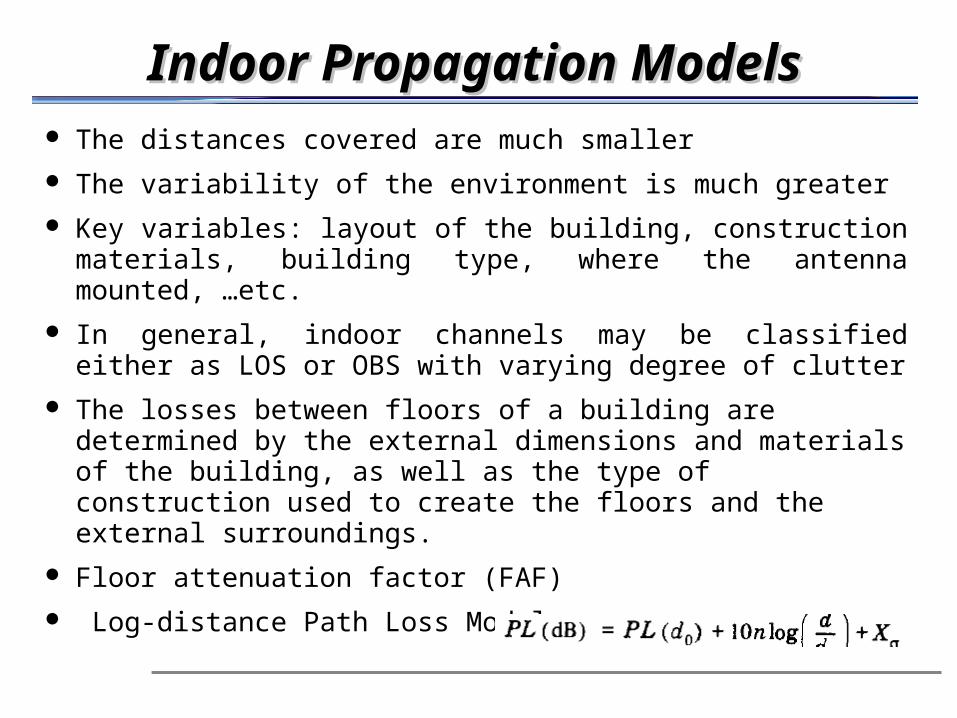
Indoor Propagation ModelsIndoor Propagation Models The distances covered are much smaller
The variability of the environment is much greater
Key variables: layout of the building, construction materials, building type, where the antenna mounted, …etc.
In general, indoor channels may be classified either as LOS or OBS with varying degree of clutter
The losses between floors of a building are determined by the external dimensions and materials of the building, as well as the type of construction used to create the floors and the external surroundings.
Floor attenuation factor (FAF)
Log-distance Path Loss Model
Signal Penetration into BuildingsSignal Penetration into Buildings RF penetration has been found to be a function of frequency as
well as height within the building. Signal strength received inside a building increases with height, and penetration loss decreases with increasing frequency.
Walker’s work shows that building penetration loss decrease at a rate of 1.9 dB per floor from the ground level up to the 15th floor and then began increasing above the 15th floor. The increase in penetration loss at higher floors was attributed to shadowing effects of adjacent buildings.
Some devices to conduct the signals into the buildings
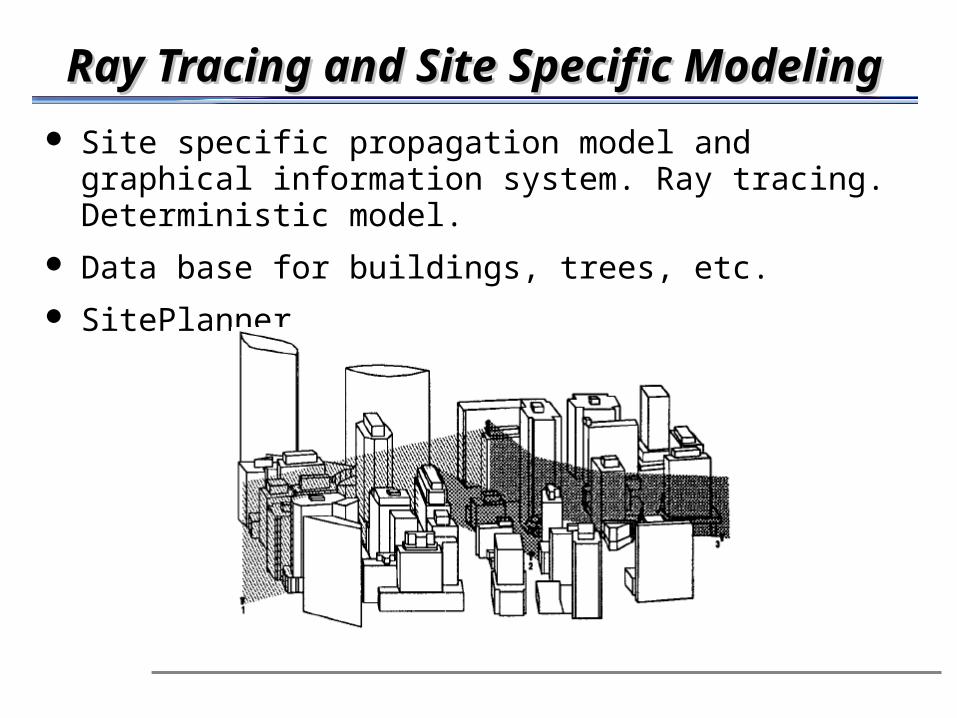
Ray Tracing and Site Specific ModelingRay Tracing and Site Specific Modeling
Site specific propagation model and graphical information system. Ray tracing. Deterministic model.
Data base for buildings, trees, etc.
SitePlanner

HomeworkHomework 4.9
4.15
4.16
4.19
4.25
4.34
Due 19/12/09

Questions?Questions?