Embed Size (px)
Citation preview

1
EDTECH CAPABILITIES AND LEARNING OUTCOMESGlobal Survey | June 2018

2 3
Summary
A survey of 481 education leaders in 10 countries found a link between schools’ EdTech capabilities and their
reported success in driving favorable learning outcomes.
• The survey evaluated 22 evidence-based EdTech capabilities
• The survey asked respondents to indicate their success in achieving or advancing outcomes
including student test scores, teacher satisfaction, school rankings or ratings, and student career
readiness.
• Schools whose leaders indicated high outcomes also reported higher development in all 22
EdTech capabilities, especially those related to strategic and collaborative technology planning.
Not all EdTech capabilities showed an equal impact on outcomes.
• Some capabilities were more strongly correlated to better outcomes. Leaders who reported high
outcomes in their schools were more likely to:
• Have detailed technology visions and plans
• Involve teachers and students in technology planning
• Formally evaluate their technology’s effectiveness
• On average, schools are less developed in several of the capabilities that show the greatest
relative impact.
• On average, schools are also not prioritizing several of the capabilities that show the greatest
relative impact.
High- and low-outcomes respondents prioritized EdTech capabilities differently.
• High-outcomes respondents placed a much higher priority on leadership vision and
stakeholder alignment.
High- and low-outcomes respondents indicated differences in their technology mix.
• High-outcomes schools indicated using more software relating to assessment, game-based
learning and student collaboration.
The USA and China showed the highest stage of EdTech capability development. The UK, Spain, Germany and
Canada fell near the mean, while respondents from the Netherlands indicated a stage of development slightly
below the mean.
Research has shown that well-implemented EdTech can reduce costs in other areas.
A 2016 study showed that technology drives better learning outcomes when it is chosen to complement defined
teaching practices.
The research continues online. Add your voice to the dialogue at www.smarttech.com/profile
Introduction
A survey of 481 education leaders in 10 countries found a link between schools’ EdTech
capabilities and their reported success in driving favorable learning outcomes.
Survey respondents who reported a high stage of development in 22 EdTech capabilities were
more likely to indicate increased student test scores, improved school rankings/ratings, high
teacher satisfaction, and advanced student readiness and digital competencies. Conversely,
leaders who reported less developed EdTech capabilities indicated lower levels of success in
these outcomes.
The survey also found that some learning capabilities have a greater relative impact on
outcomes. Globally, the capabilities with the greatest relative impact are also those that many
schools are challenged in executing or are not prioritizing.
The survey also revealed that the 19% of schools who achieved high learning outcomes
prioritize the 22 capabilities very differently from the 14% of schools who reported low
outcomes. These two groups of schools also showed different approaches to their classroom
technology mix, with the high-outcomes group favoring technologies that promote progressive,
student-centered pedagogies.

4 5
A link between EdTech capabilities and outcomes
The survey polled leaders of one or more schools and asked them to evaluate their institutions’ stage of
development in 22 EdTech capabilities.
On average, survey respondents reported their mean stage of EdTech capability development at 63.03 on a scale
of 100. They also indicated which capabilities they consider most important.
These EdTech capabilities are evidence-based and were identified through a literature review of education best
practices, qualitative research with 17 education leaders, and input from 14 education technology consultants.
Secondary sources for education and EdTech best practices included the Friday Institute for Educational
Innovation, ISTE NAACE, European Digital Competencies, UNESCO, CASEL, and many more.
Learning outcomes
Survey participants were also asked to provide their perspective on the outcomes they see in their schools.
Survey respondents evaluated:
1. The extent to which their schools met teaching and learning goals in the past year
2. The extent to which students’ average test scores improved in the past year
3. Teacher satisfaction in their schools over the past year
4. Change in their schools’ rankings or ratings upon last review
5. The extent to which their schools met technology implementation and adoption goals in the past year
6. Level of student preparedness to be active contributors to society and grow their well-being, life and
social skills
The survey found that respondents at a high stage of EdTech capability development reported higher
achievement and improvement in outcomes.
OUTCOMES ACCORDING TO STAGE OF DEVELOPMENT IN ALL 22 EDTECH CAPABILITIES
The group with the highest learning outcomes, which made up 19% of the respondents, performed significantly
better than the group with the lowest outcomes, which represented 14% of respondents (see Appendix B).
STRATEGIC TECHNOLOGY PLANNING
• Leadership vision and stakeholder alignment
• Strategic planning
• Technology change management
• Evaluation of technology and implementation effectiveness
• Teacher participation in technology planning
• Student participation in technology planning
• Parent and wider community engagement
• Acceptable technology use policies
INTEGRATION OF TECHNOLOGY IN TEACHING AND LEARNING
• Embedding technology in teaching and learning
• Use of digital content and applications
• Assessment of student progress
• Support for Social and Emotional Learning
• Development of teacher and staff mindset
PROFESSIONAL DEVELOPMENT
• Professional development planning
• Focus of professional learning
• Training offerings and options
• Evaluation of professional development effectiveness
• Opportunities for collaborative professional development
TECHNOLOGY INFRASTRUCTURE
AND MANAGEMENT
• Network infrastructure
• Design of learning spaces
• Technical support
• Compatibility of learning technologies
22 EDTECH CAPABILITIES
0%
20%
40%
60%
80%
100% Met or exceeded
EdTech adoption goals
Met or exceeded teaching/learning goals
Greatly or satisfactorily improved test scores
Greatly or satisfactorily improved school ranking/rating
Students well prepared for life and career
Teacher satisfaction
EdTech implementations consistently successful
OVERALL STAGE OF DEVELOPMENT FOR ALL 22 CAPABILITIES
Very Low Low Moderate High Very High

6 7
Differences in EdTech capability of high- and low-outcomes respondents
High-outcomes schools indicate a higher stage of development in all 22 capabilities versus low-outcomes
schools, with the greatest discrepancies in the areas of:
• Student participation in technology planning
• Leadership vision and stakeholder alignment
• Strategic planning
• Teacher participation in technology planning
• Support for Social Emotional Learning
• Evaluation of technology and implementation effectiveness
PERCENT DIFFERENCE IN EDTECH CAPABILITY DEVELOPMENT IN HIGH- AND LOW-OUTCOMES RESPONDENTS
Not all EdTech capabilities have equal impact on outcomes
The survey found that some EdTech capabilities have a greater relative impact on outcomes than others. This was
determined by correlating the relationship between each capability and respondents’ outcomes scores, based
on whether and how much the variables moved together. All 22 correlations were positive and significant at the
.01 level, but some more than others.
The three capabilities that showed the highest relative impact on outcomes, indicated by the size of the circles in
the graph, were:
• Evaluation of technology and implementation effectiveness
• Strategic planning
• Leadership vision and stakeholder alignment
EDTECH CAPABILITY DEVELOPMENT, IMPORTANCE AND IMPACT ON OUTCOMES
We observed an interesting trend in capabilities that showed high impact but for which respondents indicated
lower capability and priority (shaded oval). These indicate that schools may benefit from developing capabilities
related to strategy and planning, especially:
• Evaluation of technology and implementation effectiveness
• Strategic planning
• Leadership vision and stakeholder alignment
• Technology change management
Very Low
Low
Mod
erat
eH
igh
Low Moderate High Very High
Development of teacher and sta� mindset
Acceptable technology use policies
Parent and wider community engagement
Opportunities for collaborative professional development
Compatibility of learning technologies
Student participation in technology planningLeadership vision and stakeholder alignment
Evaluation of technology and implementation e�ectiveness
Technology change management
Training o�erings and options
Evaluation of professional development e�ectiveness
Technical support
Teacher participation in technology planning
Strategic planning
Network infrastructure
Design of learning spacesFocus of professional learning
Professional development planning
Use of digital content and applications
Support for Social and Emotional Learning
Assessment of student progress
Embedding technology in teaching and learning
Leadership vision and stakeholdh
gy and impleon o
Technology change managemenn
ons
of technolog
Teacher participation in technologT o
Evaluatio
Strategic pS
ning
0% 10% 20% 30% 40% 50% 60%
0%
Leadership vision and stakeholder alignment
Strategic planning
Technology change management
Evaluation of technology and implementation effectiveness
Teacher participation in technology planning
Student participation in technology planning
Parent and wider community engagement
Acceptable technology use policies
Embedding technology in teaching and learning
Use of digital content and applications
Assessment of student progress
Support for Social and Emotional Learning
Development of teacher and staff mindset
Professional development planning
Focus of professional learning
Training offerings and options
Evaluation of professional development effectiveness
Opportunities for collaborative professional development
Network infrastructure
Design of learning spaces
Technical support
Compatibility of learning technologies
Average % difference
Very Low
PRIORITY GIVEN BY RESPONDENTS
RE
SP
ON
DE
NT
S’ S
TA
GE
OF
CA
PA
BIL
ITY
DE
VE
LOP
ME
NT
Low Moderate High Very High
Low
Mo
de
rate
Hig
h

8 9
Another trend in the data indicates that collaboration in the technology planning process may be an area of
opportunity for schools, particularly in capabilities related to:
• Student participation in technology planning
• Teacher participation in technology planning
This data also tells us that schools are, on average, not giving high enough priority to some high-impact
capabilities, including:
• Development of teacher and staff mindset
• Opportunities for collaborative professional development
• Acceptable technology use policies
What high- and low-outcomes respondents are doing differently
The survey data provides compelling clues about what may make the difference between schools who are
successful in their EdTech implementations and those who struggle.
Differences in technology used by high- and low-outcomes schools
We observed trends in the types of technologies used by high- and low-outcomes respondents. High-outcomes
respondents reported more student assessment and collaboration software use than low-outcomes schools. This
may reveal a tendency among high-outcomes schools to use student-centered pedagogies.
TYPES OF SOFTWARE USED BY HIGH- AND LOW-OUTCOMES RESPONDENTS
Differences in how capabilities are prioritized
High-outcomes respondents placed a much higher priority on leadership vision and stakeholder alignment, as
well as on professional development planning.
Low-outcomes respondents, on the other hand, placed a much higher value on evaluating the effectiveness of
professional development.
HOW HIGH- AND LOW-OUTCOMES RESPONDENTS PRIORITIZED THE 22 CAPABILITIES
High Outcomes Group
Low Outcomes Group
22 CAPABILITIES PRIORITY
Embedding technology in teaching and learning 1 1
Use of digital content and applications 2 2
Leadership vision and stakeholder alignment 3 14
Assessment of student progress 4 3
Strategic planning 5 5
Network infrastructure 6 10
Professional development planning 7 17
Evaluation of technology and implementation effectiveness 8 4
Technology change management 9 6
Teacher participation in technology planning 10 9
Focus of professional learning 11 19
Design of learning spaces 12 13
Training offerings and options 13 8
Support for Social and Emotional Learning 14 11
Student participation in technology planning 15 14
Compatibility of learning technologies 16 16
Evaluation of professional development effectiveness 17 7
Technical support 18 12
Development of teacher and staff mindset 19 18
Opportunities for collaborative professional development 20 22
Acceptable technology use policies 21 20
Parent and wider community engagement 22 21
High Outcomes
Low Outcomes
0%
10%
20%
30%
40%
50%
60%
Content creation software
Presentation tools
Multimedia content/tools
Student collaboration
software
Whole-class collaboration
software
Assessment software
Game-based lesson
software
Content creation software
Presentation tools
Multimedia content/tools
Student collaboration
software
Whole class collaboration
software
Assessment software
Game-based lesson
software
10 11
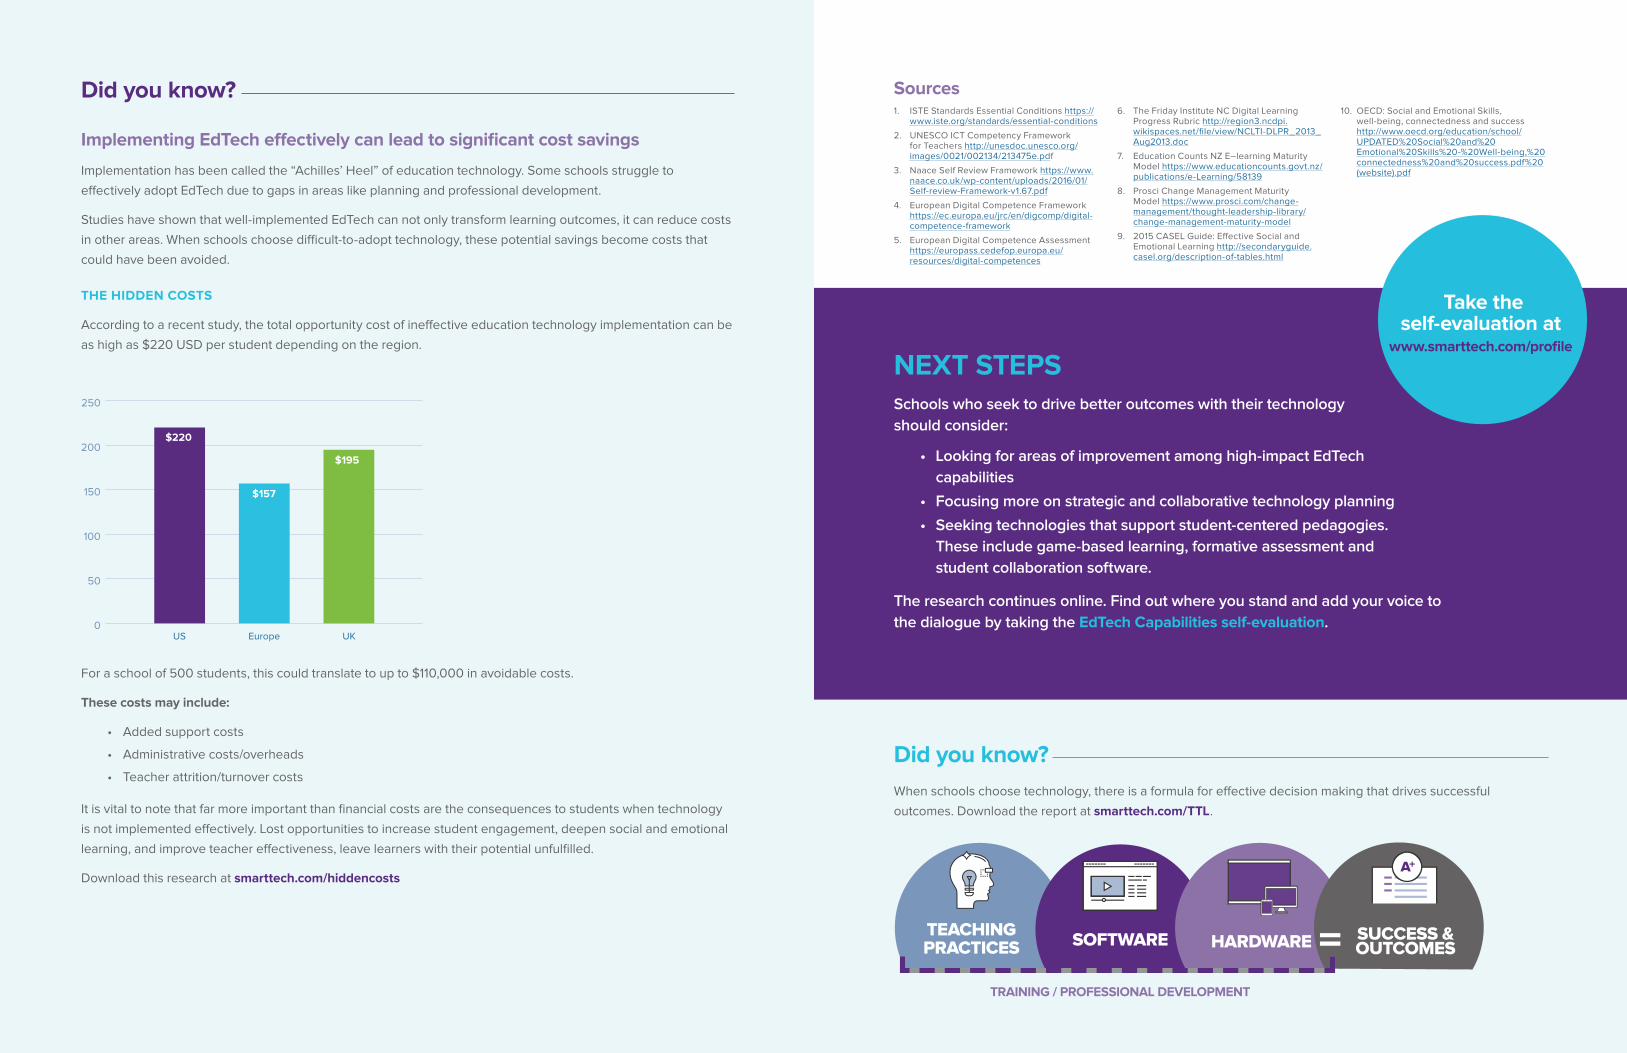
NEXT STEPSSchools who seek to drive better outcomes with their technology
should consider:
• Looking for areas of improvement among high-impact EdTech
capabilities
• Focusing more on strategic and collaborative technology planning
• Seeking technologies that support student-centered pedagogies.
These include game-based learning, formative assessment and
student collaboration software.
The research continues online. Find out where you stand and add your voice to
the dialogue by taking the EdTech Capabilities self-evaluation.
= TEACHING PRACTICES SOFTWARE HARDWARE SUCCESS &
OUTCOMES
A
Sources1. ISTE Standards Essential Conditions https://
www.iste.org/standards/essential-conditions
2. UNESCO ICT Competency Framework for Teachers http://unesdoc.unesco.org/images/0021/002134/213475e.pdf
3. Naace Self Review Framework https://www.naace.co.uk/wp-content/uploads/2016/01/Self-review-Framework-v1.67.pdf
4. European Digital Competence Framework https://ec.europa.eu/jrc/en/digcomp/digital-competence-framework
5. European Digital Competence Assessment https://europass.cedefop.europa.eu/resources/digital-competences
6. The Friday Institute NC Digital Learning Progress Rubric http://region3.ncdpi.wikispaces.net/file/view/NCLTI-DLPR_2013_Aug2013.doc
7. Education Counts NZ E–learning Maturity Model https://www.educationcounts.govt.nz/publications/e-Learning/58139
8. Prosci Change Management Maturity Model https://www.prosci.com/change-management/thought-leadership-library/change-management-maturity-model
9. 2015 CASEL Guide: Effective Social and Emotional Learning http://secondaryguide.casel.org/description-of-tables.html
10. OECD: Social and Emotional Skills, well-being, connectedness and success http://www.oecd.org/education/school/UPDATED%20Social%20and%20Emotional%20Skills%20-%20Well-being,%20connectedness%20and%20success.pdf%20(website).pdf
TRAINING / PROFESSIONAL DEVELOPMENT
Take the self-evaluation at
www.smarttech.com/profile
Did you know?
When schools choose technology, there is a formula for effective decision making that drives successful
outcomes. Download the report at smarttech.com/TTL.
Did you know?
Implementing EdTech effectively can lead to significant cost savings
Implementation has been called the “Achilles’ Heel” of education technology. Some schools struggle to
effectively adopt EdTech due to gaps in areas like planning and professional development.
Studies have shown that well-implemented EdTech can not only transform learning outcomes, it can reduce costs
in other areas. When schools choose difficult-to-adopt technology, these potential savings become costs that
could have been avoided.
THE HIDDEN COSTS
According to a recent study, the total opportunity cost of ineffective education technology implementation can be
as high as $220 USD per student depending on the region.
For a school of 500 students, this could translate to up to $110,000 in avoidable costs.
These costs may include:
• Added support costs
• Administrative costs/overheads
• Teacher attrition/turnover costs
It is vital to note that far more important than financial costs are the consequences to students when technology
is not implemented effectively. Lost opportunities to increase student engagement, deepen social and emotional
learning, and improve teacher effectiveness, leave learners with their potential unfulfilled.
Download this research at smarttech.com/hiddencosts
0
50
100
150
200
250
US Europe UK
$220
$157
$195
US Europe UK

12 13
Geographic differences
Survey participants
Participants were responsible for various areas of technology management in one or several schools, with a variety of
student ages in primary and secondary education represented.
PARTICIPATING COUNTRIES
DIFFERENCES IN AVERAGE EDTECH CAPABILITY DEVELOPMENT BY COUNTRY
APPEN
DIX
C
anad
a
Engl
and
Ger
man
y
Net
herla
nds
Rest
of U
K
Spa
in
USA
Chi
na
Total50%
53%
56%
59%
62%
65%
68%
61.32 61.50 61.53
59.99
62.6461.98
67.57 67.52
63.03
EdTech Capability Development
Total
Ca
na
da
En
gla
nd
Ge
rma
ny
Ne
the
rla
nd
s
Re
st o
f U
K
Sp
ain
US
A
Ch
ina
To
tal
Canada 12%Wales 4%
China 14%
USA 12%
Spain 14%
Scotland 6%
England 11%
Germany 13%
Netherlands 13%
Northern Ireland 1%
14 15
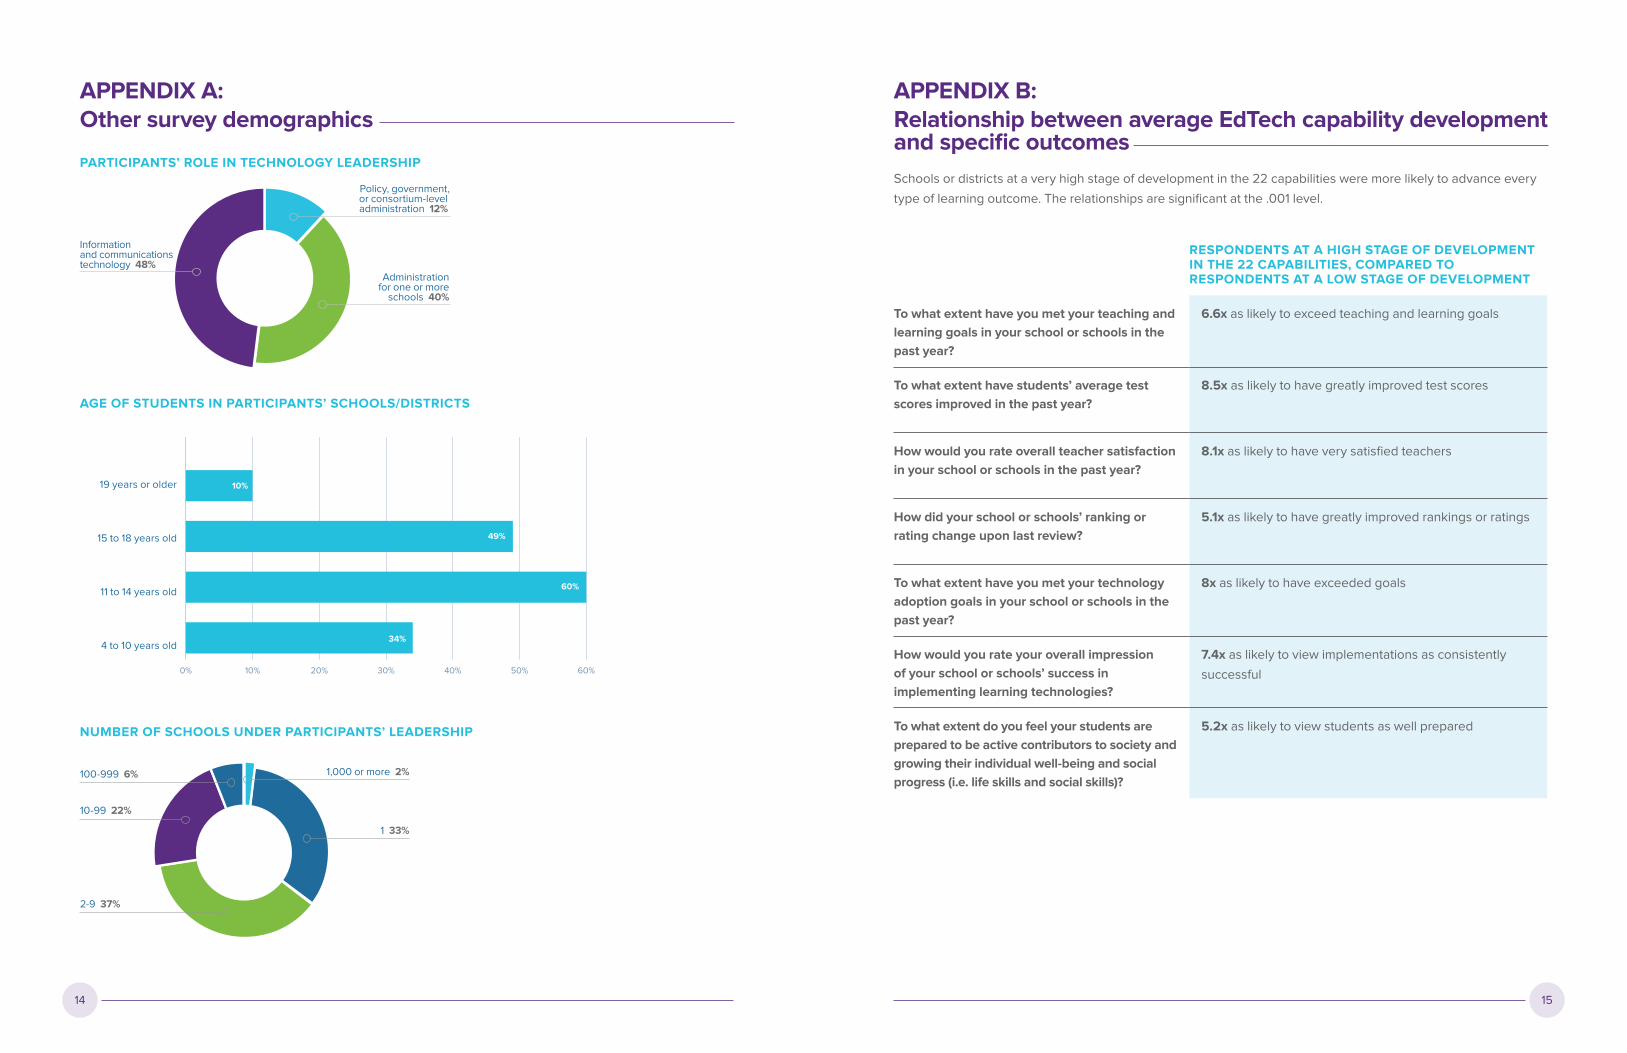
RESPONDENTS AT A HIGH STAGE OF DEVELOPMENT IN THE 22 CAPABILITIES, COMPARED TO RESPONDENTS AT A LOW STAGE OF DEVELOPMENT
To what extent have you met your teaching and
learning goals in your school or schools in the
past year?
6.6x as likely to exceed teaching and learning goals
To what extent have students’ average test
scores improved in the past year?
8.5x as likely to have greatly improved test scores
How would you rate overall teacher satisfaction
in your school or schools in the past year?
8.1x as likely to have very satisfied teachers
How did your school or schools’ ranking or
rating change upon last review?
5.1x as likely to have greatly improved rankings or ratings
To what extent have you met your technology
adoption goals in your school or schools in the
past year?
8x as likely to have exceeded goals
How would you rate your overall impression
of your school or schools’ success in
implementing learning technologies?
7.4x as likely to view implementations as consistently
successful
To what extent do you feel your students are
prepared to be active contributors to society and
growing their individual well-being and social
progress (i.e. life skills and social skills)?
5.2x as likely to view students as well prepared
APPENDIX B: Relationship between average EdTech capability development and specific outcomes
Schools or districts at a very high stage of development in the 22 capabilities were more likely to advance every
type of learning outcome. The relationships are significant at the .001 level.
APPENDIX A: Other survey demographics
PARTICIPANTS’ ROLE IN TECHNOLOGY LEADERSHIP
AGE OF STUDENTS IN PARTICIPANTS’ SCHOOLS/DISTRICTS
NUMBER OF SCHOOLS UNDER PARTICIPANTS’ LEADERSHIP
0% 10% 20% 30% 40% 50% 60%
10%
49%
60%
34%
19 years or older
15 to 18 years old
11 to 14 years old
4 to 10 years old
100-999 6% 1,000 or more 2%
Administration for one or more
schools 40%
Policy, government, or consortium-level administration 12%
Information and communications technology 48%
1 33%
10-99 22%
2-9 37%

16
© 2018 SMART Technologies. All rights reserved.