Embed Size (px)
Citation preview

ED-PIP Wave 4: Team Lead Training
April 2011
Ontario Ministry of Health and Long Term Care
Introduction to Value Stream Mapping
Session Learning Objectives
1
Session Objectives
By the end of this session, you should be able to…
Lead a value stream mapping session
Determine value added steps and waste
Identify and prioritize high level opportunities for improvement
Time
1.25 hours
Module
Introduction to Value Stream
Mapping
Topic Area
Lean Concepts and
Tools

Value Stream Mapping – Overview
• A value stream map (VSM) is a pictorial representation of how things flow
through the system from beginning to end (e.g., patient flow, information
flow, lab request flow).
• It is used to highlight any inefficiencies in the current system (i.e., waste,
flow issues, examples of variability)
• A VSM provides a great framework for opportunity identification and
solution development
Allows the team to “See the
flow” of the value stream and
wastes in the flow
2
11
Work
ing D
raft -
Last M
odifie
d 1
1/0
7/2
00
7 9
:18
:16
PM
Prin
ted 2
4/0
6/2
00
7 3
:18
:33
PM
Admissions process map (1 of 2)
Source: Team analysis
Related Activities
Admissions process step
End of Admissions process
Additional
diagnostics
conducted
Additional
diagnostics
conducted
• Communication
process re DTAis
inconsistent
• There is no flag
that a patient is
being admitted
• Communication
process re DTAis
inconsistent
• There is no flag
that a patient is
being admitted
• Phone on floor may be busy
• Unit clerk may be slow to
tell Admitting about an
open bed
• Decision is subject to
discharges, priorities,
transfers, and workload
• Phone on floor may be busy
• Unit clerk may be slow to
tell Admitting about an
open bed
• Decision is subject to
discharges, priorities,
transfers, and workload
• There is no standard
form for communicating
requirements –
sometimes key info is
missing
• Phone in admitting may
be busy
• There is no standard
form for communicating
requirements –
sometimes key info is
missing
• Phone in admitting may
be busy
Patient
discharged
from ED
Patient
discharged
from ED
0 – 2+ days
Admission
ordered
Admission
ordered
20 seconds
ED Clerk
notified
ED Clerk
notified
30 seconds
Admissions
Clerk notified
Admissions
Clerk notified
30 seconds
Inpatient
record created
Inpatient
record created
60 seconds
Unit Clerk
notified
Unit Clerk
notified
15 – 20 minutes
Bed
assignment
negotiated
Bed
assignment
negotiated
30 seconds
ED Charge
Nurse notified
of assignment
ED Charge
Nurse notified
of assignment
2 3 4 5 6 71
• Bed Clerk lacks transparency into discharges
• Bed Clerk may batch notification to ED Charge
Nurse if multiple upcoming beds
• Bed assignment may be re-worked if:
• Incomplete/ incorrect info
• Change in priorities for Admitting or Unit
• Change in patient condition / needs
• Unit Clerk may ask Admitting Clerk not to tell ED
of assignment to prevent calls from ED staff
• May be either
Senior Resident
or Consultant
• Senior MD may
delegate to
junior colleague
without decision-
making authority
• MD usually tells
ED Nurse to tell
ED Clerk
• MD may write
orders in chart
and not tell
anyone
• MD may call
Admitting
directly and
bypass ED
Nurse and ED
Clerk
• ED Clerk calls
Admissions
Clerk with key
info (e.g.,
precautions,
special care
needs, tests
booked
• Admitting Clerk
schedules
patient in
Registration
system
• ED Clerk creates
admission
package (e.g.
arm band,
paperwork)
• Admission Clerk
calls with name,
Pin #, and
special
requirements
• Unit Clerk notes
patient in Red
Book
• Admissions
Clerk and Unit
Clerk negotiate
placement and
transfer time
• If bed not ready,
Unit Clerk may
give estimated
time for transfer
• Admitting Clerk
calls ED Charge
Nurse (on
dedicated
phone) to share
assignment
n/ a
0 – 15 min 0 – 10 min 0 – 15 min0 – 30 min0 – 30 min
DRAFT
0 – 5 min
ED lacks
transparency on
timing of transfer
(e.g., 80% of time
Unit Clerk does not
give estimated time)
ED lacks
transparency on
timing of transfer
(e.g., 80% of time
Unit Clerk does not
give estimated time)
11
Work
ing D
raft -
Last M
odifie
d 1
1/0
7/2
00
7 9
:18
:16
PM
Prin
ted 2
4/0
6/2
00
7 3
:18
:33
PM
Use of zeros after
decimals (1.0 mg) in
written orders
Use of zeros after
decimals (1.0 mg) in
written orders
Root cause analysis
Respiratory depression in
elderly ED patient
Morphine overdose
(10 mg instead of 1 mg)
Order not clarifiedOrder not clarified Lack of independent double check
for narcotic administration
Lack of independent double check
for narcotic administration
Lack of awareness of
dangerous
abbreviations and dose
designations
Lack of awareness of
dangerous
abbreviations and dose
designations
Lack of widespread
implementation of “Do
Not Use” abbreviation
lists
Lack of widespread
implementation of “Do
Not Use” abbreviation
lists
Previous experience with
administering 10 mg dose
without incident.
Previous experience with
administering 10 mg dose
without incident.
Environmental
distractions
Environmental
distractionsOrganizational
culture
Organizational
culture
Physician
attending to acute
MI patient
Physician
attending to acute
MI patient
ED preparing for
concurrent arrival of
two CTAS I patients.
ED preparing for
concurrent arrival of
two CTAS I patients.
Lack of
experience with
morphine dosing
in elderly patients
Lack of
experience with
morphine dosing
in elderly patients
New gradNew grad Orientation
process
Orientation
process
EXAMPLE
Problem
Why No. 1
Why No. 2
Why No. 3
Why No. 4
Why No. 5
Step 2: ID Root Cause
Source: McKinsey9
Wo
rkin
g D
raft -
La
st M
od
ified
19
/02
/20
08
4:0
5:5
5 P
MP
rinte
d 2
2/0
7/2
00
7 1
:55
:41
PM
Main ED Opportunities
Opportunity Possible solution
Ease of
implementation
High
Low
Physicians Nurses
Sr
Admin Clerks
Key stakeholders
Improve ED
LOS for CTAS
IV patients
Improve ED LOS
for CTAS III
patients
• Implement Rapid Assessment Zone (RAZ)
Patient
benefit
• Improve utilization of existing Fast Track
• Ensure appropriate staffing, resources, etc
provided for fast track
Reduce door to
doctor time• Implement broader set of medical directives
• Increase compliance to existing directives
Quick wins • Re-number rooms
• Remove wasted time with binders
• Amend visitor policy to ensure no visitors
during shift change
• Targeted 5S tasks
Other
1
2
3
5
Improve Lab/ DI
processes
• tbd4
DRAFT
Performance
Management
Operational
improvements
Culture and
capabilities
communicationOverviewSolution
designDiagnostic
Control and
Roll-out
Pilot and
ImplementationPrepare
Performance
Management
Operational
improvements
Culture and
capabilities
communicationOverviewSolution
designDiagnostic
Control and
Roll-out
Pilot and
ImplementationPrepare
100
Example #2: Patient Discharge
Diagnostic Phase: Guides TEMPLATE
Deliver care
PatientDischargePatient dischargePatient discharge papersNurse
NursePatient discharge papersDischarge decision /
activities
Discharge decisionWard Clerk
Ward ClerkDischarge Disposition
Decision
Assign bed and admissions
Patient Assessment
Triage / ReceptionPatient info / symptomsPatient
CustomerOutputProcessInputSupplier
Notes:ØFor this example, the first 4 process steps were linked together into one step for the high level process
ØThe Customer must be the Supplier for the next row down: Ward Clerk is the first Customer and the
second Supplier
ØGenerally, the output becomes the input for the next row down: Discharge decision is the first Output and
the second Input
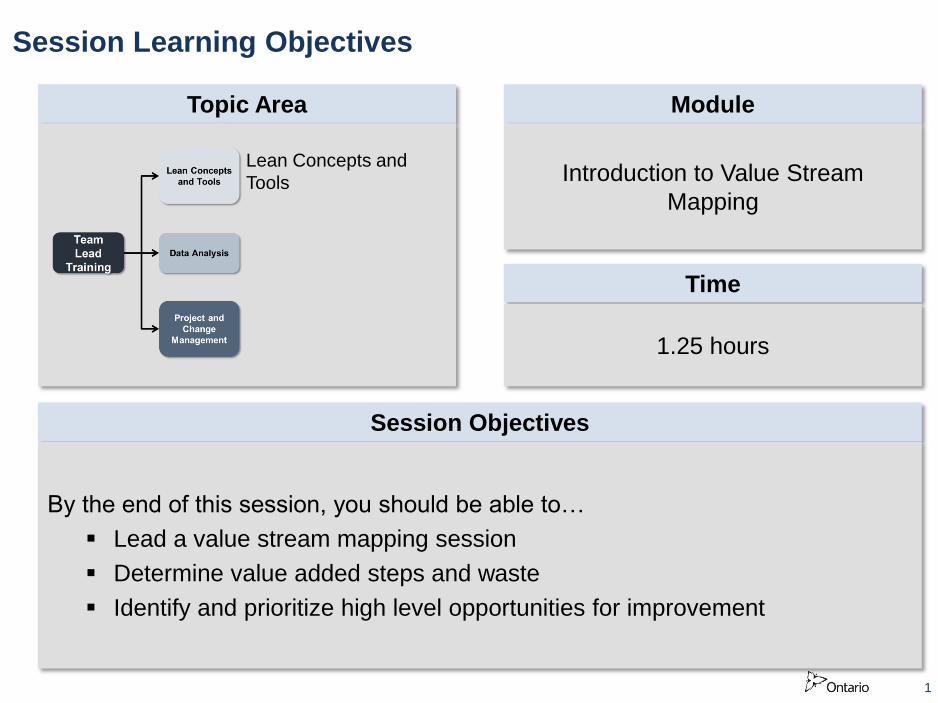
SIPOC Value Stream
Map Opportunities
Root Cause
Analysis
What are the highest
impact opportunities
for improving the
process?
What is the root
cause of the
problem?
How does the process
currently work?
How does a Value Stream Map fit into the approach?
3
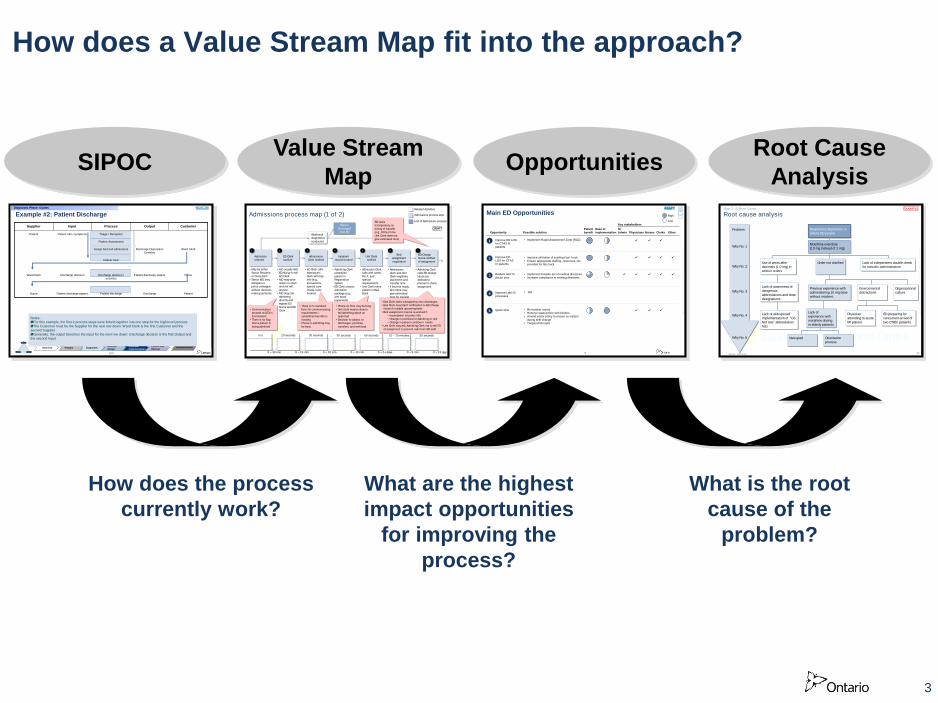
Waste can occur at any step in a process
4
Value added
(for the
patient)
• Activities performed to meet the
customer (or patient’s) requirements
• Steps must be important to the
customer, they must change the thing
going through the process and they
must be done right the first time
Value added
(for the
organization)
Waste
• Steps are required due to legal,
fiduciary, fiscal, compliance, etc
reasons
• Contributes to running the
organization and is indirectly providing
value to the customer
• Steps do not contribute directly to
fulfilling customer needs
Steps in any process can be…
Our goal is to…
• Eliminate waste
• Minimize the time
required to do
organization
value-added steps
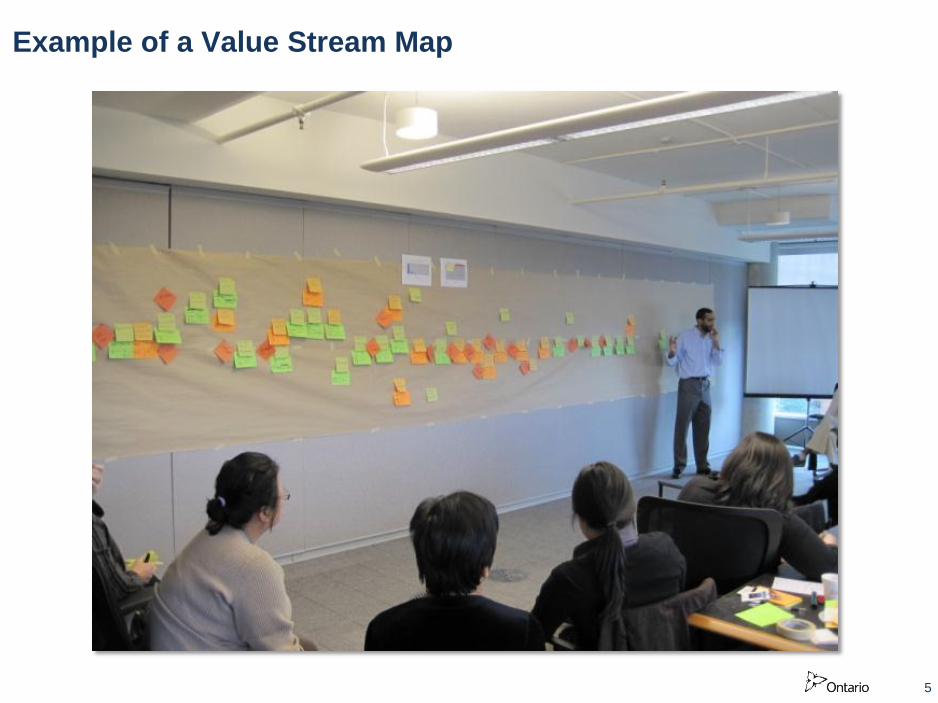
Example of a Value Stream Map
5

Example: Testing a blood sample
6
STEP 1: Define customer requirements
Who are our customers?
What do they want?
When do they want it?
Customer
Requirements
Lab results need to
be accurate
Urgent need for
results asap
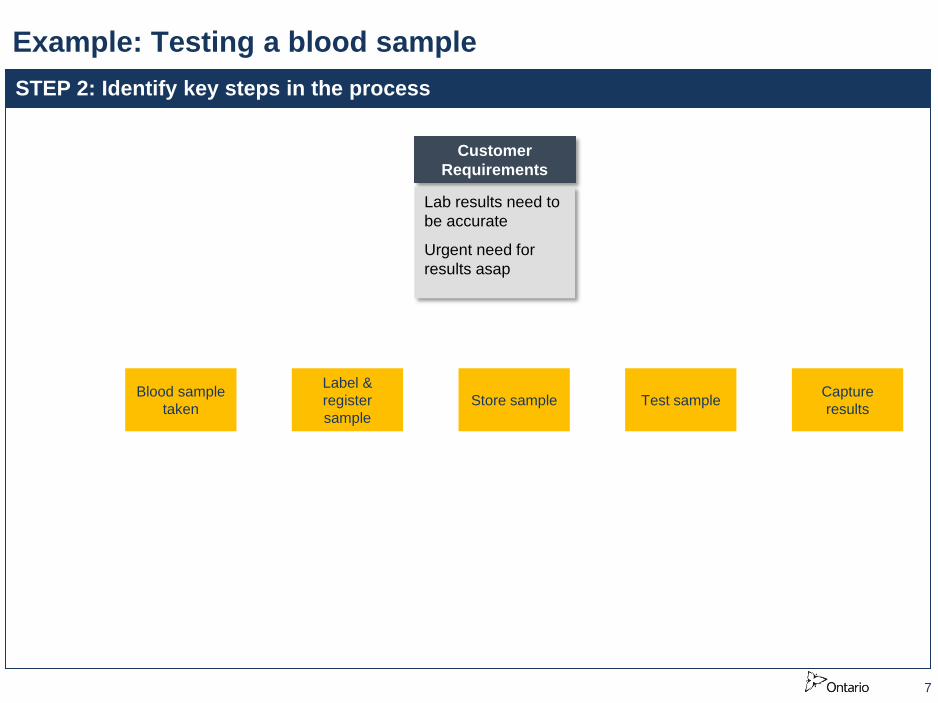
Example: Testing a blood sample
7
STEP 2: Identify key steps in the process
Customer
Requirements
Lab results need to
be accurate
Urgent need for
results asap
Blood sample
taken
Label &
register
sample
Store sample Test sample Capture
results
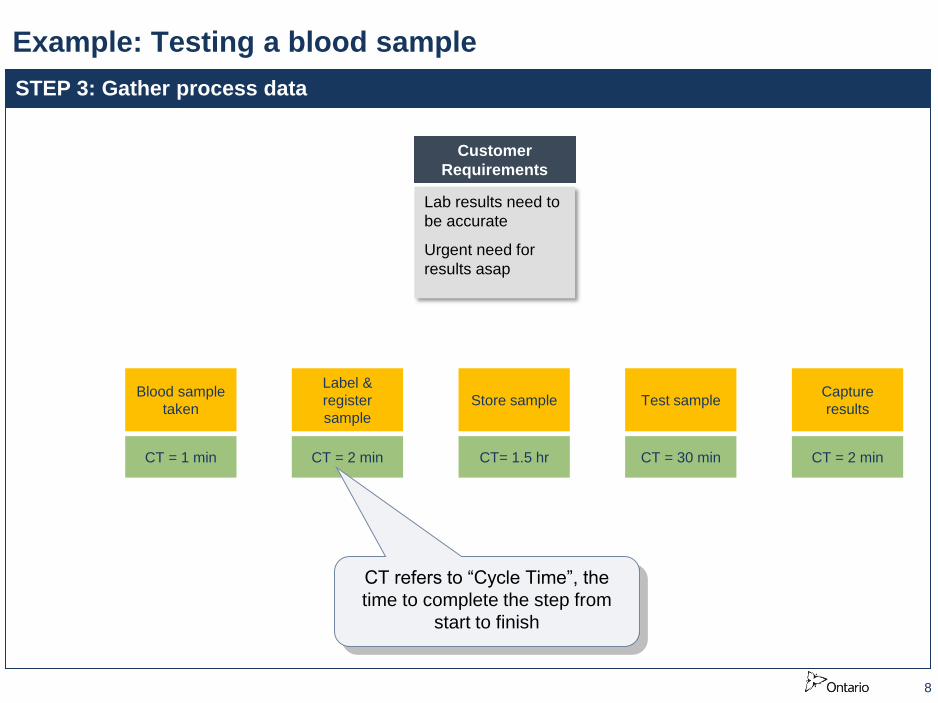
Example: Testing a blood sample
8
STEP 3: Gather process data
Customer
Requirements
Lab results need to
be accurate
Urgent need for
results asap
CT = 1 min CT = 2 min CT= 1.5 hr CT = 2 min
CT refers to “Cycle Time”, the
time to complete the step from
start to finish
CT = 30 min
Blood sample
taken
Label &
register
sample
Store sample Test sample Capture
results
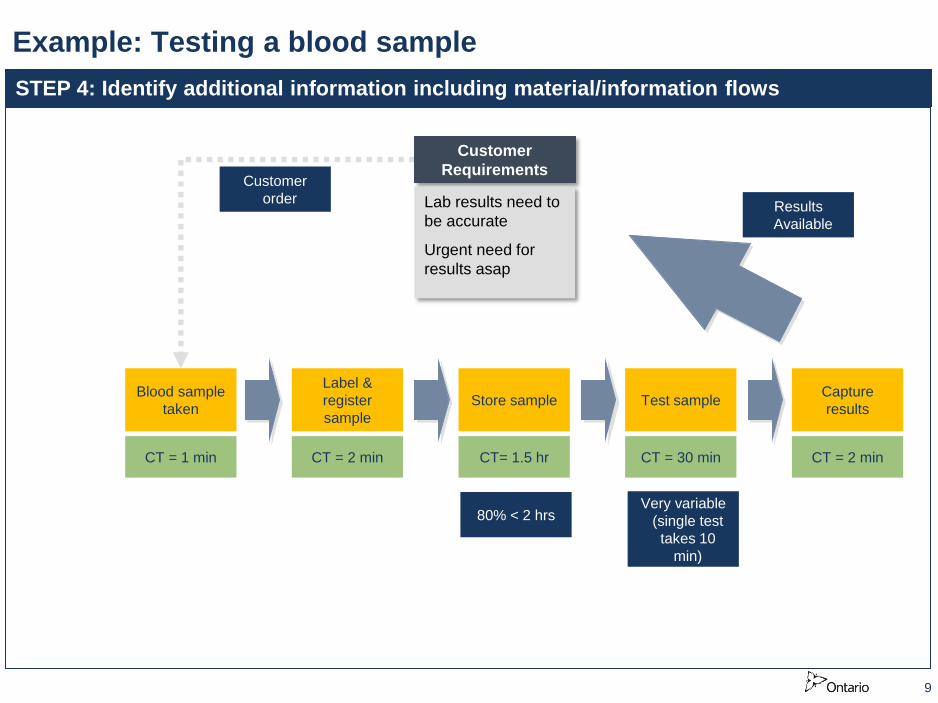
Example: Testing a blood sample
9
STEP 4: Identify additional information including material/information flows
Customer
Requirements
Lab results need to
be accurate
Urgent need for
results asap
Customer
order Results
Available
80% < 2 hrs Very variable
(single test
takes 10
min)
Blood sample
taken
Label &
register
sample
Store sample Test sample Capture
results
CT = 1 min CT = 2 min CT= 1.5 hr CT = 2 min CT = 30 min
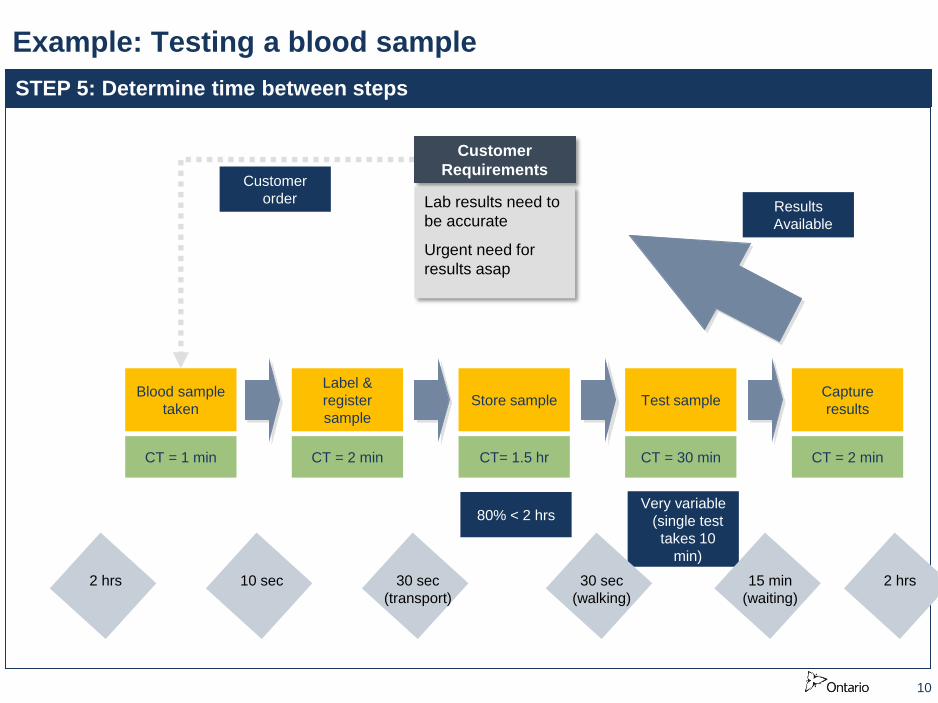
Example: Testing a blood sample
10
STEP 5: Determine time between steps
2 hrs
Customer
Requirements
Lab results need to
be accurate
Urgent need for
results asap
Customer
order Results
Available
80% < 2 hrs Very variable
(single test
takes 10
min)
CT = 1 min CT = 2 min CT= 1.5 hr CT = 2 min CT = 30 min
Blood sample
taken
Label &
register
sample
Store sample Test sample Capture
results
10 sec 30 sec
(transport)
30 sec
(walking)
15 min
(waiting)
2 hrs

Example: Testing a blood sample
11
Value-add: ~15 min
Non value add ~ 6 hrs
STEP 6: Identify value add and non-value add times
2 hrs
Customer
Requirements
Lab results need to
be accurate
Urgent need for
results asap
Customer
order Results
Available
80% < 2 hrs Very variable
(single test
takes 10
min)
CT = 1 min CT = 2 min CT= 1.5 hr CT = 2 min CT = 30 min
Blood sample
taken
Label &
register
sample
Store sample Test sample Capture
results
10 sec 30 sec
(transport)
30 sec
(walking)
15 min
(waiting)
2 hrs
VA VA VA
NVA NVA NVA NVA NVA NVA
NVA VA – 10 mins
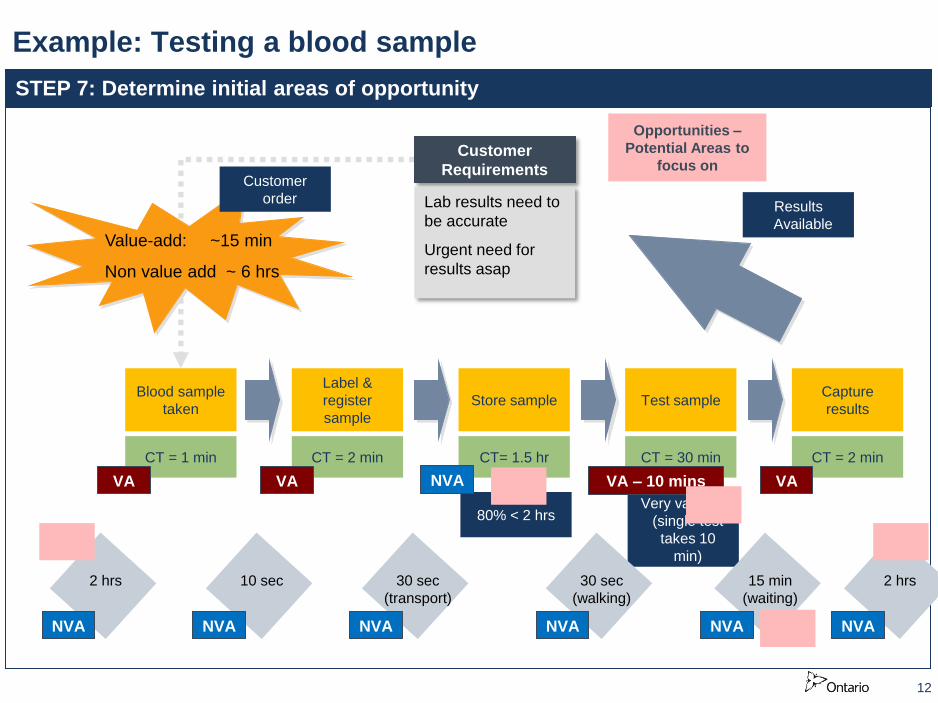
Example: Testing a blood sample
12
Value-add: ~15 min
Non value add ~ 6 hrs
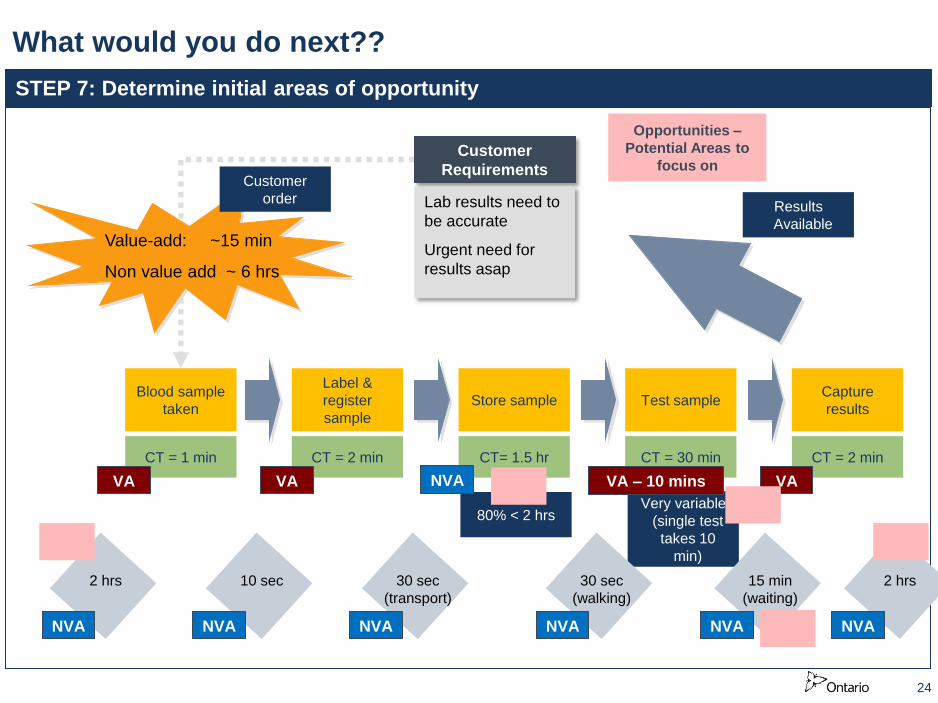
STEP 7: Determine initial areas of opportunity
2 hrs
Customer
Requirements
Lab results need to
be accurate
Urgent need for
results asap
Customer
order Results
Available
80% < 2 hrs Very variable
(single test
takes 10
min)
CT = 1 min CT = 2 min CT= 1.5 hr CT = 2 min CT = 30 min
Blood sample
taken
Label &
register
sample
Store sample Test sample Capture
results
10 sec 30 sec
(transport)
30 sec
(walking)
15 min
(waiting)
2 hrs
VA VA VA – 10 mins VA
NVA NVA NVA NVA NVA NVA
NVA
Opportunities –
Potential Areas to
focus on
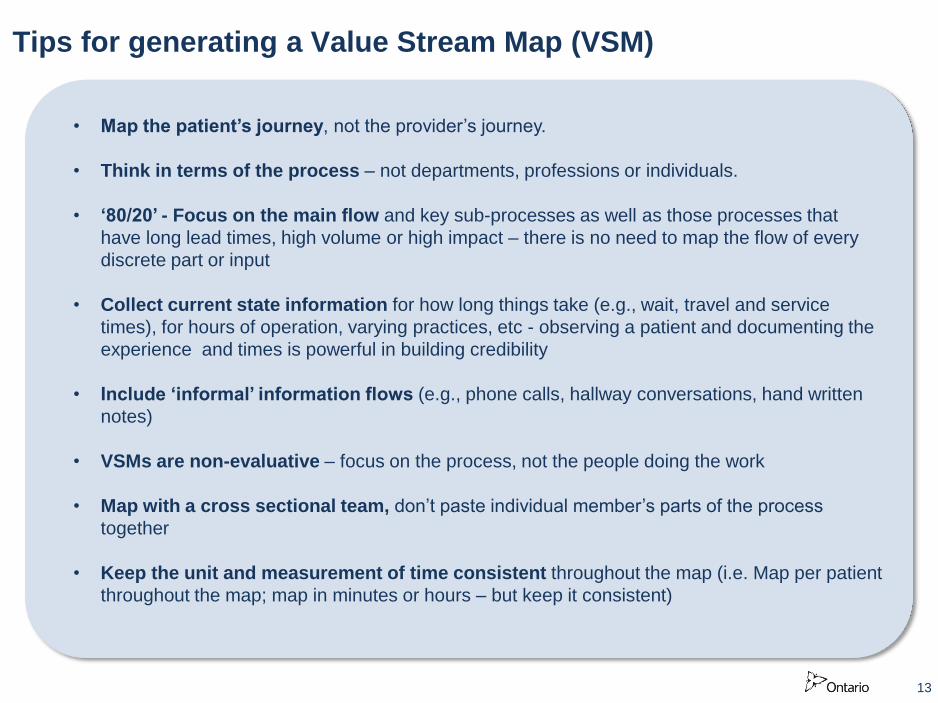
Tips for generating a Value Stream Map (VSM)
13
• Map the patient‟s journey, not the provider’s journey.
• Think in terms of the process – not departments, professions or individuals.
• „80/20‟ - Focus on the main flow and key sub-processes as well as those processes that
have long lead times, high volume or high impact – there is no need to map the flow of every
discrete part or input
• Collect current state information for how long things take (e.g., wait, travel and service
times), for hours of operation, varying practices, etc - observing a patient and documenting the
experience and times is powerful in building credibility
• Include „informal‟ information flows (e.g., phone calls, hallway conversations, hand written
notes)
• VSMs are non-evaluative – focus on the process, not the people doing the work
• Map with a cross sectional team, don’t paste individual member’s parts of the process
together
• Keep the unit and measurement of time consistent throughout the map (i.e. Map per patient
throughout the map; map in minutes or hours – but keep it consistent)
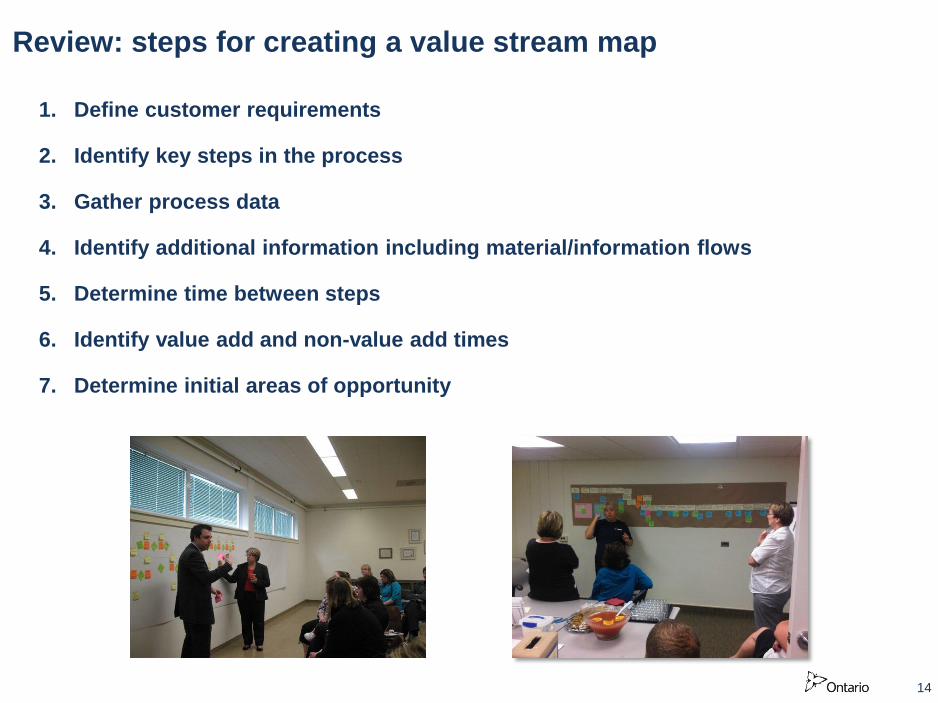
Review: steps for creating a value stream map
14
1. Define customer requirements
2. Identify key steps in the process
3. Gather process data
4. Identify additional information including material/information flows
5. Determine time between steps
6. Identify value add and non-value add times
7. Determine initial areas of opportunity

Materials for a value stream session
15
Process Step Additional
Information Cycle Time
1. Brown (Butcher) Paper
2. Post it Notes – 5 different colours
Opportunities
Wait Time
between Steps
Assign a facilitator to lead the session – they
should be the only one adding post-it notes on
the butcher paper
Assign a scribe from the team for each post-it colour
3. Tape and sharpies

How will it look….
16
Registration Nurse
Assessment
MD
Assessment
- Nurse
- Triage
Form &
health card
- 24 / 7
- Nurse
- Patient
Chart
- 24 / 7
- MD
- Patient
Chart
- Tracking
Board
- 24 / 7
3 to 5 mins 5 to 10 mins 10 to 15
mins
60 to 90
mins
20 to 180
mins
Reduce Door
to Doc time
Additional information can include who is doing the step, what is the
input to the step, hours of operations, reasons for variability, etc

Roles for Value Stream Mapping session
17
• Lead the mapping exercise
• Keep the group on task
• Ensure the group is focused at the right level of detail
Facilitator
(1)
Scribes
Content
Experts
Outside Eyes
• Record key information onto post-it notes
• Support the facilitator
• Provide your knowledge and experience
• Try not to get “into the weeds”
• Make sure you understand the process that is being described
– if you don’t understand it, the context experts may have missed
something
• Think critically, ask questions
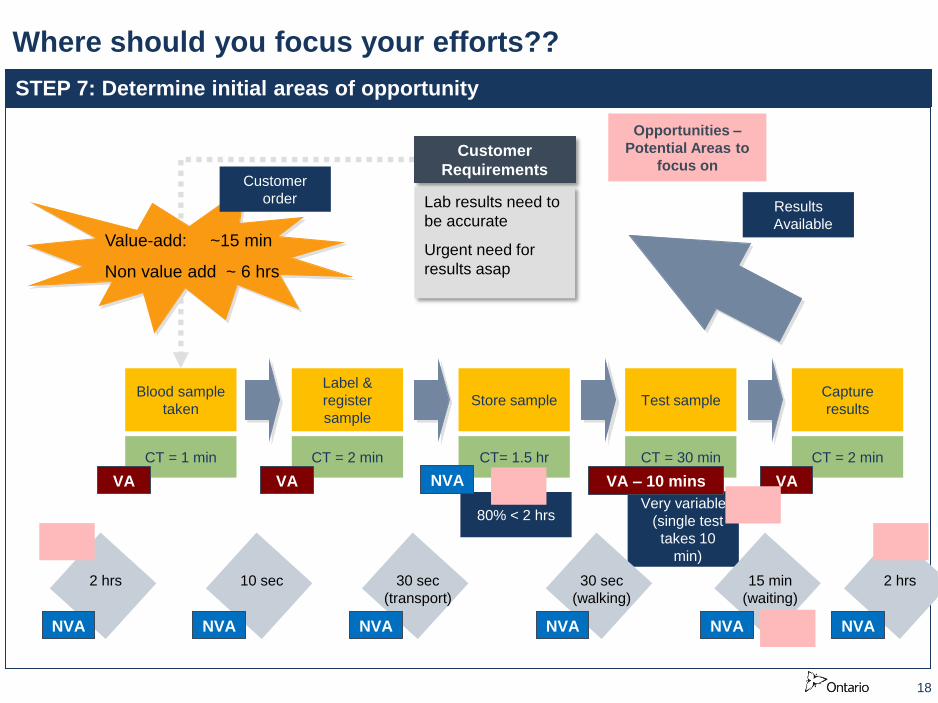
Where should you focus your efforts??
18
Value-add: ~15 min
Non value add ~ 6 hrs
STEP 7: Determine initial areas of opportunity
2 hrs
Customer
Requirements
Lab results need to
be accurate
Urgent need for
results asap
Customer
order Results
Available
80% < 2 hrs Very variable
(single test
takes 10
min)
CT = 1 min CT = 2 min CT= 1.5 hr CT = 2 min CT = 30 min
Blood sample
taken
Label &
register
sample
Store sample Test sample Capture
results
10 sec 30 sec
(transport)
30 sec
(walking)
15 min
(waiting)
2 hrs
VA VA VA – 10 mins VA
NVA NVA NVA NVA NVA NVA
NVA
Opportunities –
Potential Areas to
focus on
At your table agree on what is the
single best opportunity to pursue
with rationale to why.
Be prepared to share/debrief.
Exercise
19
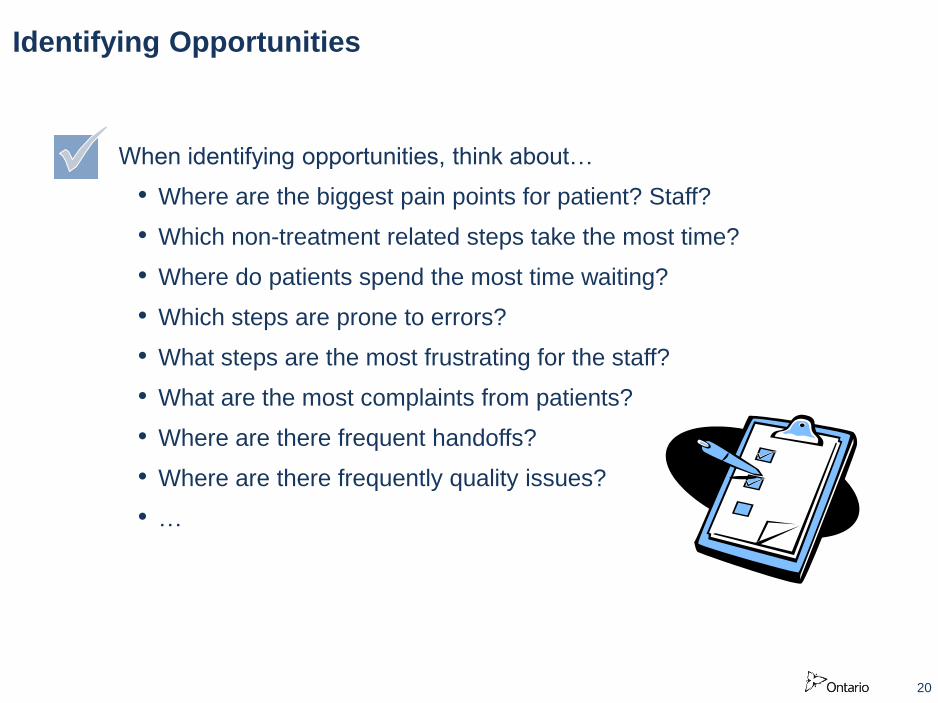
When identifying opportunities, think about…
• Where are the biggest pain points for patient? Staff?
• Which non-treatment related steps take the most time?
• Where do patients spend the most time waiting?
• Which steps are prone to errors?
• What steps are the most frustrating for the staff?
• What are the most complaints from patients?
• Where are there frequent handoffs?
• Where are there frequently quality issues?
• …
Identifying Opportunities
20

Difficult Easy
High
Low
Ease of implementation
Impact
What additional questions do you need answered to be more
confident in where you placed each opportunity?
Focus initially on
opportunities that are
high impact and easier
to capture
Prioritization Matrix
21

Difficult Easy
High
Low
Ease of implementation
Impact
Example – Lean ED Prioritization Matrix
22
Opportunity 1
Opportunity 5
Opportunity 3
Opportunity 4
Opportunity 7
Opportunity 2
Opportunity 6
So what do you do next as the
Team Lead???
Discussion
23
What would you do next??
24
Value-add: ~15 min
Non value add ~ 6 hrs
STEP 7: Determine initial areas of opportunity
2 hrs
Customer
Requirements
Lab results need to
be accurate
Urgent need for
results asap
Customer
order Results
Available
80% < 2 hrs Very variable
(single test
takes 10
min)
CT = 1 min CT = 2 min CT= 1.5 hr CT = 2 min CT = 30 min
Blood sample
taken
Label &
register
sample
Store sample Test sample Capture
results
10 sec 30 sec
(transport)
30 sec
(walking)
15 min
(waiting)
2 hrs
VA VA VA – 10 mins VA
NVA NVA NVA NVA NVA NVA
NVA
Opportunities –
Potential Areas to
focus on
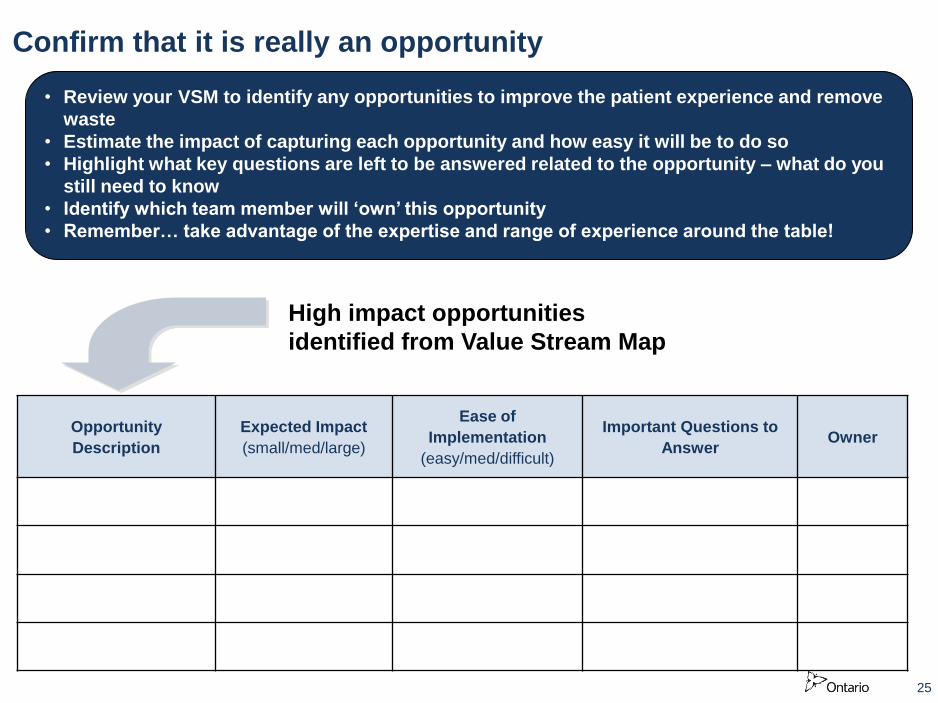
Opportunity
Description
Expected Impact
(small/med/large)
Ease of
Implementation
(easy/med/difficult)
Important Questions to
Answer Owner
High impact opportunities
identified from Value Stream Map
• Review your VSM to identify any opportunities to improve the patient experience and remove
waste
• Estimate the impact of capturing each opportunity and how easy it will be to do so
• Highlight what key questions are left to be answered related to the opportunity – what do you
still need to know
• Identify which team member will „own‟ this opportunity
• Remember… take advantage of the expertise and range of experience around the table!
Confirm that it is really an opportunity
25
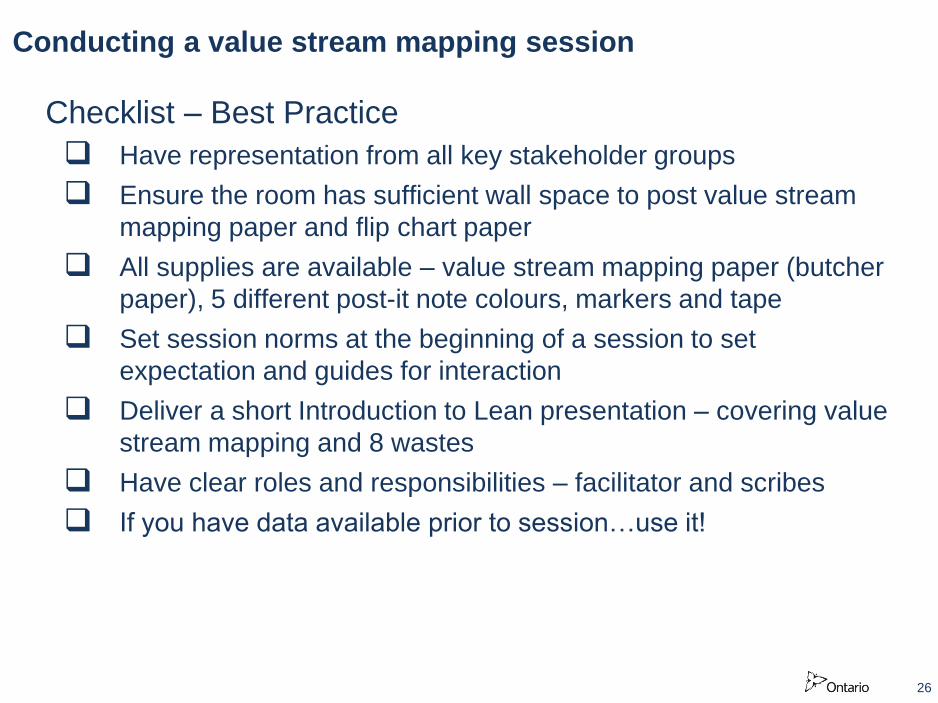
Checklist – Best Practice
Have representation from all key stakeholder groups
Ensure the room has sufficient wall space to post value stream
mapping paper and flip chart paper
All supplies are available – value stream mapping paper (butcher
paper), 5 different post-it note colours, markers and tape
Set session norms at the beginning of a session to set
expectation and guides for interaction
Deliver a short Introduction to Lean presentation – covering value
stream mapping and 8 wastes
Have clear roles and responsibilities – facilitator and scribes
If you have data available prior to session…use it!
Conducting a value stream mapping session
26
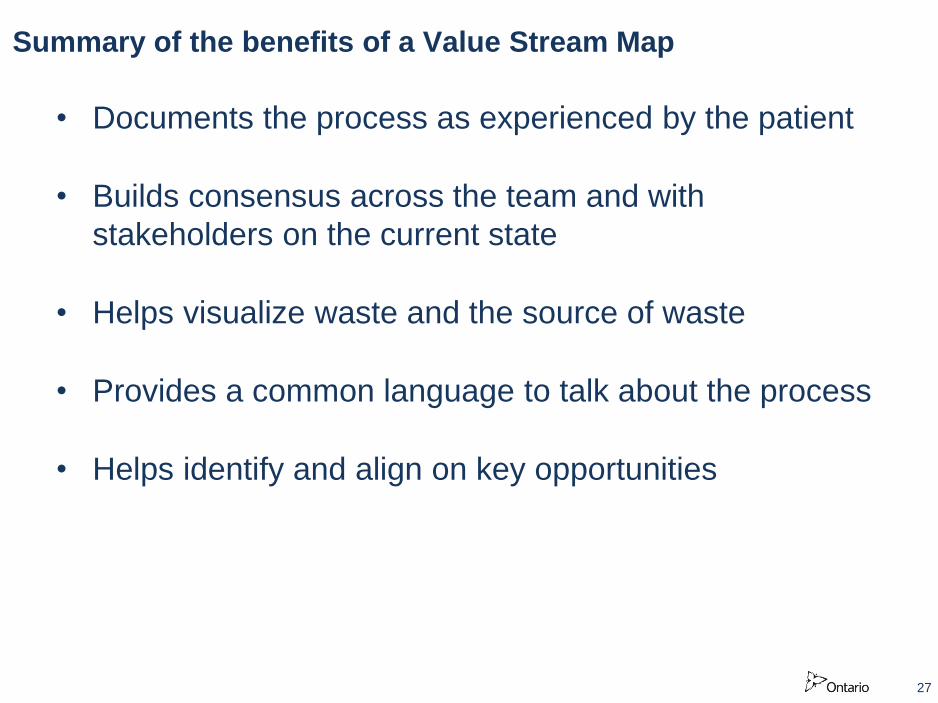
• Documents the process as experienced by the patient
• Builds consensus across the team and with
stakeholders on the current state
• Helps visualize waste and the source of waste
• Provides a common language to talk about the process
• Helps identify and align on key opportunities
Summary of the benefits of a Value Stream Map
27

VSM facilitation: tips and tricks
• Consider: are there other ways the work could be flowing?
E.g., loop back, parallel processing
• Confirm that everyone understand where the steps under consideration begins and
ends
• Put a question mark instead of a process step and move on
If you get
stuck
• Use the 80/20 rule to focus the group “what happens 80% of the time”
• Summarize their issue as an opportunity, write a pink sticky and move on
• If the group is debating, but there’s no evidence, cut the debate off and put a note
about fact finding into the parking lot
• Don’t be afraid to cut people off, just do it with energy and a smile!
If the group is
going off track
• Establish a concise set of group norms that give you the authority to effectively
facilitate
• Establish a parking lot where issues that are out of scope can be captured
• Set an aggressive time limit for the mapping portion, but plan to go over; groups
are more efficient when they’re running out of time
–E.g., book a 3 hour meeting, but schedule 2 hours for the VSM and 1 hour for
project planning
• Clearly define the scope of the processes to be mapped
Setting up the
day
• Recognize: you’ll never please everyone, just do the best you can to capture the
collective knowledge of the group
• Keep momentum and energy; don’t let the group slow down
• As the facilitator, you control the language that goes on the map
–Don’t let the scribes paraphrase
While you‟re
mapping
28

Questions?
29