Embed Size (px)
Citation preview

Page 1 A project managed by The Nature Conservancy on behalf of AusAidand implemented by the Australian Tropical Marine Alliance
(James Cook University, University of Queensland, University of Western Australia, the Australian Institute of Marine Science, Charles Darwin University) and the Coral Triangle Center
Ecosystem Approach to Fisheries Management
COURSE NOTES
CONTENTS Introduction ......................................................................................................................................................... 2 Unit 1: Threats to sustainable fisheries ................................................................................................... 4 Unit 2: Fisheries management ................................................................................................................... 11 Unit 3: Ecosystems .......................................................................................................................................... 17 Unit 4: Ecosystem Approach to Fisheries Management (EAFM) ................................................ 24 Unit 5: Fish biology ......................................................................................................................................... 33 Unit 6: Local coastal fisheries ................................................................................................................... 41 UNIT 6a. Papua New Guinea Coastal Fisheries ............................................................................ 41 UNIT 6b. Solomon Island Coastal Fisheries ................................................................................... 54
Unit 7: Governance ......................................................................................................................................... 61 Unit 7a. Papua New Guinea coastal fisheries governance ........................................................ 61 Unit 7b. Solomon Island coastal fisheries governance ............................................................... 71
Unit 8: Fisheries assessments .................................................................................................................... 76 Unit 9: Implementing an EAFM Plan ....................................................................................................... 87 Unit 10: Compliance, Monitoring and Plan review ........................................................................ 100 GLOSSARY TEST (Assessable) ................................................................................................................ 108

Introduction
These course notes comprise detailed teaching materials to support delivery of each of the ten Ecosystem Approach to Fisheries Management (EAFM) course units outlined in the curriculum and unit plans document. The course notes are also designed to be provided to students as essentail course reading material if they are to get full learning value from the course. The accompanying powerpoint presentations are developed as tools for teachers/lecturers to deliver and teach each unit, however they do not contain the full details included in these course notes. Teachers who are new to this subject area will need to be familiar with the content of these notes and draw on these to complement the powerpoint presentations in ensuring comprehensive delivery of the course. This course is designed to be able to be delivered either in full as an EAFM course, or as individual units as needed by teachers/trainers to complement and value-‐add to existing courses. It is also developed to be able to be delivered to a range of audiences with different levels of experience and training. That is, within each unit teachers can be flexible in the material delivered (and not delivered). To facilitate this, we have placed advanced material in separate sections within each unit. To assist with the flexible learning approach teachers should ask students about their previous experience and/or training with management, science, fisheries or policy development and tailor the level of course accordingly. It may also be useful to ask students what they want to achieve in this subject and refer to this during the training. The course includes many different activities to help in the teaching process and to also provide diverse learning strategies for students. The course uses as many examples as possible and as local as possible to help with learning. However, teachers are encouraged to complement the teaching examples and activities provided with some of their own. The course is focused firstly around providing basic background knowledge that underpins the use of the EAFM approach and, secondly, learning how to develop an EAFM plan in a step-‐by-‐step approach. This second aspect will form the bulk of the course and students will use the steps outlined to develop their own EAFM plan. This will be the major assessment piece for the course. Several course activities are designed to give students time to complete the different steps in developing the plan and templates are provided for use during these activities. While conducting trials of this course it was found that, unless students are advanced, developing the EAFM plan during the course is best done either in pairs or small groups. Also, students should base their EAFM plan on a region of their choosing; one they are familiar with, as well as familiar with the local fisheries issues. If not, there should be published information made available to students that will provide the necessary background for the development of an EAFM plan to occur. Failing this, developing a plan based on a hypothetical situation is reasonable. There is one core reference that students are expected to use and follow during the course, and two complementary references students should also endeavour to read (see below). Electronic copies of these are provided and where possible, hard copies should be used. Also provided at the end of each unit in these notes are key references and suggested additional reading material that help provide some of the information needed in developing a fisheries management plan, and also to provide more advanced training. Many of these (but not all) are provided electronically so they can be shared with students as appropriate.

Page 3 A project managed by The Nature Conservancy on behalf of AusAidand implemented by the Australian Tropical Marine Alliance
(James Cook University, University of Queensland, University of Western Australia, the Australian Institute of Marine Science, Charles Darwin University) and the Coral Triangle Center
Core reading: Secretariat of the Pacific Community. (2010) A community-‐based ecosystem approach to fisheries
management: guidelines for Pacific Island countries. Secretariat of the Pacific Community, Noumea. 65pp. (Ref # EAFM1)1
Complementary core reading: FAO. (2005) Putting into practice the ecosystem approach to fisheries. Food and Agriculture
Organisation, Rome. 86pp. (Ref # EAFM2)1
FAO. (2010) Putting into practice an ecosystem approach to managing sea cucumber fisheries. Food and Agriculture Organisation, Rome. 81pp. (Ref # EAFM3)1
1 On EAFM CD

Unit 1: Threats to sustainable fisheries
Student outcome: understanding of threats to fisheries and why identifying key threats is important
Activity 1.1: Ask each student to list three (3) potential threats to fisheries on sticky note pads. Lists to be collected and placed on whiteboard/butchers paper on the wall. This list can be referred to throughout the unit. (10 mins) When describing threats it is important to distinguish between threats and drivers of threats. A threat can be defined as “a person or thing likely to cause damage or danger”. An example of a driver of threats is population growth.
Internal threats to ecosystems and fisheries These are generally threats that are more locally-‐based and therefore it is possible that their impacts can be locally, or nationally, controlled.
• Locally sourced pollution including downstream (catchment) impacts Ask class for examples of these in their experience (e.g. farming, mining, coastal developments). This includes the impacts of pollution derived from local catchments and/or local coastal developments. These threats are locally-‐based however impacts from similar sources farther away are also relevant but are more externally based threats (see below). Discuss how these can directly impact fishery species (eg. physiological effects (reduced growth & reproduction) of poor water quality or contaminants) or indirectly through habitat impacts. See Box 3 and Table 2 (EAFM1)1.
• Destructive fishing Ask class for examples of these in their experience (e.g. trawling, blast fishing, use of poison, smashing of coral to chase out fish – refer to Activity 1.1) Discuss how these will impact fishery species primarily through habitat impacts.
Figure 1.1. Blast fishing using dynamite at a near shore tropical reef.

Page 5 A project managed by The Nature Conservancy on behalf of AusAidand implemented by the Australian Tropical Marine Alliance
(James Cook University, University of Queensland, University of Western Australia, the Australian Institute of Marine Science, Charles Darwin University) and the Coral Triangle Center
• Over-‐fishing Ask class for examples of these; then group the answers as per the headings below and prompt as per the headings below: Two main types of biological overfishing:
1. Growth overfishing – when fish are caught before they have time to grow. Ie. Too many small fish are taken.
2. Recruitment overfishing – reductions in the number of new fish recruits brought about by fishing. Ie. the spawning stock is reduced to the point that spawning and recruitment is affected.
Retained species including target species and by-‐product: impacts can be a reduction in the numbers of these species, or a reduction in their average size. Include discussion of how larger fish have exponentially more larvae and more robust larvae thereby providing greater potential contribution to the next generation/cohort of fish in the population. For some species, e.g. Giant Clam, the population needs to be relatively large before successful spawning can occur. So fishing some populations down to a lower, unknown trigger value can mean they are not longer able to reproduce and therefore recruit new individuals to the population (SPC 2010). Some species, e.g. some snappers and groupers, may aggregate at certain times of the year in large numbers to spawn. There are three potential overfishing problems here:
1. The fish, when aggregating, are particularly vulnerable to fishing so it is easy to take more than the overall population can sustain.
2. Moderate levels of fishing of aggregations may disrupt spawning behaviour and compromise successful reproduction. The effect would be a reduction in the number of baby fish produced (SPC 2010)1.
3. May alter the sex ratios by selectively removing more of one gender which can also compromise spawning success.
By-‐catch species: (e.g. in Australia trawl fishing can include ~90% of discarded by-‐catch). This can alter the fish communities and ecosystem balance (see ecosystem impacts). Discussion: Does the class have any knowledge of changes in the catch per unit effort of target species over time?
Figure 1.1. Example of a destructive fishing method -‐ trawling.

Activity 1.2: Ask students to consider the following questions as examples and write their own example on sticky note pads with one for the current situation and one for the past situation (eg. grouper average size in 1980s was ~45cm and now is ~30cm). The teacher and/or student then place these on a timeline written on the whiteboard or butchers paper on the wall. Discuss local examples of fishing impacts:
• Does the class have any knowledge of changes in average size of fish caught over time? • Does the class have any knowledge of any changes in species targeted over time and why
this occurred? • Have market prices changed over time? • Has access to culturally important species changed through time? • Have there been any changes in the local habitats? • Have there been changes in where fishing occurs over time? (15 mins)
Then refer students to Table 1 p6 in SPC 2010 (EAFM1)1 which show some fishing practices and gears that impact on local ecosystems in the Pacific.

Page 7 A project managed by The Nature Conservancy on behalf of AusAidand implemented by the Australian Tropical Marine Alliance
(James Cook University, University of Queensland, University of Western Australia, the Australian Institute of Marine Science, Charles Darwin University) and the Coral Triangle Center
• Ecosystem impacts
This can include effects of altering the species composition, effects of taking fish from one trophic level upon the next trophic levels (fishing down the food web), altering or removing different habitat types, or removing larger size classes. A simplified example is provided below to illustrate ecosytem impacts of fishing, however, food webs, food chains and trophic levels are covered in more detail in Unit 4 (Ecosystems).
Figure 1.2. Example of ecosystem impacts of fishing.
External threats to ecosystems and fisheries In terms of fisheries management there are likely to be threats that are either more difficult to control or beyond your control. Some of these threats may be locally based however the source of some threats may be so far away that non-‐local co-‐operation is required. These threats are called “external” threats.
• Externally sourced pollution including downstream (catchment) impacts Ask class for examples of these in their experience (e.g. farming, mining, coastal developments). This potentially includes the impacts of pollution derived from other catchments or even other countries, depending on the oceanic currents. It may, for example, include marine debris such as discarded nets. Discuss how these can directly impact fishery species (eg. physiological effects (reduced growth & reproduction) of poor water quality or contaminants) or indirectly through habitat impacts. See Box 3 and Table 2 (EAFM1)1.

Figure 1.3. Examples of upstream threats that have downstream impacts on fisheries (p28, EAFM1)1.
• Illegal foreign fishing These fishers are not allowed to take fish from the local ecosystems but sometimes they do and they can therefore impact the ability of local fishers to take catch sustainably.
• Climate change Of the predicted changes in climate, the biggest potential impacts upon fisheries are likely to be those due to sea surface temperature increases, ocean acidity increases and ocean current changes. The most significant indirect effects will be the projected degradation, fragmentation and loss of coral reefs, mangroves, seagrasses and intertidal flats. As temperatures increase, reproduction, recruitment and growth of fished animals may be impacted and may cause distributions of many marine organisms to shift to higher latitudes and/or deeper waters. Ocean acidification is likely to lead to a reduced ability of shellfish to produce shells and sea cucumbers to produce calcareous spicules which help support their bodies. This may lead to lower populations of these taxa as well as smaller average sizes making them more potentially vulnerable to natural stressors and predators. Increased acidity may also compromise larval development and impair the ability of larval fish to settle, and may alter juvenile behaviour, thereby reducing the number of fish that survive to become adults and therefore replenishment of fished stocks. Expected changes to currents will change the existing patterns of where larvae settle and, therefore, contribute to stock replenishment. Changing currents will also change patterns of nutrients supplied to coastal habitats e.g. via movement of plankton in upwellings. The expected climate change-‐associated habitat degradation (e.g. reduced calcification of corals leadings to degraded coral reefs) is likely to impact upon all fished stocks which depend upon those habitats (e.g. in PNG this is ~56% of fish targeted by subsistence fishers). The timeframes for these changes are estimated to be from 25-‐90 years. The full impact of climate change will vary, however, from location to location and be

Page 9 A project managed by The Nature Conservancy on behalf of AusAidand implemented by the Australian Tropical Marine Alliance
(James Cook University, University of Queensland, University of Western Australia, the Australian Institute of Marine Science, Charles Darwin University) and the Coral Triangle Center
dependent, in part, on the pre-‐existing health of the ecosystem being impacted (Pratchett et al 2011)2.
Activity 1.3: Ask students to voluntarily rank threats identified during Activity 1.1 from most dangerous to least. Do this as a class discussion and compare with Figure 1.4 below. (10 mins)
Figure 1.4. Relative importance that Pacific Island Countries apply to all types of impacts upon sustainability of fisheries. Source: EAFM1, p91.
Shifting ecological baselines Humans tend to frame norms in their lives over relatively short time frames (i.e. over their own lifetime, at most) and this means that the assessment of what is normal and not normal changes from one generation to the next. (Refer back to Activity 1.2). The implications for the management of ecosystems is that every new generation see the current situation as the baseline and resource management aiming for sustainability can often aim to sustain the current situation although it may often be already quite degraded.
DVD: Fish and People – Module 1: Plenty more fish in the sea? (1st half). (7.5 mins) 1
The consequences of these threats to fisheries Marine ecosystem functioning, including maintenance of fished stocks, depends on its structure, diversity and integrity. If any part of the ecosystem (whether habitat or species) are badly impacted, the flow-‐on impacts (including to fished species) can be significant and can have serious repercussions for people relying on those resources for food or income. Alteration or disturbance of one or several components of marine ecosystems can have strong effects on higher or lower trophic levels, depending on whether food webs are controlled by
2 Not on EAFM CD – contact [email protected]

resources or by predators (Cury et al 2003)1. The complete consequences of which are, at best, unknown, or, at worst, catastrophic in the case of fisheries which then collapse e.g. sea cucumber fishery in PNG. One example from a broad area of Fiji shows that as fishing pressure increased the density of predatory reef fish significantly declined, the density of coral-‐eating starfish significantly increased, and the reef-‐building corals also sigificantly declined and were replaced by algal species (Dulvy et al, 2004)2. This is an example of what is called a trophic cascade -‐
Therefore, to ensure the sustainability of the ecosystem and the fish within it, all parts of the ecosystem (biotic and abiotic, upstream and downstream) must be adequately managed.
Activity 1.4: Students to form groups of 4-‐6 people and write down local examples of some social, economic and cultural consequences of negative fishery impacts? One person from each group then presents their results back to the class for discussion. (20 mins)
Homework: Students interview their parents, grandparents, older neighbour, etc about shifting baselines and their past fisheries experience compared with today. Further reading for advanced students (in addition to core course reading list for students in Curriculum): Cury, P., L. Shannon, and Y.-‐J. Shin. (2003) The functioning of marine ecosystems: a fisheries
perspective. Pages 103-‐125 in M. Sinclair and G. Valdimarsson, editors. Responsible fisheries in the marine ecosystem. FAO, Rome.1
Dulvy, NK, Freckleton, RP and Polunin, NVC (2004) Coral reef cascades and the indirect effects of predator removal by exploitation. Ecology Letters, 7: 410-‐416.2
Jackson, J. B. C., M. X. Kirby, W. H. Berger, K. A. Bjorndal, L. W. Botsford, B. J. Bourque, R. H. Bradbury, R. Cooke, J. Erlandson, J. A. Estes, T. P. Hughes, S. Kidwell, C. B. Bange, H. S. Lenihan, J. M. Pandolfi, C. H. Peterson, R. S. Steneck, M. J. Tegner, and R. R. Warner. 2001. Historical overfishing and recent collapse of coastal ecosystems. Science 293:629-‐638. 2
Pandolfi, J. M., R. H. Bradbury, E. Sala, T. P. Hughes, K. A. Bjorndal, R. Cooke, D. A. McArdle, L. McClenachan, M. J. H. Newman, G. Paredes, R. R. Warner, and J. B. C. Jackon. 2003. Global trajectories of the long-‐term decline of coral reef ecosystems. Science 301:955-‐958. 2
Pratchett, M. S., P. L. Munday, N. A. J. Graham, M. Kronen, S. Pinca, K. Friedman, T. D. Brewer, J. D. Bell, S. K. Wilson, J. E. Cinner, J. P. Kinch, R. J. Lawton, A. J. Williams, L. Chapman, F. Magron, and A. Webb. (2011) Vulnerability of coastal fisheries in the tropical Pacific to climate change. Pages 493-‐576 in J. D. Bell, J. E. Johnson, and A. J. Hobday, editors. Vulnerability of tropical Pacific fisheries and aquaculture to climate change. Secretariat of the Pacific Community, Noumea. 2
Sandin, S. A., J. E. Smith, E. E. DeMartini, E. A. Dinsdale, S. D. Donner, A. M. Friedlander, T. Konotchick, M. Malay, J. E. Maragos, D. Obura, O. Pantos, G. Paulay, M. Richie, F. Rohwer, R. E. Schroeder, S. Walsh, J. B. C. Jackson, N. Knowlton, and E. Sala. 2008. Baselines and Degradation of Coral Reefs in the Northern Line Islands. PLoS ONE 3:e1548. 1

Page 11 A project managed by The Nature Conservancy on behalf of AusAidand implemented by the Australian Tropical Marine Alliance
(James Cook University, University of Queensland, University of Western Australia, the Australian Institute of Marine Science, Charles Darwin University) and the Coral Triangle Center
Unit 2: Fisheries management
Student outcome: an understanding of some of the main concepts of fisheries management and tools, and how to gather information to best apply these tools in PNG and Solomon Islands
Activity 2.1: Ask the class for their views on what is fisheries management? (5 mins)
The purpose of fisheries management Fisheries management is the application of fisheries management tools to achieve any stated fisheries management objectives. Put simply, if fisheries are not managed stocks will be depleted until the fishery becomes economically unviable or the stock collapses. Most fisheries management aims to achieve two or more conflicting objectives which may be biological (e.g. sustainable fish stocks), economic (maximising the catch), social (ensuring a fair share of the catch) and/or cultural (maintaining the ability to use certain species for cultural purposes). Sustainability usually underpins all other management objectives. Good management practices balance often competing objectives while achieving the goal of sustainability. Example management plan objectives are:
• Ensure the fishery stock is at or near levels of maximum sustainable economic yield. • Ensure that traditional resource use is preserved and promoted. • Maximise the economic and social benefits of the fishery. • Minimise bycatch and impacts on the ecosystem through habitat damage.
Fisheries management tools Fisheries management tools that are used to try to achieve one or more of the identified fisheries management objectives are of two types. Management tools are used to control how much of the fishery population is caught each year in two major ways, either by directly limiting what is caught, or indirectly by placing limits on the effort that can be applied to fishing. Input controls are tools that indirectly control how much is caught by restricting fishing effort. Output controls are tools that directly limit catch. Some of these types of management tools have been used by local communities for hundreds of years (EAFM11; EAFM21). INPUT CONTROLS
1. Limiting the number of fishers and/or boats (by licences or other means). 2. Gear restrictions. 3. Limits on the number of fishing days. 4. Temporal (e.g. seasonal closures) or spatial closures.
Example of an input control: restricting the size of fishing vessels and the number of fishermen (Source: EAFM31). Input control examples – Solomon Islands: Fishing gear (method) restriction
• Ban on destructive fishing practices, eg. Solomon Islands Fisheries Management Bill (draft December 20111)
Division 3, 21. (2) No person shall, for the purpose of killing, taking, stunning, stupefying or disabling fish or in any way rendering fish more easily caught use any chemical, poison or noxious substance or material, whether of manufactured or natural origin, dynamite or explosive substance or device.
• Ban on the take of all sedentary animals at night using lights and/or SCUBA and hookah. Spatial closures
• No fishing within the Inner Honiara Harbour. • MPA on Tetepare Island and the Roviana/Vonavona MPA network with a ban on all
harvesting Species restrictions
• Ban on the take and consumption of turtles. • Sea cucumber harvest closure (until 2013).
Input control examples – Papua New Guinea: Rock lobster fishery
• Limits on licences issued per region. Shark fishery
• Limits on fishing effort. Barramundi fishery
• Spatially limited spawning closure for barramundi fishing.
Page 13 A project managed by The Nature Conservancy on behalf of AusAidand implemented by the Australian Tropical Marine Alliance
(James Cook University, University of Queensland, University of Western Australia, the Australian Institute of Marine Science, Charles Darwin University) and the Coral Triangle Center
Restricting the mesh size of gillnets is a useful input control measure that helps control the size of fish captured in the net (Source: King, 19953). OUTPUT CONTROLS
1. Total allowable catch restrictions (TACs). 2. Individual transferable quotas (ITQs). 3. Bag and size limits.
Output control examples – Solomon Islands: Ask class for local Solomon Islands examples and/or refer to Solomon Fisheries Information under “Further Reading“ on EAFM CD. Output control examples – Papua New Guinea: Rock lobster fishery
• Minimum tail length of 100 mm. • Ban on the take of berried females. • Regional TAC requirement.
3 Not on EAFM CD
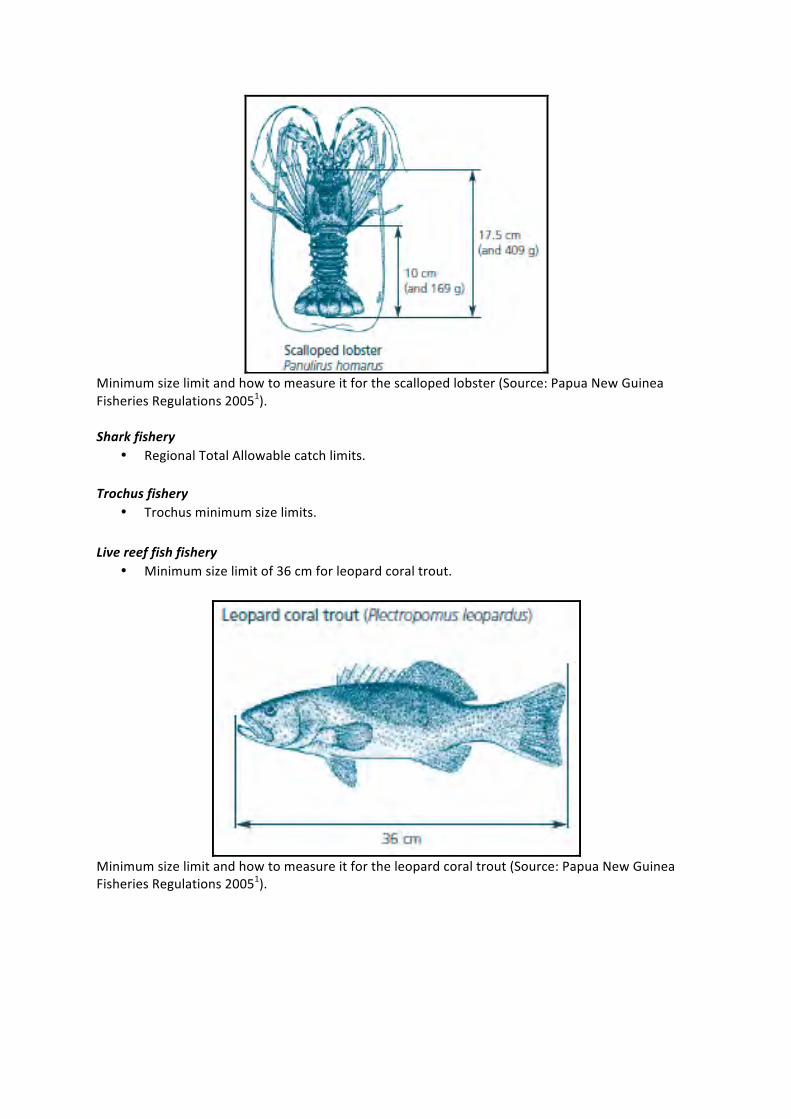
Minimum size limit and how to measure it for the scalloped lobster (Source: Papua New Guinea Fisheries Regulations 20051). Shark fishery
• Regional Total Allowable catch limits. Trochus fishery
• Trochus minimum size limits. Live reef fish fishery
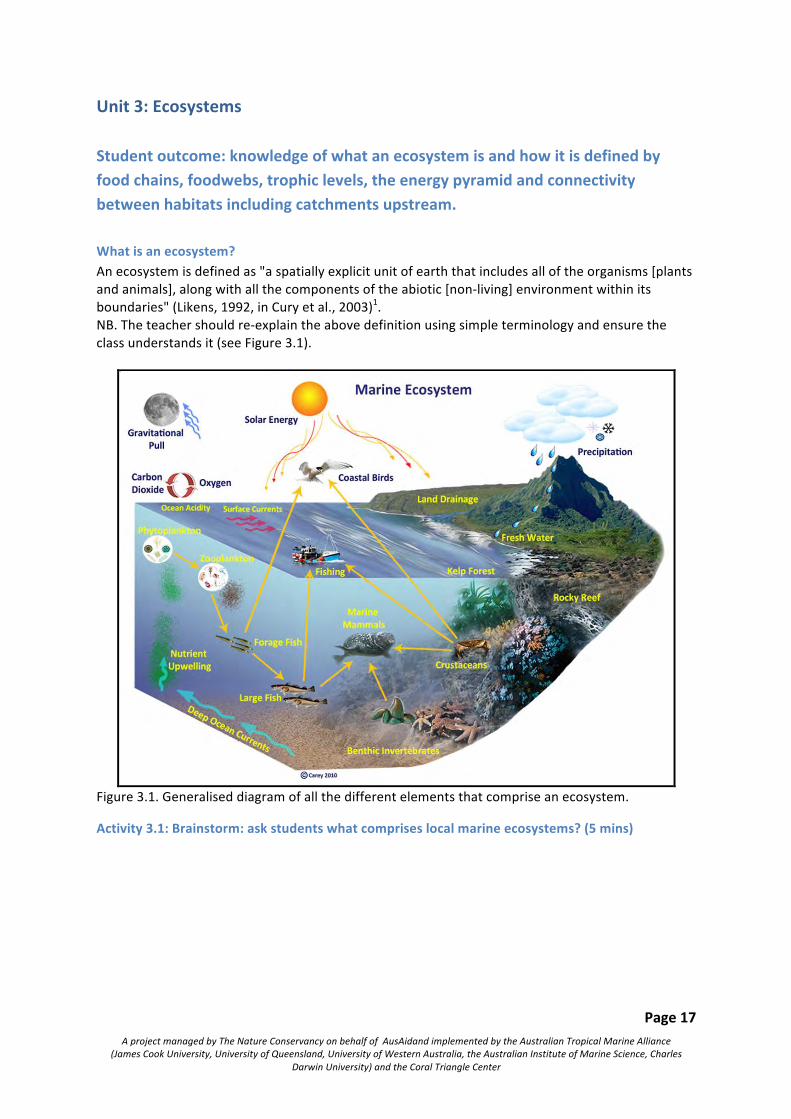
• Minimum size limit of 36 cm for leopard coral trout.
Minimum size limit and how to measure it for the leopard coral trout (Source: Papua New Guinea Fisheries Regulations 20051).

Page 15 A project managed by The Nature Conservancy on behalf of AusAidand implemented by the Australian Tropical Marine Alliance
(James Cook University, University of Queensland, University of Western Australia, the Australian Institute of Marine Science, Charles Darwin University) and the Coral Triangle Center
Activity 2.2: Provide students with local fisheries management plans and give them ~10 mins to read. Ask them to identify examples of both input and output control measures, write down on individual sticky notes and place them on a flip chart or whiteboard under separate headings: Input controls and Output controls. (20 mins)
Management tools in action It is not only useful to know the types of management tools available to use, but also the circumstances that each one would be considered useful. There are a number of factors to consider when implementing management tools including whether it is affordable; are fishermen likely to comply with the management rule; will the community understand it; what will be the penalty for non-‐compliance; will it help meet what we want to achieve (management objective); and how will we know if it works. All of these factors, and more, will be different depending on the region, the species, how the fishery operates and other factors. Determining the right management tool should be based on addressing key fisheries issues and through community consultation. The Table below shows some of the main types of management tools and when they may be considered for use (also see refs EAFM1; EAFM 2; EAFM 3 – all on EAFM CD). Management tool Input or Output What are they used for Total Allowable Catch
(TAC) Output To regulate the amount of fish taken
Fishing licences Input To control the amount of fishing effort (thereby indirectly controlling how much is caught)
Minimum size limits Output To allow animals to mature and breed before they are caught; maintain spawning stock
Maximum size limits Output To allow large fecund animals to breed; maintain spawning stock; often used for sex changing species
Ban on night fishing Input To protect some species that are vulnerable at night, eg. sleeping parrotfish
Spawning closure Input To protect spawning fish; reduce capture while at a vulnerable stage
Bag limit Output To control how much is caught and ensure catch is shared among different stakeholders
Marine Protected Area Input To conserve habitats and species Further reading: Cochrane, K.L. and Garcia, S.M. (eds.) 2009. A fishery manager’s guidebook. FAO, Rome, 2009. 518p.
(Chapter 1 and Part III: Chapters 7 – 11) 1 Govan, H., W. Aalbersberg, A. Tawake, and J. E. Parks. 2008. Locally Managed Marine Areas: a guide
for practitioners. The Locally-‐Managed Marine Area Network. Pages 1-‐3. 1 GBRMPA 2004 Report on Zoning GBRMPA, Townsville. (see Table 1 and Table 2 pp 15, 16 for one
application of multiple-‐use zones) 1 King, M. 2007. Fisheries biology, assessment and management. 2nd Ed., Oxford, UK, Wiley-‐Blackwell
Publishing. 382 pp.3 SPC (2000) Fisheries management by communities: a manual on promoting the management of
subsistence fisheries by Pacific Island communities. Secretariat of the Pacific Community, Noumea, New Caledonia. 1

Papua New Guinea Fisheries Regulations 2005. PNG National Fisheries Authority. (on CD under PNG Fisheries Information in Further Reading under References section) 1
Secretariat of the Pacific Community. (2011) Guide and information sheets for fishing communities. Secretariat of the Pacific Community, Noumea. 1
Page 17 A project managed by The Nature Conservancy on behalf of AusAidand implemented by the Australian Tropical Marine Alliance
(James Cook University, University of Queensland, University of Western Australia, the Australian Institute of Marine Science, Charles Darwin University) and the Coral Triangle Center
Unit 3: Ecosystems
Student outcome: knowledge of what an ecosystem is and how it is defined by food chains, foodwebs, trophic levels, the energy pyramid and connectivity between habitats including catchments upstream.
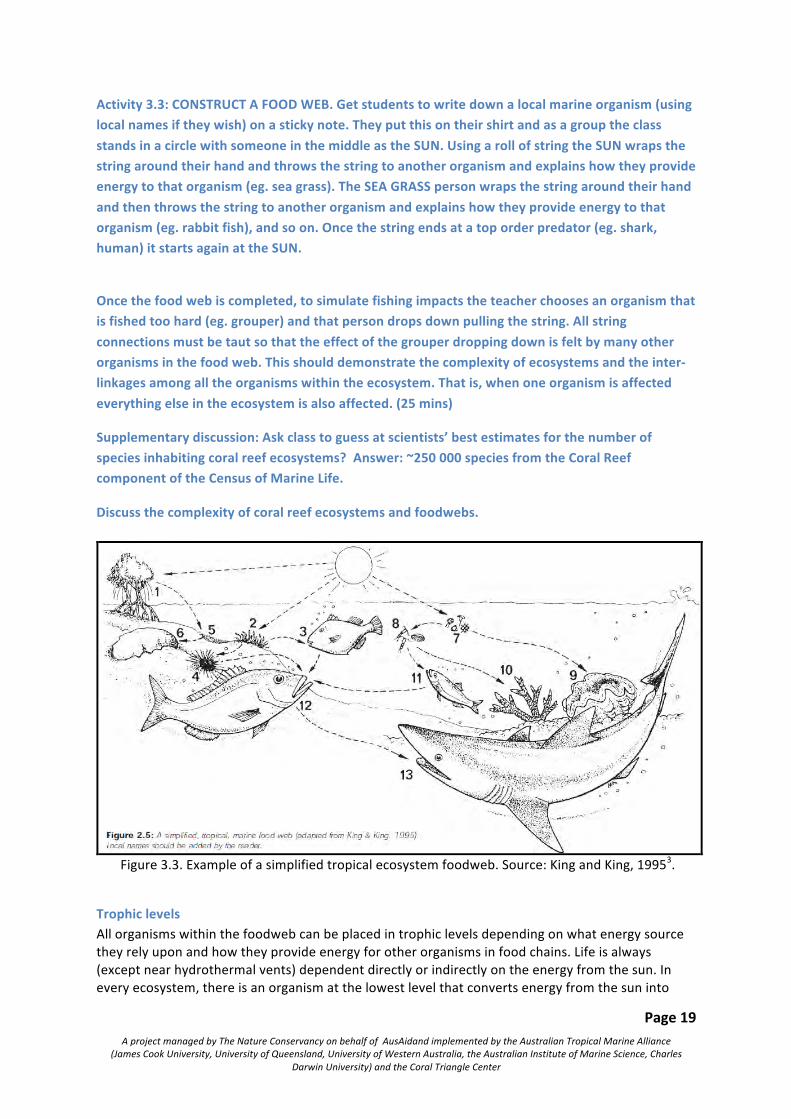
What is an ecosystem? An ecosystem is defined as "a spatially explicit unit of earth that includes all of the organisms [plants and animals], along with all the components of the abiotic [non-‐living] environment within its boundaries" (Likens, 1992, in Cury et al., 2003)1. NB. The teacher should re-‐explain the above definition using simple terminology and ensure the class understands it (see Figure 3.1).
Figure 3.1. Generalised diagram of all the different elements that comprise an ecosystem.
Activity 3.1: Brainstorm: ask students what comprises local marine ecosystems? (5 mins)

Supplementary discussion for more advanced students: A marine ecosystem, in addition to the above, contains water, detritus and hundreds of thousands of different kinds of organisms, including bacteria, microscopic plants, microscopic animals, fish, mammals and birds. (Cury et al 2003). Ensure understanding of bacteria, phytoplankton (microscopic plants), zooplankton (microscopic animals). Discuss link between the coral animal and the algae living inside it (zooxanthellae). (10 mins)
Food chains Plants and animals are connected through what they eat. Some animals eat plants (herbivores), in turn, other animals may eat these herbivores (carnivores), in turn, other animals may eat the carnivores (also carnivores) and so on. Eating provides nutrients and energy for biological processes (e.g. growth, reproduction). The original source of (almost) all energy is the sun (the exception being deepwater hydrothermal vents which source energy from within the earth e.g. from underwater volcanic activity). An example of a food chain is: Sunlight -‐> marine plant (e.g. algae) -‐> parrotfish -‐> coral trout -‐> shark
Figure 3.2. A simple food chain diagram with a fisherman ato the top of the food chain (www.fish.wa.gov.au).
Activity 3.2: Get students to choose a partner and write down on sticky note pads at least one example of a local food chain. (10 mins)
Foodwebs A foodweb describes the complex inter-‐linkages among all organisms in an ecosystem and are comprised of many different food chains.
Page 19 A project managed by The Nature Conservancy on behalf of AusAidand implemented by the Australian Tropical Marine Alliance
(James Cook University, University of Queensland, University of Western Australia, the Australian Institute of Marine Science, Charles Darwin University) and the Coral Triangle Center
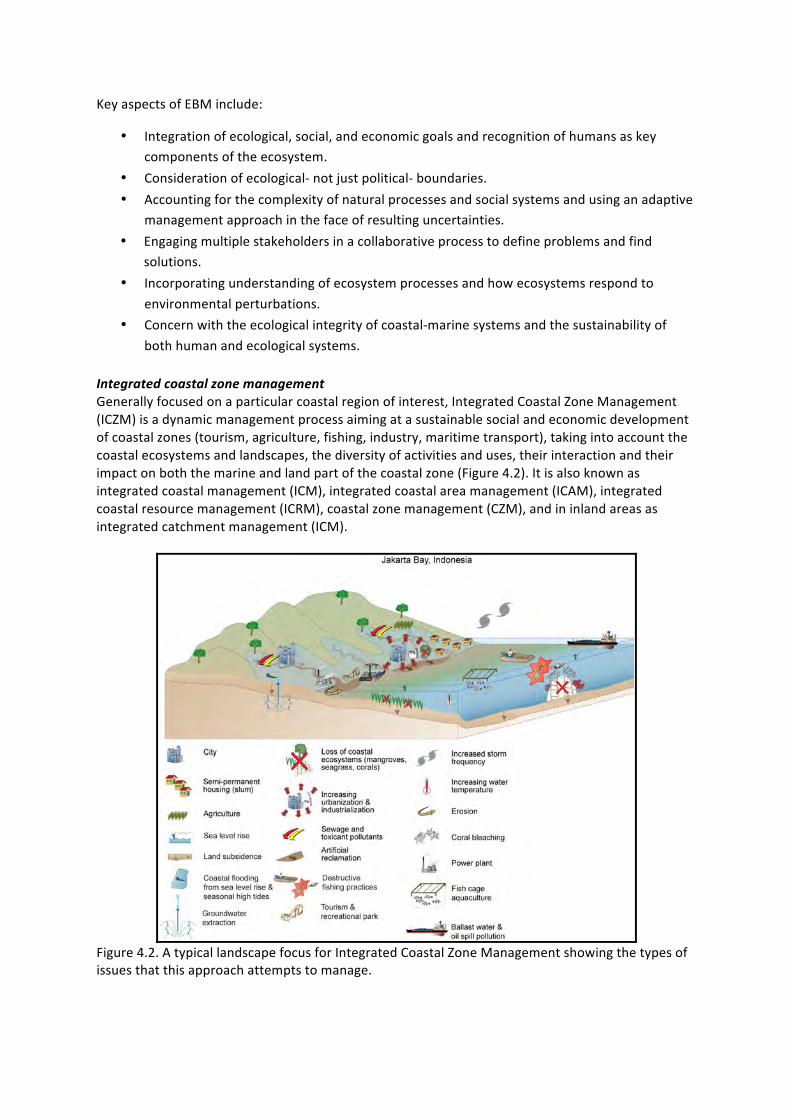
Activity 3.3: CONSTRUCT A FOOD WEB. Get students to write down a local marine organism (using local names if they wish) on a sticky note. They put this on their shirt and as a group the class stands in a circle with someone in the middle as the SUN. Using a roll of string the SUN wraps the string around their hand and throws the string to another organism and explains how they provide energy to that organism (eg. sea grass). The SEA GRASS person wraps the string around their hand and then throws the string to another organism and explains how they provide energy to that organism (eg. rabbit fish), and so on. Once the string ends at a top order predator (eg. shark, human) it starts again at the SUN.
Once the food web is completed, to simulate fishing impacts the teacher chooses an organism that is fished too hard (eg. grouper) and that person drops down pulling the string. All string connections must be taut so that the effect of the grouper dropping down is felt by many other organisms in the food web. This should demonstrate the complexity of ecosystems and the inter-‐linkages among all the organisms within the ecosystem. That is, when one organism is affected everything else in the ecosystem is also affected. (25 mins)
Supplementary discussion: Ask class to guess at scientists’ best estimates for the number of species inhabiting coral reef ecosystems? Answer: ~250 000 species from the Coral Reef component of the Census of Marine Life.
Discuss the complexity of coral reef ecosystems and foodwebs.
Figure 3.3. Example of a simplified tropical ecosystem foodweb. Source: King and King, 19953.
Trophic levels All organisms within the foodweb can be placed in trophic levels depending on what energy source they rely upon and how they provide energy for other organisms in food chains. Life is always (except near hydrothermal vents) dependent directly or indirectly on the energy from the sun. In every ecosystem, there is an organism at the lowest level that converts energy from the sun into

useable energy for other organisms. The lowest trophic level is made up of plants, like phytoplankton, which are capable of transforming inorganic carbon into protoplasm and are called primary producers. Animals that consume primary producers in turn derive energy from eating that primary producer; these are called primary consumers. The more trophic levels present, the less energy is conserved at higher trophic levels (see Figure 3.4).
Figure 3.4. Simplified representation of different trophic levels in a tropical seagrass habitat.
Trophic levels:
• Level 1: Plants and algae make their own food and are called primary producers. • Level 2: Herbivores eat plants and are called primary consumers. • Level 3: Carnivores which eat herbivores are called secondary consumers. • Level 4: Carnivores which eat other carnivores are called tertiary consumers. • Level 5: Apex predators which have no predators are at the top of the food chain
Animals that eat plants are called primary consumers or herbivores. Ask class for examples of primary consumers (e.g. zooplankton, fusiliers, rabbitfish, small angelfish, many surgeonfish, some shells e.g. trochus). Fish that eat herbivorous fish are called secondary consumers, or carnivores. Ask class for examples (e.g. coral trout, snapper). Animals that eat other carnivores are called tertiary consumers. Ask class for examples (e.g. shark, sea eagle)

Page 21 A project managed by The Nature Conservancy on behalf of AusAidand implemented by the Australian Tropical Marine Alliance
(James Cook University, University of Queensland, University of Western Australia, the Australian Institute of Marine Science, Charles Darwin University) and the Coral Triangle Center
Animals at the top of the food chain with no predators include animals such as large sharks and killer whales. Some animals eat plants and animals and are called omnivores Ask class for examples, e.g. triggerfish, pufferfish. Some animals also eat dead and decaying plant and animal material Ask class for examples e.g. sea cucumber (beche-‐de-‐mer), crabs, some shells. Show trophic levels within the foodweb/food chains drawn. http://www.teachoceanscience.net/teaching_resources/education_modules/coral_reefs_and_climate_change/why_are_predators_important/
Activity 3.5: Teacher to ask students to identify verbally the trophic level of their organism (from Activity 3.4). (5-‐10 mins)
Energy pyramid
The food chain consists of trophic levels, or the levels within the food chain in which energy is transformed. Due to basic principles of thermodynamics, energy is always lost to the environment any time an organism at one trophic level uses the energy from the trophic level below. For example, the energy gained by animals that eat phytoplankton is less than the amount of energy initially available. Every trophic level loses energy, so trophic levels are often illustrated as a pyramid with primary producers forming the base. At the apex, or top, is the highest level consumer or top predator (see Figure 3.5).
Figure 3.5. Diagram representing the transfer of energy through trophic levels of a marine food web.

The higher up the food web the more energy lost from lower trophic groups.
This can be represented as an energy pyramid. This is shown in Figure 3.6 and how it links to trophic levels and food webs.
Figure 3.6. An energy pyramid demonstrating the energy loss as you move up the food chain.
This energy pyramid always shows a decrease in energy moving up trophic levels because:
• Only a certain amount of food is captured and eaten by organisms on the next trophic level. • Some of food that is eaten cannot be digested and exits digestive tract as undigested waste. • Only a portion of digested food becomes part of the organism's body; rest is used as source
of energy. • A substantial portion of food energy goes to build proteins, lipids, carbohydrates and to fuel
growth and movement.
So it takes about 1000 grams (or 1kg) of plant energy to create one gram of, say, shark biomass (meat). So the energy “stored” in a living shark is a large amount of the ecosystem’s energy.
That also means eating 1 gram of “top predator” meat (e.g. shark) takes the same energy out of the system as eating 1000 grams of seaweed. Or eating 100grams of a herbivore (e.g. rabbitfish) takes the same energy out of the ecosystem as 1000grams of seaweed.
Connectivity (see also section on “Movement” in Unit 5)
Plants and animals within an ecosystem can also be connected between habitats. For example, the Red Emperor (Lutjanus sebae) spends different parts of its life in different parts of the ecosystem. Adult male and female fish spawn on coral reefs producing millions of sperm and eggs into the water column. Once a single sperm fertilises one of the millions of eggs released during spawning the life of a Red Emperor begins. The egg hatches into a baby fish (larvae) which spends a few weeks eating other plankton and growing until it becomes more recognisable as a juvenile fish. It then moves inshore and spends some time, as a young fish, in the inshore seagrass beds. Once it gets larger and approaches maturity it starts moving offshore again to soft and hard seabed habitats. Once the fish becomes a mature adult the process starts again.

Page 23 A project managed by The Nature Conservancy on behalf of AusAidand implemented by the Australian Tropical Marine Alliance
(James Cook University, University of Queensland, University of Western Australia, the Australian Institute of Marine Science, Charles Darwin University) and the Coral Triangle Center
Other species, such as Spanish mackerel and tuna, can move large distances throughout their lives through different regions. This story, of how habitats and different parts of the ocean are connected by the fact that fish use different habitats at different stages during their lives, is just one of millions of such stories. And all the stories put together form the fabric of connectivity between habitats of tropical coastal marine ecosystems.
The connections also extend to the catchments where the quality of the water flowing into the sea is important to the survival of, for example, the coastal habitats such as mangroves and seagrasses which are used by larval and juvenile fish that often form part of coastal fisheries. Some reef species even use estuaries during different stages of their life, particularly juvenile stages.
Use the red emperor connectivity poster here to demonstrate (Figure 3.7).
Figure 3.7. Life cycle of the red emperor (Lutjanus sebae) showing the connectivity of different life history stages with different habitats across the continental shelf of the GBR. Source: Russell Kelley.
In an ecosystem approach to fisheries management it is therefore important to ensure maintenance of all habitats and species within an ecosystems as they are all reliant upon each other either in ways that we understand or, often, ways that we perhaps do not understand yet. Further reading: Student to read BACK side of Blue Highway poster. 1 Cury, P., L. Shannon, and Y.-‐J. Shin. 2003. The functioning of marine ecosystems: a fisheries
perspective. Pages 103-‐125 in M. Sinclair and G. Valdimarsson, editors. Responsible fisheries in the marine ecosystem. FAO, Rome. 1

Unit 4: Ecosystem Approach to Fisheries Management (EAFM)
Student outcome: an understanding of an ecosystem approach to fisheries management and how it differs from other management approaches
Activity 4.1: Break the class into groups of 3-‐6 students and ask them to discuss examples of the different types of management approaches used locally. Groups to present back to the class. (15 mins)
Conventional fisheries management Historically, fisheries have been managed with a focus on controlling the human activity associated with fisheries using both input and output controls. That is, controlling what gears can be used, where and when they can be used (input controls) and controlling what is caught and how much (output controls). This conventional approach tends to focus on one target species, addresses only issues directly associated with the particular fishery, and has a top-‐down approach (government dominated). For several reasons we won’t go into here, there are many examples of the failure of conventional fisheries management.
Derivation of ecosystem approaches With the adoption of sustainable development as a core concept during the early 1980s, many sectors/disciplines started to look at approaches they could use to achieve sustainable development. Sustainable development strives to balance ecological well-‐being and human well-‐being (Figure 4.1).
Figure 4.1. Sustainable development is a balance between ecological well-‐being and human well-‐being (Source: Staples and Funge-‐Smith, 2009) 1. This has led to multiple different types of management approaches based on the same principles with the two main differences among them being how the balance between ecological and human factors is achieved, and the number and scope of sectors being considered. EAFM is one such management approach. Defining EAFM Conventional fisheries management involves managing the target species and fishery in isolation of the wider ecosystem. However, other parts of the ecosystem are impacted by fishing and target species are impacted by factors other than fishing. An ecosystem approach to fisheries management combines conventional fisheries management with ecosystem management recognising that humans are part of the ecosystem. Therefore, although EAFM is generally the responsibility of fisheries agencies, the full implementation requires a cooperative approach with other agencies responsible for other activities that impact on the aquatic ecosystem (FAO, 2005)1. EAFM focuses

Page 25 A project managed by The Nature Conservancy on behalf of AusAidand implemented by the Australian Tropical Marine Alliance
(James Cook University, University of Queensland, University of Western Australia, the Australian Institute of Marine Science, Charles Darwin University) and the Coral Triangle Center
primarily on managing fisheries, in a way that is consistent with the well-‐being of the wider ecosystem (both natural and human). The CTI has adopted the FAO (2005) definition of the ecosystem approach to fisheries management: “An ecosystem approach to fisheries management is defined as striving to balance diverse societal objectives by taking into account the knowledge and uncertainties about biotic, abiotic and human components of ecosystems and their interactions and applying an integrated approach to fisheries within ecologically meaningful boundaries.” The aim of the ecosystem approach to fisheries management is to “plan, develop and manage fisheries in a manner that addresses the multiple needs and desires of societies, without jeopardizing the options for future generations to benefit from the full range of goods and services provided by marine ecosystem.” (FAO, 2003)2. The key FAO principles that EAFM should address are that:
• fisheries should be managed to limit their impact on the ecosystem to an acceptable level; • ecological relationships between species should be maintained; • management measures should be compatible across the entire distribution of the resource; • precaution in decision-‐making and action is needed because the knowledge on ecosystems is incomplete; • governance should ensure both human and ecosystem well-‐being and equity.
Advanced students
Convention on Biological Diversity Principles of the Ecosystem Approach The wider principles identified by the Convention on Biological Diversity (CBD) for an ecosystem approach in any environment, terrestrial or aquatic, are also useful and are shown below. All the CBD principles are relevant and important in EAFM as well, and are consistent with the FAO list of principles in the previous paragraph. Principle 1: The objectives of management of land, water and living resources are a matter of
societal choice. Principle 2: Management should be decentralized to the lowest appropriate level. Principle 3: Ecosystem managers should consider the effects (actual or potential) of their activities
on adjacent and other ecosystems. Principle 4: Recognizing potential gains from management, there is usually a need to understand and
manage the ecosystem in an economic context. Any such ecosystem management programme should: a) reduce those market distortions that adversely affect biological diversity; b) align incentives to promote biodiversity conservation and sustainable use; c) internalize costs and benefits in the given ecosystem to the extent feasible.
Principle 5: Conservation of ecosystem structure and functioning, in order to maintain ecosystem services, should be a priority target of the ecosystem approach.
Principle 6: Ecosystems must be managed within the limits of their functioning. Principle 7: The ecosystem approach should be undertaken at the appropriate spatial and temporal
scales. Principle 8: Recognizing the varying temporal scales and lag-‐effects that characterize ecosystem

processes, objectives for ecosystem management should be set for the long term. Principle 9: Management must recognize that change is inevitable. Principle 10: The ecosystem approach should seek the appropriate balance between, and integration
of, conservation and use of biological diversity. Principle 11: The ecosystem approach should consider all forms of relevant information, including
scientific and indigenous and local knowledge, innovations and practices. Principle 12: The ecosystem approach should involve all relevant sectors of society and scientific
disciplines. More detail can be obtained from Decision V/6 of the fifth Conference of the Parties to the Convention on Biological Diversity at: www.biodiv.org/decisions/default.aspx?m=COP-‐05&id=7147&lg=0
How EAFM is different to conventional fisheries management? EAFM is really an extension of conventional fisheries management, utilising the full range of conventional management tools (input and out controls), while broadening the scope of management to encompass multiple target species and factors that both directly and indirectly may impact the fishery. This includes the broader ecocystem as well as the social and economic dimensions of fisheries. Table 4.1. Conventional and ecosystem approaches to fisheries management contrasted (Source: APFIC 2009)1. Conventional approaches Ecosystem approaches Few fisheries management objectives.
Expanded scope of fisheries management to explicitly address ecosystem and socio-‐economic considerations.
Sectoral, i.e. focuses mainly on fisheries sector issues.
Deals more explicitly with the interactions of the fishery sector with other sectors, e.g. coastal development, tourism, aquaculture, navigation, petroleum industry.
Deals mainly with target species.
Responds to concerns of the broader impacts of fisheries on the marine ecosystem, including impacts on the habitat, on vulnerable species, on biodiversity etc.
Addresses fisheries management issues at the stock/fishery scale.
Addresses the key issues at the appropriate spatial and temporal scales. These are often nested (local, national, sub-‐regional, regional, global).
Predictive, with decision-‐making mainly based on results from mathematical or statistical models that assess the outcomes of different management strategies.
Given the uncertainty associated with many of the issues to be dealt with, because of limited data availability and poor knowledge of relevant processes, adaptive strategies are recognized as being more useful.
Scientific knowledge is considered the only valid knowledge as a basis for decision-‐
Recognizing that it is not possible to obtain scientific knowledge on all the issues to be dealt with,

Page 27 A project managed by The Nature Conservancy on behalf of AusAidand implemented by the Australian Tropical Marine Alliance
(James Cook University, University of Queensland, University of Western Australia, the Australian Institute of Marine Science, Charles Darwin University) and the Coral Triangle Center
making.
alternative knowledge (e.g. traditional knowledge) can be utilized as a basis for decision-‐making.
Operates through regulations and penalties for non-‐compliance.
Encourages compliance with regulations through incentives.
Top-‐down (command and control) approaches typifies conventional fisheries management
Participatory approaches, e.g. various forms of co-‐management are a key feature of EAFM.
Addresses mainly corporate (fisheries sector) interests.
Addresses the interests and aspirations of a broader stakeholder community.
Discussion: Discuss with the class Table 4.1 in the context of local marine tenure? How does traditional local management compare with EAFM? Students need to start thinking about how EAFM may be applied in a local context. (30 mins)
Other management approaches How does EAFM contrast to ICZM, EBM, MPAs, CBRM/co-‐management, the precautionary principle (see picture in (USAID US CTI Support Program, 2011)(Staples, 2009)). See also Preston 20093. From Staples 20091: When adopting sustainable development as a core concept, many sectors/disciplines started to look at how to achieve it (sustainable development). All the approaches used by the different sectors/disciplines have ended up with similar principles guiding them to achieving sustainable development with the two main differences being:
• the balance between ecological and human well-‐being, and • the number and scope of the sectors (e.g. fisheries, agriculture, oil/gas, etc) being considered.
The following provides a few examples of different variations of the ecosystem approach developed by different groups.
Ecosystem-‐based management (EBM) The main difference between EAFM and EBM is that while EAFM is primarily focused on managing a particular sector, EBM focuses on holistically managing entire ecosystems, integrating all of the sectors that are both influenced by the ecosystem or that impact the ecosystem. Hence, EBM necessarily requires inter-‐sectoral coordination focused on managing to sustain ecosystem function and well-‐being to provide ecosystem goods and services for society. However, as long as the impact of the environment on fishing, the impact of fishing on the environment and the socio-‐economic benefits that can be gained from fishing are considered, then the different terms may be interchangeable. Because human activities on land and in the ocean are changing coastal and marine ecosystems they threaten the ability of those ecosystems to provide important benefits to society, such as healthy and abundant seafood and protection from storms and flooding. EBM is a management approach aiming to address all these challenges. It considers the whole ecosystem, including humans and the environment, rather than managing one issue or one resource in isolation.
Key aspects of EBM include:
• Integration of ecological, social, and economic goals and recognition of humans as key components of the ecosystem.
• Consideration of ecological-‐ not just political-‐ boundaries. • Accounting for the complexity of natural processes and social systems and using an adaptive
management approach in the face of resulting uncertainties. • Engaging multiple stakeholders in a collaborative process to define problems and find
solutions. • Incorporating understanding of ecosystem processes and how ecosystems respond to
environmental perturbations. • Concern with the ecological integrity of coastal-‐marine systems and the sustainability of
both human and ecological systems. Integrated coastal zone management Generally focused on a particular coastal region of interest, Integrated Coastal Zone Management (ICZM) is a dynamic management process aiming at a sustainable social and economic development of coastal zones (tourism, agriculture, fishing, industry, maritime transport), taking into account the coastal ecosystems and landscapes, the diversity of activities and uses, their interaction and their impact on both the marine and land part of the coastal zone (Figure 4.2). It is also known as integrated coastal management (ICM), integrated coastal area management (ICAM), integrated coastal resource management (ICRM), coastal zone management (CZM), and in inland areas as integrated catchment management (ICM).
Figure 4.2. A typical landscape focus for Integrated Coastal Zone Management showing the types of issues that this approach attempts to manage.

Page 29 A project managed by The Nature Conservancy on behalf of AusAidand implemented by the Australian Tropical Marine Alliance
(James Cook University, University of Queensland, University of Western Australia, the Australian Institute of Marine Science, Charles Darwin University) and the Coral Triangle Center
Co-‐management/Community-‐based resource management (adapted from SPC 20101) Community-‐based resource management (CBRM), or co-‐management, refers to a management system under which communities take a leading role (or a bottom-‐up approach) in managing their resources including relevant land and sea areas in partnership with, or with support from, a promoting agency (Figure 4.3). Communities in the Pacific Islands have been involved in managing and protecting their coastal ecosystems and fish stocks for many hundreds of years. And now, many government and NGOs are actively encouraging communities to take on more management responsibilities under CBRM projects. (See NFA 20071)
Figure 4.3. The shift from more conventional top-‐down government management approaches to the bottom-‐up community controlled management. Co-‐management is a negotiation among relevant stakeholders (Source: Govan et al, 20081).
Advanced students: There is a separate curriculum and course under development within this project on Community Based Resource Management (CBRM) which can be undertaken by interested students. Also, see also Principles of CBRM from Solomon Islands (on the EAFM CD in the folder “Solomons Fisheries Information“ under References and Further Reading).

Table 4.2. Summary of key differences among the main management approaches described here.
Management approaches Management elements Conventional EAFM EBM ICZM CBRM
Ecosystem scale Per fishery
Multiple fisheries &
wider ecosystems
Entire ecosystem
Terrestrial and marine coastal
zone Varied
Geographic scale
Local -‐ regional
Local -‐ regional
Regional – may cross jurisdictions
Regional Local -‐ regional
Sectors Fishery Principally fishery All All Varied
Governance Top-‐down Shift to bottom-‐up
Shift to bottom-‐up
Shift to bottom-‐up Bottom-‐up
Objectives Ecological Ecological, social and economic
Ecological, social and economic
Ecological, social and economic
Ecological, social and economic
Management tools
Input/output controls
Conventional & ecosystem tools, eg. MPAs
Conventional & ecosystem tools, eg. MPAs
Conventional & ecosystem tools, eg. MPAs
Conventional & ecosystem tools, eg. MPAs
The Coral Triangle Support Partnership’s Ecosystem Approach to Fisheries Management Technical Advisory Group has illustrated the inter-‐linkages between these different but inter-‐related management approaches using the diagram shown in Figure 4.4.(USAID 2011) 1

Page 31 A project managed by The Nature Conservancy on behalf of AusAidand implemented by the Australian Tropical Marine Alliance
(James Cook University, University of Queensland, University of Western Australia, the Australian Institute of Marine Science, Charles Darwin University) and the Coral Triangle Center
Figure 4.4. Inter-‐relationships between the different management approaches available. Source: CTSP EAFM Technical Brief 20111 Marine Protected Areas (from Fernandes et al 2012)2 Marine protected areas (MPAs) are a management tool that can be used in any approach to marine resource management. MPAs are not just no-‐take areas; they encompass a range of types of protection. A marine protected area is included in IUCN’s definition of protected area which is “A clearly defined geographical space, recognised, dedicated and managed, through legal or other effective means, to achieve the long-‐term conservation of nature with associated ecosystem services and cultural values.” (Dudley 2008) 2. IUCN/WCPA (1994) 2 in (Sale, Van Lavieren et al. 2010)2
explicitly defined MPA as a means to protect part or all of the enclosed environment. Protected areas are distinguished from other kinds of marine spatial zoning in that they have nature conservation as a primary rather than a secondary aim (World Commission on Protected Areas -‐ Marine 2010) 2. The category VI protected areas explicitly have the sustainable use of natural resources as a means to achieve nature conservation (Dudley 2008) 2. In this way, then, any clearly defined, managed area that contributes to protection of natural resources in some way is a marine protected area. Therefore, marine protected areas can be used to describe locally managed marine areas, multiple use marine parks, marine spatial zoning, etc.
Precautionary principle The precautionary principle means that “where there are threats of serious irreversible damage, lack of full scientific certainty shall not be used as a reason for postponing cost-‐effective measures to prevent environmental degradation” (FAO 2003) 2.
It applies to all the management tools and approaches discussed above with the exception of more conventional, scientific approaches to fisheries management. More than ever, ecosystem approaches to management necessitate the use of the precautionary principle through:
• use of the best available knowledge. • acceptance that information requirements will be incomplete.
For example, the PNG National Beche-‐de-‐mer Management Plan explicitly advocates the use of the precautionary principle saying: “Precautionary Approach” means setting down restrictions to control harvesting in absence of adequate scientific data. These restrictions include setting of TAC, seasonal and area closure and control fishing efforts.
Activity 4.2: Form small groups and decide on how an EAFM may be applied to a specified area that is consistent with local custom. Report back to class explaining why. (15 mins) Further reading: NFA (2007) Community-‐based fisheries management: a training manual for workers involved in
community-‐based management. National Fisheries Authority and Coastal Fisheries Management and devlopment Project, 2007. Kavieng, Papua New Guinea1.
CTSP EAF Technical Working Group. 2012. Coral Triangle Regional Ecosystem Approach to Fisheries Management (EAFM) Guidelines Page 33. CTSP, Jakarta.2
FAO (2003) Fisheries management. 2. The ecosystem approach to fisheries. FAO Fisheries Technical Guidelines No. 4, Suppl. 2, Food and Agriculture Organization of the United Nations, Rome.
FAO (2005) Putting into practice the ecosystem approach to fisheries. Food and Agriculture Organization of the United Nations, Rome, 2005, 76pp. 1
Fernandes, L., A. Green, J. Tanzer, A. White, P. M. Alino, J. Jompa, P. Lokani, A. Soemodinoto, M. Knight, B. Pomeroy, H. Possingham, and B. Pressey. (2012) Biophysical principles for designing resilient networks of marine protected areas to integrate fisheries, biodiversity and climate change objectives in the Coral Triangle. Coral Triangle Support Partnership, Jakarta. Executive Summary only. 2
Govan, H., Aalbersberg, W., Tawake, A., and Parks, J. (2008) Locally Managed Marine Areas: A guide for practitioners. The Locally-‐Managed Marine Area Network. 1
Staples, D. And S. Funge-‐Smith. 2009. Ecosystem approach to fisheries and aquaculture: implementing the FAO Code of Conduct for Responsible Fisheries. RAP Publication 2009/11, FAO Regional Office for Asia and the Pacific, Bangkok. 1
USAID US CTI Support Program, (2011) An Ecosystem Approach to Fisheries Management (EAFM) and the Coral Triangle Initiative. Technical brief. 1
Page 33 A project managed by The Nature Conservancy on behalf of AusAidand implemented by the Australian Tropical Marine Alliance
(James Cook University, University of Queensland, University of Western Australia, the Australian Institute of Marine Science, Charles Darwin University) and the Coral Triangle Center
Unit 5: Fish biology
Student outcome: understanding of the life history characteristics that are important for fisheries management
Activity 5.1: Ask students to identify the processes that lead to changes in fish populations. (3 mins)
Population dynamics Population dynamics describes how a population changes in size through time. The dynamics of fish populations or stocks is described by a simple equation called Russell’s Axiom (Russell 1931)3:
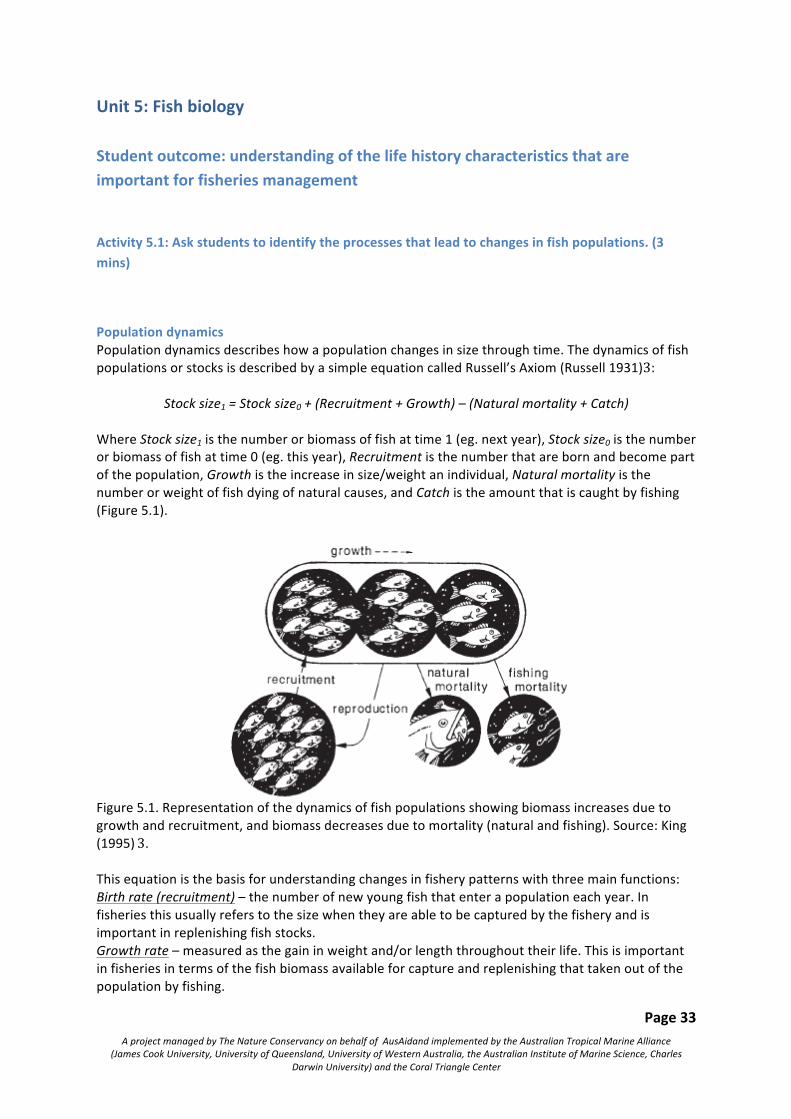
Stock size1 = Stock size0 + (Recruitment + Growth) – (Natural mortality + Catch)
Where Stock size1 is the number or biomass of fish at time 1 (eg. next year), Stock size0 is the number or biomass of fish at time 0 (eg. this year), Recruitment is the number that are born and become part of the population, Growth is the increase in size/weight an individual, Natural mortality is the number or weight of fish dying of natural causes, and Catch is the amount that is caught by fishing (Figure 5.1).
Figure 5.1. Representation of the dynamics of fish populations showing biomass increases due to growth and recruitment, and biomass decreases due to mortality (natural and fishing). Source: King (1995) 3. This equation is the basis for understanding changes in fishery patterns with three main functions: Birth rate (recruitment) – the number of new young fish that enter a population each year. In fisheries this usually refers to the size when they are able to be captured by the fishery and is important in replenishing fish stocks. Growth rate – measured as the gain in weight and/or length throughout their life. This is important in fisheries in terms of the fish biomass available for capture and replenishing that taken out of the population by fishing.
Mortality – this is made up of fishing mortality and natural mortality.
Activity 5.2: Ask students to identify the different reproductive strategies in local marine animals. Teacher to write these on a flip chart. (5 mins)
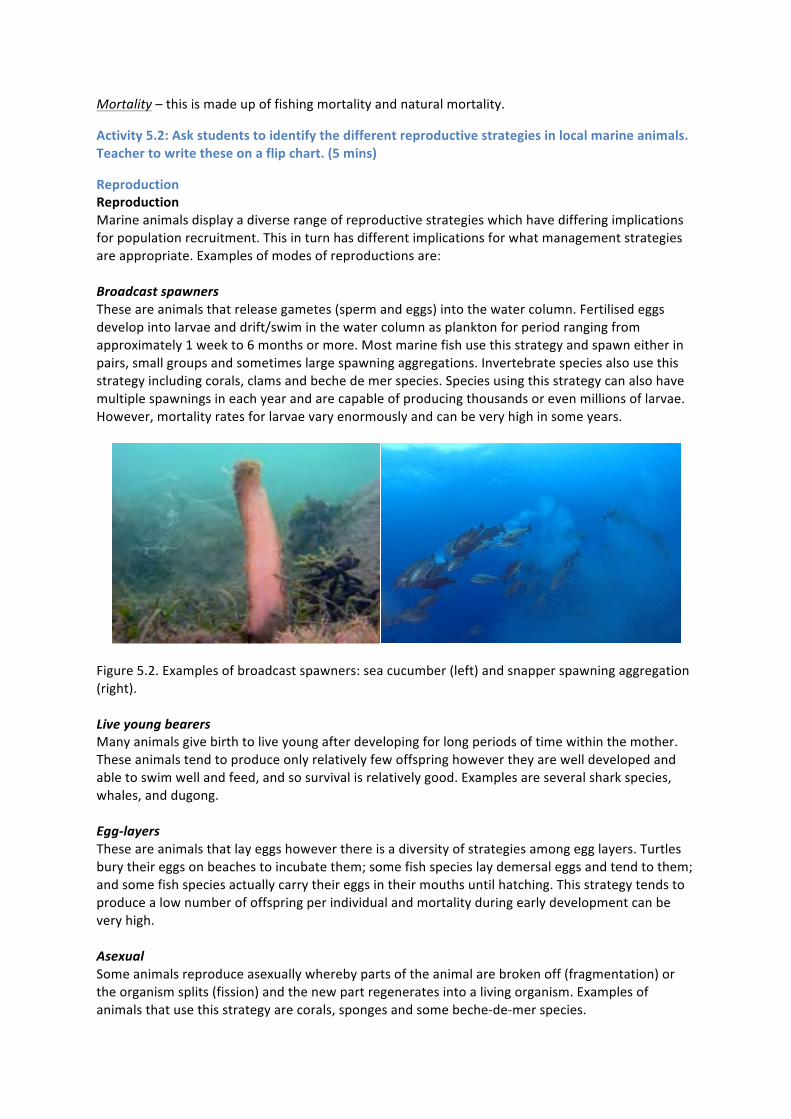
Reproduction Reproduction Marine animals display a diverse range of reproductive strategies which have differing implications for population recruitment. This in turn has different implications for what management strategies are appropriate. Examples of modes of reproductions are: Broadcast spawners These are animals that release gametes (sperm and eggs) into the water column. Fertilised eggs develop into larvae and drift/swim in the water column as plankton for period ranging from approximately 1 week to 6 months or more. Most marine fish use this strategy and spawn either in pairs, small groups and sometimes large spawning aggregations. Invertebrate species also use this strategy including corals, clams and beche de mer species. Species using this strategy can also have multiple spawnings in each year and are capable of producing thousands or even millions of larvae. However, mortality rates for larvae vary enormously and can be very high in some years.
Figure 5.2. Examples of broadcast spawners: sea cucumber (left) and snapper spawning aggregation (right). Live young bearers Many animals give birth to live young after developing for long periods of time within the mother. These animals tend to produce only relatively few offspring however they are well developed and able to swim well and feed, and so survival is relatively good. Examples are several shark species, whales, and dugong. Egg-‐layers These are animals that lay eggs however there is a diversity of strategies among egg layers. Turtles bury their eggs on beaches to incubate them; some fish species lay demersal eggs and tend to them; and some fish species actually carry their eggs in their mouths until hatching. This strategy tends to produce a low number of offspring per individual and mortality during early development can be very high. Asexual Some animals reproduce asexually whereby parts of the animal are broken off (fragmentation) or the organism splits (fission) and the new part regenerates into a living organism. Examples of animals that use this strategy are corals, sponges and some beche-‐de-‐mer species.

Page 35 A project managed by The Nature Conservancy on behalf of AusAidand implemented by the Australian Tropical Marine Alliance
(James Cook University, University of Queensland, University of Western Australia, the Australian Institute of Marine Science, Charles Darwin University) and the Coral Triangle Center
DVD: Fish and People – Module 2: Where do fish come from? (12 mins).
Recruitment The recruitment processes in marine animals will vary depending on their reproductive strategy. Regardless of the strategy the timing of spawning and larval development is very important. A species spawning season will usually coincide with periods of favourable environmental conditions for the survival of their offspring. However, the marine environment is highly variable and life in the plankton in particular is tough. Success of larval recruitment is linked to a temporal alignment of fish reproducing, larvae hatching, and plankton (prey) abundance (Match-‐Mismatch hypothesis; Cushing, 19743), and directly influences the size of fishery populations. In years of high larval survival subsequent recruitment to the fishery means good fishing years. This is why even without fishing occurring fish populations will naturally vary in number from year to year. Maintaining healthy populations of adult fish (spawning biomass) is critical to ensuring enough offspring are produced to withstand the bad years and prevent the fishery from collapsing. Research has demonstrated that as fish size increases their fecundity (number of eggs produced) increases exponentially. Also, larger and older fish have been shown to produce more robust larvae. It is therefore important to maintain fish populations that have adequate spawning biomass that includes large individuals.
DVD: Fish and People Module 3: How to make fish (12 mins).
DVD: SCRFA spawning aggregations (2.5 mins).
Activity 5.3: Ask students to identify reasons why an animal may die. (3 mins)
Mortality Mortality in marine populations can be due to either natural factors (M) or due to fishing (F). Natural factors include disease, predation by other species or old age. Natural mortality is something we have very little control over, however fishing mortality is something we can control. As discussed in Unit 2 there are a number of ways of doing this including:
• Controls on the total amount of fishing effort (eg. limits on the number of boats or people). • Controls on the total amount of catch. • Controls on where and/or when fishing is allowed. • Controls on the sizes of fish allowed to be caught.
Productivity Productivity represents the capacity for a population to replenish itself and involves several processes. In general a highly productive stock is one that has a high rate of turnover of generations. This can be influenced by the key processes of recruitment, growth, maturation, longevity and mortality. For example, sardines are early maturing, highly fecund, fast growing fish with high mortality rates that only live for a year or two. This is the “live fast, die young” mode. This means that what we take out of the population by fishing has the capacity to be replaced the following year

because what is not caught will produce recruits that grow fast enough and mature early enough to become available to the fishery the following year. In contrast, some cod species are slow growing, mature at an older age, and therefore don’t recruit to the fishery until several years after being born. These species tend to be longer lived also. In this case replenishing populations can take several years, particularly after heavy fishing. In either situation the most important thing is to maintain enough animals in the population for spawning, and enough large individuals, to ensure enough recruitment in subsequent years. Simply knowing the longevity, or maximum age a species reaches, can provide a very reasonable indication of their productivity.
Activity 5.4: Put students in groups of 4-‐6 and ask them to write on butchers paper and place different species according to how productive they are. Use the productivity groupings: most productive, moderately productive, least productive. Use the following species: grey reef shark, coral trout, cuttlefish, grouper, white tip reef shark, sea cucumber, turtle, anchovy, stingray, snapper. Students can add their own if they like. Groups to present to class and explain their groupings. (20 mins)
(Most: anchovy, cuttlefish; Moderate: grouper, coral trout, sea cucumber, snapper; Least: grey reef shark, white tip reef shark, stingray, turtle).
Use of SPC fact sheets are very useful for this activity http://www.spc.int/images/publications/en/Divisions/Fisheries/Anon_11_Guide_InfoSheetsForCommunities.pdf also on CD: SPC 2011 List of taxonomic fact sheets available includes: Finfish Invertebrates 1. Groupers (Epinephelidae) 9. Sea cucumbers (Holothurians) 2. Rabbitfish (Siganidae) 10. Giant clams (Tridacnidae) 3. Emperors (Lethrinidae) 11. Trochus (Tectus niloticus) 4. Parrotfish (Scaridae) 12. Mangrove crab (Scylla serrata) 5. Reef snappers (Lutjanidae) 13. Spiny lobsters (Palinuridae) 6. Trevallies (Carangidae) 14. Coconut crab (Birgus latro) 7. Mullets (Mugilidae) 15. Octopuses 8. Surgeonfish (Acanthuridae) 16. Green snail (Turbo marmoratus)
Advanced students
Sustainable yield The concept of sustainable yield is driven by Russell’s Axiom. Sustainable yield, or catch, is the level of catch that can be taken from a population indefinitely. Maximum Sustainable Yield (MSY) has long been used in fisheries around the world to try and maximise how much is caught, however this approach has several key assumptions and its use has led to several fishery collapses. This has generally been used in a single species management approach but for the purpose of this course understanding the principles behind MSY is more useful than trying to measure and/or attain it.
Page 37 A project managed by The Nature Conservancy on behalf of AusAidand implemented by the Australian Tropical Marine Alliance
(James Cook University, University of Queensland, University of Western Australia, the Australian Institute of Marine Science, Charles Darwin University) and the Coral Triangle Center
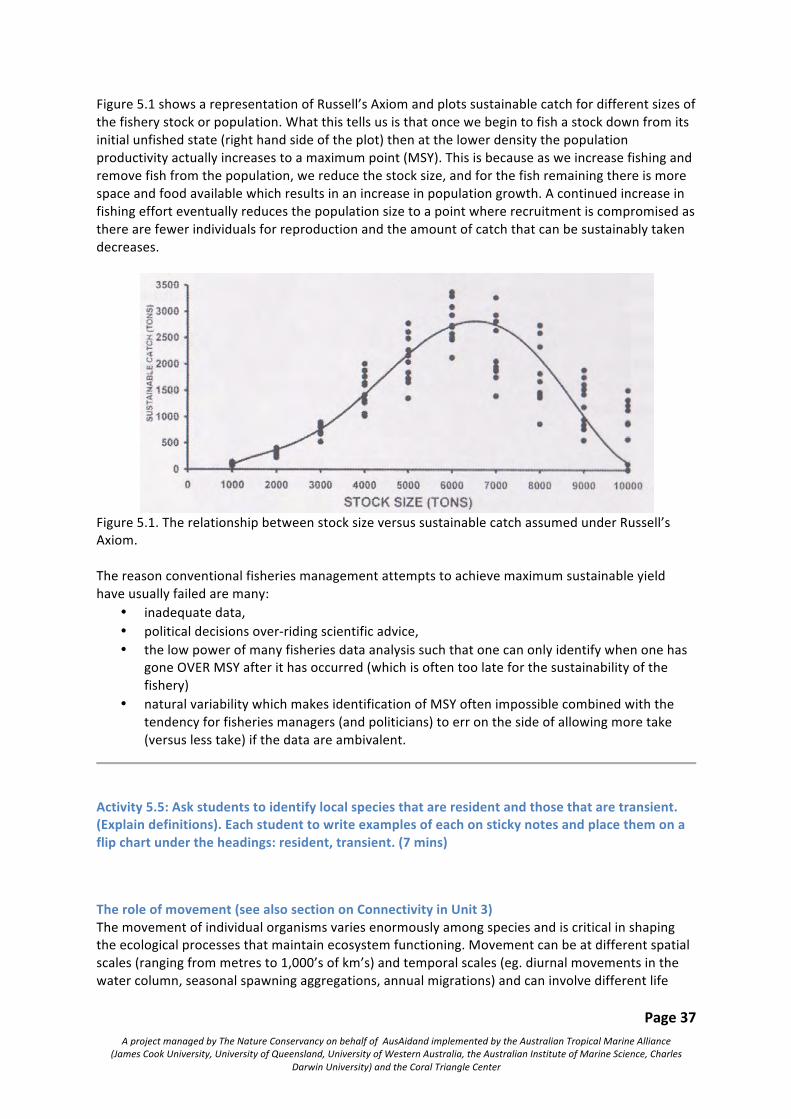
Figure 5.1 shows a representation of Russell’s Axiom and plots sustainable catch for different sizes of the fishery stock or population. What this tells us is that once we begin to fish a stock down from its initial unfished state (right hand side of the plot) then at the lower density the population productivity actually increases to a maximum point (MSY). This is because as we increase fishing and remove fish from the population, we reduce the stock size, and for the fish remaining there is more space and food available which results in an increase in population growth. A continued increase in fishing effort eventually reduces the population size to a point where recruitment is compromised as there are fewer individuals for reproduction and the amount of catch that can be sustainably taken decreases.
Figure 5.1. The relationship between stock size versus sustainable catch assumed under Russell’s Axiom. The reason conventional fisheries management attempts to achieve maximum sustainable yield have usually failed are many:
• inadequate data, • political decisions over-‐riding scientific advice, • the low power of many fisheries data analysis such that one can only identify when one has
gone OVER MSY after it has occurred (which is often too late for the sustainability of the fishery)
• natural variability which makes identification of MSY often impossible combined with the tendency for fisheries managers (and politicians) to err on the side of allowing more take (versus less take) if the data are ambivalent.
Activity 5.5: Ask students to identify local species that are resident and those that are transient. (Explain definitions). Each student to write examples of each on sticky notes and place them on a flip chart under the headings: resident, transient. (7 mins)
The role of movement (see also section on Connectivity in Unit 3) The movement of individual organisms varies enormously among species and is critical in shaping the ecological processes that maintain ecosystem functioning. Movement can be at different spatial scales (ranging from metres to 1,000’s of km’s) and temporal scales (eg. diurnal movements in the water column, seasonal spawning aggregations, annual migrations) and can involve different life

history stages. These movements are what determine the connectivity within and among groups of species making up an ecosystem. At a species level understanding the level of connectivity among individuals helps to manage these populations appropriately. Consider this example: Imagine a local fish species important for your community and your village agree to impose strict catch limits due to concerns that numbers have been decreasing year after year. Imagine also that this species migrates in Spring every year to aggregate for spawning in the fishing grounds of a neighbouring community who don’t have any catch limits and target the fish when they are gathered for spawning. This situation would likely result in your own imposed management being ineffective and catches by your village (and your neighbours) would continue to decrease. Simply having the knowledge of this annual movement and sharing the information with neighbouring communities who target them, can result in co-‐ordinated efforts to apply management that ensures the species is not depleted and both communities can continue to catch this species into the future. This demonstrates what in fisheries is called the unit stock, which although it can be defined in many ways, refers to “an intraspecific group of randomly mating individuals with temporal or spatial integrity” (Ihssen et al., 19813). In other words, a stock is a group of animals belonging to the same species that share the same geographic area throughout their lifetime. Knowledge of stocks and their structure for target species is viewed as the basis for any fishery analysis (Cadrin et al., 20053).
Advanced students
Activity: Explain the above hypothetical situation and ask the class for suggested strategies that may be used to overcome the issue described above. Eg. extend the management area by negotiation/consultation; develop a management plan to protect the spawning aggregation (temporal and/or spatial closure), etc.
Movement can occur at different life history stages of animals. Movement of adults in marine species has been extensively studied. Some species are fairly sedentary and set up territories in reef habitats. Examples of these species are some serranids such as coral trout and cods. Other species are transitory in nature and may only temporarily pass through an area. Examples of these species include pelagic species like mackerels and tunas. Movement at the larval stage has been far less studied due to the challenges in working with such tiny animals. However, this area of study is particularly important for establishing connectivity among otherwise sedentary populations of fish, and in assessing the effectiveness of marine protected areas. It is well established that no-‐take marine reserves (NTMR) can hold more fish and larger more fecund fish. The benefit of such areas to adjacent areas where fishing occurs can be either through adult fish moving outside the NTMR boundaries (spillover effect), or by increased larval production and recruitment to areas outside the NTMR (Figure 5.3). This latter strategy requires movement of larvae. Studies have shown that coral reef fish larvae, although tiny and subjected to strong currents, exhibit clear behavioural patterns and many have strong swimming capabilities.

Page 39 A project managed by The Nature Conservancy on behalf of AusAidand implemented by the Australian Tropical Marine Alliance
(James Cook University, University of Queensland, University of Western Australia, the Australian Institute of Marine Science, Charles Darwin University) and the Coral Triangle Center
Figure 5.3. The role of movement among the different life history stages of a particular species in the context of a no-‐take marien reserve (NTMR). Source: King (19953).
Activity 5.6: Ask students to answer the following questions in their notebooks under the heading ‘Activity 5.6’. Questions: What are differences between ecosystems and populations? Write in notebooks why foodwebs, energy pyramids and movement matter to fisheries management. (25 mins)
Importance of life history in EAFM Very few fisheries are so selective that they only catch a single species. Most fisheries affect many species and especially in the tropics fisheries are generally multi-‐species, either as target species or bycatch species. However, as discussed previously, some species are more productive than others. This means that in multi-‐species fisheries some species will be more vulnerable to fishing and will also take longer to recover from fishing. Multi-‐species fisheries ultimately alter the species assemblage of ecosystems either directly through removal of fish or indirectly through modification to habitats. In an EAFM context, management measures and associated objectives need to take into account low productivity species as well as high productivity species.
DVD: Fish and People Module 4: Larval lifeboats near and far. (12 mins).

Homework: Answer the following questions in your notebook:
Q1. What are the four population processes that contribute to changes in a population?
Q2. What are three different modes of reproduction in animals that live in marine ecosystems? Rank them in order from most productive to least productive in terms of fishing that they could support. Further reading: King, M. 2007. Fisheries biology, assessment and management. 2nd Ed., Oxford, UK, Wiley-‐Blackwell
Publishing. 382 pp. 3 SPC (2011) Guide to information sheets on fisheries management for communities. SPC, Noumea,
New Caledonia.1 also available at: http://www.spc.int/images/publications/en/Divisions/Fisheries/Anon_11_Guide_InfoSheetsForCommunities.pdf

Page 41 A project managed by The Nature Conservancy on behalf of AusAidand implemented by the Australian Tropical Marine Alliance
(James Cook University, University of Queensland, University of Western Australia, the Australian Institute of Marine Science, Charles Darwin University) and the Coral Triangle Center
Unit 6: Local coastal fisheries
Student outcomes: understanding of what constitutes coastal fisheries and the key biological, social and economic characteristics of PNG and Solomon Islands coastal fisheries
UNIT 6a. Papua New Guinea Coastal Fisheries
Activity 6.1: Assess prior knowledge by class discussion of their understanding of coastal fisheries in their country
What are Coastal Fisheries? Fishing in PNG fisheries waters is broadly divided into 2 main categories. The first category is Offshore or Oceanic fishing. This type of fishing takes place in the sea area far away from the coastline mainly in the area known as the Exclusive Economic Zone (EEZ) and the Archipelagic waters. Large industrial-‐scale purse-‐seine and longline fishing vessels are mainly used in the offshore fisheries. The second category of fishing is Coastal Fisheries which is the focus of this Unit. Fishing that takes place on fringing reefs, barrier reefs, lagoons, estuaries and neashore areas from the shoreline to about 6 nautical miles offshore are generally known as Coastal Fisheries. The resources that support coastal fisheries are characterised by a shallow-‐water habitat, demersal lifestyle, restriction of individual movements to coastal areas and, in most cases, a more restricted larval dispersal (see Gillett, 20102). Recent recruitment and connectivity studies in Manus and Kimbe by a group of institutions including James Cook University suggest that some reef fish species are self recruiting to the same reef areas and get recruits from adjacent reefs. Coastal fisheries can be divided further into into three categories;
1. Small Scale Commercial Fishing also known as Artisanal Fishing 2. Subsistence Fishing 3. Industrial Scale Prawn fishing.
About 300 species of the estimated 2,000 species of reef fish found in PNG are exploited by the coastal fisheries sector on a regular basis. In addition, a large number of shells and other sedentary species are also exploited. PNG has an extensive coastline of 21,250 km and a reef systems that is generally healthy. Approximately 61 % of the PNG population live within 100 km of the coastline (Table 6.1). The estimated total coastal fisheries production for PNG in 2007 was 35,000 tonnes with subsistence harvesting accounting for 80% of this production.

Table 6a.1. Estimates of the total coastal fishing area available in PNG with an indication of human population sizes that potentially rely on these areas for fishing.
Small Scale Commercial Fishing (Artisanal Fishing) Small Scale commercial fishing use small motorised boats and simple low maintainance fishing gear. In PNG and other parts of the Pacific Islands, small scale commercial fishing is done primarily for sale of fish and other marine organisms at local markets or for export to overseas markets. Small Scale Commercial Fishing for Local Markets The vessels used in this sub-‐category of coastal fisheries are normally smaller than those used in Asia and other parts of the world. The most common vessels used are 19 to 21 foot fibreglass dinghys powered by 40 HP outboard engines. Village canoes are more commonly used by the coastal and Island communities. Wading and gleaning on the reef flat during low tide is also common especially for the collection of sedentary organisms such as clams and other shells.
PROVINCE REEF AREA (hectares)-‐ less than
30 m deep
POPULATION 2011 CENSUS
PERCENT COASTAL POPULATION
COASTAL POPULATION
COASTLINE (km)
MILNE BAY 1,287,000 269,954 63.1 170,340 2,624CENTRAL 187,000 237,016 27.9 66,127 748EAST SEPIK 21,000 433,481 5.9 25,575 304SANDAUN 20,000 227,657 12.3 28,001 278MANUS 230,000 50,321 53.6 26,972 568NEW IRELAND 139,000 161,165 77.1 124,258 1,650BOUGAINVILLE 240,000 234,280 23.0 55,200 806MOROBE 77,000 646,876 6.7 43,340 752ORO 517,000 176,206 11.5 20,263 650MADANG 29,000 487,460 10.4 50,695 628GULF ? 121,128 29.8 36,096 746WESTERN 104,200 180,455 14.4 25,985 1,058NCD -‐ 318,128 100 318,128 -‐WEST NEW BRITAIN 137,000 242,676 43.2 104,836 1,640
EAST NEW BRITAIN 68,000 271,252 27.1 73,509 774
TOTAL 2,923,000 4,058,055 1,118,630 13,226 (21,250 REVISED TOTAL)

Page 43 A project managed by The Nature Conservancy on behalf of AusAidand implemented by the Australian Tropical Marine Alliance
(James Cook University, University of Queensland, University of Western Australia, the Australian Institute of Marine Science, Charles Darwin University) and the Coral Triangle Center
Figure 6a.1. Fresh fish being sold at the Kavieng fish market, PNG. Photo: Paul Lokani. Fishing methods commonly used in small scale fishing for local markets include handlining, trolling, drop lining, surface spear fishing, underwater spear fishing, hand collecting, gill netting and surround netting. The main driver for the small scale commercial fishing for local markets are local urban markets located in all the 14 coastal provinces. Some provinces have a number of urban centers and therefore have a number of urban markets. Local shops and local restaurants also buy fish and other marine products from the small scale commercial fishermen. To better understand the key characteristics of the Small Scale Commercial Fishing for local markets, two examples are given below: the Port Moresby Artisanal Reef Fishery and the Madang Inshore Fish Aggregation Device Fishery. Example 1: Port Moresby Artisanal Reef Fishery The Port Moresby Artisanal Reef Fishery (see area map in Figure 6a.4) was studied by Lock (1986) in the mid 1980’s. A fleet of 71 vessels comprising motorised dinghy’s and sailing canoes crewed by 284 full time fishermen fished in close proximity to the urban markets in Port Moresby. The fishery was concentrated on the fishing areas around the surrounding fringing reefs and barrier reefs in five villages to the west of Port Moresby. Eight different fishing methods were used in the fishery with fishermen shifting gear according to the weather patterns and seasonality of fish. Fishing methods used by the fishery were:
• Surround Net • Drive Net • Handline • Surface spear • Underwater spear • Trolling • Barrier Net • Gill Net
Lock (1986) 3 recorded 24 families of fish caught by the fishery (see Table 6.2). Surround net

accounted for 33% of the catch and drive net accounted for 28% of the catch. Annual fish catch per vessel ranged from 3.6 to 12.9 tonnes. Average yearly catch for the fishery was over 500 tonnes. Table. 6a.2. Total Annual Landings (kg) by the Port Moresby Artisanal Reef Fishery. Source: Lock (1986) 3.
Common Name Family Total Annual Landing (kg) Composition %
Sharks Carcharhinidae 4,192 0.7 Rays Myliobatidae 2,101 0.4 Milkfsh Chanidae 2,976 0.5 Half-‐beak Hemiramphidae 6,047 1.1 Longtom Belonidae 29,806 5.2 Grouper Serranidae 14,329 2.5 Jacks Carangidae 48,102 8.3 Snapper Lutjanidae 27,316 4.7 Silver Biddies Gerridae 9,882 1.7 Sweetlips Haemulidae 22,298 3.9 Emperor Lethrinidae 168,947 29.3 Seabream Sparidae 1,039 0.2 Goatfish Mullidae 25,881 4.5 Batfish Ephippidae 1,260 0.2 Bluefish Kyphosidae 5,398 0.9 Mullet Mugillidae 23,223 4.0 Barracuda Sphyraenidae 4,106 0.7 Wrasse Labridae 4,572 0.8 Parrotfish Scaridae 29,959 5.2 Unicornfish Acanthuridae 39,533 6.8 Rabbitfish Siganidae 31,897 5.5 Tuna and mackerel Scombridae 58,462 10.1 Triggerfish Ballistidae 2,211 0.4 Other 13,840 2.4 Total 577,377
Example 2: Madang Inshore Fish Aggregation Devices Fishery The Madang Inshore Fish Aggregation Devices (IFAD) fishery (see area map in Figure 6a.4) recently started around 2007. The fishery is based entirely on fishing IFADs. About four IFADS were deployed by RD Fishing along the coast of Madang that could be accessed from Madang Town in 1 to 2 hours as part of its social responsibility to help local fishermen. An estimated 60 dinghys powered by 40 HP regularly fish the IFADS. A number of IFADS were also deployed around Karkar Island for use by local Karkar Island fishermen. Observations and interviews with villagers at Karkar indicate extensive use of IFADs at Karkar Island by canoe fishermen. Between 50 and 70 canoes normally fish around a single IFAD at Karkar when the tuna aggregate in large numbers. The main target species of the IFADs fishermen are skipjack tuna, yellowfin tuna, sailfish and marlins. Other species such as rainbow runners and dolphin fish are also caught on the IFADs. There are two main types of vessels used by the fishery: 21 foot fibre glass dinghys powered by 40 HP with 3 fishermen in each dinghy; and small canoes with one fishermen using paddle power (mainly at Karkar Island). There are approximately 180 fishermen in total who crew the dinghys that fish the IFADs. Both canoe fishermen and dinghys normally leave for the IFADS very early in the morning

Page 45 A project managed by The Nature Conservancy on behalf of AusAidand implemented by the Australian Tropical Marine Alliance
(James Cook University, University of Queensland, University of Western Australia, the Australian Institute of Marine Science, Charles Darwin University) and the Coral Triangle Center
before sunrise around 5 am and fish around the IFADs for half a day or full day depending on the catch before they go home to sell the catch. At Karkar Island women sell the catch for the canoe fishermen at the local Island markets or sell them on the mainland of Madang. Women also sell the catch of the dinghy fishermen, mainly at the Madang town markets. Fish are sold acording to size of the fish or the portion of the fish. Large fish such as marlin and sailfish are normally chopped into steak portions and sold for K4.00 each. A 30 cm fish is sold for about 20-‐30 kina per fish. Each Dinghy spends between 90 and 180 kina on a daily basis for fuel. Each dinghy therefore targets to catch enough fish to break even or make a profit. The Madang IFAD fishery is conservatively estimated to land 300 to 400 tonnes per year worth over 3 to 4 million kina.
Figure 6a.2. A fish aggregating device (FAD) now commonly used in deep open ocean areas in throughout the Pacific to enhance fishing opportunities. Above shows a diagram of how they are constructed and anchored (King, 19953), and below shows the surface view of a FAD (Photo: Paul Lokani).

Small Scale Commercial Fishing for Export Infrastructure, logistics and the high cost of freighting fish and other marine products to markets have limited the full development of the small scale commercial fisheries in PNG. However, small scale fishing for the high value species which require no specialised preservation has been the focus of efforts of small scale fishermen. Species requiring little or simple preservation methods include sea cucumbers which are processed into beche-‐de-‐mer, trochus shells, pearl shells, shark fin and crabs. All the export targeted species attract high prices and therefore fisher folks target them often leading to over-‐harvesting. Lobster, aquarium trade species and live fish trade species are also high value export target species but require more specialised and technical skills to handle properly for export. The current export driven fisheries have similar characteristics that include the following;
• High Value • Easy to harvest requiring simple fishing gear • Require minimal capital investment (except live fish and Aquarium Trade) • Heavily fished • Often over-‐fished • Simple preservation methods
A brief description of two of the export fisheries (beche-‐de-‐mer and trochus) are given below. Beche-‐de-‐mer fishery Despite management of the fishery under the beche-‐de-‐mer fishery management plan, the fishery has been heavily overfished. The fishery is currently closed for 6 years due to overharvesting and continously exceeding the total allowable catches for the provinces. The characteristics of the fishery prior to this closure are summarised below. Of the 1.1 million people who live on the coast and islands in PNG it is estimated that between 200,000 and half a million people were involved in the harvesting and processing of sea cucumbers. Harvesting of sea cucumber is very simple and involves reef walking and collecting sea cucumbers during low tide or snorkelling. Traditional canoes with paddle power was the main vessel used by the fishery but outboard powered dinghys were commonly used as well to reach distant reefs. Most of the collection of sea cucumbers was on the reef flats but fisher folks also collected from the reef slopes and lagoon floor within breathholding limits. More than 21 species of sea cucumbers have been harvested in PNG. Distribution patterns of each sea cucumber species is habitat dependent. Some species such as sandfish are only found in sandy lagoon areas and grassy sand beds. The surf redfish on the other hand is only found in high energy areas where there are breaking waves. Most of the species spawn between November and January but are highly dependent on high density for successful fertilisation. Sustainability of the fishery is therefore dependent on maintaining a high spawning population density. It is therefore important that fishermen don‘t harvest every sea cucumber they see. After collecting sea cucumbers, the specimens go through a process of boiling and sun or smoke drying before they are sold to beche-‐de-‐mer buyers and exporters. In 2001 PNG exported 503 tonnes valued at K17.8 million with the low value species accounting for more than 60% of the total export. Between 2000 and 2009 PNG exported a total of 5.5 million tonnes of beche-‐de-‐mer with an export value of 296 million kina. Average annual production for the same period was 555 tonnes with an average annual value of K29 million. Export peaked at 795 tonnes with an export value of 52

Page 47 A project managed by The Nature Conservancy on behalf of AusAidand implemented by the Australian Tropical Marine Alliance
(James Cook University, University of Queensland, University of Western Australia, the Australian Institute of Marine Science, Charles Darwin University) and the Coral Triangle Center
million kina in 2007. This dropped to 537 tonnes valued at 36 million kina in 2009 when the fishery was closed. PNG used to supply 10% of the global beche-‐de-‐mer market. Trochus fishery Trochus (Trochus niloticus) is a dried product that is harvested by local communities and sold to traders, exporters and processors. Harvesting involves snorkelling and hand collecting the trochus shells. The shells are collected for the production of quality buttons and ornaments made from its nacrenous inner layer. The powdered scraps resulting from button manufacture are used in lacquers and shampoos. The shell trade is important to coastal communities as it does not require large investment or specialised equipment and the product is non-‐perishable. The easy access to the resource also makes it susceptible to over-‐harvesting. Trochus is graded into three categories (small, medium and large) and can be exported either as unprocessed or as buttons. There is no management plan for this fishery but there are specific size limits set out in the national gazette number G57 of 4th April 2002 which provides the basis for regulating the size of trochus shells that are harvested. The highest quantity of trochus buttons exported was in 2000 with 39.9 mt however the value of trochus buttons earnings peaked at US$3.1million in 1996 and 1997.
Figure 6a.3. Algal encrusted trochus shell on a coral reef. Source: SPC (2011) Guide and information sheets for fishing communities1.
Industrial Scale Prawn Fishing There are 3 main prawn fisheries in PNG located in the Gulf of Papua, Torres Strait Protected Zone and Orangerie Bay. All three fisheries use industrial trawlers which unfortunately result in a high volume of bycatch. There are more than 40 species of prawns found in Papua New Guinea but only a few species are commercially fished. The main commercial fishery is the Gulf of Papua Prawn Fishery where the main target prawn species are the banana prawns (Penaeus merguiensis and P. indicus), black tiger prawns (P. monodon) and endeavour prawns (Metapenaeus ensis, M. demani).

The production level from the Gulf of Papua Prawn fishery varies from 400–1300 (all species) tonnes per year. Ninety percent of the prawns are exported. About 50-‐60 % of the catch consists of banana prawns (P.merguiensis and P.indicus), 10-‐15 % tiger prawns (P. monodon and P. semisulcatus), and 15-‐20% endeavour prawns (M. ensis, M.endeavouri and M.demani). The rest is mostly packed as mixed grades, consisting of broken tails and soft shell prawns. The Gulf of Papua Prawn Management Plan restricts the total of number of prawn trawlers to 15. The plan also restricts participation in this fishery to companies owned by PNG citizens. The 15 vessels are operated by 7 companies. Some of these vessels were built in the 1950s and used to operate in the Gulf of Carpentaria Prawn fishery before being resold to the current operators in PNG. The rise in costs of fuel coupled with the need for occasional maintenance of the vessels has increased the costs of operation for the companies. The Torres Strait Prawn Fishery is jointly managed with Australia under the Torres Strait Treaty. The number of prawn trawlers varies and is limited because of the high cost of operating the fishing vessels away from Port Moresby where the prawn trawlers are normally resupplied however some companies operate from Daru. The Orangerie Bay Prawn Fishery normally has one boat and is managed under a management plan. Unfortunately the fishery is closed due to a conflict between the surrounding communities and the company operating the prawn trawler. The fishery is normally worth about K100,000.00 annually.
Figure 6a.4. Map showing the area for the main commercial prawn fishery in the Gulf of papua, PNG. The map also shows the main areas for the Madang IFAD fishery and the Port Moresby reef fish fishery. Source: Paul Lokani.
Subsistence Fishing Subsistence fishing refers to fishing carried out by local communities for their own consumption and for cultural purposes as their ancestors have done for thousands of years. Both traditional fishing

Page 49 A project managed by The Nature Conservancy on behalf of AusAidand implemented by the Australian Tropical Marine Alliance
(James Cook University, University of Queensland, University of Western Australia, the Australian Institute of Marine Science, Charles Darwin University) and the Coral Triangle Center
gears and more modern conventional fishing gears are being used today. Fishing normally takes place in traditional fishing areas owned by the clan or the community. Of the 4 million people who live in the 14 coastal provinces of PNG, an estimated 1.1 million people depend on their daily food and nutritional requirements from the sea (2010 National Census)3. Typical characteristics for subsistence fishing in PNG are:
• Fishing is based on traditional, customary and cultural norms. • There are certain fishing methods for women and others for men. • Women and the young commonly do reef gleaning to collect sedentary species such as
clams and other shells. • Mostly traditional canoes are used in fishing. • Traditional management is practised in some areas. • Some types of fishing gear are labour intensive requiring communal efforts. • The catch is shared among family members. • Part of the catch is often used for exchange of vegetables and other garden foods.
Figure 6a.5. Young villagers using a modern gillnet to target schooling baitfish, PNG. Photo: Paul Lokani. Traditional canoes on paddle power are the main fishing vessels used in the subsistence fishery but there is an increasing trend to use more modern vessels such as fibreglass dinghy’s powered by outboard motors. Subsistence fishing mainly takes place on the reefs, in lagoons, estuaries and mangrove swamps. A variety of traditional fishing gears are used but modern gear such as nylon fishing lines and nets are commonly used.
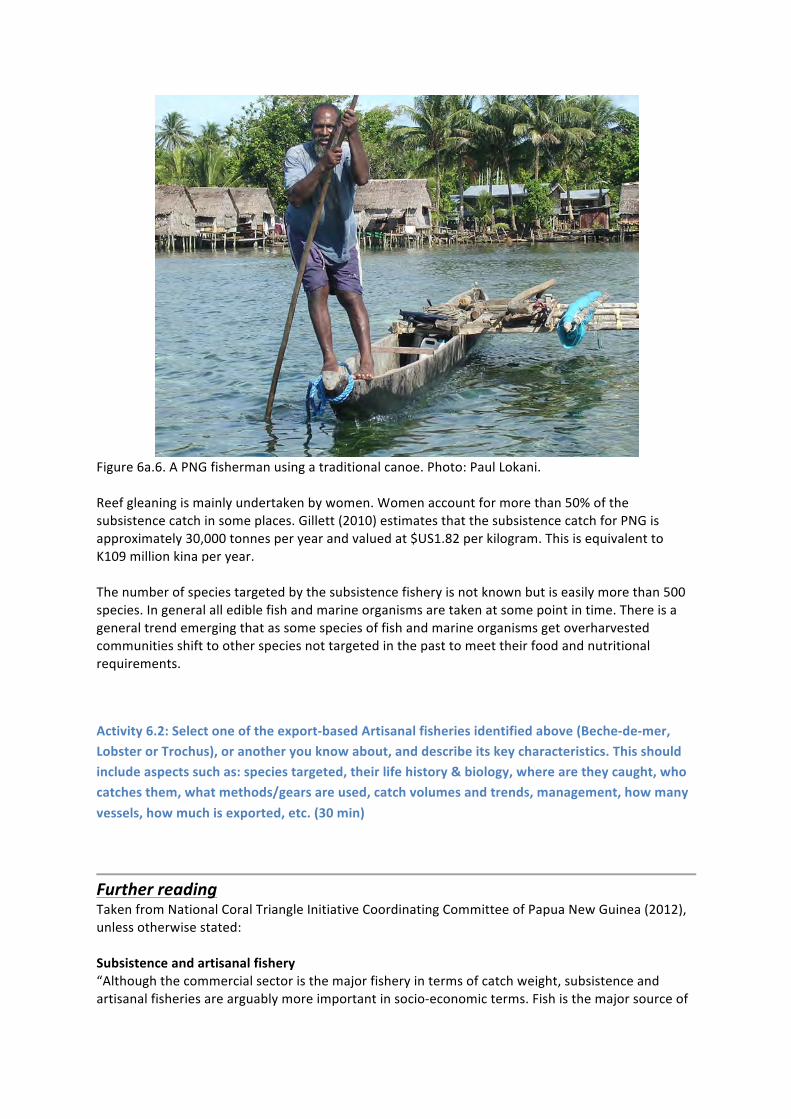
Figure 6a.6. A PNG fisherman using a traditional canoe. Photo: Paul Lokani. Reef gleaning is mainly undertaken by women. Women account for more than 50% of the subsistence catch in some places. Gillett (2010) estimates that the subsistence catch for PNG is approximately 30,000 tonnes per year and valued at $US1.82 per kilogram. This is equivalent to K109 million kina per year. The number of species targeted by the subsistence fishery is not known but is easily more than 500 species. In general all edible fish and marine organisms are taken at some point in time. There is a general trend emerging that as some species of fish and marine organisms get overharvested communities shift to other species not targeted in the past to meet their food and nutritional requirements.
Activity 6.2: Select one of the export-‐based Artisanal fisheries identified above (Beche-‐de-‐mer, Lobster or Trochus), or another you know about, and describe its key characteristics. This should include aspects such as: species targeted, their life history & biology, where are they caught, who catches them, what methods/gears are used, catch volumes and trends, management, how many vessels, how much is exported, etc. (30 min)
Further reading Taken from National Coral Triangle Initiative Coordinating Committee of Papua New Guinea (2012), unless otherwise stated: Subsistence and artisanal fishery “Although the commercial sector is the major fishery in terms of catch weight, subsistence and artisanal fisheries are arguably more important in socio-‐economic terms. Fish is the major source of

Page 51 A project managed by The Nature Conservancy on behalf of AusAidand implemented by the Australian Tropical Marine Alliance
(James Cook University, University of Queensland, University of Western Australia, the Australian Institute of Marine Science, Charles Darwin University) and the Coral Triangle Center
protein for the coastal populations throughout the Papua New Guinea mainland and islands, and is a part of the staple diet in these areas. Fish are also one of the main sources of cash income for coastal communities, many of whom will take their catch 100 kilometres or more to reach a market where they can be sold for cash. In many communities, fish that are not consumed immediately and those that will be taken to market, are smoked to extend their “shelf-‐life”, as fresh fish deteriorate rapidly in the tropical climate. The subsistence and artisanal sector provide most of the fish for the domestic market, and for export, including niche markets such as shellfish and beche-‐de-‐mer. The beche-‐de-‐mer fishery is reported to be the most valuable coastal fishery in Papua New Guinea. The subsistence and artisanal fisheries are concentrated in coastal and near-‐shore waters (generally within the 3-‐mile limit), and use a variety of methods, depending on the target catch. Although these fisheries have supported the coastal populations of Papua New Guinea for centuries, the rapid growth in coastal populations and the increasing demand for cash income has in recent years led to an increase in subsistence and artisanal fishing activity, raising serious concerns over the sustainability of coastal fish stocks. This is particularly so for those species that have a high export value, such as beche-‐de-‐mer and some shellfish such as trochus and the giant clam, which attract high overseas earnings and are therefore particularly at risk of overharvesting in a cash-‐poor economy. Rural island households in Milne Bay Province have responded to their loss of purchasing power (the effects of inflation and decreasing commodity prices such as copra) and the increasing demand for sedentary fish products by increasing their harvesting levels of commercially valuable species. Although anecdotal evidence increasingly suggests that some of these coastal stocks are declining, there appears to be a lack of reliable and accurate information on either coastal fish stocks or fish catches, so that accurate estimates of sustainable yield cannot be calculated, or indeed how serious the risk of overexploitation is at the current levels of fishing. In these circumstances, a precautionary approach should be adopted. However, subsistence and artisanal fisheries are, by their nature, difficult to manage and regulate by government agencies. Experience to date suggests that sustainable management of these fisheries is best achieved through a combination of agency regulation and community based awareness programs and local skills’ development programs for the local fishing communities. These should be designed to engage and then empower the local fishing communities to monitor and manage their own local fisheries resources in a more sustainable manner. There is considerable concern, at both local and national levels, over recently introduced destructive fishing methods such as poisoning with derris powder and dynamite fishing. These methods are non-‐selective in impact and destroy large numbers of individuals of all species, and in the case of dynamite fishing, physically destroy the habitat as well.” Commercial fishery “The main commercial fishing species are tuna and prawns. A total of 19 prawn vessels operate in PNG. Of the total, fifteen domestic prawn trawlers operate in the Gulf of Papua Prawn Fishery, while one operates in the Orangerie Bay Prawn Fishery and three in the Torres Strait Fishery. In the Gulf of Papua fishery, a total annual catch from all species of prawns is on average about 1, 000 metric tonnes (tail weight) per annum, with an estimated value of K10 million (AUS$ 5 million). The fishery remains closed to foreign involvement. Prawns are processed and packed on board and mainly exported to Japan, Singapore and Australia or are sold domestically within PNG. The fishery is managed under the Gulf of Papua Prawn Fishery Management Plan. The fishery is believed to be

nearing its catch potential and with the increase efficiency in fishing effort has raised concerns.” (http://fisheries.gov.pg.dnnmax.com/ Accessed 24/9/12) The prawn and lobster fisheries in the Torres Strait Protected Zone are being co-‐managed with Australia under the Torres Strait Treaty Arrangements. The management is aimed at preserving the fishery for the traditional inhabitants, with strict limited entry for non-‐inhabitants. The lobster fishery currently involves more than five hundred divers annually and generates an annual estimated average of about 80 mt, worth approximately a little over K4 million in exports alone. The prawn fishery has still availabilities for more active fishing vessels to participate. Restrictions and high fishing operational cost appear to make this fishery less economic than the Gulf of Papua prawn fishery. An annual harvest of prawn (all species) was worth approximately K3 million in exports alone and products exported to Asian markets. (http://fisheries.gov.pg.dnnmax.com/ Accessed 24/9/12) The Orangerie Bay Prawn fishery has one active vessel. The annual export value of prawns (all species) from Orangerie Bay fishery is worth an approximate of K100,000. The Orangerie Bay Prawn Fishery Management Plan manages the fishery. (http://fisheries.gov.pg.dnnmax.com/ Accessed 24/9/12) “The Papua New Guinea (PNG) tuna fishery is made up of both the purse-‐seine and longline sectors with a small, but important handline sector. The longline and handline sector is a citizen-‐only activity and all vessels fish exclusively in the waters under PNG national jurisdiction. The purse-‐seine sector is a mix of both domestic and foreign access vessels. A total of 256 vessels were active in the PNG waters in 2010. Thirty-‐two (32) were longline and handline vessels and 224 were purse-‐seine vessels.” Fisheries degradation and food security “A significant loss of coastal fisheries is very evident along the coastline of PNG. Major populated provinces that have depended heavily on their marine resources to sustain their livelihoods have become under stress from fishing pressure and the methods of fishing while other factors including easy access to distant or protected fishing grounds by outboard powered engines and fiberglass boats. Many of the 14 Maritime Provinces have agro-‐forestry projects located inland. These projects have over the last 20 years have contributed immensely to the degradation of the marine resources and their habitats and the other major form of degradation is from natural seasons of heavy rainfall and long drought spell. Food security has been a very serious problem mainly with coastal province which have major gold and copper mines located within their provinces. The Western Province located southernmost part of PNG bordering Indonesia has been recently impacted by recent flooding caused by heavy rains further up the Fly River. A total of 15 villages located along the coast were inundated by flooding which has destroyed food gardens, smothered sea grass meadows, caused flooding to tributaries and has prompted most of the marine resources to become unsafe to eat. Comparison from the last 12 months have recorded over 15% of men, women and children that are experiencing symptoms of arthritis, serious skin diseases, allergies, complications of women in child birth, and unknown death related to eating of reef fishes.”
References & further reading: Anon. (2010) National Fishery Sector Overview of Papua New Guinea. FAO, Rome3. Gillett, R., (2010) Marine fishery resources of the Pacific Islands. FAO Fisheries and Aquaculture
Technical Paper 537.2

Page 53 A project managed by The Nature Conservancy on behalf of AusAidand implemented by the Australian Tropical Marine Alliance
(James Cook University, University of Queensland, University of Western Australia, the Australian Institute of Marine Science, Charles Darwin University) and the Coral Triangle Center
Gillett, R and Cartwright, I. (2010) The future of Pacific Island fisheries. Secretariat of the Pacific Community and Forum Fisheries Agency. 2
Lock.J.M, (1986) Study of the Port Moresby Artisanal Reef Fishery. Technical Report 86/1. DPI. 3 National Coral Triangle Initiative Coordinating Committee of Papua New Guinea. (2012) State of the
Coral Reefs of Papua New Guinea. Government of Papua New Guinea, Port Moresby.1 Pratchett, M. S., P. L. Munday, N. A. J. Graham, M. Kronen, S. Pinca, K. Friedman, T. D. Brewer, J. D.
Bell, S. K. Wilson, J. E. Cinner, J. P. Kinch, R. J. Lawton, A. J. Williams, L. Chapman, F. Magron, and A. Webb. (2011) Vulnerability of coastal fisheries in the tropical Pacific to climate change. Pages 493-‐576 in J. D. Bell, J. E. Johnson, and A. J. Hobday, editors. Vulnerability of tropical Pacific fisheries and aquaculture to climate change. Secretariat of the Pacific Community, Noumea.3
Secretariat of the Pacific Community. (2011) Guide and information sheets for fishing communities. Secretariat of the Pacific Community, Noumea.1
Willmann, R. and K. Kelleher. (2010) Economic trends in global marine fisheries. Pages 20-‐42 in R. Q. Grafton, R. Hilborn, D. Squires, M. Tait, and M. J. Williams, editors. Handbook of marine fisheries conservation and management. Oxford University Press, New York. 3
Also see: http://www.fisheries.gov.pg/

UNIT 6b. Solomon Island Coastal Fisheries
Activity 6.1: Assess prior knowledge by class discussion of their understanding of coastal fisheries in their country
Coastal fisheries in the Solomon Islands All references used in this section are on the EAFM CD under “Further Reading“ and “Solomons Fisheries Information“ unless otherwise indicated. The Solomon Islands is made up of approximately 990 islands that form a double-‐chained archipelago. There are 6 main islands that make up a total land area of 27,556 km2 and have a total Exclusive Economic Zone (ocean) area of approximately 1,553,444 km2 (Bell et al, 2011). There is an important tuna fishery in the Solomon Islands, however, this is mainly an off-‐shore fishery (therefore its management is not addressed in this course) and mainly comprised of a foreign fleet. This fishery brings about US$4.5 million/year (~SBD$31 million) to the government in licensing (Sulu et al 2012). Coastal fishing occurs on fringing reefs, barrier reefs, atolls, lagoons, intertidal reef flats, estuaries and neashore areas. In 2007 the total annual coastal fisheries catch was estimated to be 18,250 t with approximately 3,250 t being commercial catch and the remainder subsistence. Coastal fisheries target four major species groups:
1. Demersal species – bottom-‐dwelling fish associated with coral reefs, mangroves and seagrass habitat,
2. Nearshore pelagic fish – includes tuna, Spanish mackerel, mahi mahi, wahoo and rainbow runner,
3. Invertebrates targeted for export, and 4. Invertebrates gleaned from intertidal and subtidal areas (Bell et al, 2011)2.
Demersal fish species make up nearly half (49 %) of the total coastal fisheries catch by weight followed by nearshore pelagic species (31 %), inter/subtidal invertebrates (15 %) and invertebrates for export (5 %) (Bell et al, 2011) 2. Of the demersal fish species the tropical snappers (Lutjanidae) are the single most commonly taken Family (18.1 %) followed by Serranids (13.1 %) (Figure 6b.1). The composition of species in the catch varies greatly throughout different regions of the Solomon Islands.

Page 55 A project managed by The Nature Conservancy on behalf of AusAidand implemented by the Australian Tropical Marine Alliance
(James Cook University, University of Queensland, University of Western Australia, the Australian Institute of Marine Science, Charles Darwin University) and the Coral Triangle Center
Figure 6b.1. Composition of catch of demersal fish species by family throughout the Solomon Islands. Adapted from Bell et al, 20112. Nearshore pelagic fish species are targeted using trolling methods or line fishing methods around FADs. The species targeted include tuna and mahi mahi, with Spanish mackerel being especially important. Of the invertebrate species targeted for export sea cucumbers and trochus have been the most important being of high value. Both sea cucumber and trochus have been heavily exploited in the Solomon Islands until a national ban on the harvest of sea cucumber species in 2010. Trochus continues to be heavily harvested but is showing similar trends of overfishing as seen with sea cucumber (Sulu et al, 2012). Invertebrate species that are harvested by gleaning are diverse however giant clams make up approximately half of the total annual catch (Figure 6b.2).
Figure 6b.2. Composition of catch of invertebrate species caught by gleaning throughout the Solomon Islands. Adapted from Bell et al, 20112. In the Solomon Islands coastal fisheries fall in to two main categories:
1. Subsistence fishing 2. Small scale fishing
0
5
10
15
20
25
30
Catch compo
sition (%
)
0
10
20
30
40
50
Catch compo
sition (%
)

Subsistence fishing (Source: Sulu et al, 2012) The subsistence economy is the mainstay of rural Solomon Islands, with coastal fisheries having a vital role. Fishing and gardening is the main livelihood of rural communities. There are no figures on the actual extent of fishing activities in the country let alone subsistence fishing, however, it is estimated that nearly half of all women and 90% of men fish. In most rural households, at least one member of each household is involved in fishing. Fishing is mostly done in wooden dugout canoes, and motor powered fibreglass boats, using simple fishing gear like handlines, nets or spears. Surplus garden and fishing products are often either shared with other community members or sold for cash income to purchase household necessities. Depending on household needs, a greater proportion of fish catch (usually the best) will be sold either fresh or cooked at local markets. Other forms of cash-‐earning livelihoods are limited due to the lack of transport and processing infrastructure, and the non-‐existence of microcredit schemes that can be accessed by households in rural areas. More than half (56%) of rural households in the Solomon Islands rely on home production as the main source of income compared to only 5% in the urban areas. Fish (includes shellfish and other inshore marine resources) plays a pivotal role in food security and income generation for Solomon Islanders. Solomon Islands have one of the highest per capita consumption rates of fish in the world. Although different estimates have been provided over time and by different sources, a recent study estimated that the average annual per capita fish consumption (kg yr-‐1) in urban areas was 45.5 kg yr-‐1, in the rural areas it was 31.2 kg yr-‐1 while the national average was 33 kg yr-‐1 (90% of this consisted of fresh fish). The global average is 16kg/yr (Willmann and Kelleher, 20103). However, the figures for Solomon Islands may be an underestimation.
Figure 6b.3. A canoe used in conjunction with a modern gillnet to target schooling baitfish in a bay near Honiara, Solomon Islands. Photo: Dave Welch.
Small scale Fisheries (Source: Sulu et al, 2012) Most rural fishers sell their catch when their household needs dictate it. There are also fishers who fish to sell at urban areas around the country, predominantly at Honiara, although there are also some who sell at the provincial urban centres like Auki (Malaita), Gizo and Munda (Western

Page 57 A project managed by The Nature Conservancy on behalf of AusAidand implemented by the Australian Tropical Marine Alliance
(James Cook University, University of Queensland, University of Western Australia, the Australian Institute of Marine Science, Charles Darwin University) and the Coral Triangle Center
Province), Tulagi (Central Province), Kirakira (Makira) and even as far as Bougainville markets for communities near the Papua New Guinea border. These nearshore fishing activities are what is referred to here as small scale fisheries. In 2006, it was estimated that 16% of households in self-‐employed commercial activity were engaged in the sale of fish and other seafood. The Ministry of Fisheries and Marine Resources (MFMR) established Rural Fisheries Centres (RFCs) in nine Provinces in the mid to late 1990s (funded by various donors). The aim of these RFCs was to stimulate rural development and income generation through fisheries development. The RFCs provide ice for fishermen and buy fish from fishers for sale elsewhere, in most cases for transport to Honiara where fish were sold at the Honiara market or directly to hotels and restaurateurs. Export trials to Australia were also conducted. In 2007, only 11 of the 30 RFC’s were deemed reasonably successful (Lindley 20073). Major factors besetting the endeavour were lack of maintenance of the facilities at the RFCs and poor transportation between the RFCs and Honiara; where transportation was available the high transportation cost of fish from distant provinces made then uneconomical, especially when they had to compete with fish from fishers from Honiara, Nggela and Russell Islands which are closer to Honiara. With support from various aid donors, several of RFCs are now undergoing repairs. The RFCs were an important source of cash income for fishers as livelihood options are limited and more so when the important sea cucumber fishery that many relied on has been closed since 2010. While there are no real estimates for the total value of the fish from these RFCs and other private fishing centres, it is estimated that rural communities provide SBD$5 million dollars worth of fish to the capital city on annual basis.
Figure 6b.4. A typical multi-‐species catch of demersal fish taken in Solomon Islands. Source: MFMR 2010. Reef finfish fisheries provides approximately SBD$21.6 million (Solomon Dollars) per annum in

income to fishers and traders involved in the reef fisheries market (Brewer 20113). Note that Brewer’s (2011) estimate was predominantly based on reef finfish fisheries and does not consider the marine ornamental trade, trochus fisheries or beche-‐de-‐mer fisheries (currently closed) which contribute significantly to income generation for Solomon Islanders, particularly those living in rural areas. The overall income value of the reef fisheries therefore could be considered substantial. Invertebrate species that are mainly targeted by coastal communities are trochus and sea cucumber. They are easy to harvest and non-‐perishable, important factors as most coastal communities have poor storage facilities and transportation services. For the decade ending 2010, trochus and sea cucumber (during pre-‐ban times) earned the country approximately SBD$45 million in export revenue. There is, however, a current national ban on the harvest and export of sea cucumber following indications that the fishery was heading towards collapse. In 2006, records from the then Department of Fisheries and Marine Resources showed that beche-‐de-‐mer exports consisted largely of low value species. The trochus fishery is also showing similar trends; a study by SPC in 2006 at four sites in the country found low densities of trochus compared to other sites in the Pacific. Declining catches of trochus over the last decades indicate overfishing in the fishery.
Marine Ornamental Trade (Source: Sulu et al, 2012) The marine ornamental trade in the Solomon Islands is comprised of cultured clams, corals and aquarium fish.
Coral The aquarium trade started in the country in 1995 (Kinch and Teitelbaum 20093) with the export of live corals beginning the same year. In 2003 the aquarium trade exports from the Solomons accounted for 4% of the international coral trade. In 2011, AASI was the sole exporter of live coral, and two companies, Halelo and Sea Abundance were exporting dead coral. Corals were mostly supplied by communities in the Central, Guadalcanal and Western provinces. Lal and Kinch (20053 in Sulu et al 2012) reported that approximately 75% of all coral exports came from the Ngella (Florida Islands) in the Central Province. Recent reports from MFMR are that licenses for exporters have not been renewed and are pending further considerations and assessments. Indicative figures as provided by MFMR in 2011 shows that while there was initially larger exports on live corals, the export of dead coral for the curio trade picked up in 2008. The value of the curio trade spiked in 2010 despite a decreased export volume. The reason provided by two curio exporters was that a better price was obtained with the assistance of MFMR. Previously, dead corals were exported in containers and sold by the container. A better deal was obtained whereby the corals were bought according to the piece and the species.
Curio trade In 2005, Sea Abundance began operation, exporting dead coral for the curio trade. The trade picked up in 2009 after a brief lull with Solomon Sea Stones (SSS) restarting its exports with a license to export 19 species of coral. Recently, the Ministry of Fisheries and Marine Resources (MFMR) and the Ministry of Environment, Climate Change, Disaster Management and Meteorology (MECDM) set up a quota system for select species from eight coral families. In 2010, there was a total coral quota of 92,000 pieces. In an assessment of the period between 2005 and 2011, approximately 79% of the products were destined for US based markets.

Page 59 A project managed by The Nature Conservancy on behalf of AusAidand implemented by the Australian Tropical Marine Alliance
(James Cook University, University of Queensland, University of Western Australia, the Australian Institute of Marine Science, Charles Darwin University) and the Coral Triangle Center
Threatened species Marine turtles play an important part in the lives of Solomon Islanders as food on special occasions, traditional ornaments and culture. There is a total ban on exporting turtle shells and a closed harvesting season for all turtle species and turtle eggs from June to August and from November to January during nesting seasons since 1993 (Sulu et al 2012). Some communities in Solomon Islands have a long history of hunting dolphins for the purpose of consumption as well as for their teeth which are used as traditional currency as well as to construct ornaments and jewellery. Export of live dolphins started in 2003 but has now, in 2012, been banned (Sulu et al 2012). Dugongs are also hunted for consumption purposes in many parts of the Solomon Islands with anecdotal indications that it may be over exploited in some locations.
Fisheries status and issues Newton et al. (20073; in Sulu et al 2012) classified Solomon Islands coral reef fisheries as being either fully exploited or collapsed. Particular groups of species that have been identified as overexploited include parrotfishes, sea cucumber, giant clams, green snail and sharks. Destructive fishing in the form of poison and blasting is also a problem in some areas (Sulu et al 2012). Existing predictions indicate that coastal fisheries will not be able to supply enough protein to meet the country’s nutritional needs (based on World Health Organisation recommendations) by 2030. Coupled with the lack of livelihoods is the lack of development in rural areas. There is even less incentive for people to start livelihood initiatives as buying centres or markets are often located far from communities and so transport costs are usually very high making such operations unprofitable. While there are Rural Fisheries Centres (RFCs) located in a number of provinces providing a service for rural fishers for purchasing fish, only 46% of them were reported as working in a 2010 summary of RCFs.
Activity 6.2: Select one of the local fisheries discussed above or another you know about, and describe its key characteristics. This should include aspects such as: species targeted, their life history & biology, where are they caught, who catches them, what methods/gears are used, catch volumes and trends, management, how many vessels, how much is exported, etc. Further reading: Albert, S., I. Tibbetts, and j. Udy. (2010) Solomon Islands marine lIfe: information on biology and
management of marine resources. University of Queensland, Brisbane1. Pratchett, M. S., P. L. Munday, N. A. J. Graham, M. Kronen, S. Pinca, K. Friedman, T. D. Brewer, J. D.
Bell, S. K. Wilson, J. E. Cinner, J. P. Kinch, R. J. Lawton, A. J. Williams, L. Chapman, F. Magron, and A. Webb. (2011) Vulnerability of coastal fisheries in the tropical Pacific to climate change. Pages 493-‐576 in J. D. Bell, J. E. Johnson, and A. J. Hobday, editors. Vulnerability of tropical Pacific fisheries and aquaculture to climate change. Secretariat of the Pacific Community, Noumea2.
Secretariat of the Pacific Community. (2011) Guide and information sheets for fishing communities. Secretariat of the Pacific Community, Noumea1.
Sulu, R. J., D. N. Boso, A. Vave-‐Karamui, S. Mauli, and L. Wini-‐Simeon. (2012) State of the Coral Reefs of Solomon Islands. Coral Triangle Marine Resources: their status, economies and

management. Solomon Islands National Coral Triangle Initiative Coordinating Committee, Honiara1.
Willmann, R. and K. Kelleher. (2010) Economic trends in global marine fisheries. Pages 20-‐42 in R. Q. Grafton, R. Hilborn, D. Squires, M. Tait, and M. J. Williams, editors. Handbook of marine fisheries conservation and management. Oxford University Press, New York3.

Page 61 A project managed by The Nature Conservancy on behalf of AusAidand implemented by the Australian Tropical Marine Alliance
(James Cook University, University of Queensland, University of Western Australia, the Australian Institute of Marine Science, Charles Darwin University) and the Coral Triangle Center
Unit 7: Governance
Student outcomes: understanding of existing formal and informal institutional characteristics of PNG & Solomon Islands coastal fisheries
Unit 7a. Papua New Guinea coastal fisheries governance
Activity 7a.1. Ask the class to write down what governance is and give examples of what they think is good governance. Governance Governance is the decision making and implementation of coastal fisheries mainly through the process of making policies, laws and rules. (http://www.unescap.org/pdd/prs/ProjectActivities/Ongoing/gg/governance.asp) There are two forms of governance for coastal fisheries in Papua New Guinea. The first one is formal governance which refers to the institutions, mechanisms and processes established through the formal government system, normally through written laws which give very specific directions and guidelines on what the law covers. The second form of governance is informal or traditional governance. Informal or traditional governance is allowed by written law through the constitution and other laws but normally do not give any specific directions on how the informal governance should be carried out. The main reason for this is that informal or traditional governance is different between communities, clans and provinces. Formal Governance Formal Governance refers to the institutions, mechanisms and processes that the government puts in place to guide and formalise decision making and implementation on policies, laws and rules. Key characteristics of formal governance are:
• There are formal written laws to support the establishment of institutions. • Governance institutions operate across large areas and for large populations such as the
whole country or the whole province. • Institutions, mechanisms and processes can be changed by changing policies, making
amendments to laws or making new laws. • Policies, laws and rules are written. • Implementation is supported by Government budget. • Policies and law can be changed through a democratic process. • Elected leaders can make decisions on policies and law.
Formal governance in PNG is structured under the National Government, Provincial Government and Local Level Government (LLG). LLG is comprised of a number of Wards. The Ward level is part of the formal and informal governance. A ward can be comprised of a single village, a number of villages or, if the population is too large, a village can be subdivided into a number of wards. Leaders are elected every five years to represent the people in each of the different layers of government. The meeting place to make laws and policies for the National elected leaders is the National Parliament while

provincial elected leaders meet at the provincial assemblies and Local Level Government elected leaders meet at the Local Level Government Assemblies. Table 7a.1. Description of the roles and the legal basis for the formal Governance institutions.
FORMAL GOVERNANCE INSTITUTION
ROLE LEGAL BASIS
National Fisheries Authority (NFA) and its Governing Board
Manage fisheries as a National resource. Formulate and implement fisheries policy. Control, regulate, & monitor fisheries. The Board provides general control and guidance over the exercise of the functions and powers of NFA. National Management Advisory Committee responsible for Management of beche-‐de-‐mer fishery and other fisheries. Review beche-‐de-‐mer fishery management plan.
Fisheries Management Act of 1998. Section 7 specifies the role of the Board. Beche-‐de-‐mer Fishery Management Plan.
Department of Environment and Conservation
Management and Protection of CITES listed species
Public Service Act and various environment and conservation laws
Provincial Government
Development and management of fishing and fisheries. Conduct village courts.
Section 42 (l) Sec 33A. No. 3. Organic law on provincial governments and local-‐level governments, allows for the provincial government to make laws.
Local Level Government
Empowered to make laws on the local environment, protection of sacred sites, local tourist facilities, etc. Village courts hear and impose fines as necessary.
Organic law on provincial governments and local-‐level governments, Sec 44.
Ward Can make formal rules under the formal governance mechanism or under the informal governance mechanism.
Organic law on provincial governments and local-‐level governments, Sec 44. LLG Laws on environment and resource management
Coastal and Inland Fisheries Development Agency
To serve the needs of the Coastal and Island Communities that engage in fishing to improve: -‐ income levels -‐ quality of life -‐ food security -‐ promotion of commercial fishing -‐ management of sustainable livelihoods
National Executive Decision Number 151/2009
Activity 7a.2. Ask the class to list the types of governance and specify the difference between the types of governance.

Page 63 A project managed by The Nature Conservancy on behalf of AusAidand implemented by the Australian Tropical Marine Alliance
(James Cook University, University of Queensland, University of Western Australia, the Australian Institute of Marine Science, Charles Darwin University) and the Coral Triangle Center
Activity 7a.3: Ask the class to list the roles of the main government institutions in formal governance of coastal fisheries. National Fisheries Authority (NFA) The National Fisheries Authority is the principle government institution responsible for the management and development of the fisheries sector as provided for under the Fisheries Management Act, 1998. The Act also establishes the National Fisheries Authority with powers and functions specified under Section 6 of the Act. Some of the key functions are:
• Management of fisheries • Licensing • Development of fisheries • Research and monitoring of fisheries • Monitoring control and surveillance • Policy formulation
NFA has a board which is responsible for providing general control and guidance for NFA to exercise its functions. The main framework for fisheries management is the formulation of the fishery management plans which can set the limits and specify what is allowed and not allowed in the fishery.
Department of Environment and Conservation The Department of Environment and Conservation (DEC) is responsible for some specific areas in relation to coastal fisheries and the marine and coastal environment in general. The key areas under the jurisdiction and reponsibility of DEC relate to threatened species such as turtles and dugongs and species listed under CITES (Convention on International Trade on Endangered Species). For example Trade of corals and giant clams for the Aquarium Trade fall under the reponsibility of DEC. Trade in CITES listed species require the approval of DEC for the species to be exported. Establishement and mangement of Marine Protected Areas (MPA) and Wildlife Management Areas (WMA) fall under the responsibility of DEC. DEC gives the broad approval for the management of WMA’s but the day to day management is the responsibility of communities or clans who own the reef and sea area. Many communities in PNG have established WMA’s. Establishment and management of MPAs and WMAs requires close collaboration and co-‐ordination between DEC and NFA to ensure that each performs its mandated role effectively. MPAs and WMAs can benefit fisheries. Coastal and Inland Fisheries Development Agency The Coastal and Inland Fisheries Development Agency (CIFDA) was established in 2010 under an NEC Decision number 151/2009. The Agency aspires to achive its mission of ‘‘...... providing innovative products and services and empowering them to improve their income levels, quality of life, and food security, and in doing this, graduate from being subsistence fishers to commercial fishers, while preserving the marine ecosystems“. Its vision is to ‘‘Effectively manage the sustainable rural livelihood of our fishing communities through best practice community outreach methodolgy and business development‘‘. The coastal fisheries governance role of CIFDA is mainly focused on facilitating and co-‐ordinating between NFA and province. However CIFDA does not have the technical capacity to play this role at this stage. CIFDA needs to work closely with NFA and the provinces to be effective with its limited

capacity. Provincial Fisheries Divisions There are 14 coastal provinces and all have Fisheries Divisions tasked with the development and management of coastal fisheries. Provinces have responsibilities to develop and manage fisheries in the provinces under setion 42 of the organic law on provincial government and Local Level Government (LLG). Unfortunatly most of the provinces are mainly focused on the the development and less on management. This may change in the coming years as NFA is in the process of decentralising management of small scale commercial fisheries for export such as beche-‐de-‐mer. NFA normally manages fisheries it considers of national interest such as beche-‐de-‐mer. Typical structures in a province includes a Fisheries Advisor who is the head of the Fisheries Division, District Officers and LLG Fisheries Officers. Technical capacity in the provinces needs to be built up to support governance of fisheries in the provinces.
Activity 7a.4: Ask the class to give examples of informal governance from the area they come from. Informal Governance (Traditional Governance) Informal Governance is essentially Traditional Governance. The key difference between Informal Governance and Formal Governance is that the institutions of Informal Governance have jurisdiction at a smaller scale such as for a community, a clan or the family. In addition the mechanism and process for each of the informal governance may be different between communities. Traditional and cultural differences can be equated to langauge groups and since PNG has more than 800 langauges, it should be expected that there are differences in governance between the different langauge groups. The informal governance system is enshrined in the PNG constitution which recognises custom, tradition and culture mainly through Goal 5. ‘Papua New Guniea Ways‘ which states: ‘We declare our fifth goal to be to achieve development primarily through the use of Papua New Guinea forms of social, political and economic organisation’. Under goal five Section 5(3) states that: ‘recognition that culture, commercial and ethnic diversity of our people is a positive strength, and for the fostering of a respect for, and appreciation of, life and culture, including language, in all their richness and variety, as well as for a willingness to apply these ways dynamically and creatively for the tasks of development’. In addition to the constitution, the Fisheries Management Act recognises and respects the rights of the customary owners through Section 26. Fisheries Management Plans also accommodate customary management. For example Section 9 of the Beche-‐de-‐mer Fisheries Management Plan accommodates customary management measures. Traditional institutions and the role they play in governance have been developed over thousands of years since the existence of communities and the basic clan and family structures. It should therefore be expected that informal governance evolves over a number of generations. The key institutions in traditional or informal governance are outlined in Table 7.2. Section 26 of the Fisheries Management Act, 1998 allows for the customary owners of marine resources to be accommodated in all fisheries decisions. Ownership of marine resources is different for every place but is commonly vested with the village/community, the clan, sub-‐clan or the family. Management

Page 65 A project managed by The Nature Conservancy on behalf of AusAidand implemented by the Australian Tropical Marine Alliance
(James Cook University, University of Queensland, University of Western Australia, the Australian Institute of Marine Science, Charles Darwin University) and the Coral Triangle Center
and control of the marine resource is linked to the ownership of the reef or marine resources as dictated by custom and tradition. Table 7a.2. Description of the roles and legal basis for informal governance institutions.
INFORMAL GOVERNANCE INSTITUTION ROLE LEGAL BASIS
Village. A village or community is made of a number of clans. It is common that reef and sea areas are communally owned.
Customary and Traditional Governance including: -‐ Tambu Areas -‐ Sacred sites -‐ Traditional Management -‐ Enforcement of rules
Constitution and Section 26 of the Fisheries Management Act, 1998. Fisheries Management Plans e.g. Section 9 of the Beche-‐de-‐mer Fisheries Management Plan
Clan. Clan is the functional institution which normally have the user right or have ownership of a reef, sea or the marine resources.
Customary and Traditional Governance including: -‐ Tambu Areas -‐ Taboos -‐ Sacred sites -‐ Traditional Management -‐ enforcement of rules
Constitution and Section 26 of the Fisheries Management Act, 1998. Fisheries Management Plans e.g. Section 9 of the Beche-‐de-‐mer Fisheries Management Plan
Sub-‐clan. (in some areas large sub-‐clans can play the same role as normal clans)
Customary and Traditional Governance. Clan-‐based management plans
Constitution and Section 26 of the Fisheries Management Act, 1998. Fisheries Management Plans e.g. Section 9 of the Beche-‐de-‐mer Fisheries Management Plan
Family. In some places families are the functional unit and institution that has user right and ownership of a reef or resource and therefore has governance responsibility.
Compliance and enforcement with Customary and Traditional Governance for the family members. In some cases families have control over certain reef areas or a type of fishing gear
Constitution and Section 26 of the Fisheries Management Act, 1998. Fisheries Management Plans e.g. Section 9 of the Beche-‐de-‐mer Fisheries Management Plan
The key characteristics of informal/traditional governance are:
• Specifics on governance are not written. • Governance is based on custom passed through generations. • Governance is always evolving. • Management and rules are normally not written. • Decisions are often made by a single person such as the chief of a clan. • Enforcement of rules normally enforced by the clan or family rather than fisheries officers. • Penalties imposed for breach of rules is according to custom and often the burden of the
penalty is shared with the whole clan. E.g. Making a feast or cooking a pig.
Activity 7a.5: Describe the pros and cons of formal and informal governance systems in PNG.

Further reading
LMMA – working examples in PNG
The Locally-‐Managed Marine Area Network began in 2000 and is now operating throughout Asia and the Pacific to assist local communities to conserve their marine resources. The definition of an LMMA is: an area of nearshore waters and its associated coastal and marine resources that is largely or wholly managed at a local level by the coastal communities, land-‐owning groups, partner organizations, and/or collaborative government representatives who reside or are based in the immediate area.
Sourced from http://www.lmmanetwork.org:
“LMMA activities in Papua New Guinea are taking place primarily in Kimbe Bay and Madang Lagoon in the northern part of the country, and Manus, Kavieng, Milne Bay and Hiri-‐East in the south (see map below).”
Interest in the LMMA concept began in PNG in when project representatives from Kimbe and Madang attended a regional LMMA workshop in Fiji in 2000. Later that year, a second meeting was held in Bali. In 2002, the concept for the PNG LMMA Network was first introduced at the national PNG Marine Conservation Workshop, and the PNG country LMMA network was formed. Although the LMMA Network was introduced in PNG in 2002, there was a growing need to continue dialogue with interested projects in Madang Lagoon and Kimbe Bay and to increase overall awareness of LMMA work in PNG.
In May of 2003, the PNGLMMA was officially launched during a national level introductory and capacity building meeting. Project partners from Kimbe Bay (Mahonia na Dari and TNC) and Madang Lagoon (WWF and WIO), and representatives from Manus, Kavieng, Milne Bay and Hiri-‐East requested membership, and LMMA Network point people at these sites were identified. In the years that followed, several workshops were held throughout PNG to introduce the LMMA Network as well as the Community-‐Based Adaptive Management concept and the Network's Learning Framework. In 2004, several cross-‐site visits, trainings and workshops were held to assist Madang and Kimbe project teams carry out activities. In 2005, PNGLMMA Network's first Strategic Planning
Page 67 A project managed by The Nature Conservancy on behalf of AusAidand implemented by the Australian Tropical Marine Alliance
(James Cook University, University of Queensland, University of Western Australia, the Australian Institute of Marine Science, Charles Darwin University) and the Coral Triangle Center
Workshop was held in Kimbe. Over the next few years, the focus of LMMA work in PNG was on training in biological and socioeconomic monitoring, as well as data management and analysis of collected site data.
In February of 2008, a mini Strategic Planning Workshop was conducted, and the decision was made to incorporate an independent national not-‐for-‐profit organisation to coordinate and facilitate PNGLMMA activities. After years of being hosted by long-‐time partner The Nature Conservancy, PNGLMMA began working in 2008 to establish itself as its own legal entity to carry out its work. In January 2009, PNGLMMA officially became the PNG Centre for Locally Managed Areas Inc. (PNGCLMA), a legally registered not-‐for-‐profit organisation based in Port Moresby, to operate as an independent arm of the regional LMMA Network in Papua New Guinea.
The mission of PNGCLMA is to empower local communities to achieve their marine resource management goals by building their capacity in key LMMA management skills, providing a vehicle for sharing their stories and lessons, and supporting the establishment of key partnerships. Strategies include capacity building with community projects; partnership building; awareness, outreach, marketing, and communications; fundraising and sustainability; networking and learning; and governance, management, and administration.”
Also see Talasea Rural Local-‐Level Government Marine Environment Management Law 2004. Taken from National Coral Triangle Initiative Coordinating Committee of Papua New Guinea (2012), unless otherwise stated: Customary Land Tenure “The land tenure and land utilisation system in Papua New Guinea (PNG) is based on customary land ownership. Ninety-‐seven percent of the land is owned by traditional landowners who have the right to decide what does and does not happen on their land. Only 3%, known as alienated land, is controlled by the State. This system supports the largely subsistence non-‐cash economy that supports 85% of Papua New Guineans.” Traditional Knowledge Management “Many coastal communities in PNG have traditional knowledge that dictates/guides: 1. Ownership of certain sections/zones of the sea, 2. Authority that permits or forbids harvesting, 3. Timeframe/duration of closure and open seasons, 4. Methods of harvesting different marine animals (fishing gear use), and 5. Individuals that harvest (certain clan members, females, newly initiated men etc.) However, some of the above are eroding at different rates in coastal communities around PNG. This loss of traditional knowledge is caused by; loss of traditional authority, loss of traditional values, population increase and the introduction of a cash economy.” “Traditional knowledge can also be known as local ecological knowledge. It has been used to facilitate scientific research and protection of marine areas by communities.” Traditional knowledge provides: historical and baseline information, biological and ecological information, marine resource management tools and governance structures, complements other resource management efforts (e.g. the PNG Community Locally Managed Areas), support culturally appropriate management (National Coral Triangle Initiative Coordinating Committee of Papua New Guinea, 2012).

“In PNG, customary rights to locally manage areas are vested in communal clan or families. Therefore any relevant governance structure must reflect this. .... The government has to integrate needs such as promoting conservation practices, using traditional knowledge of coastal communities into overall government planning. We further note that both legal and policy gaps do exist in government policies and legislations for coastal community issues. Therefore the promotion of traditional knowledge could be developed further within existing precedents such as the Bialla Local Level Government (LLG) law on conservation of marine environments.” “In the overall planning, many coastal areas are of critical significance such as spawning habitats that must be protected. Therefore, the government needs to take that into account when planning for conservation areas based on traditional knowledge that is balanced with formal government control.” Legislation Environmental sustainability is enshrined within the constitution of PNG which states in the Preamble to the Constitution: “we declare …PNG’s natural resources and environment to be conserved and used for the collective benefit of …all,and to be replenished for the benefit of future generations. (Goal Four) As such there is a constitutional basis for the legislative framework that has developed in PNG to manage the nation’s natural resources. The primary piece of legislation pertaining to the management of natural resources is the Environment Act 2000 (as amended 2002) which became fully operative in 2004. This legislation was developed using Australian legislation as a starting point and replaced three pieces of earlier legislation, namely:
• Environment Planning Act; • Environmental Contaminant Act; and • Water Resource Management Act.
“The new legislation aims to streamline the process of environmental management and improves the process of obtaining and monitoring permits for development activities. Key to the Environment Act is the establishment of three levels of development activity (Section 42). The Act and the Environment (Prescribed Activities) Regulation 2002 defines the specific requirements for environmental impact assessment that need to be complied with, in order for permits and licenses to be issued for activities of each level. EIAs are required for level 3 developments and may, in specific cases, also be required for level 2 developments.” “There is no requirement in the Act for Strategic Environmental Impact Assessments (SEA), nor does it appear that such assessments have been ever been undertaken, though such an approach has many benefits for managing environmental impacts.” “In addition the requirements and penalties for exceeding the conditions attached to permits are detailed within the Act. Stakeholders within the mining, forestry and agriculture sectors indicated that the Environment Act was considerably more stringent than the previous legislation and the penalties for transgressions were more severe. The Act is comprehensive but during the course of this mission a number of stakeholders including the DEC, commented that the focus was on large scale projects and no provision was made for managing the effects of the large numbers of small scale activities that occur in PNG.” “Under the Organic Law, Provincial and Local Governments may, within limits, make Local Environment Policy.”

Page 69 A project managed by The Nature Conservancy on behalf of AusAidand implemented by the Australian Tropical Marine Alliance
(James Cook University, University of Queensland, University of Western Australia, the Australian Institute of Marine Science, Charles Darwin University) and the Coral Triangle Center
Conservation “Conservation is not included in the remit of the Environment Act and as such is managed under five existing pieces of legislation:
• Fauna Protection and Control Act (1974, 1982); • The Conservation Areas Act (1980, 1992); • The National Parks Act (1982); • International Trade (Fauna and Flora) Act (1993); and • Crocodile Trade (Protection) Act (1982)”.
Other Legislation “The Fisheries Act gives broad powers to the Minister of Fisheries and Marine Resources to regulate fishing activity, mainly through prohibition (ban on using explosives) and licensing restrictions. Other pieces of legislation pertaining to fisheries include the Continental Shelf (Living Resources) Act, 1978, the Fisheries (Torres Strait Protected Zone) Act, 1978; the Export (Fish) Regulation Act.” Other legislation that can be relevant to management of fisheries resources in PNG includes: The Forestry Act (1991) which covers the management and conservation of forest resources.
• Environmental safeguards, especially pertaining to logging on steep slopes or in proximity to rivers, are provided for by agreements between government and the permit holder. Landowners who cut less than 500 cubic meters per year do not have to obtain a permit;
The Mining Act (which has been under review since 2006); National Agriculture and Quarantine Inspection Authority (NAQIA) which is responsible for the safe
disposal of agricultural chemicals; National Seas Act; The Prevention of Pollution of the Sea Act, 1981; The Dumping of Wastes at Sea Act, 1981; and The Lands Act. International treaties, conventions and agreements “PNG is a signatory to a number of international and regional environmental conventions. While the treaties and conventions may be officially ratified, there is a delay in the associated, national legislation and a clear lack of knowledge of how to implement the status or the contents of the conventions locally.” (See Appendix 3 in National Coral Triangle Initiative Coordinating Committee of Papua New Guinea, 2012) Legislative institutions “To date the National Government agencies have had the main responsibility for implementing, monitoring and enforcing the country’s legislation. With the passing of the Organic Law on Provincial Governments and Local-‐level Governments (1995), most of the operational functions could be devolved to the Provincial and/or local governments. However, devolution has been slow to be implemented. Limitations in capacity and budget are greater constraints at local than at national level and as a result provincial governments and local level government require assistance if they are to take on their legally mandated powers to undertake monitoring and management functions and pass appropriate by-‐laws. While awareness of the importance of the environment is growing at National Level, this is not as advanced at provincial, community level.”

Department of Environment and Conservation “The Department of Environment and Conservation (DEC) is the principal national government agency responsible for management of the country’s environment and environmental legislation. DEC coordinates with other national level departments and authorities (i.e. National Planning and Rural Development, Land and Physical Planning, Agriculture and Livestock, Works, Mining, Petroleum and Energy, Health, Forest Authority, National Fisheries Authority, etc.). DEC also relies on these bodies to undertake some of its duties in addition to their own specific environmental management responsibilities, and to provide logistic support for monitoring visits. The DEC is severely constrained in its operations by extremely limited funding and, in some areas, capable staff.“ National Fisheries Authority (NFA) (source: http://www.fisheries.gov.pg/) The NFA’s Vision is to “effectively manage our fisheries and marine resources for sustainable and equitable benefits”. “The NFA is a non-‐commercial statutory authority established and operating under the Fisheries Management Act 1998 and related regulations. Under the Fisheries Management Act 1998, the NFA is responsible for the management and development of the fisheries sector in accordance with the provisions of this Act under the overall policy direction of the Minister and shall perform and exercise its functions and powers on behalf of Papua New Guinea. The functions of the NFA are defined in the Act.” Refer students to fisheries management information provided by NFA on the EAFM CD under References, then Further Reading and PNG Fisheries Information. Note that only the Reefline Fishery Management Plan has been revised to provide an ecosystem-‐based management approach.
Further reading: Anon. (2010) National Fishery Sector Overview of Papua New Guinea. FAO, Rome3. Constitution of the Independent State of Papua New Guinea. Chapter 1. 3 Fisheries Management Act, (1998)1. Kuemlanga, B. (2004) Creating Legal Space for community-‐based fisheries and customary marine
tenure in the Pacific: Issues and Opportunities. FAO/FishCode Review No. 7. 3 National Coral Triangle Initiative Coordinating Committee of Papua New Guinea. (2012) State of the
Coral Reefs of Papua New Guinea. Government of Papua New Guinea, Port Moresby1. PNG Fisheries Management information downloaded from EAFM CD (provided by teacher) in which fisheries legislation, policy and management plans provide information on the in-‐country fisheries. See under References, then Further Reading.

Page 71 A project managed by The Nature Conservancy on behalf of AusAidand implemented by the Australian Tropical Marine Alliance
(James Cook University, University of Queensland, University of Western Australia, the Australian Institute of Marine Science, Charles Darwin University) and the Coral Triangle Center
Unit 7b. Solomon Island coastal fisheries governance
Activity 7b.1. Ask the class to write down what governance is and give examples of what they think is good governance. There are two main types of governance of fisheries in the Solomon Islands. Like in PNG these can be grouped as formal governance (policy and legislation) or informal governance (traditional management systems). Below are extracts from Sulu et al (2012) on these different governance approaches. Traditional Management Systems The main mechanisms of traditional marine resource management are: access control through customary marine tenure (CMT), the articulation of traditional ecological knowledge (TEK) (also referred to as indigenous ecological knowledge (IEK)) for resource management, prohibitions of access (and exploitation of resources) within culturally significant geographical space, and the prohibition of the consumption of certain species. CMT regimes are inextricably linked with the wider social and cultural contexts from which they emerge. Hence, they are tightly embedded with the society’s traditional ecological knowledge (TEK), traditional beliefs, access control and prohibitions, social/ governance structure and other customary practices. Customary marine tenure (CMT) system is the main form of traditional property ownership and control and this is recognised by the Solomon Islands National Constitution 1978; more than 90% of inshore coastal areas, islands and islets are owned under the CMT system. Under the CMT system, particular groups of people (e.g. family units, clans or tribes) have informal or formal rights to coastal areas and their historical rights to access and use marine resources are, in principle, exclusionary, transferable, and enforceable either on a conditional or permanent basis. Although CMT is the main form of marine property ownership system in the Solomon Islands, studies have been conducted in only a few locations: Lau lagoon, Malaita, Marovo Lagoon, New Georgia, Roviana and Vonavona Lagoon, New Georgia and Nggela. (More details on CMT in these places is provided in Sulu et al 2012 pp 15-‐18). The role of TEK in marine resource management is a bone of contention. (Some) argued that it is usually aimed at maximising fisheries production and could potentially contribute to resource depletion. For example, indigenous knowledge contributed to the depletion of the bumphead parrotfish Bolbometopon muricatum by Roviana fishers. In another example, Nggela fishers associated the subtle increases in trochus (catch) at times when the trochus spawn as good times for harvesting. However, TEK has a role to play when appropriately used in conjunction with conventional scientific data. Traditional knowledge in resource management is especially important in circumstances where fisheries departments are ill equipped by governments to carry out fisheries research or generate knowledge needed for management purposes. Examples of cases where such knowledge was useful for fisheries management are summarised in Sulu et al (2012) (see p. 17). Although traditional management systems offer advantages for inshore fisheries management in Solomon Islands, modernisation and socioeconomic changes have contributed to its ineffectiveness in some instances in the last 30 years. Some of the significant colluding factors include:

• declining respect for traditional leadership and authority, • the influence of markets and the commoditisation of resources, • changing consumption, • demographic patterns, • adoption of new religion, • the demise of traditional belief systems, and • the uptake of modern gears which are more efficient.
In some instances the effects of such factors have been so pervasive and overwhelming that CMT has not been able to control the decline of some species in sites close to urban areas, e.g. some finfish species, trochus and the green snail (Turbo mamoratus) exported for use in the manufacturing of buttons and jewellery, Holothuria species targeted for the beche-‐de-‐mer trade and Tridacna species which are targeted for their adductor muscles (a delicacy in Asia) and their shells for the curio trade. Despite several inadequacies which beset the effectiveness of CMT for inshore fisheries management, modern day pressures have not generally overthrown these forms of resource management. CMT systems continue to thrive as dynamic socio-‐political links between local human populations and marine environments and they remain a key dimension in any initiative in coastal resource development in Solomon Islands; in some cases their dynamic and flexible nature meant that under modern day pressures they have undergone organisational innovation and reinforcement. Therefore, although not a panacea in itself, CMT systems still remain an important prerequisite for effective management of marine resources in Solomon Islands. What is required is a better understanding of how external factors (markets, new laws and legal systems, new forms of religion, new governance systems) impact CMT and, secondly, how the differences and congruencies between CMT and modern methods of fisheries management can facilitate adaptive management systems and at the same time meet community goals and needs. Integration of the CMT system with the modern legal systems for effective fisheries management (or natural resource management in general) is possible and has been done as there are relevant legal provisions in the national legislation which allows for this. For example, the Western Province Natural Resource Management Ordinance and the legal instruments associated with the establishment of the Arnavon Community Marine Conservation Area (ACMCA) allows the establishment of community by-‐laws for the purpose of resource management, and such by-‐laws are enforceable by the magistrates court. The fisheries ordinance of the Central Islands Province which is currently (as at February 2012) drafted provides formal powers for the enforcement of customary management systems. While legal provisions allow such integration, the biggest challenge, however, is in mitigating the pressures of the cash economy in order to achieve compliance. According to John Pita (pers.comm) a conservation officer at AMCA, a major impetus for compliance in AMCA was the provision of alternative means of income generation through the establishment of seaweed farming to the Wagina community who rely solely on marine resources for their livelihood and income generation. Formal governance Policy Policies relevant to the protection and conservation of inshore marine habitats and resources (e.g. coral reefs, seagrass beds and mangroves), are embodied in the general government policies on fisheries and marine resources of successive governments (Anon, Office of the Prime Minister 2008; Anon. Office of the Prime Minister 2010a -‐ both in Sulu et al 2012). Other government documents provide strategies for the protection of coral reefs and marine resources, such as the National

Page 73 A project managed by The Nature Conservancy on behalf of AusAidand implemented by the Australian Tropical Marine Alliance
(James Cook University, University of Queensland, University of Western Australia, the Australian Institute of Marine Science, Charles Darwin University) and the Coral Triangle Center
Biodiversity and Strategic Action Plan. Substantive policy documents which provide over-‐arching national strategies to support inshore fisheries management, conservation, climate change adaptation and ecosystem approaches to resource management are:
• the National Strategy for the Management of Inshore Fisheries and Marine Resources (Ministry of Fisheries and Marine Resources 2010),
• the Solomon Islands Coral Triangle National Plan of Action (Ministry of Environment Conservation and Meteorology & Ministry of Fisheries and Marine Resources 2010) and
• the National Adaptation Programmes of Action (Ministry of Environment Conservation and Meteorology 2008).
The Solomon Islands government is also a party to several regional and international environmental agreements which obliges it to protect, sustainably utilise and manage coral reefs and marine resources.” Refer to Table 1 in Sulu et al (p10) for list of these obligations. Legislation Acts of the National Parliament which directly provide for marine environmental protection, sustainable utilisation and management of marine natural resources are: The Fisheries Act 1998, The Wildlife Protection and Management Act (1998), The Shipping Act 1998, The Environment Act 1998 and The Protected Areas Act 2010. The Fisheries Act 1998 stipulates protection, sustainable utilisation, conservation and management of fisheries resources in general. The Wildlife Protection and Management Act 1998 was enacted with the main objective of complying with obligations under the UNCBD, particularly the trade (both export and import) in wildlife fauna and flora. The Shipping Act 1998 regulates matters pertaining to the protection of marine environment and prevention of pollution from marine vessels; the Act implements various IMO conventions, e.g., the Marine Pollution Convention. The Environment Act 1999 provides for establishing integrated systems of development control, environmental impact assessment and pollution control. The Protected Areas Act 2010 provides for the declaration and management of protected areas where special measures need to be taken to conserve biological diversity and regulates biological diversity and bio-‐prospecting research.
Activity 7b.2. Ask the class to list the types of governance and specify the difference between the types of governance.
Activity 7b.3: Ask the class to list the roles of the main government institutions in formal governance of coastal fisheries.
Activity 7b.4: Ask the class to give examples of informal governance from the area they come from. Local scale compliance on conservation/resource management efforts Despite the existence of laws and regulations and the many conservation initiatives by government, nongovernment organisations and community-‐based organisations, local compliance remains a challenge. For example, it is common knowledge that dynamite fishing is prohibited by national laws, yet it remains a commonly practiced fishing method in Nggela, Malaita and Guadalcanal. Hunting and consumption of turtle is still common in many parts of the country although people are generally aware that it is prohibited under the fisheries regulations. Sea cucumber harvest closure which is currently in effect is still flouted as resident foreign nationals running businesses in the country continue to purchase illegally harvested beche-‐de-‐mer and find an opportunity to illegally
export them out of the country (e.g. Inifiri and Marau 2012; Osifelo 2012 in Sulu et al 2012). Compliance in community based MPAs remain a challenge (RJS, Pers.obs in Nggela). Even the Arnavon Marine Conservation Area which has fulltime rangers and is the best managed conservation area in the Solomon Islands still has compliance issues (J.Pita pers.comm). On the ground compliance to conservation or resource protection and management laws, regulations and initiatives will remain a challenge for some time into the future. Several reasons for this are: lack of enforcement; the need to meet daily subsistence requirements, to generate income to meet personal needs, and social obligations. Ignorance on the biological aspects of species and the rationale for the environmental legislations and regulations may also be a contributing factor. Increased awareness may probably lead to informed compliance among resource users due to better understanding of the rationale for the fisheries regulations or of the biology and ecology of exploited species and the role of humans in conserving them or exacerbating their demise (Foale, 2006 in Sulu et al 2012). Compliance to obligations under international treaties and conventions acceded/ratified Solomon Islands have undertaken steps to comply with its obligations under the environmental conventions it has ratified through the enactment of necessary legislations. Regardless of these efforts, a series of national capacity self assessment studies (McDonald and Lam 2006; McIntyre 2006; Siho 2006; Thomas 2006; Thomas et al. 2006 in Sulu et al 2012) funded by the GEF have identified that significant gaps still exist, which include: (i) the lack of capacity (both financial and human resources) at the government level to address environmental issues, enforce the legislations or implement necessary local level actions and initiatives, (ii) the general absence of `government’ at the community level where most environmental issues and actions occur; most local level community resource management and conservation initiatives were driven primarily by non government initiatives and the churches, and (iii) lack of relevant legislations or where present inherent inadequacies of the environmental legislations occur. In recent years steps have been taken to address these shortcomings. The enactment of The Protected areas Act 2010 was in response to concerns about the absence of national legislation to establish protected areas for biodiversity conservation, and the lack of provisions within The Wildlife Management and Protection Act 1998 for the in situ protection of endangered species. The Fisheries Act 1998 is currently being reviewed (The Fisheries Bill 2010) to cater for emerging fisheries related issues; one of the envisaged changes in The Fisheries Bill 2010 will be the provision of a legal basis for the empowerment of local communities to manage their marine resources (Ministry of Fisheries and Marine Resources 2010) and the integration of principles of ecosystem approach to fisheries management (MFMR, Pers. comm).
Activity 7b.5: Describe the pros and cons of formal and informal governance systems in SI. Further reading: Sulu, R. J., D. N. Boso, A. Vave-‐Karamui, S. Mauli, and L. Wini-‐Simeon. (2012) State of the Coral Reefs
of Solomon Islands. Coral Triangle Marine Resources: their status, economies and management. Solomon Islands National Coral Triangle Initiative Coordinating Committee, Honiara1.
Solomon Island Fisheries Management information downloaded from EAFM CD (provided by teacher) in which fisheries legislation, policy and management plans provide information on the in-‐country fisheries. Under References, then Further Reading and then Solomons Fisheries Information.

Page 75 A project managed by The Nature Conservancy on behalf of AusAidand implemented by the Australian Tropical Marine Alliance
(James Cook University, University of Queensland, University of Western Australia, the Australian Institute of Marine Science, Charles Darwin University) and the Coral Triangle Center
Unit 8: Fisheries assessments
Student outcomes: Understanding of how to collect and analyse appropriate fisheries and ecosystem information
Information needs for EAFM – why do you need fisheries data? Information is necessary as a basis for management decisions. As we have seen through the ‘Fish and People’ DVD series1, information about fisheries serves to tell us about the current status of the fishery, but also can be used through time to tell us about trends in our fishery. For example, are target species catches increasing, decreasing or staying the same? In guidelines for implementing EAFM produced by the FAO (2005)1, it is stated that “Information is critical to EAF. It underpins the formulation of national policies, the development of management plans and the evaluation of management progress.” It goes on to state also that EAFM will inevitably need to be based on incomplete information and that the best available information should be used. This information can be from very different sources including quantitative scientific data collected from fisheries or can be traditional knowledge derived from community interactions with the marine environment over many generations. It is also not only biological and ecological data that is important; we also need to use and collect information that is relevant to the social, economic and cultural aspects of the fishery. Drawing on all sources of information in the EAFM planning stage is critical in identifying key issues that require management intervention. Fisheries data may or may not be used during the initial planning stage depending on data availability; however, fisheries data collection once EAFM is implemented is an important part of assessing the effectiveness of the plan. Fisheries data will enable resource changes to be assessed and will guide modifications to management if necessary (adaptive management). The collection of fisheries data is therefore a critical component of EAFM monitoring.
Types of fisheries data & how to collect them (monitoring) With respect to the Pacific region, Govan (2011)1 states “To date the financial costs of scientific research and monitoring appear to have far exceeded investments in actual management of coastal areas. Using locally available information with simple approaches to community monitoring is a cost effective solution, and collaboration with government or regional technical agencies for generating highly technical and specific information such as stock assessment, is another.” There are many different types of fisheries data that can be collected and analysed, depending on the approach to be taken. However, unless agency assistance is available generally a simple ‘data-‐limited’ approach is warranted. Traditional knowledge/anecdotes This the simplest form of data that can be collected and used in assessing and managing fisheries. It is the information individuals gain through their past experiences and can be information about which species were caught in the past, their size, where they were caught, locations of spawning aggregations, etc. The collection of this type of information can by interviewing individuals, especially community elders, or through community meetings. Collecting information requires community co-‐operation and participation. Also, caution must be exercised in how much that can be concluded from this type of knowledge simply because accurately remembering past catches can be difficult.

Page 77 A project managed by The Nature Conservancy on behalf of AusAidand implemented by the Australian Tropical Marine Alliance
(James Cook University, University of Queensland, University of Western Australia, the Australian Institute of Marine Science, Charles Darwin University) and the Coral Triangle Center
Catch and effort data One of the simplest and easiest forms of fisheries data to collect is information on the catch taken and the effort to take the catch. Catch can be in numbers or weight of the target species, or both, while effort is recorded as the duration of the fishing trip with the number of people fishing also recorded. The best approach is to identify the key fish and invertebrate species (indicator species) and to focus monitoring on these. Identifying these indicator species should be by a process that involves all community stakeholders. These species may be the fishery target species or species that the community has concerns about. The data can be very easy for community members to collect once shown how. This data can then be used to calculate the catch per unit effort (CPUE), which is a measure of the relative abundance of the species. Examples of CPUE include: number of sea cucmbers collected for every hour spent collecting them for each collector; weight of a target species caught per hour of line fishing for each collector and each fishing line used. Species size data Another simple form of fishery data is information on the size of the individuals caught, either using length or weight measurements. This can simply be done by either individuals measuring and recording their catch and passing the information on to others who maintain this data from all fishers in the management area. Alternatively, key personnel can be responsible for visiting fishers on shore or at markets and measuring the catch as a sub-‐sample of the total catch. Measuring and recording the size of all animals caught is one of the simplest ways of detecting if there are impacts of fishing on the resource. Underwater Visual Survey (UVS) data Underwater Visual Surveys (UVS) are usually best done diving on SCUBA so can be a less achievable approach for monitoring fisheries, however in shallow habitats and for some invertebrate species may be done simply on snorkel (e.g. Swimming or manta tows). This approach collects data on the numbers of species of interest and can be used to monitor fish and invertebrate relative abundance (by counting them), size and diversity, or for habitat types and characteristics (eg. % coral cover). Identifying the species and indicators of interest should be by a process that involves all community stakeholders. These species may be the fishery target species or species that the community has concerns about, or habitats that support these species. This approach requires a minimum level of some training to be carried out reliably, so is more resource intensive than collecting size and catch data.
Figure 8.1. Diver conducting an underwater visual survey using snorkel. Source: Albert et al, 20101.

Figure 8.2. Sample UVC data sheet (waterproof paper) carried by divers to record data while swimming each transect. Source: Albert et al, 20101. Biological samples Other types of data that can be collected and analysed during monitoring to assist in refining management plans are the age or the reproductive status of the animals caught, which generally requires dissecting parts of the animal. For reproductive data the gonads need to be identified in the body cavity and a determination made on whether they are mature or not, and whether they are male (testes) or female (ovaries). These data are very useful as they can tell us about sex ratios and whether there are enough of each sex for successful spawning or what size (or age) the animal becomes mature. Estimating the age in fish requires dissecting out the otoliths from the brain cavity, storing them and later ‘reading’ them to get an age estimate. The age can be very revealing about an animal as it can tell us how long they live, their growth rates (when coupled with size data), what age they become mature, and the age structure in the population. Tissue samples, often taken as small sections of fins (fin clips), are also simple to collect and can be used to do genetic analyses to determine the stock structure and movement patterns of species. Appropriate storage of these types of samples is required by storing in ethanol solution or freezing.

Page 79 A project managed by The Nature Conservancy on behalf of AusAidand implemented by the Australian Tropical Marine Alliance
(James Cook University, University of Queensland, University of Western Australia, the Australian Institute of Marine Science, Charles Darwin University) and the Coral Triangle Center
However, collection and analysis of these types of data requires a far greater level of resources and training. Although these types of data are valuable and informative, in resource limited situations they are not recommended as there are other simpler more cost-‐effective data types that can be collected and used. Furthermore, species information on age, longevity, and maturity can often be sourced from previous studies conducted elsewhere.
Figure 8.3. Researchers collecting biological samples (otoliths, gonads, fin clips) from coral trout on the Great Barrier Reef, Australia. Photo: Dave Welch. Social/economic data Having data about why and how fisheries are important to local communities (and how this changes over time) can also assist in management planning to ensure the continued benefits of fishing. These types of data can be easy to collect by conducting interviews with fishers and the community. The types of data that are likely to be of most use are those that identify what the social and economic benefits of fisheries are to communities, the distribution of those benefits within/among communities, and the information needed to ensure those benefits are maintained (or enhanced should the situation dictate). The types of information this would include are: the number of fishers, their dependence on fisheries (or certain species/gears), how much income derived from fishing, the % of their total income that is derived from fishing, profitability of fishing operations, use of harvested fish (e.g., sold vs. subsistence and if subsistence, who else uses those fish), fishers’ level of involvement in decision-‐making, etc. Technical advice should be sought to assist in the types of data that may be important and ways to frame interview questions to ensure the right data is collected. (see Pomeroy et al 2004) 1. Table 8.1. Summary of some simple fisheries data types, how they are collected and how they can be

used to assist in fisheries assessment.
Data type How collected What used for Cost effectiveness
Traditional knowledge/anecdotes
Community meetings; individual surveys with elders
Important fishery sites; indication of historical fishery health (species, sizes, locations); species
life history
High
Catch and effort
Record fisher catch (numbers per species) and how long fished, either by surveys or logbooks; regular fishing
‘surveys’ by fisheries officers
Catch-‐per-‐unit effort (CPUE) used as an indicator of relative abundance; used to determine population
trends
Medium
Size
Fishers or fisheries officers record length and/or weight of fish caught; fish measured
in the marketplace
Average size (length or weight) can be calculated and monitored across: species, years, areas, etc
Medium
Underwater Visual Surveys
SCUBA or snorkel transects to record species number, size,
habitat type, etc
Numbers/transect give an estimate of relative abundance; species diversity; habitat
changes. These can be monitored through time to determine population
trends
Low
Biological
Samples can be collected directly independently of fishers; samples can be
collected from fisher catches and/or marketplaces. Samples include gonads and otoliths
Used to determine sex and age to derive: growth
rates, age/size at maturity, sex ratios, sex
change, fecundity
Low
Social/Economic Survey interviews with community individuals
Determine how fisheries benefit communities; derive strategies to
ensure benefits continue
High
Activity 8.1: Ask the class for examples of what fisheries data one may collect, how would they collect it, and how would they use that data. Get them to write these in their notebooks. (10 mins)
DVD: Second half of Module 1: Plenty more fish in the sea? (~ 5 mins) 1
Using data to assess fisheries Catch per unit effort (CPUE) Since CPUE data is a measure of the relative abundance of the resource being monitored, by collecting this data over time we can identify the fluctuations in the species abundance and if there are any trends; whether they are increasing or decreasing (Figure 8.4). A negative or downward trend in CPUE will indicate that the population may be decreasing and therefore is likely to require

Page 81 A project managed by The Nature Conservancy on behalf of AusAidand implemented by the Australian Tropical Marine Alliance
(James Cook University, University of Queensland, University of Western Australia, the Australian Institute of Marine Science, Charles Darwin University) and the Coral Triangle Center
the amendment of current management or the introduction of new management action that aims to halt and reverse this declining trend. A positive or upward trend in CPUE will indicate that the population may be increasing and may be a sign that current management actions are working. Be careful to also consider other factors that could cause the trend you observe. For example, with greater use of depth sounders and GPS fishermen can find fish more easily thereby increasing their catch rates, even though fish numbers may not be increasing. Alternatively, we can use these data to assess the current status of fish stocks, or the effectiveness of management by sampling in a managed area and a similar non-‐managed area. For example, by sampling inside a no-‐take area (tambu) and concurrently sampling in a fished area, we can compare catch rates to see if fishing is better in one of the areas, and in doing so determine whether the no-‐take area is having the desired effect of increasing fish stocks.
Figure 8.4. Examples of potential changes in catch per unit effort (CPUE) as an indicator of relative population abundance when monitored through time. Changes in size Like CPUE data, by monitoring the size of animals in the catch through time we can detect if there are trends that may be positive or negative signs for the population. Size data can be grouped to provide an estimate of the average size of animals in the catch, or as size structures of the catch (or both). Through time we can assess whether the average size is increasing or decreasing with the latter being a sign that overfishing may be occurring since fishing generally targets larger individuals. Figure 8.6 shows an applied management example of the use of average fish size monitored through time. Either monitored through time or sampled on a single occasion as a ‘snapshot’ of the current status of fish stocks or management effectiveness, size structures can also be very informative as we can see changes in different size classes of animals. An example of this is given below in Figure 8.5 where the top graph shows a healthy population with animals in all size classes present in the population with good relative numbers of large fish. The bottom graph however shows evidence of a population impacted by fishing with very few large individuals present and the most common size class (mode) is shifted to the left of the graph.
0
0.2
0.4
0.6
0.8
1
1.2
1.4
1.6
1.8
time1 time2 time3 time4 time5 time6
CPUE (# fish pe
r fish
er hou
r)
A -‐ stable population
B -‐ increasing population
C -‐ decreasing population

Figure 8.5. Evidence of effects of fishing on coral trout (Plectropomus leopardus) populations using size structures: The top graph shows the size structure of a population on a reef protected from fishing; the bottom graph shows the populations size structure on a reef open to fishing showing that larger fish have been mostly removed from the population. Source: Dave Welch.
0
20
40
60
80
100
120
140
<310 325 355 385 415 445 475 505 >520
Number
Size class (cm)
0
20
40
60
80
100
120
140
<310 325 355 385 415 445 475 505 >520
Number
Size class (cm)

Page 83 A project managed by The Nature Conservancy on behalf of AusAidand implemented by the Australian Tropical Marine Alliance
(James Cook University, University of Queensland, University of Western Australia, the Australian Institute of Marine Science, Charles Darwin University) and the Coral Triangle Center
Figure 8.6. Evidence of the effects of fishing on a key target species and the effects that introducing management has had based on simply monitoring the size of animals caught through time. The average size decreased over the time period until 2005 when a minimum size limit of 35 cm was introduced. The increase in average size since the size limit was introduced suggests that the management is working. UVS data Like with the use of CPUE data above, UVS data can be as a proxy for the abundance of key species to assess for trends in the fishery populations. It can also be used to assess changes in habitats that are important for fishery species and for overall ecosystem health. UVS involves conducting swims (transects) of a specified distance (eg. 100 m) or time (eg. 5 mins). For fish and invertebrate species the transect will have a specified width usually 3-‐5 m either side of the transect (Figures 8.7 and 8.8). The diver will swim with a data sheet and board and record their data for key species or species groups within each transect. For habitat it is often carried out by laying a tape along the transect and habitat measurements taken for areas that fall under the tape. By conducting several transects (replicates) for each management area, measurements of relative abundance can be obtained, such as # fish/100 m2 or # fish/min, that are assumed to be representative of the populations. These can be compared among different areas, or by repeating transects each year, so that management effectiveness can be assessed in space and time.
0
5
10
15
20
25
30
35
40
45
50
2000 2002 2004 2006 2008 2010 2012
Average size (cm)
Year

Figure 8.7. Conducting an underwater visual survey requires the diver (or swimmer) to swim the line of the transect tape counting target organisms within the area specified either side of the tape. Source: English et al, 19973.
Figure 8.8. Manta tow surveys can be conducted by towing a diver on the surface behind a boat who counts what he observes. Such surveys could be done on snorkel however using the manta tow technique allows far greater area to be sampled. Source: English et al, 19973. More complex analysis approaches There are many more complex analyses that can be conducted each with their own data requirements. The more data required then the more resource intensive the monitoring will be so care is needed to choose data and analyses that are appropriate for any given situation. With adequate data available some of the more complex analyses can be tackled. We will not cover other analyses types here since the capacity to collect the relevant data and conduct relevant analyses are likely to be limited in the Pacific region. Indicators and reference points Whichever data is available and collected from the fishery, can then be used to calculate measurements that inform us about i) the current status of the fishery, and ii) changes through time in the resource we are managing. Further, these measurements can be used to assess the performance of the management plan and whether it is meeting certain objectives.

Page 85 A project managed by The Nature Conservancy on behalf of AusAidand implemented by the Australian Tropical Marine Alliance
(James Cook University, University of Queensland, University of Western Australia, the Australian Institute of Marine Science, Charles Darwin University) and the Coral Triangle Center
The data measures that we decide to use are what we call indicators. By measuring the value of these indicators we can use them to assess whether or not they are at a desirable level that gives us confidence that populations are healthy. These levels are what we call reference points. The target reference point is the desirable value we would like for our indicator, while the limit reference point is the lower limit below which is undesirable. The indicator is judged against these reference points to assess how well are management is performing (performance measure). When the indicator goes below the limit reference point it signals that management is not working and affirmative action is required that is aimed at allowing the measure to go back above the limit reference point. A generalised representation of how indicators are used is provided below in Figure 8.9.
Figure 8.9. A generalised representation of the use of objectives, indicators and performance measures. Source: Staples and Funge-‐Smith, 20091. For a non-‐fisheries example of the use of a performance measure against reference points, see Box 15, Ref#EAFM11. Monitoring is the act of collecting the necessary data to measure our chosen indicator/s. Monitoring can occur at different locations within a management area and the performance measure can be compared among these locations to assess for variation within the management area, while repeating monitoring at these locations through time (eg. annually) will assess how things change temporally. The performance measure can also be compared among locations within the management area and locations outside the management area. All of these are legitimate ways of

assessing the effectiveness of management. Later in Unit 10 we will talk in more detail about the how to design a robust monitoring program and how to choose indicators and reference point levels.
Activity 8.2: In teams of 4-‐6 ask the class to calculate basic fisheries statistics using simulated data and identify reference points. Get them to plot some of their data and present this to the class. Each group will need a laptop with the data spreadsheet provided. This activity may require a short tutorial on the use of Excel, eg. using equation editor, using pivot tables, plotting data in graphs, etc. (45-‐60 mins)
(An alternative approach to this activity would be for the class to visit a site (eg. local MPA) and collect their own data, eg. snorkel transect data on fish/invertebrate numbers, interview local community on effectiveness of the MPA – social, economic, ecological, cultural.)
DVD: Fish and People Module 5: Fish and people: today and tomorrow (12 mins)1. Further reading: Albert, S., I. Tibbetts, and J. Udy. (2010) Solomon Islands marine lIfe: information on biology and
management of marine resources. University of Queensland, Brisbane. (see p62-‐96) 1. English, S., Wilkinson, C. and Baker, V. (1997) Survey manual for tropical marine resources.
Australian Institute of Marine Science, Townsville, Australia. 390pp. (Copies can be bought via the Institute at www.aims.gov.au) 3
Govan, H., Aalbersberg, W., Tawake, A., and Parks, J. (2008). Locally-‐Managed Marine Areas: A guide for practitioners. The Locally-‐Managed Marine Area Network. 1
Haddon, M. (2001) Modelling and quantitative methods in fisheries. Chapman and Hall/CRC Press, Boca Raton, Florida, USA, 406pp.3
Pomeroy, RS, Parks, JE and Watson, LM (2004) How is your MPA doing? A guidebook of natural and social indicators for evaluating Marine Protected Area management effectiveness. IUCN, Gland, Switzerland and Cambridge, UK. 1

Page 87 A project managed by The Nature Conservancy on behalf of AusAidand implemented by the Australian Tropical Marine Alliance
(James Cook University, University of Queensland, University of Western Australia, the Australian Institute of Marine Science, Charles Darwin University) and the Coral Triangle Center
Unit 9: Implementing an EAFM Plan
Student outcome: knowledge of how to develop, implement and monitor an EAFM plan
Activity 9.1: Assess prior experience in planning and developing management plans. (5 mins)
Introduction An EAFM management plan should be a formal or informal arrangement between the main fisheries management authority and stakeholders. The development of a plan is essential for the implementation of EAFM. An EAFM plan should consider the following key components:
1. Define the scope of the plan 2. Define stakeholder engagement strategy 3. Compile background information 4. Prioritise issues and define objectives 5. Select indicators and reference points 6. Identify management actions to achieve objectives 7. Design process whereby all management actions can be implemented 8. Design monitoring program including performance indicators (Unit 10) 9. Design a compliance/enforcement program (Unit 10) 10. Define the “review and management adaptation” process (Unit 10)
The rest of this subject is about implementing the steps. Note that the steps are presented in a logical chronology however their implementation will require iteration between the steps. Figure 9.1 provides an overview of this process. The rest of this subject requires the student to answer the questions either on their own behalf or on behalf of the fisheries management problem they have brought to the classroom. An excellent example that can be presented is the management plan developed by the Buakap village in Morobe Province, PNG (Buakap 2006) 3.

Figure 9.1. Overview of the processes required for the development and implementation of an EAFM plan. Source: FAO, 2005.1
1. Define the scope of the plan One of the very first things you must do in developing a management plan is to decide on the geographic area of the intended management plan (consider both upstream and downstream impacts). This will determine all of the other key elements of your plan. Some of these will be:
• What fisheries are the main interest of this management effort; what are the key species (ensure students address a multi-‐species fishery to ensure full appreciation of the value of an EAFM); in what habitats do they occur; what areas does fishing occur; what impacts upon the quality of the habitats/status of fished stocks and bycatch.
• Who are the stakeholders? (i.e. anyone with a vested interest in the fisheries of interest. This should consider including local fishers, local fishing community (including non-‐fishers),
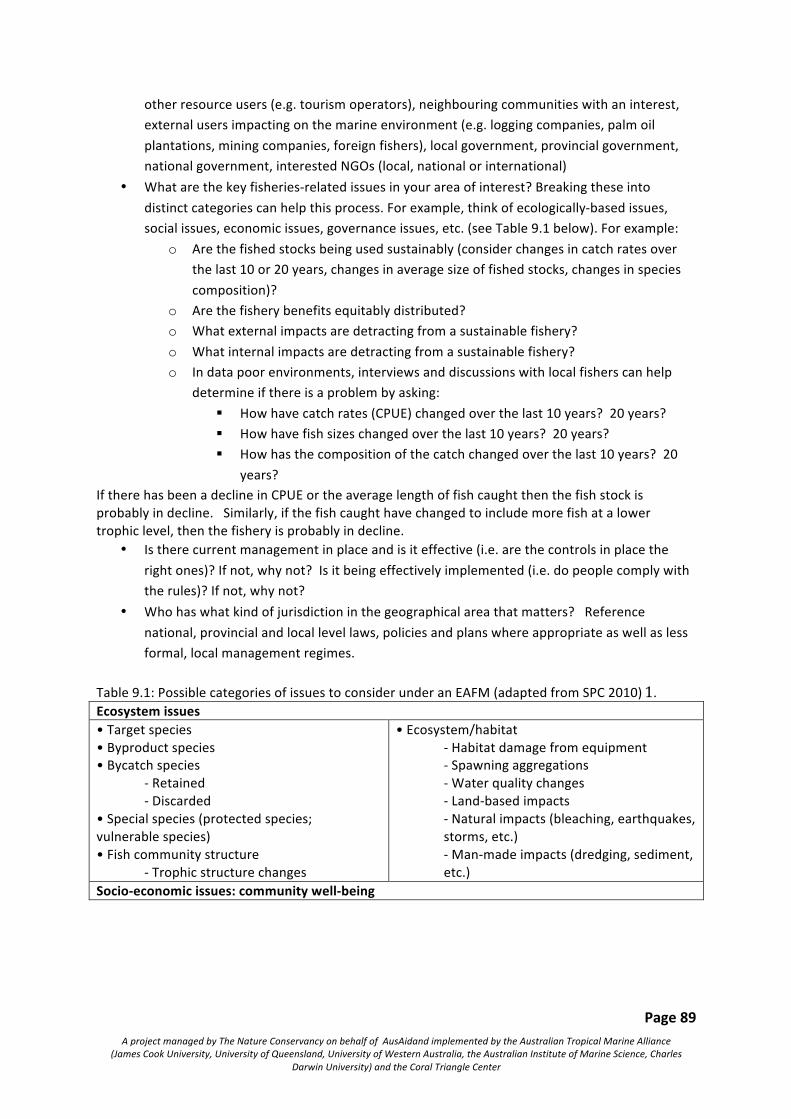
Page 89 A project managed by The Nature Conservancy on behalf of AusAidand implemented by the Australian Tropical Marine Alliance
(James Cook University, University of Queensland, University of Western Australia, the Australian Institute of Marine Science, Charles Darwin University) and the Coral Triangle Center
other resource users (e.g. tourism operators), neighbouring communities with an interest, external users impacting on the marine environment (e.g. logging companies, palm oil plantations, mining companies, foreign fishers), local government, provincial government, national government, interested NGOs (local, national or international)
• What are the key fisheries-‐related issues in your area of interest? Breaking these into distinct categories can help this process. For example, think of ecologically-‐based issues, social issues, economic issues, governance issues, etc. (see Table 9.1 below). For example:
o Are the fished stocks being used sustainably (consider changes in catch rates over the last 10 or 20 years, changes in average size of fished stocks, changes in species composition)?
o Are the fishery benefits equitably distributed? o What external impacts are detracting from a sustainable fishery? o What internal impacts are detracting from a sustainable fishery? o In data poor environments, interviews and discussions with local fishers can help
determine if there is a problem by asking: § How have catch rates (CPUE) changed over the last 10 years? 20 years? § How have fish sizes changed over the last 10 years? 20 years? § How has the composition of the catch changed over the last 10 years? 20
years? If there has been a decline in CPUE or the average length of fish caught then the fish stock is probably in decline. Similarly, if the fish caught have changed to include more fish at a lower trophic level, then the fishery is probably in decline.
• Is there current management in place and is it effective (i.e. are the controls in place the right ones)? If not, why not? Is it being effectively implemented (i.e. do people comply with the rules)? If not, why not?
• Who has what kind of jurisdiction in the geographical area that matters? Reference national, provincial and local level laws, policies and plans where appropriate as well as less formal, local management regimes.
Table 9.1: Possible categories of issues to consider under an EAFM (adapted from SPC 2010) 1. Ecosystem issues • Target species • Byproduct species • Bycatch species
-‐ Retained -‐ Discarded
• Special species (protected species; vulnerable species) • Fish community structure
-‐ Trophic structure changes
• Ecosystem/habitat -‐ Habitat damage from equipment -‐ Spawning aggregations -‐ Water quality changes -‐ Land-‐based impacts -‐ Natural impacts (bleaching, earthquakes, storms, etc.) -‐ Man-‐made impacts (dredging, sediment, etc.)
Socio-‐economic issues: community well-‐being

• Fishers -‐ Income -‐ Work-‐related injuries -‐ Food -‐ Well-‐being
• Community -‐ Employment -‐ Food -‐ Fees -‐ Cost to alternative activities or opportunities -‐ Social disputes – resource ownership, equity, benefits -‐ Fuel, boats -‐ Training -‐ Cultural values and issues -‐ Climate change -‐ Natural disasters
• Small-‐scale commercial sector -‐ Income, profit -‐ Work-‐related injuries -‐ Risk – storage, shipping -‐ Community relations -‐ Fuel, supplies -‐ Fees and licenses -‐ Training -‐ Market price variability -‐ Demand fluctuations -‐ Infrastructure
• National -‐ Management capacity -‐ Export income -‐ License fees -‐ National social and economic plans -‐ Food security -‐ Market forces -‐ Development
Governance Ability to achieve (governance) • Institutional • Legal framework
-‐ National -‐ Provincial/state -‐ Local -‐ Other
• Management plan • Compliance • Enforcement • Monitoring • Research • Community leadership and structures • Resources to manage at national, provincial and community levels
-‐ Staff capacity -‐ Financial resources
• Consultation/engagement/participation -‐ Community -‐ Industry -‐ Provinces / states -‐ Interagency -‐ NGOs
• Reporting • Information and awareness • Interagency cooperation and coordination • Community – national agency cooperation External factors (natural and human induced) • External drivers affecting governance (fisheries and non-‐fisheries sources)
-‐ Climate change impacts (bleaching, etc.) -‐ Catchment impacts (coastal development, agriculture, mining, logging) -‐ Marine development (e.g. tourism related, marine oil/gas) -‐ Market forces
Activity 9.2: Using the EAFM plan template ask students to outline the scope for their case study EAFM plan and list the key issues for the fishery/ies. This can be done as individuals, in pairs or in groups depending on the class. (50 mins)
2. Define stakeholder engagement strategy Stakeholder involvement in the EAFM process is critical to the success of the plan. Without stakeholder ’ownership‘ in what the EAFM plan is trying to achieve, and an understanding of the reasons why, then the fishing community/ies is/are not likely to accept or follow the plan. Thought

Page 91 A project managed by The Nature Conservancy on behalf of AusAidand implemented by the Australian Tropical Marine Alliance
(James Cook University, University of Queensland, University of Western Australia, the Australian Institute of Marine Science, Charles Darwin University) and the Coral Triangle Center
needs to go into this process and so a plan for engagement needs to be developed. Broadly, this is about who to include at what stages in the process and how. Planners need to decide the levels of input they desire from stakeholders regarding decision-‐making. This may be restricted due to resources or the culture of the organisation(s) you are dealing with. Pros and cons of various ways forward must be considered. For each stakeholder group, the engagement strategy needs to consider: § what do we want to achieve with this stakeholder group, § how best to achieve this, § what key messages do we want to share, § what messages will they want to share, § what inputs do we want from them, § when do we want these inputs, § how best to share messages, § how best to garner inputs, § what is the feedback loop, § what are the likely problems and benefits of the chosen approach.
Activity 9.3: In your EAFM plan i) List the relevant stakeholders for your case study, and ii) Develop your stakeholder engagement strategy using the template as a guide. (40 mins)
3. Compile background information With consideration to the issues identified above, the geographical area and the stakeholders involved, all available information on the fishery/ies, the ecosystem and the people depending on them, should be compiled and analysed. This process will help in the formulation of the plans detailed objectives. Information sources may be documents or oral history. The type of information that needs to be collected during this step includes:
Social and economic aspects of the fishery/ies – the level of employment; value of the fishery to local and national economies; subsistence and cultural importance; ownership of the resource (access rights).
Fishery characteristics – area of operation; gears used; vessel types; target and bycatch species; species biology and ecology; catch composition; monitoring data available.
Ecosystem – description of habitats; potential upstream and downstream influences; data available.
Governance -‐ legal frameworks; management plans; national-‐local arrangments. Provide information here about existing management (refer to PNG and SI Fisheries Management Information on EAFM CD under References, then Further Reading).
Activity 9.4: Identify potential sources for background information. This only needs to be a list due to time constraints to demonstrate key sources are identified. Some of these will be on the EAFM CD (eg. legislation and policy, status reports, research reports, etc). (15 mins)
4. Prioritise issues and define objectives The steps involved in translating overarching policy and goals into operational objectives and actions is seen below (Figure 9.2).

Figure 9.2. Process for translating high level policy to broad objectives of the EAFM plan, through to operational objectives and actions. (Source: FAO, 2005) 1. Broad objectives Broad objectives must be set first, and subordinate and more detailed objectives can then be set. As these broad objectives should be consistent with national policies (eg. sustainable fishing), they are very important as they provide statements of the overarching intended outcomes of the management plan. These objectives should cover all of the dimensions: economic, social, cultural, and environmental. It is important that all levels of stakeholders be involved in the setting of these objectives. Examples of broad objectives are:
• Maintain target species within ecologically viable stock levels. • Maintain habitats and non-‐retained fishery species within ecologically viable levels. • Maintain healthy structure and function of ecosystems. • Ensure equitable sharing of the resource among stakeholders. • Maximise economic benefits.
In PNG, the Buakap village in Morobe Province developed their own management plan with the overarching goal to “Protect the marine environment and fisheries resources for the future generations. ” Such a broad statement sets the scene for more specific objectives to be formulated.
An example of broad objectives and corresponding lower level subordinate objectives from the Caribbean (Fernandes, 1996)2 is given in Figure 9.3 below. Subordinate objectives all contribute to the higher-‐level objective above them.

Page 93 A project managed by The Nature Conservancy on behalf of AusAidand implemented by the Australian Tropical Marine Alliance
(James Cook University, University of Queensland, University of Western Australia, the Australian Institute of Marine Science, Charles Darwin University) and the Coral Triangle Center
Minimize reefdamage(0.083)
Maximize fishabundance
(0.083)
Maximize waterquality(0.083)
Ecologicalsustainability
(0.250)
Economicbenefits(0.250)
Children(0.042)
Public(0.042)
Government(0.042)
Increaseunderstanding
(0.125)
Maximizeuser access
(0.125)
Socialacceptability
(0.250)
Provide educationopportunities
(0.125)
Provide researchopportunities
(0.125)
Globalmodel
(0.250)
OVERALL GOAL: Preserve Saba’s marine resources for the benefit andenjoyment of people in perpetuity
Figure 9.3 Community-‐derived objectives for Saba Marine Park, structured into an objectives hierarchy. Numbers in parentheses are the default weightings (importance) given to each objectives when presuming all objectives are equally important to achieving the overall goal.
Activity 9.5: Identify broad objectives for your case study EAFM plan. (20 mins) Prioritise issues Operational objectives can usually be grouped into each of the different broad objectives and are very specific with much more detail. They will also directly address the fishery issues identified earlier. However, there is a limit to how many fisheries issues that can be practically achieved concurrently. Therefore, you firstly need to prioritise the issues to ensure that management efforts focus on the most important issues. FAO (2005)1 suggest this prioritisation involves three tasks:
Task 1: Under each of the broad objectives group the detailed fishery issues already identified. Task 2: Prioritise the issues based on the level of risk they pose to the fishery. Task 3: Develop operational objectives only for the priority issues.
Identification involves listing all of the key issues and prioritisation involves judging the severity of threats associated with each (SPC, 2010) 1. In identifying issues remember to consider all possible interactions between a fishery and the ecosystem.
Activity 9.6: Assign previously identified fishery issues to each broad objective. In small classes this works better in groups as more issues will be identified which will make Activity 9.7 easier also. This also better reflects the likely scenario when asking for community input into issue identification where many issues will be identified. (20 mins) Prioritisation can be conducted using qualitative and opinion-‐based risk assessment methods through to more quantitative data-‐based ones, depending upon student capabilities. Two different

approaches are provided below using fishing related issues as examples, however, non-‐fishing issues and socio-‐economic issues could be assessed using the same methods. Tables for using a qualitative approach or a quantitative approach are provided in the EAFM plan template. Example 1 Pairwise ranking of issues (simple):
Issue 1 Issue 2 Issue 3 Issue 4 Issue 5 etc Issue 1 Issue 2 Issue 3 Issue 4 Issue 5 etc
Compare each issue with the other e.g. Issue 2 with Issue 1. Write, in the blank white space, which one of the two is most important. Those issues that are written down most often, in the table, are the most important issues. See Box 7 below for a worked example from Ref#EAFM11.

Page 95 A project managed by The Nature Conservancy on behalf of AusAidand implemented by the Australian Tropical Marine Alliance
(James Cook University, University of Queensland, University of Western Australia, the Australian Institute of Marine Science, Charles Darwin University) and the Coral Triangle Center
Source: SPC, 2010 (EAFM1) 1.
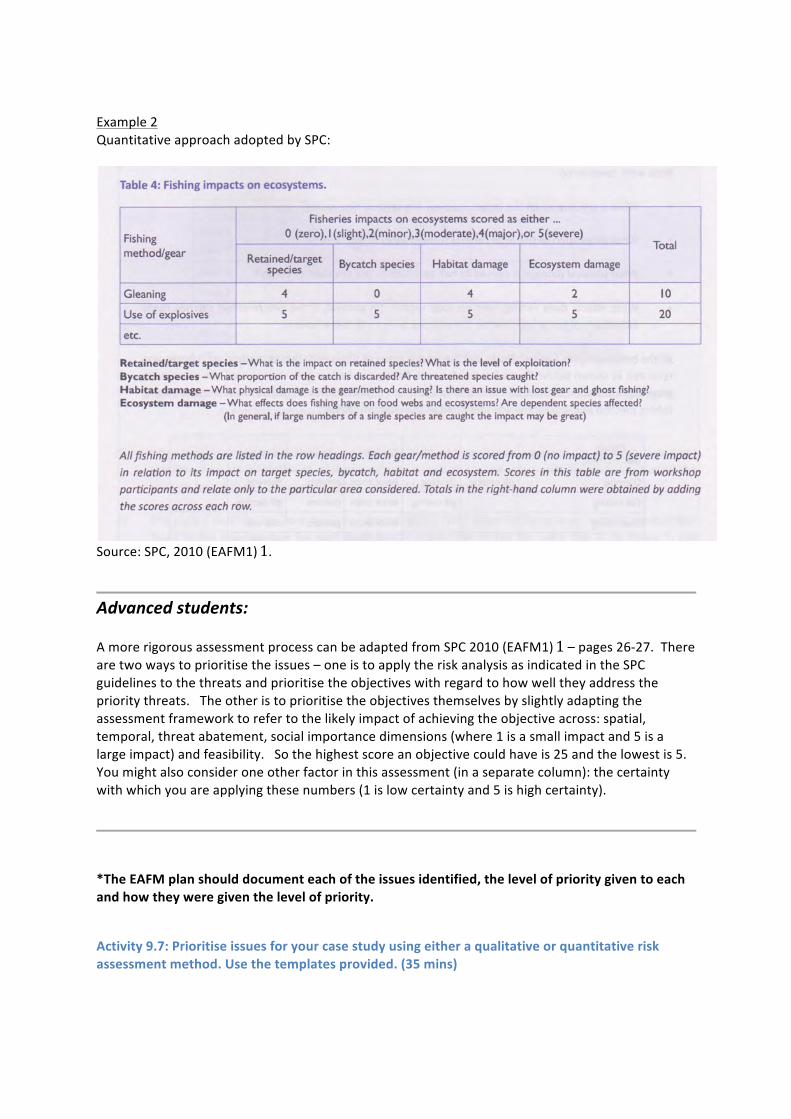
Example 2 Quantitative approach adopted by SPC:
Source: SPC, 2010 (EAFM1) 1.
Advanced students: A more rigorous assessment process can be adapted from SPC 2010 (EAFM1) 1 – pages 26-‐27. There are two ways to prioritise the issues – one is to apply the risk analysis as indicated in the SPC guidelines to the threats and prioritise the objectives with regard to how well they address the priority threats. The other is to prioritise the objectives themselves by slightly adapting the assessment framework to refer to the likely impact of achieving the objective across: spatial, temporal, threat abatement, social importance dimensions (where 1 is a small impact and 5 is a large impact) and feasibility. So the highest score an objective could have is 25 and the lowest is 5. You might also consider one other factor in this assessment (in a separate column): the certainty with which you are applying these numbers (1 is low certainty and 5 is high certainty).
*The EAFM plan should document each of the issues identified, the level of priority given to each and how they were given the level of priority.
Activity 9.7: Prioritise issues for your case study using either a qualitative or quantitative risk assessment method. Use the templates provided. (35 mins)
Page 97 A project managed by The Nature Conservancy on behalf of AusAidand implemented by the Australian Tropical Marine Alliance
(James Cook University, University of Queensland, University of Western Australia, the Australian Institute of Marine Science, Charles Darwin University) and the Coral Triangle Center
Operational objectives For each of the issues identified as being the highest priority an operational objective should be developed that addresses the issue. These objectives should be measurable and achievable. For example, if one of the fishery issues identied as a high priority is that “catches of the target species are dropping“, then an operational objective would be “to increase the catch of the target species“. In an EAFM context these objectives should be ecological, social and economic however can also refer to single species if a key issue relates to them. Once again, it is very important to have stakeholder involvement in identifying these objectives. Further reading: Pomeroy et al., 20041 provides many examples of biophysical, socio-‐economic and governance operational objectives and relevant performance measures.
Activity 9.8: Develop operational objectives for your case study EAFM plan for the priority issues. Focus on the top 3-‐4 initially. Use the objectives templates provided in the EAFM plan template. (25 mins)
5. Select indicators and reference points Indicators (or performance measures) and reference points were introduced in Unit 8. The whole aim of setting these in our plan is so we have measureable attributes that we can use to assess how well our EAFM plan is achieving its stated objectives. At least one indicator, and reference points for each indicator, should be selected for each operational objective. Ultimately it is very important that there is the capacity for the indicator to be measured and monitored regularly, and that the indicator is meaningful to stakeholders. Below is a fisheries example from SPC (2010) 1 of the use of an indicator and reference levels. Further reading: Pomeroy et al., 20041 provides many examples of biophysical, socio-‐economic and governance operational objectives and relevant performance measures.

Source: SPC, 20101.
Activity 9.9: Identify potential indicators that may be used for assessing each objective. Use the objectives table in the EAFM template. (15 mins)
6. Identify management actions to achieve objectives Management actions are the measures needed to achieve the objectives and there will quite often be more than one required to achieve a particular objective, as shown in the above example. A good way to identify the potential management actions for each objective is for members of the local community, along with relevant government and non-‐government agencies, to participate in a brainstorming session. To help in choosing the most appropriate management actions the following factors should be considered for each: ease of application, likelihood of success, feasibility and cost (SPC, 2010). Some management measures will be identified for many different objectives. In multi-‐species fisheries it will be impossible to manage for each species separately so there must be consideration to the general state of the resources overall with attention given to low productivity species as well as high productivity species. As much as possible, management actions should have minimal undesirable impacts on the operational objectives. All management actions should also refer to those responsible for their implementation.

Page 99 A project managed by The Nature Conservancy on behalf of AusAidand implemented by the Australian Tropical Marine Alliance
(James Cook University, University of Queensland, University of Western Australia, the Australian Institute of Marine Science, Charles Darwin University) and the Coral Triangle Center
A list of potential management actions (input and output controls) are listed in Unit 2 of this course. Also see:
FAO 20051 -‐ P14-‐29 SPC 20101 -‐ Table 6, p 32 Albert et al 20101 -‐ P 48-‐59
Activity 9.10: Identify potential management actions that could be used to achieve each operational objective. (45 mins) Justify your choices using the criteria: -‐ Ease of application -‐ Likelihood of success -‐ Feasibility -‐ Cost
7. Design process whereby all management actions can be implemented To be able to successfuly implement the EAFM plan, ALL of the above elements need to be documented in a written plan (see EAFM plan template on EAFM CD). The plan should consider and include all necessary details including: the exact nature of management actions, who implements them, how they will be applied and when, what formal and informal legal and administrative structures need to be put in place, what is the role of government and other agencies, what is the role fo the community, what will implementation cost, who will fund it, etc. Ideally, through cooperation between government and the stakeholders, there will be a formal recognition and acceptance of the plan at all levels (see the Apia Policy). Other elements of the plan that also need to be documented are compliance and monitoring. These elements are a critical part of the plan review process and are discussed further in Unit 10.
Activity 9.11: Using the EAFM plan template document all the above elements into an EAFM plan for your case study. Include identification of factors needed to be considered to formalise the plan, and how they may be addressed. Butchers paper may be useful for groups. (20 mins) Further reading: Buakap Salamaua management plan (2006). Coastal Fisheries Management and Development
Project. (on CD under PNG Fisheries Information)3 FAO. (2010) Putting into practice an ecosystem approach to managing sea cucumber fisheries. Food
and Agriculture Organisation, Rome. 81pp. (Ref # EAFM3) 1 Pacific Islands regional coastal fisheries management policy and strategic actions (The Apia Policy). 3
http://www.spc.int/DigitalLibrary/Doc/FAME/Reports/Anon_2008_ApiaPolicy.pdf (5MB!)
Unit 10: Compliance, Monitoring and Plan review
Student outcomes: ability to develop and implement monitoring and compliance plans to support an EAFM plan, and apply adaptive management
Activity 10.1: Ask the class to break into 2-‐3 groups and document prior experience and local examples of compliance and monitoring activities. Get them to report back to the class. What does adaptive management involve? (20 mins)
Introduction The following elements (monitoring, compliance and plan review) are all important parts of the EAFM plan and should also be documented as part of the plan. The monitoring component is very important is it provides the necessary information to assess how well the plan is performing against the objectives. The monitoring process should also consider how well the plans management actions are followed by the stakeholders (compliance – see below). To make sure that this monitoring process feeds into the plan and informs how the plan needs to be changed (or not), a review process also needs to be developed. This is discussed in the final section of this unit.
8. Design a monitoring program
Define monitoring program The EAFM plan needs to include a process for monitoring the success of the plan. This process should then be documented in a monitoring plan to help ensure it is acted on. The monitoring program will be dictated by the issues identified and prioritised earlier, thereby helping to evaluate the success in meeting the operational management objectives. The monitoring process will need to:
• Identify performance measures and reference levels for each of the operational objectives (discussed and developed in Unit 8, 9 and below in more detail);
• Identify data to be collected and the collection methods (refer to Unit 8 and remember to include data on social and economic characteristics);
• Document a plan for conducting the data collection (eg. When, where, who, how; refer to Unit 8);
• Identify how the data will be analysed (who, when; refer to Unit 8). Ultimately the data collected from monitoring will need to be formally considered during the review process. In developing a monitoring program, guidelines that complement the text here are provided in the EAFM plan template. In developing a robust monitoring program sampling design, relevant expertise should be consulted as much as possible. Principles of good monitoring design:
• Spread sampling throughout area of interest • Use replication to account for natural variability – the more the better (see Figure 10.1) • Minimise sources of variation
• Eg. fish numbers can be influenced by season, tide, time of day, depth, reef zone, water temperature, visibility, etc.
• Identify who will conduct monitoring and when • Develop robust data storage and analysis procedures

Page 101 A project managed by The Nature Conservancy on behalf of AusAidand implemented by the Australian Tropical Marine Alliance
(James Cook University, University of Queensland, University of Western Australia, the Australian Institute of Marine Science, Charles Darwin University) and the Coral Triangle Center
Figure 10.1. The importance of having replicate sampling sites in your monitoring is demonstrated here by showing the potential for incorrect conclusions that can be made without replication. Source: English et al, 19973.
More on indicators Performance indicators are the yardsticks by which one can measure, or estimate, the degree of achievement of different objectives. Performance indicators may be quantitative or qualitative. The most important characteristics of the indicators suggested here are that they must be:
• representative of the system of interest; • sensitive to temporal and spatial rates of change; • unbiased; • feasible with respect to data collection; and • easy to interpret by the various user groups that will use them.
Indicators should be representative of the objective of interest (Liverman et al. 1988)3; that is, they should accurately represent the state of achievement of the objective or include an explicit range of uncertainty (Braat 1991)3. A good indicator should be sensitive to change, ie. it should be able to

discern normal variability from movements towards or from a desirable situation (Liverman et al. 1988)3. Data for the indicator must be collected frequently enough so that significant changes can be detected within the time frame of interest (MacDonald 1972)3. Ideally, long-‐ as well as short-‐term trends should be detectable (temporal scales of change). In addition, indicators should be sensitive to spatial scales of change (Liverman et al. 19883, MacDonald 19723). If the problem of spatial heterogeneity is anticipated then it can be pre-‐empted, to some degree, by stratification of data collection and combination. Thus, both spatially and temporally, the dimensions and size of the indicator should show the degree of deviation from a steady state and the distance from a desirable situation (Opschoor and Reijnders 19913). It is impossible to establish totally unbiased indicators (Liverman et al. 19883). Value judgements enter into every stage of indicator construction: what, where, how, when to measure, how to weigh and present the results? Every effort should be made to minimise these biases (Liverman et al. 19883). The data required for indicators should be feasible to collect (MacDonald 19723, Liverman et al. 19883). In many cases, existing or proposed monitoring systems could be used. One constraint on the choice of monitoring systems may be the necessity to follow long-‐term trends in conditions. Indicators should be easy to interpret by the various groups that will use them (MacDonald 19883, Kuik and Verbruggen 19913). A reduction in precision may have to be accepted to facilitate communication of indicators. Their communication can be further improved with the use of graphics and computer demonstrations. One aspect to consider is that the decision-‐making process is usually receptive to the presentation of indicators in terms of costs and benefits (Kimball 19723).
Advanced students: Application of indicators In addition to the above technical selection criteria, the usefulness of the indicators will be enhanced if they have predictive power, if they are politically and/or socially meaningful, and if they have clear implications for policy. It is recognised that it is unlikely that all indicators will be able to meet all of these criteria; it is therefore particularly important that the process of indicator development or construction is transparent. Indicators that can predict or anticipate undesirable conditions, for instance, have great value to managers. This is possible if the indicator reflects a link between cause and effect (Gilbert and Feenstra 19923). For example, if biological indicators can be used to measure the responses of organisms to environmental quality, then it may be possible to predict a biological response from a physical measurement (Thomas 19723). Time series data may be used in predictive extrapolation or simulation modelling (Liverman et al. 19883). Performance indicators are also more useful if they have immediate political or social meaning (Goldstein 19723, Liverman et al. 19883, de Haes et al. 19913). For example, pollution may be measured at source, but the effect of that pollutant on a biotic receptor is more likely to be socially and politically meaningful. From a scientific point of view, however, the validity of biological indicators is a major problem in that knowledge of specific environmental effects, especially those arising from a combination of impacts, is often very limited (Finklea et al. 19723, Liverman et al. 19883).

Page 103 A project managed by The Nature Conservancy on behalf of AusAidand implemented by the Australian Tropical Marine Alliance
(James Cook University, University of Queensland, University of Western Australia, the Australian Institute of Marine Science, Charles Darwin University) and the Coral Triangle Center
In representing some part of a chain of cause and effect, an indicator should offer implications for policy. Determining the effectiveness of a past policy or options for future policy should be assisted by following the trends in indicators. Not all of the potential problems associated with the selection of indicators can be avoided, but a transparent process of indicator development will permit improvements and enable decision makers to make allowances for their deficiencies. In some cases, proxy (or surrogate) performance indicators have to be used to measure more nebulous qualitative effects (eg., number of lessons at school may be used to measure increased awareness and understanding). One expects, however, that the proxy is highly correlated with the effect (French 19883). Obviously this is not ideal but it provides some measure of guidance. Units of measurement of performance indicators It is essential, in defining the performance indicator, to specify the units or scale along which one is measuring achievement (Weber and Borcherding 19933). Measurement of the achievements of a project with respect to different objectives result in scores. These may be made along a "natural" pre-‐existing interval (eg., degrees Celsius temperature) or ratio scale (eg., the real numbers used to measure weight). Alternatively, qualitative measures can be used or else experts’ opinions. For example, in the absence of further information water quality can be designated as poor, satisfactory or good. Reference values Reference values give meaning to the units measured in performance indicators. Reference values tell you whether any particular level or direction of a performance indicator is good or not. Reference values also provide a base upon which lowest-‐level objectives can be normalised and compared to each other. All performance indicators should be feasible in the sense that reference values can be determined. What kinds of reference values are there? Desirable level of achievement -‐ this is the ideal level of achievement of an objective. This might be the ideal level that you or the community aim to achieve. More likely is that, because there are often multiple impacts upon an objective, anything anyone agent might do can only move the needle so far in terms of achieving this objective. Thus, for the community this “desirable level” may not be achievable through their actions alone. None-‐the-‐less, identifying what is the more desirable condition is important. Target values – are attainable levels of achievement of an objective. They are levels that should be reached within specified time frames by the people you are working with e.g. the community eg. 1, 5 or 10 years. Undesirable levels of achievement – this a level which should never be reached and is unacceptable to the parties involved. Trigger values – it may be that you are not at an “undesirable level” of achievement but you are declining in the degree to which you are achieving an objective and your have reaches a level where there is cause for concern and management action is required immediately. This is called a “trigger value” as it should trigger a management response. Trigger values are crucial because, when you are dealing with many objectives, a decline in one may be overlooked if the other objectives area going fine.

Via these reference values, performance indicators measure the distance between a current or predicted value and a value that is considered meaningful in some way.
Collecting data to assess level of performance indicators (teacher to extract most applicable information from Pomeroy et al 20041 – although this book refers to MPAs the management effectiveness measures laid out can be applied to any management efforts with similar goals). Suggest use parts of the section in Pomeroy et al 20041 called “MPA management effectiveness indicators”. For biophysical indicators read pages 47-‐53, choose one or two biophysical indicators from biophysical
indicators number 1 page 55, no7 page 94, no8 page 100, no 9 page 104, no 10 page 107; For socio-‐economic indicators read p113-‐117 and choose one or two socio-‐economic indicators from
socio-‐economic indicators no’s . 1 through to 5 pages 119-‐130. For governance indicators read p163-‐165 and choose one or two governance indicators from
governance indicators no.2 through to 6 pages 169-‐179, indicator no 9 (p186-‐187), 13, 14, 15 pages 196-‐201.
Activity 10.2: Ask students to design a fisheries data collection program appropriate for their case study. Use the monitoring program guidelines provided in the EAFM plan template and refer to the operational objectives and the indicators identified during Unit 9. Modify these as needed. Include objectives of the monitoring plan. (40 mins) Further reading (Monitoring): Johnson, J. (2010) Vulnerability and adaptation of coastal fisheries to climate change: monitoring
indicators and survey design for implementation in the Pacific. C2O Consulting – coasts climate oceans. Report for the Secretariat of the Pacific Community, New Caledonia.1
MRAG (2010) Monitoring the vulnerability and adaptation of Pacific coastal fisheries to climate chnage. Report prepared for the Secretariat of the Pacific Community, Marine Resources Division, New Caledonia.1
Pomeroy, RS, Parks, JE and Watson, LM (2004) How is your MPA doing? A guidebook of natural and social indicators for evaluating Marine Protected Area managament effectiveness. IUCN, Gland, Switzerland and Cambridge, UK. xvi + 216p.1
9. Design a compliance/enforcement program Building a natural resource management plan together with local communities and users of the resource will facilitate compliance because the resource users will have more ownership of the plan. Even better is when the management planning effort originates with communities. None-‐the-‐less, there will always be a level of non-‐compliance although the degree of non-‐compliance will be low for most people. Only a few might fail to stick to the rules on purpose (Figure 10.1). Where people fail to stick to the rules on purpose, it can be important to understand why they are non-‐compliant. Is it because they don’t agree with the rules or they can’t afford to stick to the rules (e.g. if they don’t catch the extra fish then they can’t pay the school fees). These motivations can influence, on a case-‐by-‐case basis, the response by management. After the management plan is in place, compliance can be encouraged through the following actions:

Page 105 A project managed by The Nature Conservancy on behalf of AusAidand implemented by the Australian Tropical Marine Alliance
(James Cook University, University of Queensland, University of Western Australia, the Australian Institute of Marine Science, Charles Darwin University) and the Coral Triangle Center
Education – about the rules and also about the reasons for the rules. This can occur at schools as well as at other forums (e.g. gatherings where people who use the resource come together). This will help prevent accidental non-‐compliance. Routine surveillance (Cruise and peruse) – like police, it can be beneficial for the management body to have an on-‐the-‐water presence in the marine managed area. This raises the profile of the management plan and encourages resource users to ensure they know the rules. If possible, this type of surveillance should never be predictable to the resource user; it should be as random as possible. This will help deter those who might consider breaking the rules if they observe no enforcement activities. Targeting of specific behaviours that lead to opportunistic or intentional non-‐compliance – identify the times/locations/species/issues that are the focus of non-‐compliant behaviour and focus limited surveillance and enforcement resources to those times/locations/issues and/or species. Punishment of those conducting illegal activities. The deterrent used to prevent or stop further activities that are against the rules must be sufficient to achieve the goal of encouraging compliance. The sanction need not be a financial punishment. It may be infringements on rights, either permanently or temporarily (e.g. the person is not allowed to fish for a certain length of time).
Figure 10.1. Compliance pyramid – Motivations and responses to facilitate compliance (adapted from Gunningham and Grabosky, 1998 p.397 in Greenfield 2009)2 Who conducts the compliance activities? The compliance activities can be conducted by a range of organisations/groups as long as they are appropriately empowered to do so. These might include locally anointed rangers given this power by community leaders or more formal entities (e.g. staff of the management organisation, local
police, Navy, etc).
Education of the community using the resources is one part of compliance. This can be conducted by the management group or could be devolved, in part, to existing training/education institutions, where appropriate.
Surveillance activities must be conducted by people who have either formal or informal powers to act if they discover illegal activities. A risk-‐based approach to enforcement activities Targeting specific behaviours – a risk-‐based approach should be taken to prioritising the allocation of limited resources available for enforcement. This means assessing:
1. Which illegal activities (in total) are most damaging to the resources? 2. Which illegal activities will enforcement efforts succeed in stopping?
The next steps in the risk-‐based approach to enforcement is to determine which times/places to deploy enforcement efforts to maximise the chance of apprehending those breaking the rules. This will usually NOT mean regular surveillance of the managed area but rather targeted enforcement efforts which are planned without the knowledge of those conducting the illegal activities. Very few places in the world have the resources to ensure compliance to resource management through heavy enforcement activities. High levels of voluntary compliance are required. Whilst education can be helpful to ensure voluntary compliance for many people, other people need deterrents. Being caught doing the wrong thing can, in itself, be an adequate deterrent for some people. But for others, it will be important that the sanction imposed is high enough to deter their illegal activities. This is especially important in situations where the risk of being caught doing the wrong thing is low. If the penalty is high enough then this can be adequate to deter illegal activity despite the low risk of being caught. Crime scene investigation approach Environmental crimes can and should be subjected to investigation. There has been an unfortunate tradition, in enforcement of marine resource rules, that those breaking the rules must be “caught in the act”. This is not the case for almost any other type of breach of rules or regulations. Rather, enforcement officers can gather evidence, including conducting interviews with witnesses and “the accused” person in order to build a case against someone who has done the wrong thing. This investigative approach is advocated when aiming to enforce an ecosystem approach to management planning. Rewarding good behaviour Sticking to the rules can also be encouraged through rewards for good behaviour. Whether a reward system might work, or what kind of reward system might work, depends upon each individual situation. Rewards would usually not be monetary. Rewards might be in terms of an award or prize (a recognition scheme), it might be a form of certification or it might be improvements in access to the marine resource which do not, in any way, diminish the resource. For example, if permission to take certain species is required to be renewed annually, then “good behaviour” might mean that the renewal might only be required every two years. Coordinating compliance efforts and centralising information

Page 107 A project managed by The Nature Conservancy on behalf of AusAidand implemented by the Australian Tropical Marine Alliance
(James Cook University, University of Queensland, University of Western Australia, the Australian Institute of Marine Science, Charles Darwin University) and the Coral Triangle Center
Sometimes different groups of people or different organisations are conducting surveillance in the same area for different purposes. By identifying these different groups and coordinating activities, it might be possible to conduct surveillance trips with multiple objectives, rather than surveillance aimed at only one purpose. For example, if the Navy, or Customs, or Water Police, or local rangers or local police all spend some time in an area conducting surveillance and they see activities of interest to each other it would be useful if they shared this information. This can best be conducted via one centralised locus for depositing information, which all these groups can then access. This might be a community leader or else one of the groups or organisations involved – probably the one with the most resources to keep track of incoming information. Training those who are supporting compliance The rules of the management plan must be well understood by those in the role of supporting compliance. This includes, also, those who will sit in judgement of people who break the rules. These may be part of a formal legal system or local community leaders. If the enforcement activities are part of a formal legal system, then compliance officers must be informed as to the appropriate manner in which to collect information (evidence) to use to prosecute accused persons. If enforcement activities are not part of a formal legal system, then compliance officers must understand and adhere to the community leaders and community norms in terms of collecting information about those who break the rules. Particular aspects of the severity of illegal activities that should be highlighted to compliance officers and those sitting in judgement of accused persons (whether part of a legal structure or local leaders) include:
• Inequity of allowing some the benefits of illegal access to resources and not others • Reduction of the benefits potentially accruing to all resource users due to non-‐compliance • Erosion of the integrity of the management plan as a whole, due to even a small number of
illegal uses occurring These factors must be considered when decisions are made about appropriate levels and types of punishment to ensure adequate punishments are handed down. Funding the compliance activities Much as the development of the management plan should include addressing sustainable funding, so too must sustainable funding be sourced to support compliance activities from education to enforcement.
Activity 10.3: Use the EAFM plan template to develop a compliance program for your case study EAFM plan. (30 mins) Further reading (Compliance): Greenfield, R. 2009. Facilitating compliance with natural resource management regulations.
Findings from Research Cycle 2: expert perceptions of compliance and non-‐compliance. Department of Environment and Resource Management, Brisbane. 2
Smith, R. G. and K. Anderson. 2004. Understanding Non-‐compliance in the Marine Environment in

Australian Institute of Criminology, editor. Australian Government, Canberra. 2
10. Develop the “review and management adaptation” process A review process is necessary in assessing how well performance measures meet the plan objectives. Reviews should be short-‐ and long-‐term and be clearly identified in the EAFM plan (see Figure 9.1). Reviews should involve all stakeholders and should use all available and relevant information obtained during the review period, either from external sources or through the monitoring program set up as part of the implementation. If the monitoring process identifies that a particular objective is not being achieved then management effectiveness (or governance issues) need to be examined. For example, are managment actions being implemented? Are regulations being enforced effectively? If the answers to either of these questions is ‘no‘ then they need to be addressed. If the answers to both of these questions is ‘yes‘ then other or additional management actions need to be considered (SPC, 2010)1. This is called adaptive management and is an important part of incorporating learning into the management process, and in ultimately achieving successful management. Short-‐term reviews should be approximately annual and long-‐term reviews should be carried out every 3-‐5 years and will involve a more comprehensive assessment of the success of the plan (Figure 9.1). This stage may involve a re-‐evaluation of the entire plan including the relevance of the operational objectives. It will need to examine all possible reasons to explain where a plan is not working, and where it is working.
Activity 10.4: Update EAFM plan with a timeframe and process for review of management effectiveness. If needed refer back to Figure 9.1 for how you might develop your plan review process. (15 mins) Further reading (Review): Pomeroy, RS, Parks, JE and Watson, LM (2004) How is your MPA doing? A guidebook of natural and
social indicators for evaluating Marine Protected Area managament effectiveness. IUCN, Gland, Switzerland and Cambridge, UK. xvi + 216p. 1
GLOSSARY TEST (Assessable) Answer in your exercise books 3 (three) of the following:
• Define “connectivity” • List and describe 3 major fishery threats • Define “ecosystem” • List and describe 3 management tools • Define “productivity”

Page 109 A project managed by The Nature Conservancy on behalf of AusAidand implemented by the Australian Tropical Marine Alliance
(James Cook University, University of Queensland, University of Western Australia, the Australian Institute of Marine Science, Charles Darwin University) and the Coral Triangle Center
Final words Some principles proposed by SPC (2010)1 for community-‐based EAFM are worth remembering as you go through the process of developing your own EAFM plan. Although they are targeted to a community-‐based approach, they are generally relevant for any EAFM approach: Keep the process simple: The process and reasons for management actions, or undertakings, have to be understood at the community level.
Respect local customs and protocols: The local traditions and customs must be respected if the process to implement EAFM is to succeed.
Provide motivation: Most communities have a good understanding of problems that are affecting their fisheries and the marine environment. The major need is to motivate communities to address these problems.
Maximise community participation: All sectors of the community, including youths, women, and community leaders should be encouraged to participate. Most community members are involved in fishing.
Make use of traditional knowledge: The knowledge held by older members of the community is likely to be valuable in proposing management actions.
Use science to support community objectives: Technical advice and information should be made available to community members. Examples include providing recommendations on size limits of fish, advice on the likely source and effects of existing pollutants, and on ways of improving the wellbeing of community members.
Enlist the support of a broad range of government agencies: Many issues affecting a community will be beyond the control of the community. The maximum participation of stakeholders, including a broad range of government agencies, is important in the EAFM process.
Use a demand-‐based system: Work with communities that are aware of their problems and keen to take actions to resolve them. As the resources of most fisheries agencies and other promoting agencies are limited, it makes sense to work with communities that are eager to take local actions. Less committed communities may eventually see the benefits and request to join the programme.
Adopt a precautionary approach: Encourage communities to take precautionary actions or undertakings without waiting for scientific confirmation of what is generally known.
Manage human activities: Most management is about regulating human activities – activities that are reducing stocks of fish and polluting coastal ecosystems need to be regulated.
Suggest alternatives to the overexploitation of resources: Wherever possible, suggest alternatives to the overexploitation of resources. These may include the diversion of fishing pressure from lagoons to offshore areas by the installation of fish aggregating devices (FADs) and developing aquaculture or agriculture.
Develop supporting legislation for EAFM: For effective management under EAFM, it is desirable that local communities are legally provided with the authority to manage their management areas and fisheries resources.
References (Final words) Secretariat of the Pacific Community. 2010. A community-‐based ecosystem approach to fisheries
management: guidelines for Pacific Island countries. Secretariat of the Pacific Community, Noumea. 65pp (EAFM1)1


Page 111 A project managed by The Nature Conservancy on behalf of AusAidand implemented by the Australian Tropical Marine Alliance
(James Cook University, University of Queensland, University of Western Australia, the Australian Institute of Marine Science, Charles Darwin University) and the Coral Triangle Center
Dr Leanne Fernandes Executive Officer
Australian Tropical Marine Alliance c/o Office of the Senior Deputy Vice-‐Chancellor
James Cook University Townsville QLD 4811
Australia Ph. +61 7 4725 1824
Email: [email protected]
Ms Rili Djohani
Director Coral Triangle Center
Jl. Danau Tambingan no. 78 Sanur Bali 80228, Indonesia
Ph. +62 361 289338 Email: [email protected]
Ms Laura Whitford Policy Advisor, Asia-‐Pacific The Nature Conservancy
60 Leicester St Carlton, Melbourne VIC 3053 Australia Ph. +61 3 8346-‐8605
Email: [email protected]