Embed Size (px)
Citation preview

1
Adaobi Gloria Bolu
51017150
Date of submission: 30th
August 2011
Thesis presented in partial fulfilment of the requirements for the degree of MSc. International
Business, Energy and Petroleum at the University of Aberdeen.
Economics of Safety:
An empirical Study

2
DISCLAIMER
I declare that this thesis has been composed by myself, that it has not been accepted in any
previous application for a degree, that the work of which it is a record has been done by
myself, and that all quotations have been distinguished appropriately and the source of
information specifically acknowledged.
Adaobi Gloria Bolu
30th
August 2011

3
ACKNOWLEDGEMENT
I am thankful to my supervisor, Professor Euan Phimister, whose guidance and support from
the initial to the final level enabled me to develop an understanding of the subject.
In addition, I would like to thank Opito and in particular, David Doig for his encouragement,
support and granting me the Opito Piper Alpha Memorial MSc Safety Scholarship. I remain
ever grateful.
DEDICATION
I would like to dedicate this dissertation to God Almighty and my family for all their patience
and support.

4
TABLE OF CONTENT
List of Figures and Tables.......................................................................................................... 6
CHAPTER ONE ........................................................................................................................ 9
1 Introduction ........................................................................................................................ 9
CHAPTER TWO ....................................................................................................................... 9
2 Background ....................................................................................................................... 10
2.1 Origins of UK oil and gas ......................................................................................... 10
2.2 Designation of the UK Continental Shelf ................................................................. 11
2.3 Introduction to Health and Safety ............................................................................. 13
2.4 Piper Alpha disaster .................................................................................................. 13
2.5 Lord Cullen Public Inquiry Key recommendations .................................................. 14
2.6 The Safety Case regime............................................................................................. 14
2.7 Government and industry targets .............................................................................. 16
CHAPTER 3 ............................................................................................................................ 18
3 Economics of safety .......................................................................................................... 18
3.1 Optimal policy for safety........................................................................................... 19
3.2 Economic Costs ......................................................................................................... 20
3.2.1 Economic costs to employees ............................................................................ 20
3.2.2 The Economic cost to Firm ................................................................................ 21
3.2.3 Economic cost to host country ........................................................................... 25
3.3 Value of human life and Safety ................................................................................. 28
3.4 Information Asymmetry ............................................................................................ 33
3.4.1 Why does Moral Hazard occur? ........................................................................ 34
3.4.2 Moral hazard on safety in the oil and gas industry ............................................ 36
CHAPTER 4 ............................................................................................................................ 38
4 Research Methodology ..................................................................................................... 38
4.1 Data ........................................................................................................................... 38

5
4.2 Method for data analysis ........................................................................................... 40
4.3 Econometric Model ................................................................................................... 40
4.3.1 Tests ................................................................................................................... 41
4.3.2 Hypothesis Testing............................................................................................. 41
4.4 Results and Interpretation.......................................................................................... 42
4.4.1 Test 1: Relationship between major hydrocarbon releases and OSCR 2005..... 43
4.4.2 Test 2: Relationship between minor hydrocarbon releases and OSCR 2005 .... 44
4.4.3 Test 2: Relationship between significant hydrocarbon releases and OSCR 2005
45
CHAPTER 5 ......................................................................................................................... 46
5 Conclusion ........................................................................................................................ 46
6 Appendix .......................................................................................................................... 48
Bibliography ............................................................................................................................ 54

6
LIST OF FIGURES
Figure 1 UK continental shelf (UKCS). Source: The Energy Report (1998) .......................... 12
Figure 2 Combined fatal and major injury rate. Source: HSE (2010) ..................................... 16
Figure 3 Over 3 day injury rate. Source: HSE (2010) ............................................................. 17
Figure 4 Average costs for businesses from accidents at work. Source:
nuneatonandbedworth.gov.uk .................................................................................................. 22
Figure 5 Costs to employers of workplace injuries and work-related ill health in 2005/06.
Source: Pathak (2008) .............................................................................................................. 22
Figure 6 A comparison of major injury rates and size of establishment. Source:
nuneatonandbedworth.gov.uk .................................................................................................. 23
Figure 7 Accident costs, prevention costs and safety levels. Source: Dorman (2000b) .......... 24
Figure 8 Estimates of aggregate economic cost of occupational injury and disease (%), by
country. Source: Buhai et al (2008) ......................................................................................... 26
Figure 9 Costs to Britain of workplace accidents and work-related ill, 2001/02. Source:
Pathak (2008) ........................................................................................................................... 27
Figure 10 Derivation of the implicit value of a life. Source: Dardis (1980) ............................ 29
Figure 11 Major, minor and significant hydrocarbon releases. Source: HSE (2006) .............. 42

7
LIST OF TABLES
Table 1 Costs to employers, by component cost. Source: Pathak (2008) ................................ 23
Table 2 UK average cost of illness in 2006. Source: HSE (2008) ........................................... 25
Table 3 Value of statistical life by country. Source: Miller (2000) ......................................... 31
Table 4 Range of statistical life values (in thousands of 1995 us dollars). Source: Miller
(2000) ....................................................................................................................................... 32
Table 5 The insurance market. Source: Gravelle & Rees (1993) ............................................ 35
Table 6 Changes between the 1992 and 2005 Offshore Safety Case Regime (OSCR). Source:
HSE (2006) .............................................................................................................................. 39
Table 7 Econometric model descriptions ................................................................................. 40
Table 8 Major hydrocarbon releases: summary statistics ........................................................ 43
Table 9 Additional summary statistics ..................................................................................... 43
Table 10 Minor hydrocarbon releases: summary statistics ...................................................... 44
Table 11 Additional summary statistics ................................................................................... 44
Table 12 Significant hydrocarbon releases: summary statistics .............................................. 45
Table 13 Additional summary statistics ................................................................................... 45

8
ABSTRACT
The importance of safety in the UK offshore oil and gas industry can never be over
emphasised. This is because the industry has faced serious accidents like the Piper Alpha
disaster which killed 167 people. The motivation of this dissertation is to investigate the
nature of relationship between safety in the oil and gas industry and the UK safety
regulations.
Chapter 1 describes the motivation of this dissertation, research aim, objectives and research
structure. Chapter 2 presents a background into the offshore oil and gas safety culture, while
Chapter 3 critically reviews current literature on the economics of safety. Finally, Chapter 4
presents an empirical study of the relationship between Offshore Safety Case Regime
(OSCR) 2005 and hydrocarbon releases. The result of the empirical study identifies a strong
need for safety regulations in the UK offshore oil and gas industry as firms have the least
incentive to improve safety conditions compared to employees and society. This is because
firms are faced with the least economic costs hence resulting in market failure.
Government intervention through regulations can improve safety however faced with
information asymmetry. This information asymmetry gave rise to the question of whether
government regulations had an impact on safety which was answered in chapter four. The
Offshore Safety Case Regime (OSCR) 2005 was the variable for the safety regulation while
hydrocarbon releases was used as a measure of safety. The regression captured the impact of
the change in safety case regime in 2005 to safety. The result from the empirical analysis
found that OSCR 2005 had an effect on minor hydrocarbon releases but no effect on major
and significant hydrocarbon releases. Hence, there is a room for improvement in the OSCR
2005 regulation for further increase in safety.

9
CHAPTER ONE
1 Introduction
The offshore oil and gas industry is faced with the challenge of hazards which arise from
hydrocarbons being processed on relatively small and congested platforms, with a potential
risk of fires and explosions. For example, over the years there have been a few serious
accidents involving multiple fatalities, the worst ones being the “Alexander L Kjelland”, the
“Ocean Ranger”, the “Piper Alpha” and most recently the “Gulf of Mexico oil spill” by BP.
Hence, the need for an effective safety management practice cannot be over emphasised to
minimise the number of accidents.
The primary aim of this research is to establish the nature of the relationship between level of
safety and safety regulation in the UK offshore oil and gas industry. In order to achieve the
aim, the dissertation will review and critically analyse the literature on economics of safety
and develop an econometric model to investigate the relationship between level of safety
(hydrocarbon releases will be used) and safety regulation (safety case regime) in the oil and
gas industry. The study will identify whether the change in safety case regime from 1992
version to the 2005 updated regulations had an impact on safety.
This study examines existing literature on the economics of safety focusing on the economic
costs, optimal safety and impact of asymmetry information. From the research, regulatory
intervention seemed incredibly necessary due to market failure hence; a regression was
carried out to see if the safety regulation in the oil and gas industry actually had an effect on
improving safety. The safety regulation used in this research was the safety case regime
implemented in 2005 while the variable used to measure safety was the number of
hydrocarbon releases.
In order to achieve the research aim, this study will have 5 chapters. The second chapter will
give a general background into the UK offshore oil and gas industry and safety developments
in the industry. The third chapter focuses on the economics of safety with specific attention to
the need of regulation and why this regulation may not reduce safety. The fourth chapter
gives an example of the impact of regulation of safety; hence an empirical analysis is
performed using OLS and Poisson regression models. The fifth chapter gives a conclusion of
the dissertation with limitations faced and ways research can be further developed.
10
CHAPTER TWO
2 Background
In order to achieve the research aim which is to examine the relationship between safety and
safety regulations in the oil and gas industry, this dissertation will give a background into the
oil and gas industry and history of safety regulation in the industry. For this to be achieved,
firstly the origins of UK oil and gas will be discussed then designation of the UK Continental
Shelf (UKCS). An introduction of health and safety will follow, then a brief explanation of
the worst offshore oil and gas accident which is the piper alpha. As a result of the piper alpha,
the Lord Cullen Public Inquiry Key recommendations came out which is explained. This
Cullen Public recommendations included the safety regime which is discussed next as it is
our key variable for regulations in this dissertation. Finally the government and industry
targets are identified and are compared with the actual results for accidents between 1996 and
2010.
2.1 Origins of UK oil and gas
Oil and gas can be described as one of the most significant natural resource found in the
United Kingdom (UK). Oil and gas resources are very essential in modern day development
as they serve as one of the most common source of energy for industries and households
around the world (Pindyck, 2001). Resources from the oil and gas sources can be used to
provide energy and chemicals for domestic use, industries and transport system as well as
revenues from exports and taxes to support the UK economy. According to Mason (2006), oil
and gas resources in the United Kingdom are derived from two major sources. The first
source is associated with discoveries of commercial quantity of natural gas underneath the
southern North Sea and Irish seas which were originally coal derived from lush about
300millions years ago. The central and northern North Sea serves as the second source of oil
and most gas in the UK. This was formed from the residue of planktonic algae and bacteria
that flourished in tropical seas about 150million years ago (Energy report, 2000).
The origin of oil and gas in the UK can be trace to shales in Edinburgh which where dug up
and roasted to make kerosene. This led to a peak production of this source of energy in 1918.
The difficulty in oil importation experienced during the First World War stands as one of the
major factors which pushed for the exploration oil and gas in the UK. As a result of scarcity

11
of oil, the government companies to drill for oil. Hence, the Petroleum (Production) Act 1918
was formed which aimed to issue licences and control UK exploration and production. As a
result of resumption in import after the war, interest in exploration did not grow rapidly until
1930‟s when the Petroleum (Production) Act 1934 was formed and abolished the 1918 Act
(Energy report, 2000).
Shortly after the enactment of the Petroleum (Production) Act 1934, the commercial quantity
of gas was discovered onshore in Yorkshire which was followed there after by an oil field
found close to Nottingham. These discoveries were significant to the development of the oil
and gas industry, such that by the 1940s, about 40,000 tonnes of oil were being produced per
annum (Energy Report, 2000). This report also explains that onshore exploration significantly
advanced when the Wytch Farm field in Dorset was discovered in 1973 and its later offshore
extension which was proven in the 1980‟s.
So far this dissertation has explained how oil and gas originated and how regulations where
formed. However, it is important to identify which part of the North Sea (where the offshore
oil and gas is deposited) is designated to the UK for exploration. This is described in the next
section of the chapter below.
2.2 Designation of the UK Continental Shelf
The Energy report (1998) defines the United Kingdom Continental Shelf (UKCS) as the
district of water surrounding the UK which the UK claims mineral deposits. Therefore, the
UKCS encompasses those parts of the sea bed and subsoil further than the territorial sea over
which the UK applies independent rights of exploration and exploitation of natural resources.
Primarily, this is known as the North Sea which has several hydrocarbon deposits however it
is also bordered by Norway, Denmark and Germany. In order to avoid conflicts of interest a
mutual agreement has been made by the countries to set out domains of each of these
countries (Grant, 2003).
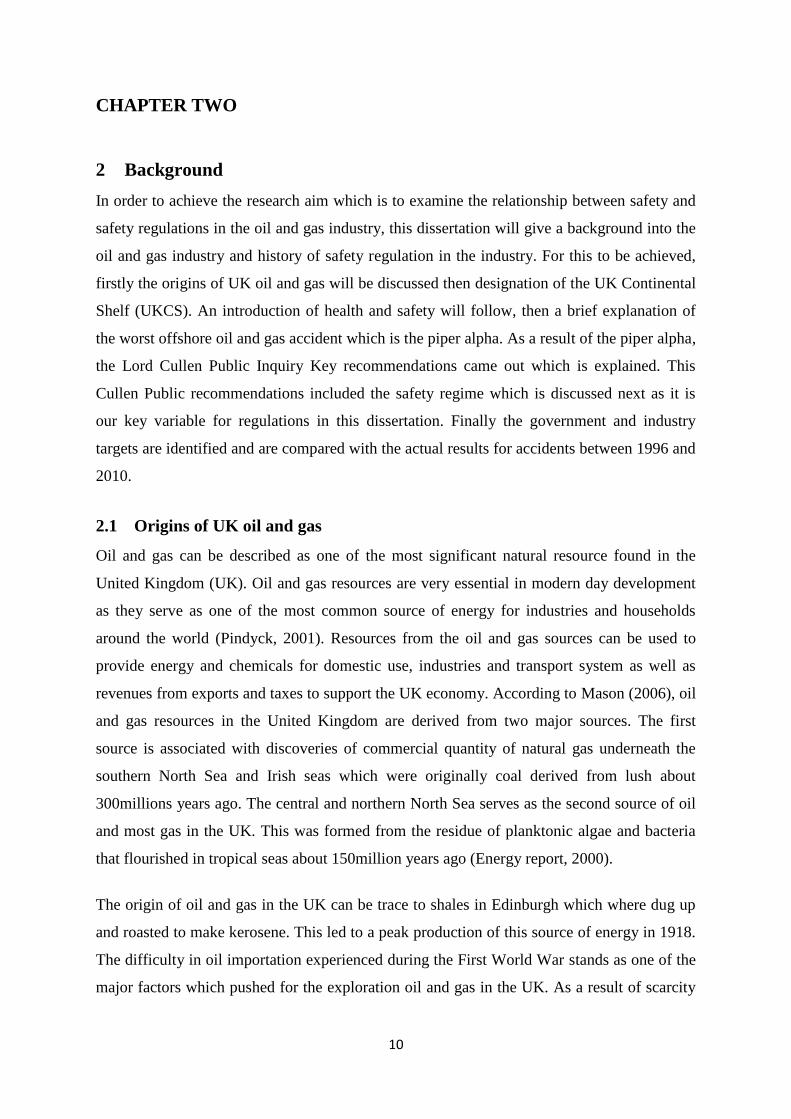
The map below identifies how the UKCS has been expanded since the mid 1960s. The exact
limits of the UKCS are set out in orders prepared under section 1(7) of the Continental Shelf
Act 1963 (Energy Report, 1998).
12
Figure 1 UK continental shelf (UKCS). Source: The Energy Report (1998)
Activities in the UKCS are monitored and regulated by the Department of Energy and
Climate Change (DECC). This organisation is charged with the responsibility granting
licences to oil firms to produce hydrocarbons from precise areas and controls how much the
firms can produce over what time in the UKCS (DECC, 2011). It is the Petroleum
(Production) Act 1934 that awards the UK government the authority to issue licences to oil
companies for exploration and exploitation of the petroleum resources in Great Britain and its
surrounding waters. It is also worthy of note that the Continental Shelf Act (1964) extends
these rights to the UKCS and that laws made under the Petroleum (Production) Act 1934
state how and by whom applications for these licences can be made (DECC, 2011).
According to the Energy report (1998) during the exploration, development and production of
oil and gas resources in the UK, the issue of environmental protection stands as the
paramount concern. Hence, the report states that applicants for oil and gas prospecting
licences are ordinarily expected to hand in copies of their Company Environmental Policy,
Environmental Management System and an initial Environmental Assessment of the vicinity
to be explored with their applications. In addition to this condition, it is also a requirement for
oil companies to present a work programme document that details evaluation of
environmental analysis.

13
So far, a background of the origins of UK oil and gas and the UKCS has been explained. As
this dissertation is focused on the economics of safety in the oil and gas industry, the next
sections gives an introduction to health and safety in this industry.
2.3 Introduction to Health and Safety
The management of day to day safety operations in the UK offshore oil and gas industry has
evolved over time. The accidents have been the major cause for the development of most
safety regulations. The first offshore health and safety legislation was the Mineral Workings
(Offshore Installations) Act 1971 which was carried out by the Department of Energy (Wils
and Nelson, 2007). Regulations relating to stand by vessels where run by the Department of
Transport while Certifying Authorities which were appointed by the department of Energy
had the role to check, test and certify that installations themselves, fire-fighting equipment
and live saving appliances, were „fit-for-purpose‟. This led to major confusion as various
authorities managed different regulatory requirements and more importantly, issues such as
fire fighting equipment and emergency procedures had a „one size fit all‟ approach which was
a significant problem. This is because in reality most installations have distinctive risk
profiles requiring site specific approaches to health and safety management. This led to
frictions between oil companies and government departments in charge of various regulatory
requirements because of the poor safety culture (Wils and Nelson, 2007).
Piper Alpha accident which is the world‟s worst offshore oil industry incident till date caused
an extreme transformation in offshore safety management (Duff, 2008). This led to an
introduction of various regulatory frameworks to govern all UK installations, as well as
Health and Safety Executive (HSE) being in charge of the development and enforcement of
safety regulations (Bull, 2004). More so, this resulted in the clear separation of industry
safety issues and potential conflicts with field developments hence prosecution was more
likely if firms failed to adhere to safety regulations. This disaster is further explained in the
next section below.
2.4 Piper Alpha disaster
A large fixed platform, Piper Alpha was situated on the Piper oilfield, approximately 180km
north east of Aberdeen. On the 6th
of July 1988, an explosion happened in the gas
compression room which was next to the control room. There were about 229 personnel on

14
the platform at the time and only about 62 survived. The Piper Alpha fire caused the lives of
167 people who suffocated from the toxic fumes of the gas leak making it the world‟s worst
offshore oil incident (Wils and Nelson, 2007).
This immediately motivated the UK government to institute a two part Public Inquiry
directed by Lord Cullen which is in the next section below. The first part was to identify what
caused the fire and the second part was to make sure this incident did not repeat itself in
future. It was found that the main cause of the fire was due to a leak in pipework connected to
a condensate pump. What had happened was that a safety valve had been removed from the
pipework or maintenance and this led to gas inadvertently being introduced into this section
of the pipework (Wils and Nelson, 2007).
2.5 Lord Cullen Public Inquiry Key recommendations
According to Wils and Nelson (2007), in November 1990 Lord Cullen published the Public
Inquiry which contained three major findings:
Offshore safety should be managed by a single body, the Health and Safety Executive
(HSE) rather than the industry sector administrator.
Goal setting regulations should replace the original array of detailed prescriptive
regulations.
„Safety Case‟ which is a detailed site specific technical document justifying the case
for safety design and operation of the installation should be submitted by the operator
to the regulator. In 1992, the Offshore Installations (Safety Case) Regulations came
into force.
The next section explains the safety case regime in more detail as it is the key variable
needed to achieve the aim of finding the relationship between safety regulation and safety in
this dissertation.
2.6 The Safety Case regime
In 1992, the Offshore Installations (Safety Case) Regulations came into force. To improve
safety, the Offshore Installations (Safety Case) Regulations 2005 (SCR05) insists that
installations to be operated or operating have a safety case which must be accepted by HSE.
The responsibility of submitting a safety case is placed on operator of a production
installation and the owner of a non production installation. A safety case is a living document

15
which must be kept up to date throughout the life of the production installation. More so, any
change that makes a significant or material change to the case for safety must be resubmitted
to HSE for acceptance. Also the duty holder must make sure the safety case is at least revised
every five years or less if instructed by HSE. After the safety case is accepted a fixed
installation is dismantled (Wils and Nelson, 2007).
According to a report prepared by Vectra Group Limited (2003) for HSE, the safety case
gives confidence to the duty holder and the regulator, HSE that the duty holder has the ability
to manage major accident risk effectively. This means that the duty holder must have
identified and evaluated all potential hazards which could lead to major accidents. Also the
safety case expects that the duty holder would have taken measures to manage those risks to
ensure compliance with relevant statutory provisions which are regulations that apply to an
installation.
In this case, major accident hazards refer to any hazard that can cause serious injury or loss of
life and these can be evaluated through the use of systematic techniques such as qualitative,
semi quantitative or quantitative. SO if a measure is practicable and the cost is not grossly
disproportionate to the benefit, then the measure is worth implementing as it is practicable.
Wils and Nelson (2007) states that SCR05 is a foundation to the offshore health and safety.
Additionally, SCR05 have independent and scrutiny of safety critical elements throughout the
installation life cycle, to get assurance that the systems are always fit for use and will be
constantly maintained. This verification technique can be used as evidence of a duty holder‟s
compliance with legal obligations such as those arising from Prevention of Fire and
Explosion, and Emergency Response Regulations (PFEER) 1995 and Design and
Construction Regulations (DCR) 1996. The major difference between SCR05 and PFEER,
DCR etc is that the former requires a written confirmation of compliance while the latter
requires some specific action to be carried out.
This section has explained the safety case regime which has been designed to improve safety
in the oil and gas industry. However what exactly is the government and firms trying to
achieve? Well, the next section answers this question as it identifies the government and
industry targets for safety and also shows the actual results of injury rate from 1996 to 2010.

16
2.7 Government and industry targets
In June 2000, the HSC issued a 10 year health and safety improvement strategy statement
called „Revitalising Health and Safety‟ which is aimed at introducing fresh drive into health
and safety programme. Wils and Nelson (2007) state some national targets from this
document are stated below:
To reduce the number of work days lost per 100,00 workers due to ill health or work
related injury by 30% by 2010
To reduce incident rate of work related ill health by 20%
To reduce incidence rate of fatal and major injury accidents by 10% by 2010
7(2005) believe that these national targets motivated the UK offshore industry to set higher
targets for development:
A 50% reduction in fatal and major accidents by 2010 with a year on year
improvement in safety
Similar to national target, a 30% reduction in the rate of working days lost per 100,000
workers due to work related injury and ill health
In relation to the targets, the actual industry performance is shown below:
Figure 2 Combined fatal and major injury rate. Source: HSE (2010)

17
The graph above illustrates the combined fatal and major injury rate per 100,000 workers. A
downward trend can be seen with a peak in 1998 with 340 per 100,000 workers. While in
2009, the lowest value with 100 per 100,000 workers. Even when looking at the less serious
injuries such as the “over 3 day injury rates”, the data shows a similar trend. This is shown
below:
Figure 3 Over 3 day injury rate. Source: HSE (2010)
The graph above represents over 3 day injury rate per 100,000 workers. Clearly, there is also
a downward trend with its lowest value of 400 per 100,000 workers in 2009/10. This
downward trend could be a result from the safety case implementation in 1992 however this
dissertation focuses on the impact of the modified safety case regime in 2005.
This chapter has given a background to the UK oil and gas industry, discussed the importance
of safety in the industry and how safety case regime was created to improve the safety
practice. The next chapter of the dissertation focuses on a critical review of existing
literature about the economics of safety as this will help to explain the nature of the
relationship between safety regulation and safety from an economic perspective.

18
CHAPTER 3
3 Economics of safety
Accidents in the offshore oil and gas industry are matters of health, however much related to
economics as they stem work which is an economic activity. According to Dorman (2000a),
these accidents are related to economics as they stem from work and work is an economic
activity. Literature on this topic often begin by citing the National Safety Council statistics
that more than 14,000 people are killed and over two million workers are injured each year
(Oi, 1974). Also, the UK has an average of 274,000 workplace accidents every year
(Nampoothiri, 2011). In relation to the offshore oil and gas industry, the Health and Safety
Executive (2011) reported in the Offshore Injury, Ill health and Incident statistics 2010 that
major injury rate per 100,000 workers was 188.0 which is an increase from 2009‟s figure of
2006 and this is the highest record since 2006. Legislative actions of the Health and Safety
Executive (HSE) have intended to improve safety and reduce the occurrence of accidents in
the offshore oil and gas industry. According to Oi (1974), reducing injury and accidents has
great significance for economic efficiency to the economy, firm and society hence an
economic perspective is important.
Examining the economics of safety is important to give an economic evaluation of the
relationship between safety and safety regulation in the oil and gas industry. This chapter will
use economic literature to explain the need for safety regulation and why this safety
regulation might not work in an economy. Firstly, this chapter explains optimal safety as this
is what the oil and gas industry aims to achieve. Then a discussion of the economic costs of
safety to individuals, firms and society will be analysed as it is clear there are not only
benefits to safety, but huge costs involved if not made a priority. As firms are faced with the
least economic costs which will be explained in due course, it shows the disincentive for firm
to invest in safety hence a market failure. The next section will then explain how firms
actually value human life and safety. This market failure shows the great need for safety
regulations. However, as firms have private information (asymmetry of information) which is
not being disclosed to government, it could lead to the regulations not working. The next part
will explain this asymmetry information and how it affects the oil and gas industry.

19
3.1 Optimal policy for safety
As optimal safety is when the cost of providing safety is equal to benefit of having safety.
However due to market failure, government intervention is required to provide an optimal
policy. A study by Swierzbinski (1993) developed a model for pollution control which is the
optimal tax policy. His assumptions included:
- The regulator facing asymmetry of information about firms costs (moral hazard)
- Limited penalty for non-cooperation
- High cost of monitoring firms emission
Swierzbinski agrees with Solow (1971) and Bohm (1981) models that the optimal regulation
is similar to a deposit refund system. His optimal models are below:
OPTIMAL REBATE
OPTIMAL UP-FRONT TAX
Where, K = types of firms, = firm‟s actual output level, = largest fine that regulator can
give to a firm that has been monitored producing , =largest rebate the regulator can
give firm producing , = reservation costs (social costs associated with quitting).
Swierzbinski (1993) said that any combination that satisfies both equations above is an
optimal tax/rebate policy for regulating the type K firm. He also states that this deposit –
refund system is very efficient as it encourage firm to monitor its own emissions (I a
verifiable way) more cheaply that the outside regulator. It can also encourage the firms to pay
for their own monitoring activities. Although this deposit-refund system looks appealing, care
needs to be taken as the optimal regulation depends on the details of how enforcement is
limited or what the rights of the polluters are. Hence, when designing the deposit refund
system, every detail is important as to have an effective system.
So far, it can be seen that an optimal policy is required to prevent market failure. This optimal
safety is required to prevent several economic costs which many stakeholders in the oil and
gas industry could face. The next part explains the economic costs to individuals
(employees), the firm (Oil Company) and the society (host country).

20
3.2 Economic Costs
3.2.1 Economic costs to employees
Workers and their communities are faced with occupational injuries and diseases globally.
According to Boden et al (2001), these injuries and diseases not only affect the workers
themselves, but also have an effect on the individuals‟ families, employees and the
community. This is because the injury or disease becomes part of an individual‟s identity;
hence it affects their family duties, leisure activities, career pursuit including their earnings
which in turn has an effect on productivity, competitiveness and other economic costs.
Brooks and Hwong (2006) define economic costs as costs which have monetary value and are
benefits lost which are subjective from the point of view of a decision maker. However,
Dorman (2000a) argues that the most significant cost to workers and those who care about
them are non economic costs. These are costs that have no monetary value as it is difficult to
calculate human emotions that come about when a life is loss or impaired. Hence in this
case, it can also be referred to as „human costs‟ of ill health or premature death in this case.
Nonetheless, economics can still make contributions of these human costs as it will be used in
this chapter to identify the groups at highest risk and explain why. More so, economics will
shed light on the economic costs of Occupational Safety and Health focusing on their
amounts, who bears the burden and explain why again.
3.2.1.1 Groups at risk
According to an article wrote by Nampoothiri (2011), statistics from HSE found that the five
most dangerous occupations hence more prone to accidents are:
1) Fishermen or Merchant Seafarer
2) Bomb disposal or Mine clearer agent
3) Oil and gas riggers
4) Construction workers
5) Lorry drivers
Nampoothiri (2011) stated that Fishermen or Merchant Seafarers are the most dangerous jobs
as workers in this career are 50 times more likely to die at work than any other occupation.
Bomb disposal or Mine clearer agents do not come as a shock as they deal with explosives.
Oil and gas riggers been in the top five is quite an interesting finding as this dissertation is
focused on safety in the oil and gas industry.

21
The oil and gas industry has been faced with major oil and gas rig explosion which the
biggest being the Piper Alpha disaster that took 168 lives. In addition, the industry is faced
with terrorism. Construction industry is another dangerous industry to work for it accounts
for 30% of all workplace deaths in the UK between 2003 and 2008. For lorry drivers, 150
accidents occur in the UK every year which makes it a less easy job.
3.2.1.2 The Burden of Economic costs
Dorman (2000a) explains the two major economic costs of early death or disability to
individuals, these are:
Workers lost/reduced wages: A study carried it out Haveman and Wolfe (1990) discovered
that in developing countries, the gross income ratio for disabled workers with less education
is about one third the earnings compared to the non-disabled workers. In addition, Dorman
(2000a) research found that in the United States, disabled workers rate of participation is
about two third of non disabled workers with only half in full time jobs. Hence it can be seen
that disability has a major role in economic outcomes as there is diminished productivity of a
disabled worker. However due to the Americans with Disability Act, this wage gap is now
illegal but the law is difficult to make obligatory (Baldwin and Johnson, 1994).
Cost of medical treatment: This is the cost of treatment or care during the time the worker
is disabled. Developed countries are easier to measure the economic costs because of good
health insurance systems put in place but not that some costs could be difficult to measure.
For example, Dorman (2000a) found that one in six disabled workers require a family
member to take care of them and also two fifth required further assistance from their relative
to perform their house hold chores for them.
3.2.2 The Economic cost to Firm
Regardless of the firm size, safety is critical to its success. Healtey (2011) from the Hartford
Steam Boiler Inspection and Insurance Company stated that no matter how complicated or
automated the technology within the firm is, it is the workers that control and maintain it.
Hence, a business can have great financial difficulty and run into losses if safety of
employees is ignored. An article by ARI Integrated Workplace Solutions (2007) stated that
businesses in the United States spend $170 billion a year on direct and indirect costs related
to occupational injuries and illnesses which are taken directly from company profits. This
expenditure is quite crucial as it could lead to bankruptcy of the firm.

22
Concerning the United Kingdom, Nuneaton & Bedworth Borough Council (2002) stated that
HSE carried out a research which shed some light on the practical and financial consequences
for firms of accidents at work. One of the firms used in the research had a cost which totalled
37% of annual profits while another firm had losses accounting to 5% of running costs. In the
study by HSE, the costs were split into insured and uninsured costs and an average for both
costs for the firms are shown below:
Figure 4 Average costs for businesses from accidents at work. Source: nuneatonandbedworth.gov.uk
A study by Pathak (2008) from HSE also found the costs of injury and ill health to employers
in 2005/06. This is shown below:
Figure 5 Costs to employers of workplace injuries and work-related ill health in 2005/06. Source: Pathak
(2008)

23
In component form as in what comprises these costs to employers is shown below:
Table 1 Costs to employers, by component cost. Source: Pathak (2008)
In relation to size of the firm, both Dorman (2000a) and the Nuneaton & Bedworth Borough
Council (2002) agreed that workplace accidents are unfortunately more frequent in small to
medium sized firms rather than large firms. Statistical evidence from HSE in a Nuneaton &
Bedworth Borough Council article confirmed this statement which is shown below:
Figure 6 A comparison of major injury rates and size of establishment. Source:
nuneatonandbedworth.gov.uk

24
From the figure above, it can be seen that the larger the size of establishment (using
employees as a guide), the lower the number of major accidents hence a negative relationship
between the variables.
So far it can be seen that workplace accidents has an impact on firms. However, in another
article by Dorman (2000b), it was argued that most of the costs related to workplace injuries
are actually external to the firm. Dorman argued that the costs where mostly faced by the
workers, families and their communities which is not reported in profit and loss statements of
the firm. Hence if there is no intervention from the government in place of safety laws and
employers decide what safety and health conditions they will give strictly on the basis of
profit, workplaces will be very dangerous.
The diagram below illustrates this point:
Figure 7 Accident costs, prevention costs and safety levels. Source: Dorman (2000b)
In the figure above, the vertical axis represents both costs and injuries and of preventing them
while the horizontal axis measures the level of safety in the workplace with the level of safety
in the job increasing from left to right. Let us assume C1 is the average cost of an injury
(absorbed by all stakeholders) and it is constant whatever levels of safety, hence a perfect

25
horizontal marginal cost curve. C1 costs include lost work time, burden to family etc while
C2 (the lower cost) is the proportion of costs that is taken only by the employer e.g. hazard
pay, lost work time etc (Dorman, 2000b). Therefore:
C1 – C2 = Cost of externalisation (costs faced by worker, communities etc)
The third curve which is sloping upwards is the cost of eliminating a risk. The upward slope
indicates that as the cost of risk increases (e.g. more preventive methods being implemented)
the job becomes safer. Therefore because of this high costs, firms choose to target S2 rather
than S1 where C1 is the total social cost. This gap between S1 and S2 can be very wide
depending on the effectiveness of health and safety laws in different countries (Dorman,
2000b).
3.2.3 Economic cost to host country
Other than employee or employer, occupational injuries have an effect on the national as a
whole. According to Nuneaton & Bedworth Borough Council (2002), the United States lost
almost half a trillion dollars in workers compensation. In reference to United Kingdom, HSE
(2008) estimated the average cost of illness in 2006 (Q3). This is shown below:
Table 2 UK average cost of illness in 2006. Source: HSE (2008)
Human cost Lost output Resource costs Total
Fatality £991,200 £520,700 £900 £1,500,000
Major injury £18,400 £16,200 £5,800 £40,500
Other reportable injury (O3D) £ 2,700 £2,600 £500 £5,800
Minor injury £200 £100 £50 £350
Average case of ill health £6,700 £2,700 £800 £10,100

26
From an economic perspective, Dorman (2000a, pg 25) says:
“…the total cost to an economy of occupational morbidity and mortality is the sum
of all private economic costs that are also social costs, plus the social costs that are
external to all private parties. Suppose, for instance, that an injury to a worker
results in lost output. If the worker is paid during the period of non-production, this
mitigates the private cost to the worker but increases the cost to the employer. A
loss of production may lead to a loss of profits, which would then be a social as
well as private cost, but the firm might have the ability to raise prices, maintain
profits, and shift the cost to consumers.”
Buhai (2008) states that strangely enough it is the highly developed countries with good
welfare programs that are more susceptible to cost externalization because their programs
shift the risk to taxpayers. A good example would be countries like Denmark with a publicly
funded health care system that bears the costs of accidents. Nevertheless in terms of
aggregate economic costs of occupational injury, Denmark does better than its neighbours
like Norway and Finland. This is shown below:
Figure 8 Estimates of aggregate economic cost of occupational injury and disease (%), by country.
Source: Buhai et al (2008)
27
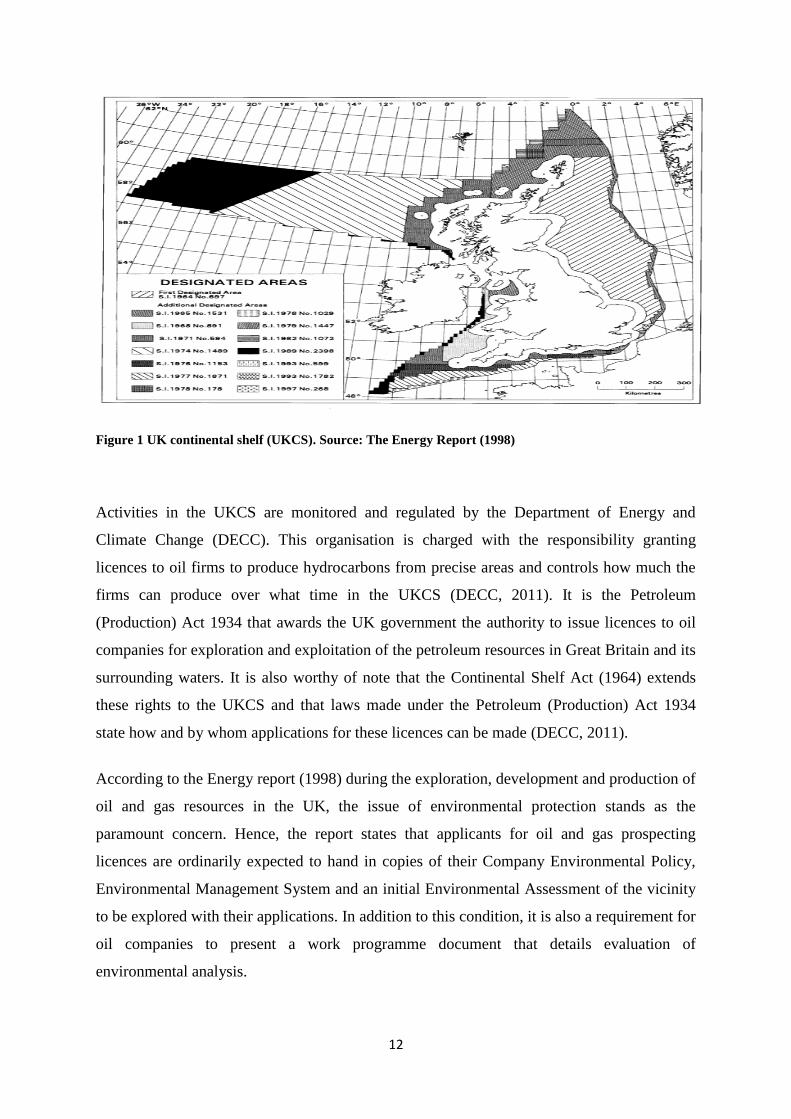
Actually, Pathak (2008) from HSE discovered that “society” bears the biggest burden of costs
(e.g. medical costs, loss of output) and not the employer which has a small fraction. This is
identified below:
Figure 9 Costs to Britain of workplace accidents and work-related ill, 2001/02. Source: Pathak (2008)
From the figure above, it can be seen that employers bear the least costs of occupational
injury hence will have the weakest incentive to improve safety in the workplace. This
externality causes a market failure which is a situation that the allocation of goods and
services is not efficient in a free market (Bator, 1958). Hence, this market failure justifies
why there should be intervention from the government to improve health and safety. Pathak
(2008) believes that recognising these costs help to indicate whether the cost of enforcing a
policy such as the safety case regime would be proportional to the anticipated benefits of
improving occupational safety. Hence the cost estimates show a possible degree for cost
savings.
So far, it can be seen that the least cost is faced by the employer. Hence, it would be of an
advantage if this dissertation can explain how these firms actually value human life and
safety to understand their behaviour.

28
3.3 Value of human life and Safety
As the value placed on improvements in the safety of human life is one of the most puzzling
questions in public investment decision making (Jones-Lee, 1974), it is important to discuss
the economic literature on the value of statistical life. Miller (2000) defines Value of
Statistical Life (VSL) as the amount a group of people will pay for a fatal risk reduction in
the expectation of saving one life. Why should one want to put a monetary value on human
life? Well, according to Jones-Lee (1985) the reason is simply because many public sector
allocative and legislative decisions have a major influence on safety hence can therefore save
lives and avoid injuries. Jones-Lee added that if inadequate resources are to be distributed
economically and unbiased then it is without a doubt important to ensure that all effects,
including those on safety, are clearly well thought-out in the decision making process.
Consequently if the tools of conventional welfare economics are to be used in making
allocative decisions, then money values of safety improvements and costs of deterioration are
clearly required.
Conley (1976) states that for government safety programmes, the benefit per statistical life
saved is the average of the affected population‟s values of human life plus the value of any
externalities. However, in the early years Dublin and Lotka (1930) noted that the benefit cost
analysis that was used was the “human capital” or “gross output” approach. This approach
was used to estimate the costs of deterioration and money values of safety improvements. In
this method, the cost of a worker‟s premature death is defined as the discount present value of
the worker‟s future output foregone due to the death. However for workers whose services
are not in the market (for example a house wife) a “net output” approach is used. Following
this method, the cost of premature death would be gross output minus future consumption
that would have been enjoyed by the victim if the person had survived. However Jones-Lee
(1985) argues that although these methods measure the direct economic impact of premature
death, the gross output method restricts attention to Gross National Product (GNP) hence not
take into account wider human consequences. More so, the net output focuses on only
economic effects on the rest of the society and would also count the death of people past
retirement age as a gain to the society which has made many users of this method
uncomfortable (Jones-Lee, 1985).
Due to the issues with the gross output and net output approach, another method was
suggested which is the “willingness to pay” approach. According to Cook (1978), this

29
approach is more theoretically sound than other approaches and is favoured by economists as
it incorporates the individuals risk preferences. The willingness to pay valuation model is
shown below:
Figure 10 Derivation of the implicit value of a life. Source: Dardis (1980)
In the figure above, income is measured on the horizontal axis while utility is on the vertical
axis. According to the figure above by Dardis (1980), firstly in risk-less state, the person is at
point A where consumption CO has a utility value of U(CO). However, when a hazard is
introduced the certain prospect CO is replaced with uncertain prospect that has income of CO
with probability value of 1-p which death is the probability value of p. As death has no
utility, Hirshleifer et al (1974) states that the expected value of the uncertain prospect would
be:
p(O) + (1-p)UC0
Note that this loss in utility is equivalent to pU(Co) and can also be converted to a monetary
value by taking into account the amount of money needed to compensate the person for the
presence of the hazard. This is given by C0 – C1 which is illustrated in the figure above.
Dardis (1980, pg 2) says
“For small changes in the neighbourhood of A, the compensating variation V(C0-
C1) is equal to pU(C0)/(dU/dC) where p is the probability of death and
U(C0)/(dU/dC) represents the implicit value of a life. Thus, the compensating
variation may be combined with the increase in the probability of death to yield
estimates of the value of a life. Alternatively, the amount of money an individual
is willing to pay for risk reduction may be used to estimate the value of a life.”
30
It is important to know that this method focuses on the rate a person would exchange a
marginal change in safety for marginal change in income. However, if it is a large number of
people who are making similar choices, then the estimation would be in this way Dardis
(1980). An example from Hirshleifer et al (1974): Imagine if there is a decrease in survival
probability of 0.001 and so the 1000 people in the community require $100 for compensation.
This would imply that the estimated value of life is $100, 000 for this community. Due to the
decrease in survival rate with probability of 0.001 in 1000 people, there will be one more
death if hazard is introduced with total compensation of $100,000. However, it does not mean
that any individual would be willing to give up his life for this $100,000.
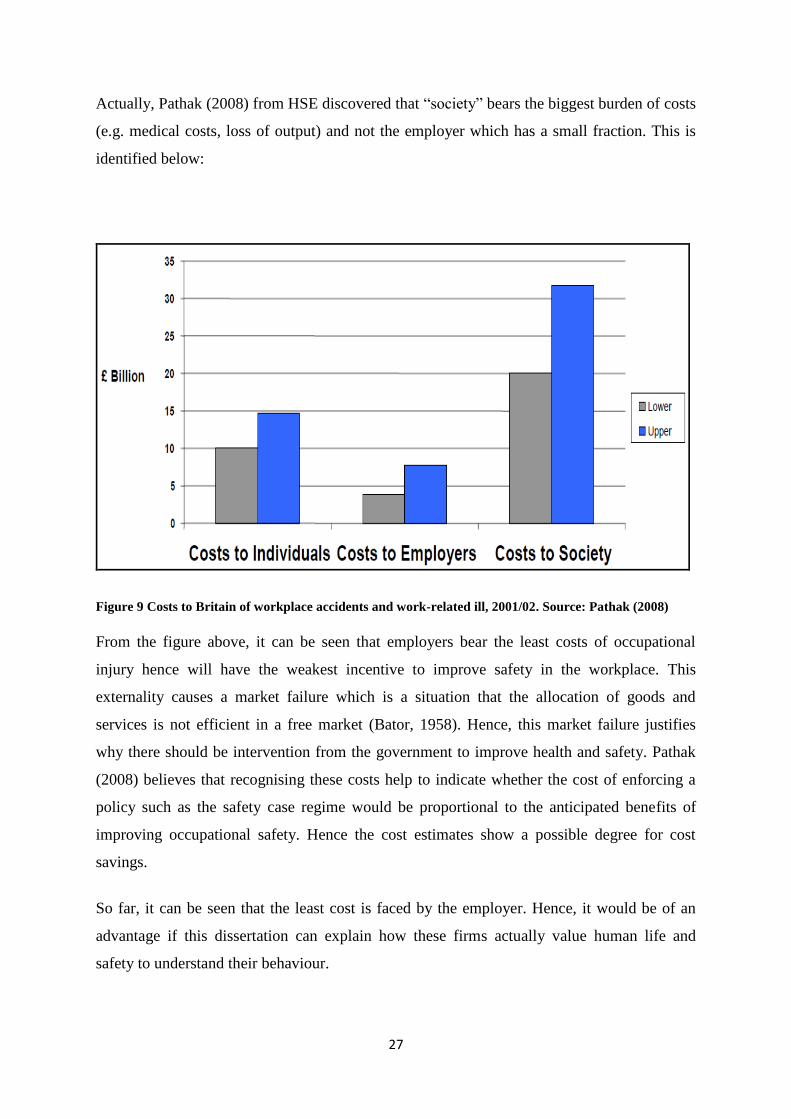
In Miller (2000) research, he estimated values of statistical life in various countries which
uses a log regression on the values to estimate their income elasticity. This regression
equation is shown below:
Where,
VSL – Value of statistical life
Y – Income measure
Z – Vector of explanatory variables
(a,b,c,) – Vector of regression coefficients
His result is shown in the table below with the number of studies averaged and estimated
mean value of a statistical life by country:

31
Table 3 Value of statistical life by country. Source: Miller (2000)
From table above, it can be seen that the value of statistical life varies in different countries.
Miller (2000) believes that this variation is caused due to the differences in cultural beliefs
and in income levels. However within the individual countries, the sensitivity of VSL to
income is different. For example Persson et al (1995) found that Swedish VSL estimates vary
with income elasticity between 0.37 and 0.46 while a study by Viscusi and Aldy (2003) for
United States found that the VSL estimates are roughly linearly with income.
Miller (2000) also identified various studies in different countries and their values of
statistical life, this is shown below:

32
Table 4 Range of statistical life values (in thousands of 1995 us dollars). Source: Miller (2000)
The table above derived the Value of Statistical life from three different classes of
willingness to pay studies:
- Consumer behaviour studies
- Wage-risk studies, which estimate the extra wages paid to induce workers to take
risky jobs
- Contingent valuation surveys that get respondents values directly
Note that the use of contingent valuation of fatal risk reduction could be problematic as it is
difficult to design, field and analyse a reliable contingent survey (Miller, 2000).

33
This section of the dissertation has explained the value of a statistical life and safety to firms
as they face the least economic costs hence a market failure. This market failure leads to the
need for safety regulations by regulators however firms hold private information (asymmetry
of information) which could be why these regulations do not work. The next part of this
chapter explains information asymmetry and how it affects the oil and gas industry.
3.4 Information Asymmetry
This section of the dissertation discusses the effect of information asymmetry on safety in the
oil and gas industry. Firstly, a discussion of asymmetry information literature will be
reviewed, then how it can be related to safety in the oil and gas industry.
Many economists like George Akerlof, Michael Spence and Joseph Stiglitz have contributed
to the theory of incentives under information asymmetry as it is faced by most industries
including the oil and gas industry. Information asymmetry deals with the study of decisions
in contracts where one party has more or superior information than the other party. As
knowledge is power, this causes unevenness in control in transactions which can lead to the
transactions to go awry. Lofgren (2002) and Fehr and Schmidt (2000) agree that asymmetric
information is very common in market interactions. For example the seller of a good often
has better information about the quality of its good than the buyer, or a job applicant has
better knowledge about his/her skills than the potential employer, or even the buyer of an
insurance policy is more knowledgeable about his/her individual risk than the insurance
company.
The two major setbacks with information asymmetry are:
- Adverse selection
- Moral hazard
Adverse selection: A classic paper on adverse selection is George Akerlof's paper on “The
Market for Lemons”. Akerlof (1970) verified the troubles that occur in health insurance
markets when an applicant for insurance has complete information about his/her physical
condition, while insurers have no such information. Akerlof uses the example of an insurer
who is unable to differentiate between high-risk and low-risk insurance applicants, hence
values contracts at an average premium for all applicants. This leads to only those individuals
whose risk is above average to buy the insurance. Hence resulting in losses for the insurer
and, consequently, premiums would have to be raised for the insurer to break even at least.
Of the group which purchased insurance in the first place, only the worse-than-average risks

34
would purchase insurance again at the higher premium. Premiums would again need to be
raised to cover losses and, eventually, only the very high-risk individuals would purchase
insurance at extremely high premiums and the entire market for insurance would collapse
(Akerlof, 1970).
Moral hazard: In economics, the term “Moral Hazard” has been defined by many authors.
McTaggart et al (1992, pg 440) states “Moral hazard arises when individuals, in possession of
private information, take actions which adversely affect the probability of bad outcomes."
Similarly, Katz & Rosen (1994) defines moral hazard as a situation of hidden actions where
the party with the information may take the wrong decision. The key points from the
definition of moral hazards are that there is presence of hidden action (e.g. insurer unable to
observe the action of the insured) and that the institution or person whose actions are hidden
will increase the probability of a „bad‟ outcome (Varian, 1990).
3.4.1 Why does Moral Hazard occur?
As already stated, moral hazard is a problem of hidden action. As a firm or an individual is
faced with a cost of taking precautions against a loss, if the firm or individual has full
insurance, they have no incentive to incur the cost of taking care as the insurance will cover
the loss anyway. An example from Gravelle & Rees (1993) about Moral hazard and
insurance contract will be used to illustrate why moral hazard occurs. The diagram for the
insurance market is shown below:

35
Table 5 The insurance market. Source: Gravelle & Rees (1993)
Figure above is a representation of the market for insurance. In this model by Gravelle &
Rees (1993), let‟s assume that there are no transaction costs and insurance is provided by risk
neutral and competitive insurers. Also it is to be assumed that the probability (of loss (L) is
endogenous and depends on the level of expenditure on care a1, a0, where a1 > a0. Hence if we
set a0 = 0, now probability of loss when a = 0 is and a = a1 by Note that for a1 care to
be spent rather than a0 care, then:
(L > a1 or L + a1 < L
Under perfect information or no hidden action, the insured with definitely spend a1 on care as
he/she will be on a higher indifference curve I' then if they choose a0 which is clearly lower
(I0). However when there is moral hazard due to information asymmetry, the insurer would
not be able to observe the level of care being taken by the insured. If the insurer assumes that
the insured chooses a1 level of care, the insurer will still choose to offer the insurance on the
break-even budget line B1However, as the insured can choose their level of care, they
would have an incentive to choose a0 level of care because they will be at point A'1 which has
a higher indifference curve than the perfect information situation. This situation is clearly
unfavourable to the insurer as will make a loss with expected payments exceeding the
expected premiums (L > L). Hence moral hazard exists (Gravelle & Rees, 1993).

36
3.4.2 Moral hazard on safety in the oil and gas industry
So how does moral hazard due to information asymmetry affect safety in the oil and gas
industry? Well, according to Laffont (1994) a large class of major environmental risks
causing occupational accidents are because of major moral hazard problems. For example it
was due to lack of care that caused the disconnection of safety securities for routine work
which led to the Tchernobyl catastrophe or the futile desires of the crew which caused the
Shetland disaster. In relation to the oil and gas industry, the lack of care of a captain which
sent the Exxon Valdez to the shore spilling 260,000 to 750,000 barrels of crude oil or more
recently in 2010 the BP oil spill in the Gulf of Mexico (Guardian, 2011). This lack of care of
firms and their employees, show the importance of an effective regulative system. These
regulatory systems are especially important as every day, the society is becoming more
complex and many more economic agents are carrying tasks which create large hazards to the
society and also to the firm‟s employees.
The problem of moral hazard can also be seen through the interaction between the firm and a
worker as both parties can influence the probability of an accident. Oi (1974) and Rea (1981)
both agree that workers are lacking information on safety levels common in other firms. For
example, policies like mandatory insurance (workers compensation) and safety regulations
need to be closely examined. Diamond (1977) explains that the workers compensation is
required as it raises the expected utility of risk averse workers while the implementation of
safety standards is needed to enhance safety in the firm which can be suboptimal if workers
underestimate risk. However Carmichael (1986) disagrees with Diamond‟s notion that
workers underestimate risk. Carmichael states that what actually happens is that it takes time
for workers to learn about the changes in the level of safety in the workplace which usually
leads to under-provision of safety. In addition, Carmichael‟s model agrees with Oi (1974) and
Rea (1981) that government intervention with safety laws and an increase in workers
compensation definitely improves the level of safety in the workplace.
From firms‟ point of view, the increase in workers compensation or activities for safety
improvement will increase the firms‟ costs. As every profit making firm‟s objective is to
maximise profit, an increase in firms cost is not favourable to the firm. However, as this
dissertation has identified previously that the firm bears the least costs of occupational injury
hence they have the weakest incentive to improve safety in the workplace. Due to these
incentives, firm can have hidden actions (moral hazard) which cannot be observed by other
37
stakeholders of the firm. Hence, there is a strong need for the government to monitor firms‟
level of safety.
Across the world, governments have various ways of regulating firms‟ level of safety to
protect the society. For example, Swierzbinski (1993) believes that emission fees are crucial
for regulating pollution in many European countries as they reduce pollution. Russell (1990)
argue that endorsing this pollution control legislation is only the first step, that there is a need
for supervising and enforcement to make sure that firms invest in the suitable pollution
control technology and the firms operate them correctly. Magat and Viscusi (1995) agree
with Russell, as they found in their study that increasing the number of inspections and
monitoring increases firm compliance hence enhancing safety and reducing number of
accidents and pollution.
Although firms agree to “comply”, it is difficult for government to truly monitor the firms‟
level of compliance. Looking at Swierzbinski (1993) study, he found that emission fees in
textbook discussions are meant to provide polluters with the correct incentives to internalize
external costs. However in most European fee system, it is found that the fees have been set
at low levels and polluters‟ payment is based on an estimate rather than the actual amount of
emissions. So as the polluters‟ payments are unrelated to the amount they pollute there is no
incentive to reduce the level of pollution.
This part of the dissertation gives a clear understanding for the need for safety regulations in
the oil and gas industry as firms have a disincentive to invest in safety. However, due to the
private information firms hold, it could result in the regulations being unsuccessful in their
aim to improve safety. This leads to the question of whether safety regulations in the oil and
gas industry improve safety. The next chapter of this dissertation aims to answer this question
by using econometric analysis to examine the relationship between the safety case regime
2005 regulation and safety using hydrocarbon releases as a measure.

38
CHAPTER 4
4 Research Methodology
From the literature review on the economics of safety in chapter three, it states that there is
market failure hence a need for safety regulations. However, the regulators are faced with
information asymmetry as firms have hidden actions (moral hazard) and information. This
leads to the question of whether these safety regulations are effective in the presence of
asymmetry of information. In order to answer this question, an example of a safety regulation
and a measure of safety will be chosen. This chapter will use econometric analysis to
examine the relationship between the safety case regime implemented in 2005 (safety
regulation and the hydrocarbon releases (measure for safety). This analysis is necessary as it
helps to achieve the research aim which is to examine the nature of the relationship between
safety regulations and safety.
This chapter will first describe the data been used for this empirical analysis which will also
identify the main changes between the 1992 safety case regime and the 2005 safety case
regime, then a brief description of the method for data analysis, followed by the econometric
model and finally the results and interpretation.
4.1 Data
This study has gathered quantitative data to identify if safety regulations has actually had an
impact on safety in the oil and gas industry. The specific regulation tested here is the safety
case regime which was implemented in 2005 while data used to represent safety is the
number of hydrocarbon releases in the oil and gas industry. The data for number of
hydrocarbon releases is monthly time series data for the period April 1996 to May 2011
which gives 183 data points, hence can be considered large (full data in appendix 1).The data
for the offshore hydrocarbon releases is divided into minor spills, major spills and significant
spill. Note that data for hydrocarbon releases have been obtained from the Health and Safety
Executive website hence secondary data and that the financial year from HSE is April to
March.

39
As safety case regime was originally implemented in 1992, it is necessary to identify the
differences between the 2005 offshore safety case regime which is to be tested and the 1992
version. A report by HSE (2006) identifies some differences and they are stated in the table
below:
Table 6 Changes between the 1992 and 2005 Offshore Safety Case Regime (OSCR). Source: HSE (2006)
1992 2005
1 Safety case lasted for three years and
must be resubmitted after this period.
Safety case can last for the life of the
installation. However a „thorough review‟
at five-year intervals must be carried out.
2 A combined operations safety case
(COSC) is required before any combined
operation.
The COSC is no longer required. It has
been replaced by a requirement that the
safety case must include a generic
description of the management of the
combined operations.
3 A Design Safety Case (DSC) must be
submitted to HSE before a new fixed
design was completed.
DSC has been replaced by a simpler,
earlier, design notification and does not
need to be approved by HSE but consider
HSE comments.
4 An abandonment safety case (ASC) must
be submitted before decommissioning a
fixed installation
Instead, duty holders are required to revise
the safety case where details of each phase
of the decommissioning process will be
stated and submit it to HSE for acceptance
In addition, there are also some new regulations in the 2005 Offshore Safety Case Regime
which were not in the 1992 version such as the workforce consultation and a clear definition
of installation operator (HSE, 2006). Identifying the differences between 1992 and 2005
safety case regime is important to identify whether these changes in 2005 had any impact on
safety as it is the 2005 regime being tested in this dissertation. The next section of this
chapter will give a brief description of the method for the data analysis.

40
4.2 Method for data analysis
Several statistical data analysis tools can be used however this dissertation will utilise the
regression analysis. This is based on the fact this study is trying to find the relationship
between the safety case regime in 2005 and safety. Hence, the regression analysis will be
performed to show the effect of the safety case regime looking at hydrocarbon releases before
and after 2005. The statistical software used to carry out this regression is called Eviews.
The Ordinary Least Squares (OLS) regression model and the Poisson count regression model
are employed for the empirical analysis. The Ordinary Least Squares (OLS) model is used as
it provides the Best Linear Unbiased Estimate (Brooks, 2002). Poisson count regression
model was used because sometimes count data can be incorrectly analysed using Ordinary
Least Squares regression model (UCLA statistical consulting group, 2007). According to
Larget (2007), Poisson distribution can be useful for variables that are small integers
including zero. As the data sample has a lot of small integers, it would be very relevant to use
this Poisson regression model. The next section of this chapter will identify the econometric
model being tested and a description of the variables involved.
4.3 Econometric Model
The regression equation for this analysis is stated below:
Yt = α + β1St + β2q1 + β3q
2 + β4q
3 + Ytimet + µ
Table 7 Econometric model descriptions
Symbol Interpretation
Yt Number of major/ minor/ significant
hydrocarbon releases
St Offshore Safety Case Regime 2005 (St=1
for 2005+ while St=0 otherwise)
q1
Quarter 1 (Jan, Feb, Mar)
q2 Quarter 2 (Apr, May, Jun)
q3 Quarter 2 (Jul, Aug, Sept)
Ytimet Time/Period
µ Error term

41
4.3.1 Tests
As hydrocarbon releases are split into three groups, this empirical study will carry out the
following three tests below:
- Relationship between major hydrocarbon releases and safety case regime 2005
- Relationship between minor hydrocarbon releases and safety case regime 2005
- Relationship between significant hydrocarbon releases and safety case regime 2005
4.3.2 Hypothesis Testing
As the major aim for this dissertation is to explore the relationship between safety and safety
regulations, these variables will be focused on while other variables are just present for
controlling factors which could affect safety.
The null hypothesis H0: St = 0
The alternative hypothesis H1: St < 0
The null hypothesis implies that there is no significant relationship between hydrocarbon
releases and Offshore Safety Case Regime 2005. On the other hand, the alternative
hypothesis implies that there is a negative relationship between hydrocarbon releases and
Offshore Safety Case Regime 2005. The alternative hypothesis is expected as the literature
review in chapter three indicates that an increase in safety regulation improves safety which
in this case would mean a reduction in hydrocarbon releases.
The next section of this chapter shows the results from the regression analysis for this
econometric model.

42
4.4 Results and Interpretation
0
4
8
12
16
20
24
28
96 97 98 99 00 01 02 03 04 05 06 07 08 09 10 11
MAJOR MINOR SIGNIFICANT
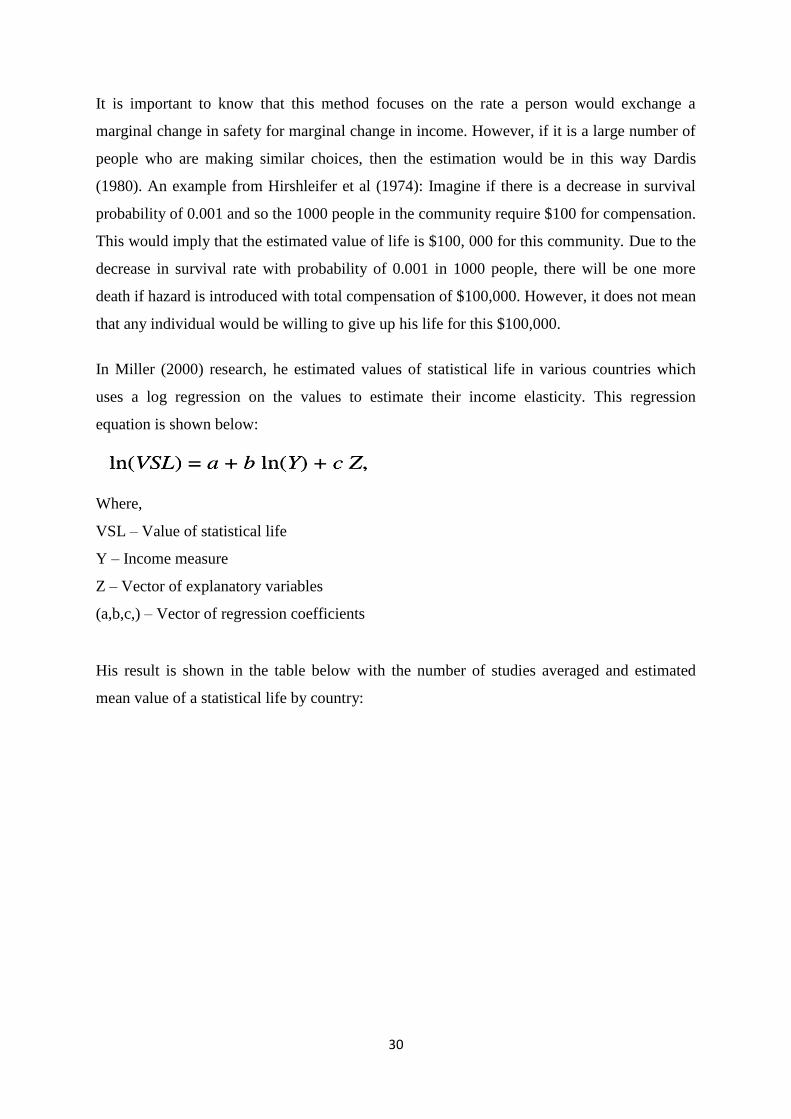
Figure 11 Major, minor and significant hydrocarbon releases. Source: HSE (2006)
This graph above represents the trend of major, minor and significant hydrocarbon or oil
spills from 1996 to 2011. It can be seen that the amongst the three types of oil spills, minor
oil spills is the most significant and it peaked in June 2004 with 26 occurrences. After 2005,
it appears significant oil spills dropped over time while major hydrocarbon releases decreased
in 2005 and remained steady until end of 2010. In relation to minor oil spills, it appears to be
slightly decreasing with a low in 2011. The EViews results in test 1, 2 and 3 below will
identify if the decreases in hydrocarbon releases actually happened due to the Offshore Safety
Case Regime 2005.
As there where three tests identified in the previous section, the results of these tests are
shown below identifying the results of the OLS regression models and the Poisson count
regression models:

43
4.4.1 Test 1: Relationship between major hydrocarbon releases and OSCR 2005
Table 8 Major hydrocarbon releases: summary statistics
Variable OLS result Poisson Count result
Trend -0.009371 -0.013918
-4.087636 -4.041068
0.0001 0.0001
OSCR 2005 0.341264 0.362384
1.399092 0.899191
0.1635 0.3686
Quarter 1 0.049805 0.107274
0.280939 0.370882
0.7791 0.7107
Quarter 2 0.142884 0.234446
0.814847 0.855611
0.4163 0.3922
Quarter 3 0.194111 0.319259
1.096208 1.174508
0.2745 0.2402
Intercept 1.236693 0.296537
6.665236 1.138735
0.0000 0.2548
For results; 1st row: Coefficient, 2nd row: T-statistic/Z-Statistic, 3rd row: Probability values
Table 9 Additional summary statistics
OLS result Poisson Count result
R-squared 0.167027 0.194614
F-statistic 7.058287 -
Durbin-Watson stat 1.793605 -
4.4.1.1 Interpretation
The results for both the OLS and Poisson regression models are very similar. As probability
value is 0.0001 for TREND, statistical evidence suggests that we reject the null so therefore
there is evidence of a relationship between TREND and major oil spills. However as the
probability values for the regulation and quarters of the year are greater than 0.1 or 10%
significance level, it implies that we cannot reject the null which says there is no relationship
between major hydrocarbon releases and OSCR 2005 or quarters of the year. The only
difference between the OLS and Poisson regression results is for intercept. For OLS, we
reject the null for intercept while for Poisson regression; the null cannot be rejected for
intercept.

44
4.4.2 Test 2: Relationship between minor hydrocarbon releases and OSCR 2005
Table 10 Minor hydrocarbon releases: summary statistics
Variable OLS result Poisson Count result
Trend 0.056995 0.005882
5.005560 6.667944
0.0000 0.0000
OSCR 2005 -6.261938 -0.641717
-5.168589 -6.949317
0.0000 0.0000
Quarter 1 0.513144 0.055747
0.582755 0.796490
0.5608 0.4257
Quarter 2 1.377560 0.144139
1.581652 2.125100
0.1155 0.0336
Quarter 3 1.193207 0.125480
1.356647 1.829436
0.1766 0.0673
Intercept 6.239020 1.895666
6.769830 25.11775
0.0000 0.0000
For results; 1st row: Coefficient, 2
nd row: T-statistic/Z-Statistic, 3
rd row: Probability values
Table 11 Additional summary statistics
OLS result Poisson Count result
R-squared 0.147106 0.163772
F-statistic 6.071260 -
Durbin-Watson stat 1.535350 -
Interpretation
Once again, both OLS and Poisson count regression results are similar. Statistical evidence
suggests that we reject the null for the Trend, OSCR 2005 and Intercept as there probability
values are below 0.01 or 1% significance level. This implies that there is evidence of a
relationship between minor hydrocarbon releases and Trend or OSCR 2005 or intercept.
However as the probability values for the quarters of the year are greater than 0.1 or 10%
significance level, it implies that we cannot reject the null which says there is no relationship
between minor hydrocarbon releases and quarters of the year.

45
4.4.3 Test 2: Relationship between significant hydrocarbon releases and OSCR 2005
Table 12 Significant hydrocarbon releases: summary statistics
Variable OLS result Poisson Count result
Trend -0.041731 -0.005025
-5.068814 -5.278710
0.0000 0.0000
OSCR 2005 0.194223 -0.024273
0.221715 -0.229825
0.8248 0.8182
Quarter 1 -0.576644 -0.071962
-0.905703 -0.950203
0.3663 0.3420
Quarter 2 -0.389303 -0.050504
-0.618187 -0.682713
0.5373 0.4948
Quarter 3 -0.347415 -0.042777
-0.546300 -0.574227
0.5856 0.5658
Intercept 11.89489 2.531660
17.85063 34.53665
0.0000 0.0000
For results; 1st row: Coefficient, 2
nd row: T-statistic/Z-Statistic, 3
rd row: Probability values
Table 13 Additional summary statistics
OLS result Poisson Count result
R-squared 0.339141 0.349437
F-statistic 18.06401 -
Durbin-Watson stat 2.122183 -
Interpretation
As expected, the results are similar. Statistical evidence suggests that we reject the null for
the Trend and Intercept as their probability values are below 0.01 or 1% significance level.
This implies that there is a relationship between significant oil spills and TREND or
intercept. As the probability values for the quarters of the year and OSCR 2005 are greater
than 0.1 or 10% significance level, it means that the null cannot be rejected which implies
there is no relationship between significant oil spills and safety regime or quarters of the year.
46
CHAPTER 5
5 Conclusion
This dissertation has examined existing literatures on economics of safety and an empirical
study was carried out to explore the nature of relationship between safety and safety
regulation. Hence, a regression was executed to identify whether the change in safety case
regime in 2005 had an impact on safety.
From literature, it was found that workers and their communities are faced with occupational
injuries. These workers are faced with a reduction in wages and cost of medical treatment. In
relation to the groups at risk, oil riggers fall under the top five risky occupations. Firms also
have costs which could run up to billions of pounds however the society is faced with the
higher cost. As firms have the lower cost, there is no incentive to improve safety, and this can
lead to market failure. Hence, there is a strong need for government intervention through
safety regulations to improve safety; however, the regulators are faced with information
asymmetry particularly moral hazard.
This led to the question of whether these safety regulations are effective in the presence of
moral hazard as it is imperfect market. The empirical analysis carried out in chapter four
aimed to find the relationship between safety and safety regulations. The Offshore Safety
Case Regime (OSCR) 2005 was the variable for the safety regulation while hydrocarbon
releases was used as a measure of safety. The regression captured the impact of the change in
safety case regime in 2005 to safety. The regression analysis using OLS and Poisson
regression models found that OSCR 2005 had reduced the number of minor oil spills
however did not have an effect on the number of major and significant hydrocarbon releases.
A possible explanation to why only minor releases reduced is that the OSCR05 regulations
might have been focused on minor releases after the peak of 26 occurrences in June 2004
shown in figure 11. However, it was difficult finding out exactly what regulations in the
OSCR05 caused only minor hydrocarbon releases to reduce but these results might be
significant to HSE as they can focus on new regulations to reduce significant and major
hydrocarbon releases hence improving overall safety.

47
Note that this empirical study is faced with limitations as the data is small hence could affect
the accuracy of the result. Also other factors such as changes in the industry or infrastructure
have not been observed could have had an effect on safety. Further study can be carried out
on this dissertation to find the particular regulatory requirement in the OSCR 2005
regulations that could have affected the minor oil spills. Also a research with an increased
data sample can lead to more accurate results.

48
6 Appendix
Appendix 1
Year ALL OFFSHORE HYDROCARBON
RELEASES
Dummy variable
Minor Significant Major Total
Apr-96 14 10 1 25 0
May-96 6 9 1 16 0
Jun-96 7 9 3 19 0
Jul-96 9 7 5 21 0
Aug-96 4 12 2 18 0
Sep-96 6 10 0 16 0
Oct-96 3 12 1 16 0
Nov-96 3 13 0 16 0
Dec-96 7 6 5 18 0
Jan-97 5 17 1 23 0
Feb-97 10 10 0 20 0
Mar-97 4 14 0 18 0
Apr-97 8 22 2 32 0
May-97 6 9 0 15 0
Jun-97 4 17 0 21 0
Jul-97 4 9 0 13 0
Aug-97 8 12 2 22 0
Sep-97 5 12 1 18 0
Oct-97 5 8 0 13 0
Nov-97 3 9 0 12 0
Dec-97 5 13 0 18 0
Jan-98 3 7 3 13 0
Feb-98 9 12 2 23 0
Mar-98 6 10 3 19 0
Apr-98 4 13 2 19 0
May-98 14 9 1 24 0
Jun-98 8 13 4 25 0
Jul-98 7 5 1 13 0
Aug-98 10 9 0 19 0
Sep-98 8 15 0 23 0
Oct-98 5 13 1 19 0
Nov-98 6 10 1 17 0
Dec-98 3 9 2 14 0
Jan-99 8 12 2 22 0
Feb-99 6 13 1 20 0
Mar-99 6 12 0 18 0
Apr-99 8 10 3 21 0

49
May-99 11 16 1 28 0
Jun-99 6 13 2 21 0
Jul-99 8 6 2 16 0
Aug-99 7 11 1 19 0
Sep-99 8 9 0 17 0
Oct-99 10 9 0 19 0
Nov-99 3 11 1 15 0
Dec-99 10 9 0 19 0
Jan-00 6 12 2 20 0
Feb-00 9 8 0 17 0
Mar-00 9 13 0 22 0
Apr-00 10 7 2 19 0
May-00 7 11 1 19 0
Jun-00 9 12 1 22 0
Jul-00 14 13 0 27 0
Aug-00 6 7 1 14 0
Sep-00 17 12 0 29 0
Oct-00 20 11 1 32 0
Nov-00 13 15 0 28 0
Dec-00 7 7 1 15 0
Jan-01 19 6 0 25 0
Feb-01 12 7 1 20 0
Mar-01 11 9 0 20 0
Apr-01 7 11 1 19 0
May-01 13 9 1 23 0
Jun-01 12 8 0 20 0
Jul-01 10 14 1 25 0
Aug-01 12 8 0 20 0
Sep-01 10 6 0 16 0
Oct-01 11 13 0 24 0
Nov-01 9 9 0 18 0
Dec-01 12 8 1 21 0
Jan-02 6 12 0 18 0
Feb-02 14 7 0 21 0
Mar-02 12 4 0 16 0
Apr-02 9 4 0 13 0
May-02 10 2 0 12 0
Jun-02 11 12 0 23 0
Jul-02 13 6 2 21 0
Aug-02 13 7 2 22 0
Sep-02 17 10 1 28 0
Oct-02 23 8 0 31 0
Nov-02 14 9 1 24 0
Dec-02 10 3 0 13 0
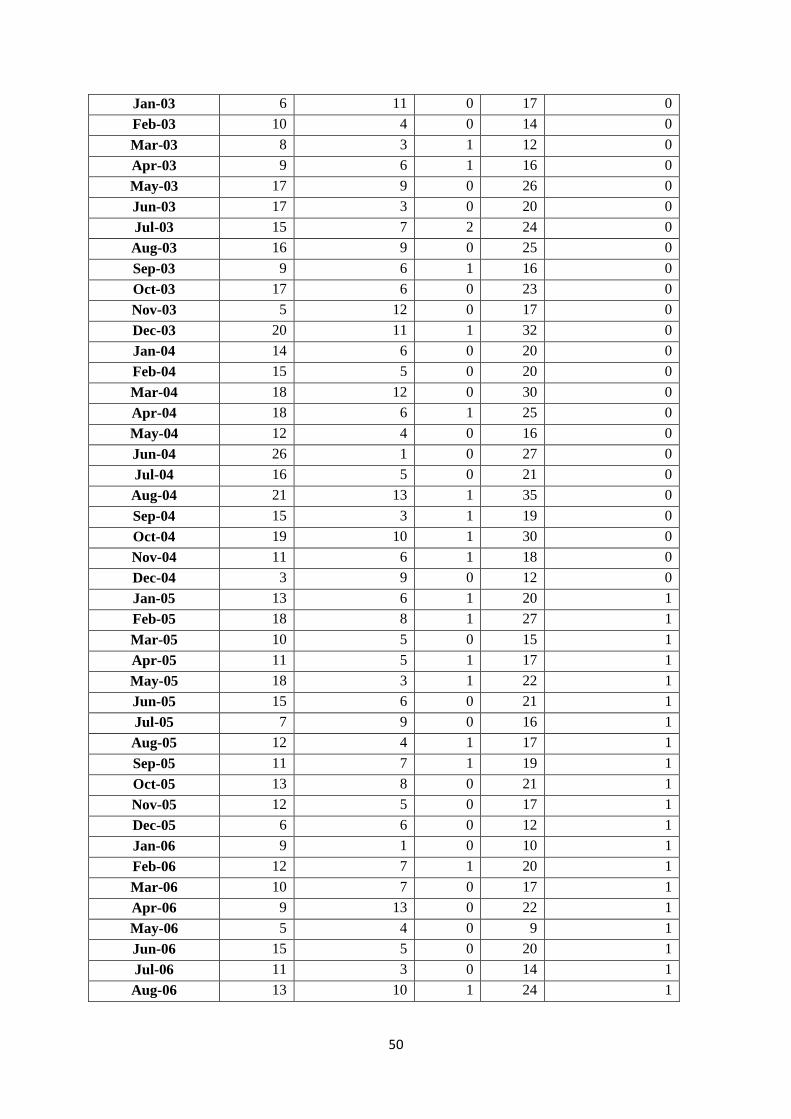
50
Jan-03 6 11 0 17 0
Feb-03 10 4 0 14 0
Mar-03 8 3 1 12 0
Apr-03 9 6 1 16 0
May-03 17 9 0 26 0
Jun-03 17 3 0 20 0
Jul-03 15 7 2 24 0
Aug-03 16 9 0 25 0
Sep-03 9 6 1 16 0
Oct-03 17 6 0 23 0
Nov-03 5 12 0 17 0
Dec-03 20 11 1 32 0
Jan-04 14 6 0 20 0
Feb-04 15 5 0 20 0
Mar-04 18 12 0 30 0
Apr-04 18 6 1 25 0
May-04 12 4 0 16 0
Jun-04 26 1 0 27 0
Jul-04 16 5 0 21 0
Aug-04 21 13 1 35 0
Sep-04 15 3 1 19 0
Oct-04 19 10 1 30 0
Nov-04 11 6 1 18 0
Dec-04 3 9 0 12 0
Jan-05 13 6 1 20 1
Feb-05 18 8 1 27 1
Mar-05 10 5 0 15 1
Apr-05 11 5 1 17 1
May-05 18 3 1 22 1
Jun-05 15 6 0 21 1
Jul-05 7 9 0 16 1
Aug-05 12 4 1 17 1
Sep-05 11 7 1 19 1
Oct-05 13 8 0 21 1
Nov-05 12 5 0 17 1
Dec-05 6 6 0 12 1
Jan-06 9 1 0 10 1
Feb-06 12 7 1 20 1
Mar-06 10 7 0 17 1
Apr-06 9 13 0 22 1
May-06 5 4 0 9 1
Jun-06 15 5 0 20 1
Jul-06 11 3 0 14 1
Aug-06 13 10 1 24 1

51
Sep-06 9 2 1 12 1
Oct-06 8 7 0 15 1
Nov-06 7 10 0 17 1
Dec-06 5 4 1 10 1
Jan-07 4 2 1 7 1
Feb-07 3 7 0 10 1
Mar-07 10 3 0 13 1
Apr-07 10 5 1 16 1
May-07 12 8 0 20 1
Jun-07 15 7 0 22 1
Jul-07 10 10 0 20 1
Aug-07 10 5 0 15 1
Sep-07 8 6 1 15 1
Oct-07 7 5 1 13 1
Nov-07 7 4 0 11 1
Dec-07 13 9 0 22 1
Jan-08 3 3 1 7 1
Feb-08 13 5 0 18 1
Mar-08 6 2 1 9 1
Apr-08 3 7 0 10 1
May-08 11 6 0 17 1
Jun-08 12 2 0 14 1
Jul-08 8 4 0 12 1
Aug-08 6 7 0 13 1
Sep-08 9 6 0 15 1
Oct-08 7 5 0 12 1
Nov-08 10 1 0 11 1
Dec-08 4 4 0 8 1
Jan-09 5 11 0 16 1
Feb-09 10 3 0 13 1
Mar-09 11 4 1 16 1
Apr-09 5 11 0 16 1
May-09 11 4 0 15 1
Jun-09 3 8 0 11 1
Jul-09 13 11 0 24 1
Aug-09 10 6 1 17 1
Sep-09 5 7 0 12 1
Oct-09 12 5 0 17 1
Nov-09 4 6 0 10 1
Dec-09 6 5 1 12 1
Jan-10 14 7 0 21 1
Feb-10 11 8 0 19 1
Mar-10 8 5 0 13 1
Apr-10 7 4 1 12 1

52
May-10 10 5 0 15 1
Jun-10 12 4 0 16 1
Jul-10 7 2 0 9 1
Aug-10 8 4 0 12 1
Sep-10 5 10 1 16 1
Oct-10 10 9 1 20 1
Nov-10 10 6 1 17 1
Dec-10 6 8 0 14 1
Jan-11 6 5 2 13 1
Feb-11 5 4 0 9 1
Mar-11 9 6 0 15 1
Apr-11 4 3 0 7 1
May-11 3 3 0 6 1
Appendix II
From the graph above, it can be seen that in relation to number of accidents over time, it is
dangerous occurrences which has the highest number as expected. This is because it is this
dangerous occurrences that lead to fatalities, major injuries or over 3 day injuries. After 2005,
it appears that all accidents have decreased however it is unclear if this was caused due to the

53
safety case regime. The test will examine if safety case regime had an effect on number of
accidents.
Result
Variable Coefficient Std. Error t-Statistic Prob.
TREND -7.220270 2.807696 -2.571599 0.0129
DUM_REG -3.522973 25.73296 -0.136905 0.8916
D_1 -573.6000 19.72061 -29.08632 0.0000
D_2 -524.6667 19.72061 -26.60499 0.0000
D_3 -389.2667 19.72061 -19.73908 0.0000
C 634.2698 21.38278 29.66265 0.0000
R-squared 0.951695 Mean dependent var 203.4500
Adjusted R-squared 0.947222 S.D. dependent var 235.0847
S.E. of regression 54.00712 Akaike info criterion 10.91075
Sum squared resid 157505.5 Schwarz criterion 11.12018
Log likelihood -321.3224 Hannan-Quinn criter. 10.99267
F-statistic 212.7778 Durbin-Watson stat 0.505944
Prob(F-statistic) 0.000000
Interpretation
As probability value is 0.00 for major injuries, over 3 day injuries, trend, and intercept,
statistical evidence suggests that we reject the null so therefore there is a relationship between
number of accidents and fatalities or major injuries or over 3 day injuries or trend or
intercept. However as the probability value safety regime is greater than 0.1 or 10%
significance level, it implies that we cannot reject the null which says there is no relation
between number of accidents and safety case regime 2005.
54
Bibliography
Akerlof G, 1970, The Market for 'Lemons': Quality Uncertainty and the Market Mechanism,
Quarterly Journal of Economics , The MIT Press, 84 (3): 488–500.
ARI Integrated Workplace Solutions, 2007, Safety and Health Add Value. OSHA Publication
3180, available at http://www.arirehab.com/images/ARIWorkplaceSolutionsTemplateR2.pdf
accessed on 29/07/2011 at 9:15pm.
Baldwin M and Johnson W, 1995, Labor Market Discrimination against Women with
Disabilities, Industrial Relations, 34(4): 555-77.
Bator F, 1958, The Anatomy of Market, The Quarterly Journal of Economics, Vol. 72, No. 3,
pp. 351-379, Oxford University Press, available at http://www.jstor.org/stable/1882231
accessed on 5/08/2011 at 3:20pm.
Boden L, Biddle E, Spieler E, 2001, Social and Economic Impacts of Workplace Illness and
Injury: Current and Future Directions for Research, American journal of industrial medicine
40:398-402.
Bohm (P), 1981, Deposit-Refund Systems: Theory and Applications to Environmental,
Conservation, and Consumer Policy, Resources for the Future, Washington DC.
Brooks and Hwong, 2006, The Social Benefits and Economic Costs of Taxation, A
Comparison of Highand Low-Tax Countries, available at
http://www.taxjustice.net/cms/upload/pdf/Benefits_and_Costs_of_Taxation.pdf accessed on
6/07/2011 at 10:54am
Brooks.C, 2002, Introductory econometrics for finance, Cambridge university press,
Cambridge.
Buhai s, Cottini E and Westergård-Nielsen N, 2008, The impact of workplace conditions on
firm performance, Department of Economics, Working paper 08-13.
Bull D, 2004, A critical review of post Piper-Alpha developments in explosion science for the
Offshore Industry, Prepared by Firebrand International Ltd for the Health and Safety
Executive, research report 89, available at http://www.hse.gov.uk/research/rrpdf/rr089.pdf,
accessed on 6/07/2011 at 12:28pm.

55
Carmichael, 1986, Reputations for Safety: Market Performance and Policy Remedies, Journal
of Labour Economics, 4: 458-72.
Conley B, 1976, The Value of Human Life in the Demand for Safety, The American
Economic Review, Vol 66, No. 1, pp 45-55, available at http://www.jstor.org/stable/1804944,
accessed on 12/08/2011 at 9:24am.
Cook, 1978, The Value of Human Life in the Demand for Safety: Comment, The American
Economic Review, Vol. 68, No. 4, pp. 710-711, American Economic Association, available
at http://www.jstor.org/stable/1808941 accessed on 8/08/2011 at 2:15pm.
Dardis R, 1980, The Value of a Life: New Evidence from the Marketplace, The American
Economic Review, Vol. 70, No. 5, pp. 1077-1082, American Economic Association,
available at http://www.jstor.org/stable/1805792 accessed on 8/08/2011 at 5:01pm.
Department of Energy and Climate Change (DECC), 2011, available at
http://www.decc.gov.uk/ accessed on 5/07/2011 at 4:01pm.
Diamond P, 1977, Insurance Theoretic Aspects of Workers' Compensation, in: Alan S.
Blinder and Philip Friedman, Natural Resources, Uncertainty and General Equilibrium
Systems, New York, Academic Press.
Dorman P, 2000a, The Economics of Safety, Health, and Well-Being at Work: An Overview,
In Focus Program on Safe Work, International Labour Organisation
Dorman P, 2000b, The Role of Economic Incentives for Occupational Safety and Health,
chapter 2, Three Preliminary Papers on the Economics of Occupational Safety and Health.
http://ilo-
mirror.library.cornell.edu/public/english/protection/safework/papers/ecoanal/wr_chp2.htm.
Dublin C and Lotka A, 1930, The Money Value of a Man, New York, Ronald Press.
Duff S, 2008, Remembering Piper Alpha disaster, BBC Scotland, BBC.co.uk, available at
http://news.bbc.co.uk/1/hi/scotland/7438774.stm, accessed on 6/07/2011 at 12:20pm.

56
Energy report, 1998, The 1998 Digital Energy Report- Vol. II, available at http://www.dbd-
data.co.uk/bb1998/book.htm, accessed on 5/07/2011 at 3:22pm.
Energy report, 2001, Development of UK Oil and Gas Resources, available at
http://www.dbd-data.co.uk/bb2001/book.htm, accessed on 5/07/2011 at 3:37pm.
Fehr E and Schmidt K, 2000. "Fairness, Incentives, and Contractual Choices." European
Economic Review, 44(4-6): 1057-68.
Grant A, 2003, Environmental Impacts of the Decommissioning of Oil and Gas Installations
in the North Sea, University of East Anglia, available at
http://www.uea.ac.uk/~e130/cuttings.htm, accessed on 6/07/2011 at 10:21am.
Gravelle H and Rees R, 1993, Microeconomics, Longman Group, Singapore.
Gray W and Deily M, Compliance and Enforcement: Air Pollution Regulation in the U.S.
Steel Industry, Journal of Environmental Economics and Management 31 (1996), 96-111.
Guardian, 2011, BP oil spill, Guardin.co.uk, available at
http://www.guardian.co.uk/environment/bp-oil-spill and accessed on 8/08/2011 at 10:24pm.
Haveman R and Wolfe B, 1990, The Economic Well-Being of the Disabled, Journal of
Human Resources, 25(1): 32-54.
Healtey T, 2007, The hartford steam boiler inspection and insurance company, safety should
be everybody's business - don't underestimate the value of employee safety, available at
http://www.hsb.com/TheLocomotive/SafetyShouldBeEverybodysConcern.aspx accessed on
27/07/2011 at 3:21pm.
Health and Safety Executive (HSE), 2006, A guide to the Offshore Installations (Safety Case)
Regulations 2005, Guidance on Regulations, available at
http://www.hseni.gov.uk/l30_a_guide_to_the_offshore_installations__safety_case___regulati
ons_2005.pdf, accessed on 14/08/2011 at 1:26pm.
Health and Safety Executive (HSE), 2010, Offshore Injury, Ill Health and Incident Statistics
2009/2010,Hazardous Installations Directorate Offshore Division (OSD), HID Statistics

57
Report HSR 2010-1, available at http://www.hse.gov.uk/offshore/statistics/hsr0910.pdf
accessed on 6/07/2011 at 10:03am.
Hirshleifer J, Bergstrom T and Rappaport E, 1974, Applying Cost-Benefit Concepts to
Projects which Alter Human Mortality, Univ. California-Los Angeles.
HSE, 2008, Economic Analysis Unit (EAU) appraisal values, available at
http://www.hse.gov.uk/economics/eauappraisal.htm#refs accessed on 5/08/2011 at 11:32am.
Jones-Lee W, 1985, The value of life and safety: A survey of recent developments, The
Geneva papers on Risk and Insurance, 10 (No 36), 141-173.
Jones-Lee, 1974, The Value of Changes in the Probability of Death or Injury, The Journal of
Political Economy, Vol. 82, No. 4, pp. 835-849, The University of Chicago Press, available at
http://www.jstor.org/stable/1837150 accessed on 9/08/2011 at 2:43pm.
Katz M and Rosen H, 1994, Microeconomics, 2nd Edition, Irwin, Illinios.
Laffont J (1994), Regulation, moral hazard and insurance of environmental risks, Journal of
public economics 58:319-336.
Lanoie P, 1991, Occupational Safety and Health: a Problem of Double or Single Moral
Hazard, Journal of Risk and Insurance, 58(1):80-97.
Larget B, 2007, Poisson Regression, Departments of Botany and of Statistics University of
Wisconsin, available at
http://www.stat.wisc.edu/courses/st572-larget/Spring2007/handouts24-2.pdf, accessed on
14/08/2011 at 3:25pm.
Lofgren K., Persson T, and. Jorgen J, 2002, Markets with Asymmetric Information: The
Contributions of George Akerlof, Michael Spence and Joseph Stiglitz, Scandinavian Journal
of Economics, 104(2): 195-211.
Magat W and Viscusi K, 1995, Effectiveness of the EPA's Regulatory Enforcement: The
Case of Industrial Effluent Standards, Journal of Law and Economics 33, 331-360.

58
Manson H, 2006, The Project: Brief History of the UK North Sea Oil and Gas Industry, Lives
in the Oil Industry: Oral History of the UK North Sea oil and gas industry, University of
Aberdeen, available at http://www.abdn.ac.uk/~wad009/about/nsoghist.shtml, accessed on
6/07/2011 at 10:07am.
McTaggart D, Findlay C and Parkin M, 1992, Economics, Addison-Wesley, Sydney.
Miller T, 2000, Variations between Countries in Values of Statistical Life, Journal of
Transport Economics and Policy, Volume 34 Part 2, pp.169-188.
Nampoothiri S (2011), Workplace Accidents – The 5 Most Dangerous Jobs, available at
http://sparklingspur.com/workplace-accidents-the-5-most-dangerous-jobs/ accessed on
8/07/2011 at 1:06pm.
Nuneaton & Bedworth Borough Council, 2002, Accidents – Costs and Statistics,
Management of Health and Safety (51), available
athttp://www.nuneatonandbedworth.gov.uk/NBBC_Applications/healthsafety/accicost2.pdf
accessed on the 5/08/2011 at 11:05am.
Oi W, 1974, On the Economics of Industrial Safety, Law and Contemporary Problems, Vol.
38, No. 4, Occupational Safety and Health, pp. 669-699.
Pathak M, 2008, The costs to employers in Britain of workplace injuries and work-related ill
health in 2005/06, Health and Safety Executive, Discussion Paper Series No. 002.
Persson U, Norinder A and Svensson, 1995, Valuing the benefits of reducing the risk of non-
fatal road injuries: The Swedish experience. In: Schwab-Christe and Soguel (eds): Contingent
valuation, Transport safety and the value of life, 63-83, Boston MA: Kluwer Academic.
Pindyck R, 2001, The Dynamics of Commodity Spot and Futures Markets: A Primer,
Volume 22, Issue 3, available at https://www.iaee.org/documents/vol22%283%29.pdf,
accessed on 6/07/2011 at 9:56am.
Rea S, 1981, Workmen's Compensation and Occupational Safety under Imperfect
Information, American Economic Review, 71: 80-93.

59
Russell C, 1990, Monitoring and enforcement, in Public Policies for Environmental
Protection (Portney, Ed.), Resources for the Future, Washington DC.
Solow R, 1971, The economist‟s approach to pollution and its control, science 173, 498-503.
Swierzbinski J, 1993, Guilty until proven innocent-regulation with costly and limited
enforcement, Journal of Environmental Economics and Management 27, 163–184.
UCLA statistical consulting group, 2007, Regression Models with Count Data, UCLA
Academic Technology Services, available at
http://www.ats.ucla.edu/stat/stata/seminars/count_presentation/count.htm, accessed
on14/08/2011 at 3:14pm.
Varian H, 1990, Intermediate Microeconomics: A Modern Approach, 2nd ed, W Norton and
Co., New York.
Vectra Group Limited, 2003, Literature review on the perceived benefits and disadvantages
of UK Safety Case Regimes, Prepared for HSE, available at
http://www.hse.gov.uk/research/misc/sc402083.pdf, accessed on 15/08/2011 at 3:15pm.
Viscusi W and Aldy J, 2003, The value of a statistical life: A critical review of market
estimates throughout the world, Journal of Risk and Uncertainty, Vol. 27(1).
Wils J and Nelson E, 2007, The Technical and Legal Guide to the UK Oil and Gas Industry,
Aberdeen, Aberlour Press.


![CPUC Safety En Banc on Safety Management Systems - 5 ......The Public Inquiry into the Piper Alpha Disaster. ... [Piper Alpha] 2. Simple but detailed systems, policies, standards and](https://img.dokumen.tips/doc/110x75/60e84ef5187a963e6167b5ef/cpuc-safety-en-banc-on-safety-management-systems-5-the-public-inquiry.jpg)