Embed Size (px)
Citation preview

Economic and Market Report
EU Automotive Industry Quarter 3 2016
December 2016

ACEA Economic and Market Report: Quarter 3 2016 – December 2016 1
CONTENTS EU economic outlook .................................................................................................................... 2
Passenger cars ............................................................................................................................... 4
Registrations ............................................................................................................................. 4
World ..................................................................................................................................... 4
The European Union ............................................................................................................... 7
Registrations by alternative fuel type .................................................................................. 9
Diesel penetration ............................................................................................................. 11
Production ............................................................................................................................... 12
World ................................................................................................................................... 12
The European Union ............................................................................................................. 15
Trade ....................................................................................................................................... 16
Imports ................................................................................................................................. 17
Exports ................................................................................................................................ 18
Commercial vehicles .................................................................................................................... 19
Registrations ........................................................................................................................... 19
The European Union ............................................................................................................ 19
Global production outlook ....................................................................................................... 24
Trade ....................................................................................................................................... 26
Imports ................................................................................................................................. 27
Exports ................................................................................................................................ 28

ACEA Economic and Market Report: Quarter 3 2016 – December 2016 2
EU ECONOMIC OUTLOOK
The European economy is expected to continue to grow at a moderate rate in the near future,
although various barriers to growth remain, including (geo)political uncertainty, the fragile
situation of global trade and weak economic growth outside the EU. In its autumn forecast, the
European Commission predicts EU GDP growth to be 1.8% in 2016, 1.6% in 2017 and 1.8% in 2018.
Figure 1: EU GDP growth forecast (in %)
Source: EUROPEAN COMMISSION, DG ECFIN

ACEA Economic and Market Report: Quarter 3 2016 – December 2016 3
Table 1: European Economic Forecast Autumn 2016
EU FORECAST 2016 2017 2018
GDP GROWTH (%, YOY) 1.8 1.6 1.8
INFLATION (%, YOY) 0.3 1.6 1.7
UNEMPLOYMENT (%) 8.6 8.3 7.9
Source: EUROPEAN COMMISSION, DG ECFIN
Inflation in the European Union is expected to rise above 1%, as an increase in oil prices seems to
be imminent. According to the Commission’s latest forecast, EU inflation will rise from 0.3% this
year to 1.6% in 2017 and 1.7% in 2018.
Job creation will continue to benefit from moderate growth of wages and domestic demand
expansion, further stimulated by the fiscal policy measures and structural reforms that have been
implemented in some member states. Consequently, unemployment rates in the EU are forecasted
to fall relatively fast over the next few years: from 8.6% in 2016 to 8.3% in 2017 and 7.9% in 2018.

ACEA Economic and Market Report: Quarter 3 2016 – December 2016 4
PASSENGER CARS
REGISTRATIONS
WORLD
Demand for passenger cars in Europe1 improved noticeably during the first nine months of 2016
(+4.9%), accounting for 23.6% of the global market. The EU region contributed significantly to the
positive global picture, mainly thanks to better macroeconomic conditions which directly improved
internal demand. With 11.2 million passenger cars sold in the EU, results were 8.0% higher than in
the same period last year. This represents a solid and rather consistent performance, especially
considering the fact that the first three quarters of 2015 were already strong. However, some risks
remain, also following the Brexit vote, and this uncertainty will inevitably continue to affect the car
market.
From January to September 2016, Russian demand dropped (‐15.1%) due to very high inflation and
the resulting decline in consumer confidence. Recent months, however, have shown a relative
stabilisation and also the Ukrainian market started to show signs of a possible recovery, with car
registrations up 53.4% during first three quarters. Although the first half of the year saw positive
momentum, Turkey returned to negative territory (‐2.3%) following the failed coup in July.
Nine months into 2016, Japanese passenger car sales were down 4.2% compared to 2015, because
of Japan’s weak domestic economy and consumption. For this reason, the Japanese government
decided to delay the consumption tax hike planned for April 2017 to October 2019. The downturn
in Japan was partially offset by the growth observed in South Korean sales, which went up 3.1%
during the same period.
The car market in the United States remained stable during the first nine months of the year, with
about 11 million passenger cars sold so far in 2016, accounting for 19.3% of the global market.
1 Includes Belarus, Bosnia‐Herzegovina, Kazakhstan, Macedonia, Russia, Serbia, Turkey, Ukraine and
Uzbekistan

ACEA Economic and Market Report: Quarter 3 2016 – December 2016 5
Over the first three quarters of 2016, passenger car demand in South America contracted by 15.1%
to 2.3 million units, as a result of high inflation, currency devaluations and low consumer
confidence. Brazil accounted for more than 90% of the volume loss in the region, with a
contradiction of 362,697 units or a 22.6% fall compared to the same period in 2015.
Chinese passenger car sales did increase (+14.7%), partially driven by the remarkable performance
of the SUV segment. The Chinese market reached 15.5 million units sold and accounted for more
than a quarter of global passenger car sales.
Looking at the other emerging markets, passenger car demand in India increased significantly
during the third quarter after a slow start of 2016. Indian sales reached 2.3 million units, up 10.5%
compared to first nine months of 2015.
Globally, 56 million passenger cars were sold so far in 2016, 4.4% more than in the same period one
year ago.

ACEA Economic and Market Report: Quarter 3 2016 – December 2016 6
Table 2: World new passenger car registrations
JAN‐SEP 20162 JAN‐SEP 2015 % change 16/15 % share 2016
EUROPE 13,193,634 12,576,446 +4.9 23.6
EU3 11,243,263 10,413,745 +8.0 20.1
EFTA 364,003 362,995 +0.3 0.6
RUSSIA 944,736 1,112,497 ‐15.1 1.7
TURKEY 489,355 500,905 ‐2.3 0.9
UKRAINE 42,363 27,622 +53.4 0.1
OTHERS‐EUROPE4 109,914 158,682 ‐30.7 0.2
NORTH AMERICA5 12,915,701 12,866,230 +0.4 23.1
Of which the US 10,794,739 10,890,268 ‐0.9 19.3
SOUTH AMERICA 2,266,088 2,668,260 ‐15.1 4.0
Of which Brazil 1,240,966 1,603,663 ‐22.6 2.2
ASIA 24,772,235 22,608,685 +9.6 44.2
CHINA 15,529,653 13,541,045 +14.7 27.7
JAPAN 3,138,034 3,277,320 ‐4.2 5.6
INDIA 2,289,404 2,071,621 +10.5 4.1
SOUTH KOREA 1,108,662 1,074,834 +3.1 2.0
OTHERS‐ASIA6 2,706,482 2,643,865 +2.4 4.8
MIDDLE EAST/AFRICA 2,869,995 2,925,357 ‐1.9 5.1
WORLD 56,017,653 53,644,978 +4.4 100.0
Source: IHS MARKIT, ACEA
2 Provisional figures
3 Data for Malta not available
4 Includes Belarus, Bosnia‐Herzegovina, Kazakhstan, Macedonia, Serbia and Uzbekistan
5 Based on production type
6 Includes Hong Kong, Taiwan and all the other South Asian countries, excluding India
ACEA Economic and Market Report: Quarter 3 2016 – December 2016 7
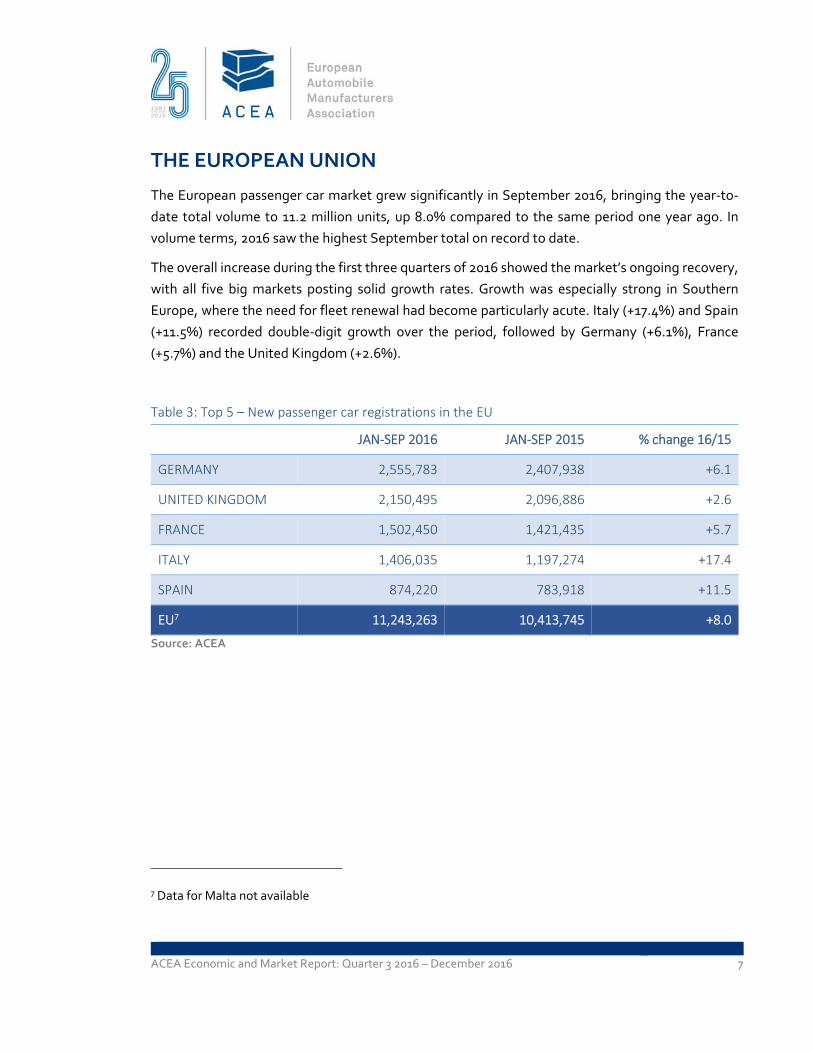
THE EUROPEAN UNION
The European passenger car market grew significantly in September 2016, bringing the year‐to‐
date total volume to 11.2 million units, up 8.0% compared to the same period one year ago. In
volume terms, 2016 saw the highest September total on record to date.
The overall increase during the first three quarters of 2016 showed the market’s ongoing recovery,
with all five big markets posting solid growth rates. Growth was especially strong in Southern
Europe, where the need for fleet renewal had become particularly acute. Italy (+17.4%) and Spain
(+11.5%) recorded double‐digit growth over the period, followed by Germany (+6.1%), France
(+5.7%) and the United Kingdom (+2.6%).
Table 3: Top 5 – New passenger car registrations in the EU
JAN‐SEP 2016 JAN‐SEP 2015 % change 16/15
GERMANY 2,555,783 2,407,938 +6.1
UNITED KINGDOM 2,150,495 2,096,886 +2.6
FRANCE 1,502,450 1,421,435 +5.7
ITALY 1,406,035 1,197,274 +17.4
SPAIN 874,220 783,918 +11.5
EU7 11,243,263 10,413,745 +8.0
Source: ACEA
7 Data for Malta not available

ACEA Economic and Market Report: Quarter 3 2016 – December 2016 8
Figure 2: New passenger car registrations in the EU | 12‐month trend
Source: ACEA

ACEA Economic and Market Report: Quarter 3 2016 – December 2016 9
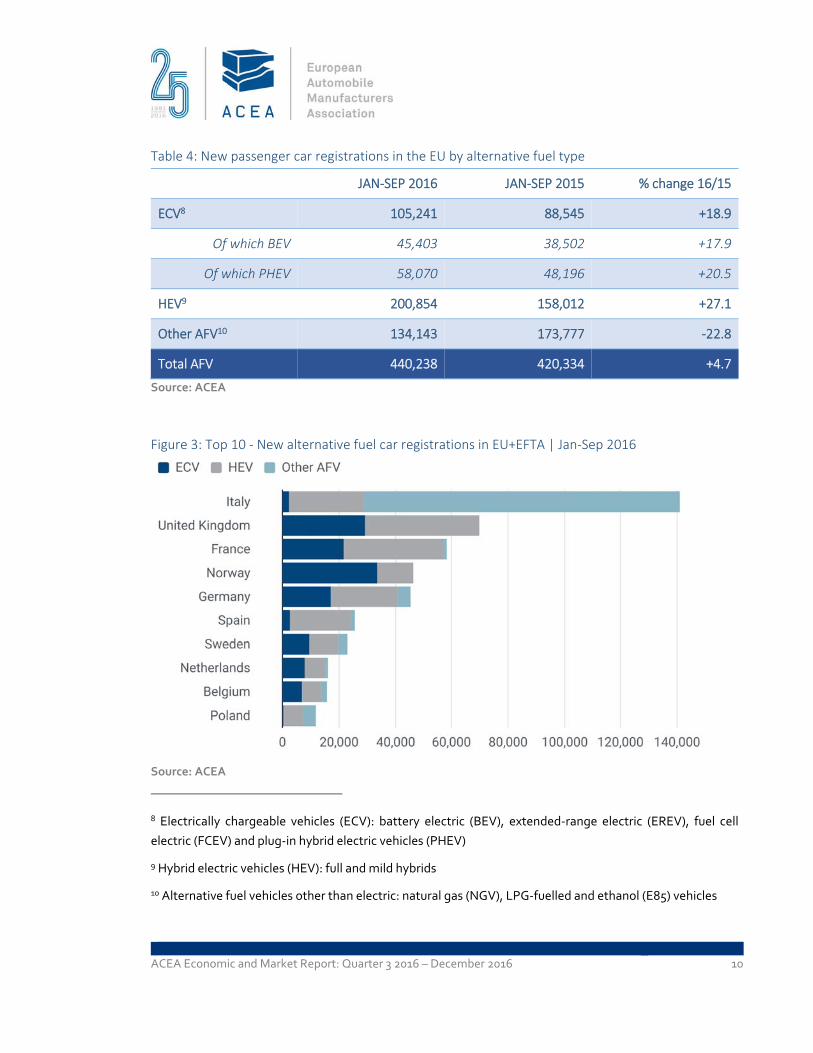
Registrations by alternative fuel type
Over the first three quarters of 2016, demand for alternative fuel vehicles (AFV) in the EU grew by
4.7%, totalling 440,238 units. AFVs represented almost 4% of total passenger car registrations.
However, results were diverse among different vehicle categories. On the one hand, registrations
of new electrically chargeable (ECV) and hybrid electric vehicles (HEV) continued their positive
momentum, posting double‐digit percentage gains both in the third quarter (+20.2% and +29.2%
respectively) and over the first nine months of 2016 (+18.9% and +27.1%). Growth in the ECV
segment was particularly supported by plug‐in electric cars (+20.5%), which represented more than
half of all ECV registrations. Demand for cars powered by propane, ethanol or natural gas (NGV),
on the other hand, fell by 22.8% so far in 2016, continuing the trend of the first half of the year. The
main reason for this drop in demand is the contraction of the Italian market, which accounted for
the majority of these vehicles.
Among the EU’s major markets, Spain (+59.2%), the UK (+24.3%) and Germany (+15.0%) saw
substantial increases in AFV registrations over the period. Growth in these countries was fully
driven by demand for electric and hybrid electric vehicles. Italy performed less well than in 2015 (‐
14.6%), mainly due to the sharp decline in registrations of propane and gas‐fuelled cars, which
where only partly offset by increases in the sales of electric (+16.3%) and hybrid electric (+48.8%)
cars. France only showed a modest uplift (+2.2%) in total AFV registrations, due to decreases in the
HEV and LPG segments. However, France still accounted for the second largest number of HEV
registrations (35,513 units) after the United Kingdom.
Among the EU+EFTA countries, Norway maintained its leading position with the largest number
of ECVs registered over the period: 33,386 units, up 34.2% compared to the first nine months of
2015.
ACEA Economic and Market Report: Quarter 3 2016 – December 2016 10
Table 4: New passenger car registrations in the EU by alternative fuel type
JAN‐SEP 2016 JAN‐SEP 2015 % change 16/15
ECV8 105,241 88,545 +18.9
Of which BEV 45,403 38,502 +17.9
Of which PHEV 58,070 48,196 +20.5
HEV9 200,854 158,012 +27.1
Other AFV10 134,143 173,777 ‐22.8
Total AFV 440,238 420,334 +4.7
Source: ACEA
Figure 3: Top 10 ‐ New alternative fuel car registrations in EU+EFTA | Jan‐Sep 2016
Source: ACEA
8 Electrically chargeable vehicles (ECV): battery electric (BEV), extended‐range electric (EREV), fuel cell
electric (FCEV) and plug‐in hybrid electric vehicles (PHEV)
9 Hybrid electric vehicles (HEV): full and mild hybrids
10 Alternative fuel vehicles other than electric: natural gas (NGV), LPG‐fuelled and ethanol (E85) vehicles

ACEA Economic and Market Report: Quarter 3 2016 – December 2016 11
Diesel penetration
So far in 2016, 49.8% of all new passenger cars registered in Western Europe ran on diesel, about
two percentage points less than in the same period last year. In the EU‐15, diesel’s market share
fell from 52.0% to 50.2% of total registrations during the first nine months of the year.
Results were diverse across Western Europe: diesel’s market share increased slightly in Denmark,
Switzerland, Italy, the UK and Austria, while notable declines were observed in Norway, Greece,
Belgium, Spain, the Netherlands, Luxembourg and France.
Table 5: Share of diesel in new passenger cars in Western Europe
JAN‐SEP 2016 JAN‐SEP 2015
AUSTRIA 57.8% 57.6%
BELGIUM 52.3% 59.7%
DENMARK 35.2% 29.8%
FINLAND 33.1% 35.3%
FRANCE 52.5% 58.2%
GERMANY 46.5% 47.7%
GREECE 53.3% 61.9%
IRELAND 70.1% 71.0%
ITALY 56.6% 55.0%
LUXEMBOURG 64.2% 70.0%
NETHERLANDS 18.4% 24.4%
PORTUGAL 64.3% 67.2%
SPAIN 57.0% 63.2%
SWEDEN 51.8% 57.7%
UNITED KINGDOM 48.1% 47.8%
EU‐15 50.2% 52.0%
ICELAND 44.8% 48.0%
NORWAY 30.7% 41.0%
SWITZERLAND 39.7% 37.8%
EFTA 37.0% 39.1%
WESTERN EUROPE 49.8% 51.6%
Source: AAA

ACEA Economic and Market Report: Quarter 3 2016 – December 2016 12
PRODUCTION
WORLD
European passenger car production increased (+3.4%) in the first three quarters of 2016, this was
mainly the result of high domestic demand (especially in the EU perimeter). Production in Russia
and Ukraine continued to decrease, although at a lower rate compared to last year.
US output remained stable compared to one year ago (+0.4%) as demand for cars slowed, with
production counting 7 million units so far in 2016.
Through the first three quarters of 2016, passenger car production in South America continued to
drop sharply compared to last year. Between January and September, the region produced around
1.6 million units, 16.4% less than in the same period in 2015. Volume continues to be lost in Brazil
(‐16.9%), where several factors, including high inflation and interest rates, are still affecting
domestic demand and thus production.
Over the first three quarters of 2016, production in China accelerated back into double‐digit growth
(+11.7%), as a result of more stable financial markets and increased demand under the
government’s stimulus policy. China maintained its leading position among passenger car
producers with 14.6 million units, accounting for more than a quarter of global production.
Japanese production declined (‐1.3%) to around 5.7 million units during the first nine months of
2016, still affected by stagnant domestic sales. During the same period, passenger car production
in South Korea contradicted by 3.6%, mainly due to sluggish export demand from South American
and African markets.
From January to September 2016, Thailand and Indonesia posted positive results, with production
up respectively 12.2% and 5.6%. Strong domestic sales and improved exports boosted Indian
production (+5.2%) as well, which totalled 2.6 million units over the same period.
Globally 56.4 million passenger cars were produced during the first nine months of the year, 3.6%
more than in the same period in 2015.

ACEA Economic and Market Report: Quarter 3 2016 – December 2016 13
Table 6: World passenger car production
JAN‐SEP 201611 JAN‐SEP 2015 % change 16/15 % share 2016
EUROPE 14,510,277 14,032,579 +3.4 25.7
EU 12,967,626 12,381,168 +4.7 23.0
RUSSIA 818,741 901,311 ‐9.2 1.5
TURKEY 591,612 529,160 +11.8 1.0
UKRAINE 2,099 3,068 ‐31.6 0.0
OTHERS‐EUROPE12 130,199 217,872 ‐40.2 0.2
NORTH AMERICA 10,733,144 10,596,906 +1.3 19.0
Of which the US 7,078,622 7,053,388 +0.4 12.5
SOUTH AMERICA 1,595,107 1,906,914 ‐16.4 2.8
Of which Brazil 1,295,870 1,559,756 ‐16.9 2.3
ASIA 28,269,466 26,740,571 +5.7 50.1
CHINA 14,596,560 13,062,720 +11.7 25.9
JAPAN 5,702,957 5,780,155 ‐1.3 10.1
SOUTH KOREA 2,974,161 3,084,107 ‐3.6 5.3
INDIA 2,626,455 2,497,787 +5.2 4.7
THAILAND 742,151 661,230 +12.2 1.3
INDONESIA 675,139 639,480 +5.6 1.2
OTHERS‐ASIA13 952,043 1,015,092 ‐6.2 1.7
MIDDLE EAST/AFRICA 1,311,679 1,183,880 +10.8 2.3
WORLD 56,419,673 54,460,850 +3.6 100.0
Source: IHS MARKIT, OICA
11 Provisional figures
12 Includes Belarus, Kazakhstan, Serbia and Uzbekistan
13 Includes Taiwan, Australia, Malaysia, Pakistan, Philippines and Vietnam

ACEA Economic and Market Report: Quarter 3 2016 – December 2016 14
Figure 4: Top 10 – World passenger car producers
Source: IHS MARKIT, OICA
+11.7
+4.7
+0.4
‐1.3
‐3.6+5.2
‐2.0 +9.0‐16.9
‐9.2
0
2,000,000
4,000,000
6,000,000
8,000,000
10,000,000
12,000,000
14,000,000
16,000,000
China EU US Japan SouthKorea
India Mexico Canada Brazil Russia
Jan‐Sep 2015 Jan‐Sep 2016

ACEA Economic and Market Report: Quarter 3 2016 – December 2016 15
THE EUROPEAN UNION
Within the European Union perimeter, passenger car production increased by 4.7% during the first
three quarters of the year, reaching almost 13 million units. The EU accounts for 23.0% of global
passenger car production and is the world’s second largest producer after China.
The main producing countries of Western Europe showed significant growth so far in 2016, all
spurred by continuing growth of domestic demand: France (+10.9%), the UK (+10.5%), Italy
(+8.8%), Spain (+8.4%) and Germany (+1.1%).
Production in Central European countries slowed down over the first nine months of the year. This
was especially the case in Romania (‐8.8%) and Hungary (‐4.0%), while the Czech Republic (+11.8%)
and Poland (+2.9%) contributed positively to the EU’s output increase over the period.
Table 7: Top 10 – Passenger car producers in the EU
JAN‐SEP 2016 JAN‐SEP 2015 % change 16/15
GERMANY 4,378,700 4,329,795 +1.1
SPAIN 1,807,921 1,667,198 +8.4
UNITED KINGDOM 1,292,453 1,169,476 +10.5
FRANCE 1,282,000 1,156,000 +10.9
CZECH REPUBLIC 1,088,400 973,127 +11.8
SLOVAKIA 782,781 770,000 +1.7
ITALY 536,726 493,417 +8.8
POLAND 428,700 416,500 +2.9
HUNGARY 322,190 335,630 ‐4.0
ROMANIA 272,183 298,355 ‐8.8
EU 12,967,626 12,381,168 +4.7
Source: OICA

ACEA Economic and Market Report: Quarter 3 2016 – December 2016 16
TRADE
From January to September 2016, the EU exported 4 million passenger cars worth €92.6 billion. In
parallel, the value of EU imports strongly increased (+16.6%) during the same period.
EU passenger car exports fell both in value (‐4.0%) and in volume terms (‐3.6%) – although exports
recovered slightly compared to the first quarter, when declines were even more significant.
So far in 2016, the EU generated a trade surplus worth €64.9 billion, down 10.7% compared to the
same period one year ago.
Table 8: EU passenger car trade
Trade in value (€m) JAN‐SEP 2016 JAN‐SEP 2015 % change 16/15
IMPORTS 27,678 23,746 +16.6
EXPORTS 92,595 96,405 ‐4.0
TRADE BALANCE 64,918 72,660 ‐10.7
Trade in volume (units) JAN‐SEP 2016 JAN‐SEP 2015 % change 16/15
IMPORTS 2,083,254 1,805,539 +15.4
EXPORTS 4,031,018 4,182,111 ‐3.6
Source: EUROSTAT

ACEA Economic and Market Report: Quarter 3 2016 – December 2016 17
IMPORTS
During the first three quarters of 2016, most passenger cars imported into the EU came from
Turkey and Japan, the latter also accounted for the highest import value (+20.5%). Turkish imports
recovered significantly in both value (+16.9%) and volume terms (+16.8%) over the last few months,
after the first quarter saw serious declines.
Imports from South Korea and the United States also significantly increased over the first nine
months of the year. Together with Japan and Turkey, these countries represented more than 65%
of all EU passenger car imports.
Table 9: Origin of most passenger car imports
Trade in value (€m) JAN‐SEP 2016 JAN‐SEP 2015 % change 16/15
WORLD 27,678 23,746 +16.6
JAPAN 6,756 5,608 +20.5
UNITED STATES 5,448 4,938 +10.3
TURKEY 4,351 3,723 +16.9
SOUTH KOREA 3,597 3,254 +10.6
SOUTH AFRICA 2,118 1,706 +24.1
Source: EUROSTAT
Table 10: Origin of most passenger car imports
Trade in volume (units) JAN‐SEP 2016 JAN‐SEP 2015 % change 16/15
WORLD 2,083,254 1,805,539 +15.4
TURKEY 448,847 384,347 +16.8
JAPAN 420,348 351,272 +19.7
SOUTH KOREA 306,212 278,684 +9.9
UNITED STATES 190,340 176,620 +7.8
MOROCCO 137,453 115,828 +18.7
Source: EUROSTAT

ACEA Economic and Market Report: Quarter 3 2016 – December 2016 18
EXPORTS
Nine months into the year, EU passenger car exports to the United States declined from 908,216
units to 847,245, down 6.7% compared to one year ago. However, the US remained the EU's most
valuable export market for passenger cars, with exports totalling more than €27 billion –
representing about 30% of the total.
Negative results were also recorded in export volumes to China, Turkey and Switzerland. Japan was
the only major export partner to show an increase over the period, both in value (+14.9%) and in
volume terms (+19.9%).
Table 11: Main destinations of EU passenger car exports
Trade in value (€m) JAN‐SEP 2016 JAN‐SEP 2015 % change 16/15
WORLD 92,595 96,405 ‐4.0
UNITED STATES 27,183 29,660 ‐8.4
CHINA 14,735 14,109 +4.4
TURKEY 6,117 5,842 +4.7
JAPAN 5,408 4,707 +14.9
SWITZERLAND 5,383 5,801 ‐7.2
Source: EUROSTAT
Table 12: Main destinations of EU passenger car exports
Trade in volume (units) JAN‐SEP 2016 JAN‐SEP 2015 % change 16/15
WORLD 4,031,018 4,182,111 ‐3.6
UNITED STATES 847,245 908,216 ‐6.7
TURKEY 412,371 423,046 ‐2.5
CHINA 359,998 373,759 ‐3.7
JAPAN 218,406 182,144 +19.9
SWITZERLAND 208,016 229,025 ‐9.2
Source: EUROSTAT

ACEA Economic and Market Report: Quarter 3 2016 – December 2016 19
COMMERCIAL VEHICLES
REGISTRATIONS
THE EUROPEAN UNION
From January to September 2016, demand for new commercial vehicles in the EU continued the
positive momentum from previous months, with September 2016 marking the 21st consecutive
month of growth. The EU market expanded by 13.3% over the period, reaching more than 1.7
million commercial vehicle registrations. Growth was sustained across all segments, but was
especially strong for light commercial vehicles (+13.5%) and trucks (+13.5%).
Looking at the largest markets, Italy saw the highest upturn (+40.2%), followed by Spain (+13.1%),
Germany (+11.3%), France (+10.1%) and the UK14 (+2.9%).
Table 13: New commercial vehicle registrations in the EU | by type
JAN‐SEP 2016 JAN‐SEP 2015 % change 16/15
LCV ≤ 3,5t15 1,422,657 1,253,719 13.5%
MHCV > 3,5t16 271,132 238,812 13.5%
MHBC > 3,5t17 29,580 28,648 3.3%
TOTAL CV 1,723,369 1,521,179 13.3%
Source: ACEA
14 MHCV and MHBC categories have been updated to take into account SMMT official quarterly data
15 New light commercial vehicles (LCV) up to 3.5 tonnes
16 New medium and heavy commercial vehicles (MHCV) over 3.5 tonnes
17 New medium and heavy buses and coaches (MHBC) over 3.5 tonnes

ACEA Economic and Market Report: Quarter 3 2016 – December 2016 20
Figure 5: New commercial vehicle registrations in the EU big 5 markets
Source: ACEA
FRANCE UK GERMANY ITALY SPAIN
Jan‐Sep 2015 308,335 327,381 237,972 105,617 128,981
Jan‐Sep 2016 339,471 337,003 264,790 148,086 145,838
+10.1% +2.9%
+11.3%
+40.2% +13.1%
0
50,000
100,000
150,000
200,000
250,000
300,000
350,000
400,000

ACEA Economic and Market Report: Quarter 3 2016 – December 2016 21
New light commercial vehicles (LCV) up to 3.5 tonnes
Over the first nine months of 2016, new registrations of light commercial vehicles totalled more
than 1.4 million units, up 13.5% compared when to the same period one year ago. September 2016
marked the 37th consecutive month of growth in the segment, which accounts for the majority of
sales in the EU commercial vehicle market.
All major markets saw demand for vans increase during this period. Italy (+41.5%) posted the
strongest growth, followed by Spain (+13.0%), Germany (+12.9%), France (+9.8%) and the United
Kingdom (+2.7%).
Figure 6: New light commercial vehicle registrations in the EU big 5 markets
Source: ACEA
FRANCE UK GERMANY ITALY SPAIN
Jan‐Sep 2015 272,148 284,161 168,100 92,306 112,162
Jan‐Sep 2016 298,744 291,714 189,795 130,592 126,692
+9.8%+2.7%
+12.9%
+41.5% +13.0%
0
50,000
100,000
150,000
200,000
250,000
300,000
350,000
ACEA Economic and Market Report: Quarter 3 2016 – December 2016 22
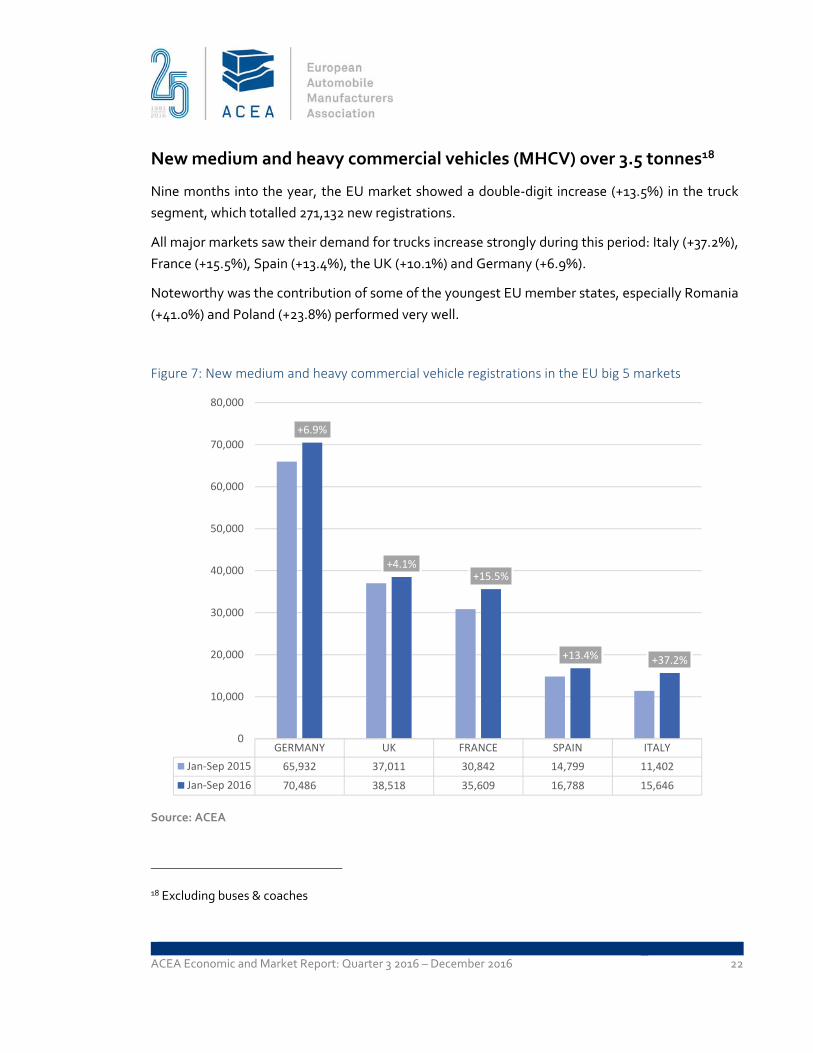
New medium and heavy commercial vehicles (MHCV) over 3.5 tonnes18
Nine months into the year, the EU market showed a double‐digit increase (+13.5%) in the truck
segment, which totalled 271,132 new registrations.
All major markets saw their demand for trucks increase strongly during this period: Italy (+37.2%),
France (+15.5%), Spain (+13.4%), the UK (+10.1%) and Germany (+6.9%).
Noteworthy was the contribution of some of the youngest EU member states, especially Romania
(+41.0%) and Poland (+23.8%) performed very well.
Figure 7: New medium and heavy commercial vehicle registrations in the EU big 5 markets
Source: ACEA
18 Excluding buses & coaches
GERMANY UK FRANCE SPAIN ITALY
Jan‐Sep 2015 65,932 37,011 30,842 14,799 11,402
Jan‐Sep 2016 70,486 38,518 35,609 16,788 15,646
+6.9%
+4.1%+15.5%
+13.4% +37.2%
0
10,000
20,000
30,000
40,000
50,000
60,000
70,000
80,000

ACEA Economic and Market Report: Quarter 3 2016 – December 2016 23
New medium and heavy buses and coaches (MHBC) over 3.5 tonnes
So far in 2016, new bus and coach registrations increased (+3.3%) compared to the same period a
year ago, totalling 29,580 units.
Demand was primarily driven by Spain (+16.7%), Germany (+14.4%) and the United Kingdom
(+9.1%), while France (‐4.2%) and Italy (‐3.2%) saw demand decline over this period.
Figure 8: Top 5 – New medium and heavy bus and coach registrations in the EU | by country
Source: ACEA
UK FRANCE GERMANY SPAIN ITALY
Jan‐Sep 2015 6,209 5,345 3,940 2,020 1,909
Jan‐Sep 2016 6,771 5,118 4,509 2,358 1,848
+9.1%
‐4.2%
+14.4%
+16.7%
‐3.2%
0
1,000
2,000
3,000
4,000
5,000
6,000
7,000
8,000
ACEA Economic and Market Report: Quarter 3 2016 – December 2016 24
GLOBAL PRODUCTION OUTLOOK19
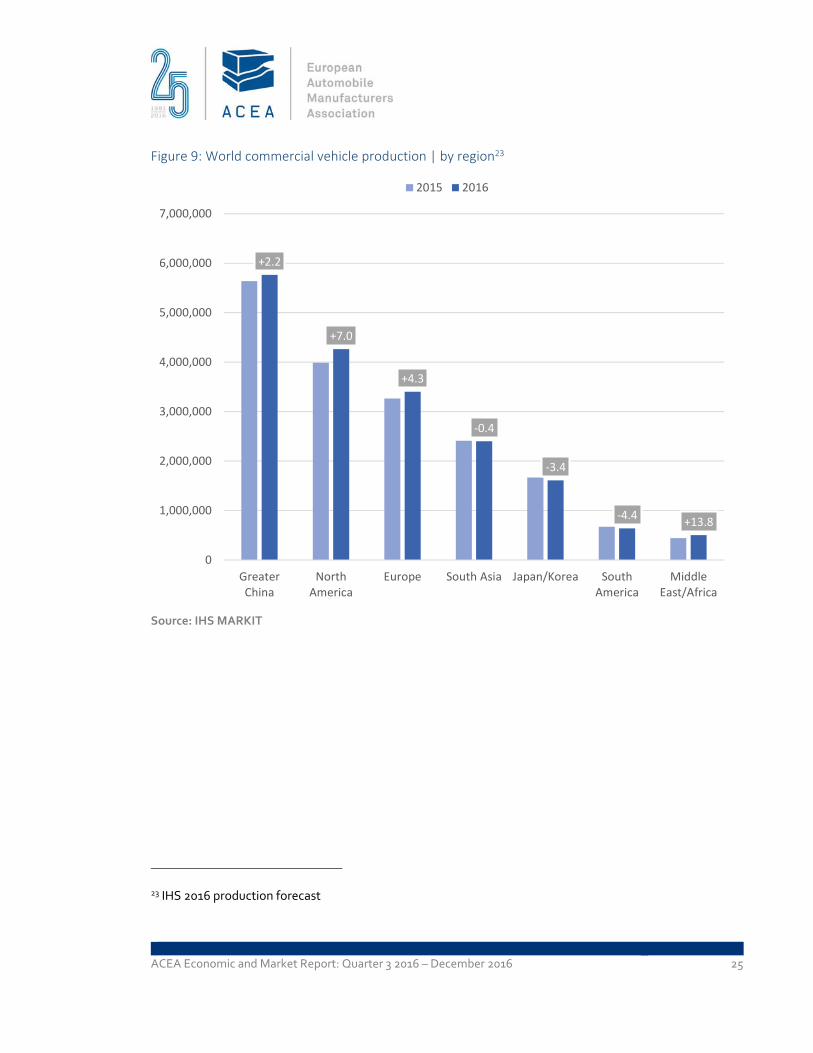
In 2016, European20 commercial vehicle production is expected to grow (+4.3%) and reach around
3.4 million units. This growth will mainly be driven by an increase in domestic demand, especially
in van and truck segments. This upturn is expected to be broadly supported by improving economic
conditions in many parts of the Eurozone, which should also contribute to improving consumer
confidence.
Commercial vehicle production in China21 closely follows market demand. Hence, fuelled by
recovering internal demand Chinese output is projected to further rise (+2.2%), reaching around
5.8 million units by the end of 2016.
Production in North America is also on an upward trajectory, supported by broad economic
recovery and an increase in demand across all commercial vehicle segments. Production is
expected to reach 4.3 million units, which would mean a 7% year‐on‐year increase.
Japanese production is expected to further decline, as domestic sales have been sluggish since the
consumption‐tax increase. This will most likely result in a lower production total of about 1.6 million
units for the whole region22.
South America will probably see its commercial vehicle production fall (‐4.4%) to around 0.6 million
units as a consequence of Brazil’s continuing economic crisis.
Production trends in parts of the Middle East and Africa (MEA) are showing signs of improvement.
As a result, the region is expected to produce around 0.5 million commercial vehicles in 2016, up
13.8% compared to 2015.
19 Commercial vehicle production figures not available on a quarterly basis
20 Includes Turkey and CIS countries
21 Includes Hong Kong and Taiwan
22 Includes Japan and South Korea
ACEA Economic and Market Report: Quarter 3 2016 – December 2016 25
Figure 9: World commercial vehicle production | by region23
Source: IHS MARKIT
23 IHS 2016 production forecast
+2.2
+7.0
+4.3
‐0.4
‐3.4
‐4.4+13.8
0
1,000,000
2,000,000
3,000,000
4,000,000
5,000,000
6,000,000
7,000,000
GreaterChina
NorthAmerica
Europe South Asia Japan/Korea SouthAmerica
MiddleEast/Africa
2015 2016

ACEA Economic and Market Report: Quarter 3 2016 – December 2016 26
TRADE
Over the first three quarters of 2016, EU exports of light and heavy commercial vehicles have
managed to recover from the sharp declines observed during the first half of the year (now +0.1%
and ‐1.5% respectively), with total exports adding up to around €7.6 billion. A stable result, when
compared to the same period last year.
Despite a significant increase in the total value of commercial vehicle and bus imports (+27.0%),
the EU’s trade balance remained positive over the period, generating a positive trade surplus of
about €2 billion.
Table 14: EU commercial vehicles (CV), buses and coaches (BC) trade | by type
Trade in value (€m) CV up to 5t CV over 5t + BC Total CV + BC
JAN‐SEP 2016
IMPORTS 4,352 1,373 5,726
EXPORTS 2,978 4,621 7,598
TRADE BALANCE ‐1,375 3,247 1,873
JAN‐SEP 2015
IMPORTS 3,392 1,118 4,510
EXPORTS 2,976 4,692 7,668
TRADE BALANCE ‐416 3,574 3,159
% change 16/15
IMPORTS +28.3 +22.9 +27.0
EXPORTS +0.1 ‐1.5 ‐0.9
Source: EUROSTAT

ACEA Economic and Market Report: Quarter 3 2016 – December 2016 27
IMPORTS
So far in 2016, most EU commercial vehicle imports originated from Turkey (+18.6%). China came
second with 59,930 units, although imports were down 10.3% compared to last year.
Imports of commercial vehicles from Serbia, Thailand and South Africa increased significantly
during the first nine months of the year, while imports from the United States and especially
Argentina declined considerably.
In total, the EU imported 406,120 commercial vehicles (including buses and coaches) over the first
three quarters of 2016, 11.5% more than last year.
Table 15: Top 10 – Origin of EU commercial vehicle and bus imports
Trade in volume (units) JAN‐SEP 2016 JAN‐SEP 2015 % change 16/15
WORLD 406,120 364,407 +11.5
TURKEY 254,335 214,451 +18.6
CHINA 59,930 66,780 ‐10.3
THAILAND 31,539 22,035 +43.1
SOUTH AFRICA 17,592 13,028 +35.0
MOROCCO 14,207 12,953 +9.7
UNITED STATES 6,337 6,832 ‐7.3
SWITZERLAND 4,798 4,092 +17.3
SERBIA 3,120 370 +743.2
ARGENTINA 2,976 5,668 ‐47.5
NORWAY 2,451 2,275 +7.7
Source: EUROSTAT

ACEA Economic and Market Report: Quarter 3 2016 – December 2016 28
EXPORTS
From January to September 2016, EU commercial vehicle exports markedly increased (+59.5%)
compared to the first three quarters of 2015. Substantial growth was observed in exports to
Cameroon, Norway and especially Hong Kong, the latter mainly driven by the truck segment.
Exports to Australia decelerated in the third quarter, after the uplift observed in the first semester.
Exports to Ukraine, traditionally a key market for EU commercial vehicle trade, are gaining
momentum again, they were up 42.3% compared to the same period last year.
At the same time, exports to the United States (‐56.3%), Turkey (‐19.5%) and Switzerland (‐1.5%)
all declined during this period.
Table 16: Top 10 – Destinations of EU commercial vehicle and bus exports
Trade in volume (units) JAN‐SEP 2016 JAN‐SEP 2015 % change 16/15
WORLD 648,009 406,391 +59.5
HONG KONG 285,041 1,089 ∞
TURKEY 39,816 49,474 ‐19.5
SWITZERLAND 20,963 21,286 ‐1.5
NORWAY 20,660 17,921 +15.3
UNITED STATES 19,451 44,456 ‐56.3
UKRAINE 15,771 11,085 +42.3
NIGERIA 14,670 13,558 +8.2
AUSTRALIA 13,798 13,927 ‐0.9
ISRAEL 10,916 10,570 +3.3
CAMEROON 10,548 3,583 +194.4
Source: EUROSTAT

ACEA Economic and Market Report: Quarter 3 2016 – December 2016 29
ABOUT ACEA
ACEA represents the 15 Europe‐based car, van, truck and bus manufacturers:
BMW Group, DAF Trucks, Daimler, Fiat Chrysler Automobiles, Ford of Europe,
Hyundai Motor Europe, Iveco, Jaguar Land Rover, Opel Group, PSA Group, Renault
Group, Toyota Motor Europe, Volkswagen Group, Volvo Cars, and Volvo Group.
More information can be found on www.acea.be or @ACEA_eu.
ABOUT THE EU AUTOMOBILE INDUSTRY
12.2 million people ‐ or 5.6% of the EU employed population ‐ work in the sector.
The 3.1 million jobs in automotive manufacturing represent 10.4% of EU manufacturing employment.
Motor vehicles account for over €400 billion in tax contributions in the EU15.
The sector is also a key driver of knowledge and innovation, representing Europe's largest private contributor to R&D, with €44.7 billion invested annually.
The automobile industry generates a trade surplus of €100.4 billion for the EU.
European Automobile Manufacturers' Association (ACEA) Avenue des Nerviens 85 | B‐1040 Brussels | www.acea.be T +32 2 732 55 50 | F +32 738 73 10 | [email protected] | @ACEA_eu