Embed Size (px)
Citation preview

Economic and Market Report
EU Automotive Industry Quarter 4 2015
March 2016

ACEA Economic and Market Report: Q4 2015 1
CONTENTS Passenger cars ............................................................................................................................... 2
Registrations ............................................................................................................................. 2
World ..................................................................................................................................... 2
The European Union .............................................................................................................. 5
Production .................................................................................................................................. 7
World ...................................................................................................................................... 7
The European Union ............................................................................................................ 10
Trade ........................................................................................................................................ 11
Imports ................................................................................................................................ 12
Exports ................................................................................................................................. 13
Commercial vehicles .................................................................................................................... 14
Registrations in the EU ............................................................................................................ 14
Global production .................................................................................................................... 19
Trade ....................................................................................................................................... 21
Imports ................................................................................................................................ 22
Exports ................................................................................................................................ 23

ACEA Economic and Market Report: Q4 2015 2
PASSENGER CARS
REGISTRATIONS
WORLD
In 2015, global passenger car demand showed a modest upgrade (+2.0%), totalling 72.8 million
units. This is the result of diverse global demand, with mature markets generally performing well,
while many emerging markets are struggling to maintain car sales momentum despite lower oil
prices.
The EU market continued its positive performance and ended 2015 extremely strongly, thanks to
economic improvement and better macro conditions. With 13.7 million passenger cars sold, results
for the full year were consistently higher (+9.3%) than in 2014. This represents an encouraging
development, although the market is still far from being healthy. In fact, the EU market is
benefiting from a natural recovery, but still needs to catch up for the losses registered after years
of sales decline.
The Russian passenger car market finished 2015 with a sharp decline (‐34.9%), as a result of
geopolitical tensions as well as the economy’s overdependence on oil and gas resources. Likewise,
Ukraine showed a similar trend, posting a double‐digit decline (‐52.5%). Only Turkey ended the
year positively (+21.2%), recovering from last year’s credit crisis. Overall in Europe1, sales increased
(+2.5%), accounting for 22.9% of the global market.
In 2015, the Japanese passenger car market shrank (‐9.9%) compared with 2014, totalling 4.2
million units. This negative performance and weaker domestic demand are mainly the result of the
consumption tax rise in 2014.
The United States closed the year with a positive result (+5.1), although 2015 did not start in a very
encouraging way because of inclement weather. 14.6 million passenger cars were sold in the US
last year, accounting for 20% of the global market.
1 Includes Belarus, Bosnia‐Herzegovina, Kazakhstan, Macedonia, Russia, Serbia, Turkey, Ukraine and
Uzbekistan

ACEA Economic and Market Report: Q4 2015 3
Brazil's passenger car sales saw a decline in 2015 (‐25%), due to high inflation, credit constraints
and low consumer confidence. The Brazilian market contracted by approximately 700,000 units to
2.1 million passenger cars over the year.
Chinese sales have risen in 2015 (+6.5%), also thanks to the government’s deduction of tax on the
purchase of new cars introduced last October. The Chinese market reached almost 20 million units
sold and accounted for more than a quarter of global passenger car sales.
Looking at other emerging markets, South Korean sales rose in 2015 (+10.5%) after a lacklustre
start of the year, benefiting from a temporary reduction in special consumption tax. Indian
passenger car sales increased by 7.2% in 2015, supported by lower oil prices and low inflation.

ACEA Economic and Market Report: Q4 2015 4
Table 2: World new passenger car registrations
20152 2014 % change 15/14 % share 2015
EUROPE 16,681,398 16,269,860 +2.5 22.9
EU3 13,713,526 12,551,204 +9.3 18.8
EFTA 488,498 455,681 +7.2 0.7
RUSSIA 1,513,886 2,327,089 ‐34.9 2.1
TURKEY 712,044 587,331 +21.2 1.0
UKRAINE 43,376 91,225 ‐52.5 0.1
OTHERS‐EUROPE4 210,068 257,330 ‐18.4 0.3
NORTH AMERICA5 17,203,413 16,281,960 +5.7 23.6
Of which the US 14,554,087 13,842,105 +5.1 20.0
SOUTH AMERICA 3,495,103 4,347,437 ‐19.6 4.8
Of which Brazil 2,101,798 2,800,589 ‐25.0 2.9
ASIA 31,384,387 30,390,836 +3.3 43.1
CHINA 19,252,404 18,071,255 +6.5 26.4
JAPAN 4,230,447 4,693,050 ‐9.9 5.8
INDIA 2,787,978 2,600,872 +7.2 3.8
SOUTH KOREA 1,508,707 1,365,350 +10.5 2.1
OTHERS‐ASIA6 3,604,851 3,660,309 ‐1.5 5.0
MIDDLE EAST/AFRICA 4,046,597 4,076,326 ‐0.7 5.6
WORLD 72,810,898 71,366,419 +2.0 100.0
Source: IHS, ACEA
2 Provisional figures
3 Data for Malta not available
4 Includes Belarus, Bosnia‐Herzegovina, Kazakhstan, Macedonia, Serbia and Uzbekistan
5 Based on production type
6 Includes Hong Kong, Taiwan and all the other South Asian countries excluding India

ACEA Economic and Market Report: Q4 2015 5
THE EUROPEAN UNION
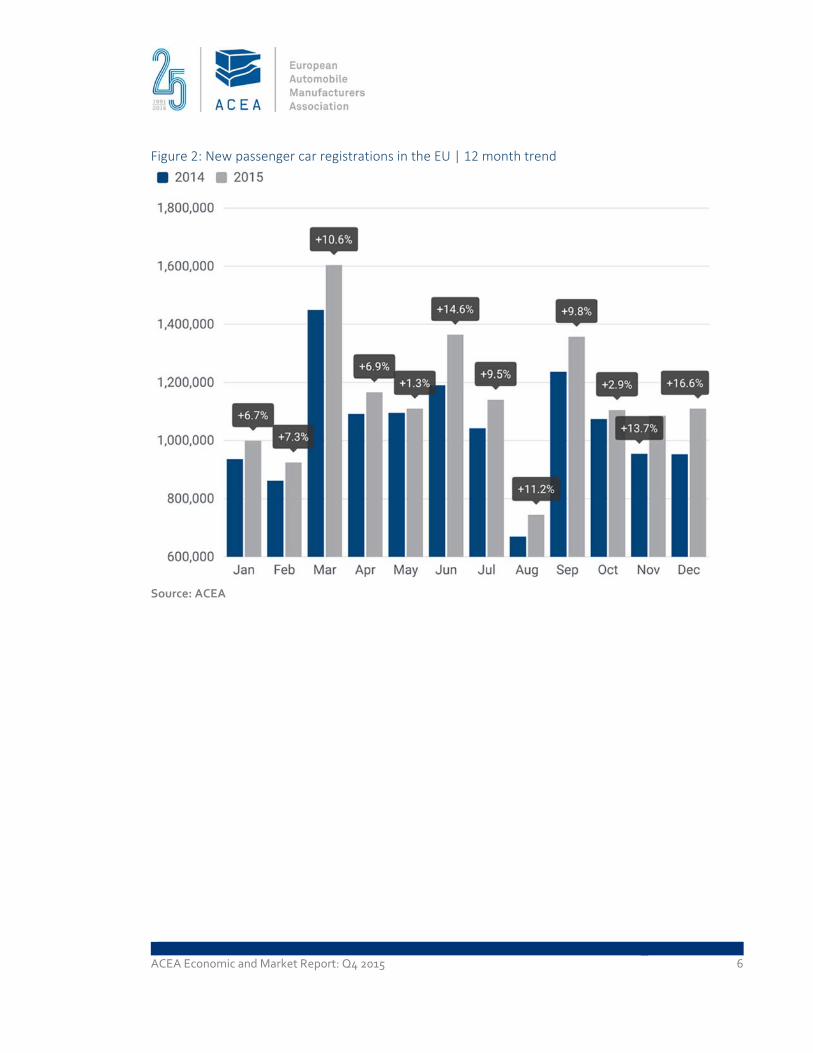
In December 2015, the EU passenger car market posted a very strong uplift (+16.6%), amounting
to 1,109,927 units and marking the 28th consecutive month of growth. This is the highest
percentage increase since the beginning of the positive trend. All major passenger car markets
ended 2015 strongly, contributing significantly to the full‐year positive result. Spain (+20.7%), Italy
(+18.7%) and France (+12.5%) posted double‐digit percentage gains during the month, followed by
the UK (+8.4%) and Germany (+7.7%), which also performed better than in December 2014.
In 2015, new passenger car registrations increased (+9.3%), totalling 13,713,526 units. Nevertheless,
this result is only now passing levels registered in 2010, immediately after the economic crisis. In
other words, the trend is positive but volumes remain low in absolute terms.
Looking at the five major EU markets, Spain (+20.9%) and Italy (+15.8%) saw the strongest growth
in demand during the year, followed by France (+6.8%), the UK (+6.3%) and Germany (+5.6%),
which posted a robust performance in 2015.
Table 3: Top 5 – New passenger car registrations in the EU
2015 2014 % change 15/14
Germany 3,206,042 3,036,773 +5.6
United Kingdom 2,633,503 2,476,435 +6.3
France 1,917,226 1,795,885 +6.8
Italy 1,574,872 1,360,578 +15.8
Spain 1,034,232 855,308 +20.9
EU7 13,713,526 12,551,204 +9.3
Source: ACEA
7 Data for Malta not available
ACEA Economic and Market Report: Q4 2015 6
Figure 2: New passenger car registrations in the EU | 12 month trend
Source: ACEA

ACEA Economic and Market Report: Q4 2015 7
PRODUCTION
WORLD
Production in Europe showed contrasting signals during 2015. On the EU perimeter (+6.2%) and in
Turkey (+2.7%), passenger car production increased. However, production shrank in Russia
(‐28.4%) and Ukraine (‐79.8%) due to geopolitical tensions in the region. As a result, European
passenger car production only showed modest growth in 2015 (+2.0%)
In 2015, US output increased (+2.7%) reaching 9.3 million units, based on the continuing growth of
its domestic demand. Passenger car production in South America, on the other hand, dropped
significantly (‐19.1%) over the year. In Brazil several factors, including high inflation and interest
rates, are affecting production. Brazilian production declined (‐19.8%) in 2015 compared to levels
a year earlier, to a total of less than 2 million passenger cars.
Growth of Chinese passenger car production slowed during the year (+3.8% in 2015, down from
+9.6% registered during the first half of the year), reaching 18.1 million units. However, China
maintained its leading position among passenger car producers, accounting for a quarter of global
production.
Japanese production decreased (‐6.4%) to 7.6 million units in 2015, because of stagnant domestic
sales, following the consumption tax increase in 2014. South Korean production totalled 4.2 million
units last year. This translates into roughly the same outcome (+0.1%) as in 2014.
In 2015, Indian passenger car production increased (+7.3%) to 3.3 million units, largely fuelled by
strong domestic sales and improved economic sentiment following the election of a new
government.
Indonesia’s production remained well below 1 million units, down 14.7% compared to 2014. This
decline in production was primarily due to weakening domestic demand as a result of a slowdown
in economic growth, increasing inflation and high interest rates. Thailand, on the other hand,
showed signs of recovery and ended the year positively (+6.1%), after 2014’s military coup, thanks
to robust export growth.

ACEA Economic and Market Report: Q4 2015 8
Table 4: World passenger car production
20158 2014 % change 15/14 % share 2015
EUROPE 18,084,210 17,723,702 +2.0 24.9
EU 15,873,609 14,952,696 +6.2 21.9
RUSSIA 1,188,724 1,659,352 ‐28.4 1.6
TURKEY 709,741 691,255 +2.7 1.0
UKRAINE 5,595 27,717 ‐79.8 0.0
OTHERS‐EUROPE9 306,541 392,682 ‐21.9 0.4
NORTH AMERICA 14,020,220 13,795,840 +1.6 19.3
Of which the US 9,289,058 9,041,649 +2.7 12.8
SOUTH AMERICA 2,458,949 3,040,161 ‐19.1 3.4
Of which Brazil 1,990,497 2,481,599 ‐19.8 2.7
ASIA 36,349,672 36,024,817 +0.9 50.0
CHINA 18,137,264 17,473,310 +3.8 25.0
JAPAN 7,648,641 8,169,024 ‐6.4 10.5
SOUTH KOREA 4,168,142 4,162,932 +0.1 5.7
INDIA 3,298,267 3,072,610 +7.3 4.5
INDONESIA 854,768 1,001,686 ‐14.7 1.2
THAILAND 890,677 839,195 +6.1 1.2
OTHERS‐ASIA10 1,351,913 1,306,060 +3.5 1.9
MIDDLE EAST/AFRICA 1,729,408 1,455,136 +18.8 2.4
WORLD 72,642,459 72,039,656 +0.8 100.0
Source: IHS
8 Provisional figures
9 Includes Belarus, Kazakhstan, Serbia and Uzbekistan
10 Includes Taiwan, Australia, Malaysia, Pakistan, Philippines and Vietnam

ACEA Economic and Market Report: Q4 2015 9
Figure 3: Top 10 – World passenger car production
Source: IHS

ACEA Economic and Market Report: Q4 2015 10
THE EUROPEAN UNION
In 2015, EU production increased (+6.2%), with almost 16 million passenger cars produced. This
result confirmed the EU’s position as world’s second largest producer after China, accounting for
21.9% of global passenger car production.
Among the main production countries of Western Europe, the UK (+2.8%), Germany (+1.8%) and
France (+2.1%) showed modest growth in 2015, while Spain (+16.5%) and Italy (+53.7%) posted
double‐digit percentage gains, supported by strong domestic demand during the year.
Production in Central European countries, especially in Poland (+17.3%), Hungary (+18.7%) and
Czech Republic (+9.8%), significantly contributed to this output increase in 2015.
Table 5: Top 10 – Passenger car production in the EU
2015 2014 % change 15/14
Germany 5,542,117 5,446,423 +1.8
Spain 2,157,299 1,851,828 +16.5
United Kingdom 1,572,079 1,529,233 +2.8
France 1,486,123 1,455,160 +2.1
Czech Republic 1,241,756 1,131,247 +9.8
Slovakia 888,393 843,023 +5.4
Italy 632,928 411,702 +53.7
Hungary 511,140 430,683 +18.7
Poland 462,732 394,645 +17.3
Romania 381,556 391,425 ‐2.5
EU 15,873,609 14,952,696 +6.2
Source: IHS

ACEA Economic and Market Report: Q4 2015 11
TRADE
In 2015, the EU exported 5.7 million passenger cars worth €129 billion. The value of EU imports
strongly increased (+24.0%) during last year, representing roughly a quarter of the export value
(€32.5 billion).
EU exports also grew in value during this same period, although at a slower pace (+12.3%). This
resulted in an EU trade surplus of €96.6 billion, up (+8.8%) compared to 2014.
Table 6: EU passenger car trade
Trade in value (€m) 2015 2014 % change 15/14
Imports 32,484 26,203 +24.0
Exports 129,112 114,993 +12.3
Trade balance 96,627 88,790 +8.8
Trade in volume (units) 2015 2014 % change 15/14
Imports 2,503,845 2,221,708 +12.7
Exports 5,696,831 5,513,784 +3.3
Source: Eurostat

ACEA Economic and Market Report: Q4 2015 12
IMPORTS
Japan (+15.1%) and the US (+41.3%) accounted for the highest import value for passenger cars in
2015, closely followed by Turkey (+15.8%) and South Korea (+8.0%). Together, these countries
represent more than 70% of the total value of all car imports into the EU.
In 2015, most of the passenger cars imported into the EU came from Turkey (+11.6%), followed by
Japan (+9.2%) and South Korea (+7.7%), the latter making up for its negative performance in the
first part of the year.
Table 7: Origin of most passenger car imports
Trade in value (€m) 2015 2014 % change 15/14
World 32,484 26,203 +24.0
Japan 7,692 6,685 +15.1
United States 6,940 4,911 +41.3
Turkey 5,051 4,363 +15.8
South Korea 4,329 4,009 +8.0
South Africa 2,400 1,208 +98.7
Source: Eurostat
Table 8: Origin of most passenger car imports
Trade in volume (units) 2015 2014 % change 15/14
World 2,503,845 2,221,708 +12.7
Turkey 527,474 472,768 +11.6
Japan 478,881 438,638 +9.2
South Korea 374,726 347,842 +7.7
United States 241,793 235,009 +2.9
Morocco 169,822 152,588 +11.3
Source: Eurostat
ACEA Economic and Market Report: Q4 2015 13
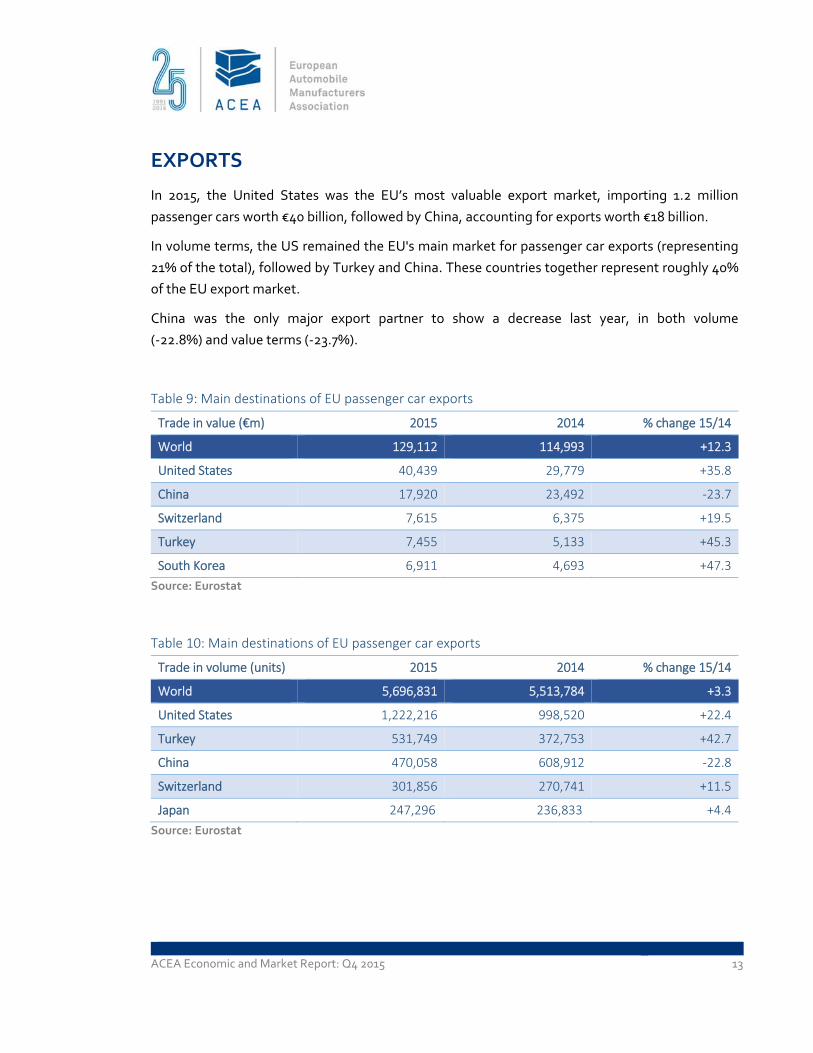
EXPORTS
In 2015, the United States was the EU’s most valuable export market, importing 1.2 million
passenger cars worth €40 billion, followed by China, accounting for exports worth €18 billion.
In volume terms, the US remained the EU's main market for passenger car exports (representing
21% of the total), followed by Turkey and China. These countries together represent roughly 40%
of the EU export market.
China was the only major export partner to show a decrease last year, in both volume
(‐22.8%) and value terms (‐23.7%).
Table 9: Main destinations of EU passenger car exports
Trade in value (€m) 2015 2014 % change 15/14
World 129,112 114,993 +12.3
United States 40,439 29,779 +35.8
China 17,920 23,492 ‐23.7
Switzerland 7,615 6,375 +19.5
Turkey 7,455 5,133 +45.3
South Korea 6,911 4,693 +47.3
Source: Eurostat
Table 10: Main destinations of EU passenger car exports
Trade in volume (units) 2015 2014 % change 15/14
World 5,696,831 5,513,784 +3.3
United States 1,222,216 998,520 +22.4
Turkey 531,749 372,753 +42.7
China 470,058 608,912 ‐22.8
Switzerland 301,856 270,741 +11.5
Japan 247,296 236,833 +4.4
Source: Eurostat

ACEA Economic and Market Report: Q4 2015 14
COMMERCIAL VEHICLES
REGISTRATIONS IN THE EU
In December 2015, EU demand for new commercial vehicles saw a strong increase (+14.8%),
totalling 191,826 units over the month and marking one year of consecutive growth. Growth was
significantly sustained across all commercial vehicle segments. Italy (+23.2%), Spain (+23.0%) and
the UK (+20.3%) ended the year strong by posting double digit percentage gains in December,
followed by France (+9.4%) and Germany (+8.7%).
In 2015, the EU market showed a consistent uplift (+12.4%) and rose for the third year in a row,
exceeding two million commercial vehicles registered (2,079,322). During the year, Spain (+36.4%)
showed the most significant increase, followed by the UK (+16.7%), Italy (+13.2%), Germany
(+4.3%) and France (+3.1%) – all performing better than in 2014.
Table 11: New commercial vehicle registrations in the EU | by type
2015 2014 % change 15/14
LCV ≤ 3,5t 1,713,850 1,535,287 +11.6%
MHCV >3,5t 325,689 280,356 +16.2%
MHBC>3,5t 39,783 33,765 +17.8%
TOTAL CV 2,079,322 1,849,408 +12.4%
Source: ACEA

ACEA Economic and Market Report: Q4 2015 15
Figure 4: Top 10 – New commercial vehicle registrations in the EU | by country
Source: ACEA
+16.7 +3.1
+4.3
+36.4
+13.2
+19.6 +14.4 +13.1+6.3
+5.5
0
50,000
100,000
150,000
200,000
250,000
300,000
350,000
400,000
450,000
2014 2015

ACEA Economic and Market Report: Q4 2015 16
New light commercial vehicles (LCV) up to 3.5 tonnes
In December 2015, new registrations of light commercial vehicles totalled 160,518 units, up
(+13.5%) compared to December 2014. This marked the 28th consecutive month of growth in the
segment. Italy (+23.9%), Spain (+23.8%), the UK (+14.6%), France (+8.7%) and Germany (+5.6%) all
positively contributed to this upturn.
In 2015, 1,713,850 new vans were registered in the EU (+11.6%). All major markets saw their
demand for vans increase over the year, in particular Spain (+36.1%), the UK (+15.6%) and Italy
(+12.4%).
Figure 5: New light commercial vehicle registrations in the EU | 12 month trend
Source: ACEA
+7.4+9.5
+20.5
+11.8
+4.3
+16.3
+4.1
+7.0
+14.0
+7.3+16.7
+13.5
80,000
100,000
120,000
140,000
160,000
180,000
200,000
'14 | '15Jan
'14 | '15Feb
'14 | '15Mar
'14 | '15Apr
'14 | '15May
'14 | '15Jun
'14 | '15Jul
'14 | '15Aug
'14 | '15Sep
'14 | '15Oct
'14 | '15Nov
'14 | '15Dec
Jan‐Dec 2014 Jan‐Dec 2015

ACEA Economic and Market Report: Q4 2015 17
New medium and heavy commercial vehicles (MHCV) over 3.5 tonnes11
In December 2015, new truck registrations in the EU totalled 27,315 units, up (+23.7%) compared to
December 2014. The UK market finished the year strongly (+75.6%) after showing decline in
October. Moreover, Spain (+19.5%), Germany (+19.5%), France (+13.2%) and Italy (+10.1%) saw
significant market upturn at the end of 2015.
In 2015, 325,689 new trucks (+16.2%) were registered in the EU. Looking at the five major markets,
Spain (+38.4%), Poland (+26.6%), the UK (+24.5%) and France (+10.3%) posted the highest
increases over the year, followed by Germany (+4.4%).
Figure 6: New medium and heavy commercial vehicle registrations in the EU | 12 month trend
Source: ACEA
11 Excluding buses & coaches
+6.7
+2.0
+21.2
+15.0+16.1
+31.4
+22.0
+14.7
+17.0
+3.0
+22.9+23.7
15,000
20,000
25,000
30,000
35,000
40,000
'14 | '15Jan
'14 | '15Feb
'14 | '15Mar
'14 | '15Apr
'14 | '15May
'14 | '15Jun
'14 | '15Jul
'14 | '15Aug
'14 | '15Sep
'14 | '15Oct
'14 | '15Nov
'14 | '15Dec
Jan‐Dec 2014 Jan‐Dec 2015

ACEA Economic and Market Report: Q4 2015 18
New medium and heavy buses & coaches (MHBC) over 3.5 tonnes
In December 2015, new bus and coach registrations increased (+11.1%) compared to December
2014, totalling roughly four thousand units. Italy (+79.1%), France (+33.0%), the UK (+32.6%) and
Germany (+11.6%) accounted for a large part of the overall expansion.
In 2015, the EU market increased (+17.8%), totalling 39,783 new buses and coaches. Demand was
primarily driven by Spain (+38.0%), the UK (+27.2%) and France (+24.6%), followed by Italy
(+13.3%) and Germany (+8.6%). Significant growth was also recorded for the Romanian market
(+101.1%).
Figure 7: New medium and heavy bus & coach registrations in the EU | 12 month trend
Source: ACEA
+21.2
+12.2
+33.1
+5.5
+3.8
+28.6
+8.9
+23.1
+29.8
+15.9
+26.3
+11.1
1,500
2,000
2,500
3,000
3,500
4,000
4,500
'14 | '15Jan
'14 | '15Feb
'14 | '15Mar
'14 | '15Apr
'14 | '15May
'14 | '15Jun
'14 | '15Jul
'14 | '15Aug
'14 | '15Sep
'14 | '15Oct
'14 | '15Nov
'14 | '15Dec
Jan‐Dec 2014 Jan‐Dec 2015

ACEA Economic and Market Report: Q4 2015 19
GLOBAL PRODUCTION
In 2015, European12 commercial vehicle production posted substantial growth (+9.2%), reaching
about 3.2 million units, mainly driven by an increase in domestic demand for commercial vehicles,
especially in the van and truck segments. This has been broadly supported by improving economic
conditions in many parts of the Eurozone, which have helped to stimulate confidence. In addition,
as a result of the introduction of the new Euro VI emission regulations at the beginning of the year,
some markets took advantage of scrappage incentives (eg the Spanish government’s PIVE plan to
encourage fleet renewal).
Commercial vehicle production in China13 declined (‐10.8%) to 5.7 million units, mainly influenced
by weak demand in the light commercial vehicle segment. Growth of Japanese production also
decelerated, as domestic sales have been falling since last year’s consumption tax increase. This
resulted in a stable production figure of around 1.7 million units for the whole region14.
South America saw its commercial vehicle production fall (‐11.8%) to about one million units as a
consequence of the region’s economic slowdown and Brazil’s recession.
12 Includes Turkey and CIS countries
13 Includes Hong Kong and Taiwan
14 Includes Japan and South Korea

ACEA Economic and Market Report: Q4 2015 20
Figure 8: World commercial vehicle production | by region
Source: IHS
‐10.8
+4.3
+9.2
‐0.2‐1.8
‐11.8 +1.2
0
1,000,000
2,000,000
3,000,000
4,000,000
5,000,000
6,000,000
7,000,000
Greater China North America Europe South Asia Japan/Korea South America MiddleEast/Africa
2014 2015

ACEA Economic and Market Report: Q4 2015 21
TRADE
In 2015, EU exports of heavy commercial vehicles and buses increased (+2.3%), while the export
value of light commercial vehicles remained stable (+0.9%), worth around €4 billion.
Despite a significant increase in total commercial vehicle and bus imports (+27.7%), the EU’s trade
balance remained positive over the year, with a trade surplus of €3.8 billion.
Table 12: EU commercial vehicles (CV), buses and coaches (BC) trade | by type
Trade in value (€m) CV up to 5t CV over 5t + BC Total CV + BC
2015
Imports 4,963 1,559 6,522
Exports 3,956 6,380 10,336
Trade balance ‐1,007 4,821 3,814
2014
Imports 3,973 1,136 5,108
Exports 3,922 6,236 10,158
Trade balance ‐51 5,100 5,049
% change 15/14
Imports +25.0 +37.3 +27.7
Exports +0.9 +2.3 +1.7
Source: Eurostat

ACEA Economic and Market Report: Q4 2015 22
IMPORTS
Most EU commercial vehicle imports originated from Turkey (+33.5%) in 2015, while China came
second with 129,503 units (+76.6%).
An important increase of commercial vehicle imports from Argentina, Taiwan and India was
observed during the year, while imports from Thailand (‐14.3%) and South Africa (‐1.4%) went
down compared to 2014.
In total, the EU imported 554,830 commercial vehicles, buses and coaches over the year.
Table 13: Top 10 – Origin of EU commercial vehicle and bus imports
Trade in volume (units) 2015 2014 % change 15/14
World 554,830 406,314 +36.6
Turkey 313,545 234,792 +33.5
China 129,503 73,342 +76.6
Thailand 30,665 35,791 ‐14.3
South Africa 18,742 19,005 ‐1.4
Morocco 18,547 16,407 +13.0
United States 8,362 8,255 +1.3
Argentina 6,666 2,541 +162.3
Switzerland 6,117 5,615 +8.9
Taiwan 4,608 201 +2192.5
India 4,562 469 +872.7
Source: Eurostat

ACEA Economic and Market Report: Q4 2015 23
EXPORTS
In 2015, EU commercial vehicle exports to Turkey (+37.5%) and especially to the US (+325.1%) grew,
the latter mainly driven by the buses and coaches segment. At the same time, exports to Algeria,
Nigeria and EFTA countries declined in comparison with 2014.
Ukraine, traditionally a key market for EU commercial vehicle exports, ranked ninth after a decline
of 66.2%, still suffering from the effects of the geopolitical tensions in the region.
Significant growth was observed in exports to Benin and Jordan, contributing to the slight upturn
in EU exports (+0.5%).
Table 14: Top 10 – Destinations of EU commercial vehicle and bus exports
Trade in volume (units) 2015 2014 % change 15/14
World 537,065 534,597 +0.5
Turkey 60,124 43,743 +37.5
United States 49,699 11,692 +325.1
Switzerland 28,827 28,831 ‐0.01
Norway 25,830 26,442 ‐2.3
Australia 23,423 20,329 +15.2
Algeria 19,430 29,143 ‐33.3
Benin 18,854 4,623 +307.8
Nigeria 18,155 24,286 ‐25.2
Ukraine 17,076 50,524 ‐66.2
Jordan 14,558 7,061 +106.2
Source: Eurostat

ACEA Economic and Market Report: Q4 2015 24
ABOUT ACEA
ACEA’s members are BMW Group, DAF Trucks, Daimler, Fiat Chrysler Automobiles,
Ford of Europe, Hyundai Motor Europe, Iveco, Jaguar Land Rover, Opel Group, PSA
Peugeot Citroën, Renault Group, Toyota Motor Europe, Volkswagen Group, Volvo Cars,
Volvo Group. More information can be found on www.acea.be.
ABOUT THE EU AUTOMOBILE INDUSTRY
Some 12.1 million people ‐ or 5.6% of the EU employed population ‐ work in the
sector.
The 3.1 million jobs in automotive manufacturing represent 10.4% of EU's
manufacturing employment.
Motor vehicles account for €396 billion in tax contribution in the EU15.
The sector is also a key driver of knowledge and innovation, representing
Europe's largest private contributor to R&D, with €41.5 billion invested annually.
European Automobile Manufacturers' Association – ACEA Avenue des Nerviens 85 | B‐1040 Brussels | www.acea.be T +32 2 732 55 50 | M +32 485 886 647 | F +32 738 73 10 | [email protected] | @ACEA_eu