Embed Size (px)
Citation preview
Economic and Market Report
EU Automotive Industry Quarter 3 2017
December 2017
ACEA Economic and Market Report: Quarter 3 2017 – December 2017 1
CONTENTS EU economic outlook .................................................................................................................... 2
Passenger cars ............................................................................................................................... 4
Registrations ............................................................................................................................. 4
World ..................................................................................................................................... 4
The European Union .............................................................................................................. 6
Passenger car registrations by fuel type ............................................................................. 8
Production ................................................................................................................................ 11
World .................................................................................................................................... 11
The European Union ............................................................................................................. 14
Trade ........................................................................................................................................ 15
Imports ................................................................................................................................. 16
Exports ................................................................................................................................. 17
Commercial vehicles..................................................................................................................... 18
Registrations in the EU ............................................................................................................. 18
New light commercial vehicles (LCV) up to 3.5 tonnes ..................................................... 20
New medium and heavy commercial vehicles (MHCV) over 3.5 tonnes ............................. 21
New medium and heavy buses and coaches (MHBC) over 3.5 tonnes ............................... 22
Global production outlook ........................................................................................................ 23
Trade ........................................................................................................................................25
Imports ................................................................................................................................ 26
Exports ................................................................................................................................. 27

ACEA Economic and Market Report: Quarter 3 2017 – December 2017 2
EU ECONOMIC OUTLOOK
So far this year, the EU economy has performed significantly better than expected. The 2.3%
increase in GDP marks the highest growth rate in 10 years. In its Autumn Forecast, the European
Commission said to expect more moderate GDP growth of around 2.1% in 2018 and 1.9% in 2019.
However, it should be noted that next year’s projections will be affected by the outcome of the
ongoing Brexit negotiations between the EU27 and the United Kingdom.
Figure 1: EU GDP growth forecast (in %)
SOURCE: EUROPEAN COMMISSION, DG ECFIN
ACEA Economic and Market Report: Quarter 3 2017 – December 2017 3
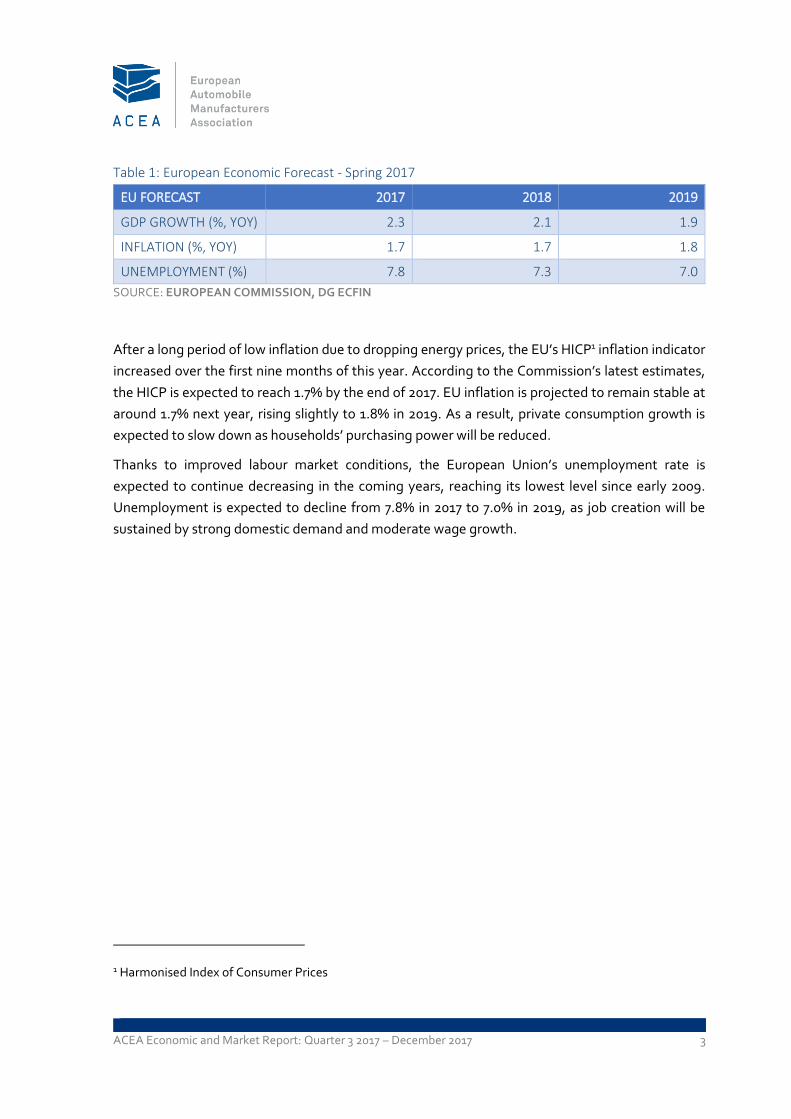
Table 1: European Economic Forecast - Spring 2017
EU FORECAST 2017 2018 2019
GDP GROWTH (%, YOY) 2.3 2.1 1.9
INFLATION (%, YOY) 1.7 1.7 1.8
UNEMPLOYMENT (%) 7.8 7.3 7.0
SOURCE: EUROPEAN COMMISSION, DG ECFIN
After a long period of low inflation due to dropping energy prices, the EU’s HICP1 inflation indicator
increased over the first nine months of this year. According to the Commission’s latest estimates,
the HICP is expected to reach 1.7% by the end of 2017. EU inflation is projected to remain stable at
around 1.7% next year, rising slightly to 1.8% in 2019. As a result, private consumption growth is
expected to slow down as households’ purchasing power will be reduced.
Thanks to improved labour market conditions, the European Union’s unemployment rate is
expected to continue decreasing in the coming years, reaching its lowest level since early 2009.
Unemployment is expected to decline from 7.8% in 2017 to 7.0% in 2019, as job creation will be
sustained by strong domestic demand and moderate wage growth.
1 Harmonised Index of Consumer Prices

ACEA Economic and Market Report: Quarter 3 2017 – December 2017 4
PASSENGER CARS
REGISTRATIONS
WORLD
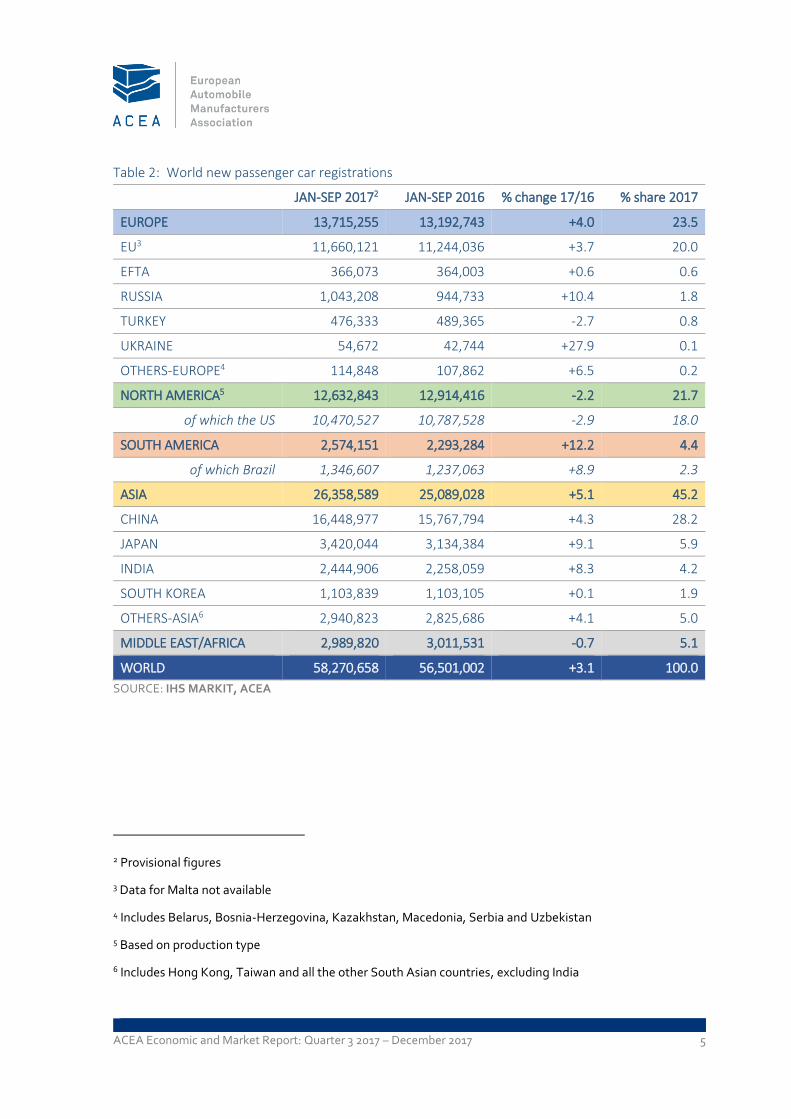
From January to September 2017, passenger car registrations across the European continent
increased by 4.0% to 13.7 million units. After a strong start of the year, registrations in the European
Union slowed during the second and the third quarter of 2017. With 11.7 million passenger cars sold
so far, EU results were 3.7% higher than in the same period last year.
Three quarters into the year, the Russian market continued to show signs of recovery with
passenger car registrations going up by 10.4%. Ukraine maintained the positive momentum from
the first half of 2017, recording a substantial increase in demand for cars (+27.9%). The Turkish
market showed some signs of improvement, going from -9.6% in the first semester of 2017 to -2.7%
over the first nine months of the year.
So far in 2017, Japanese registrations were up 9.1% compared to 2016, with domestic demand
improving after the government decided to delay a hike in consumption tax to October 2019. Car
sales in South Korea remained stable compared to last year.
In the United States, car volumes went down by 2.9% during the first nine months of 2017, totalling
about 10.5 million vehicles sold and representing 18% of the global market.
Through the first three quarters of 2017, passenger car demand in South America continued to
recover (+12.2%) following significant losses last year. Brazilian sales also increased (+8.9%) after a
negative start of the year, with consumers having easier access to credit for automotive purchases
(lending constraints held back vehicle demand in Brazil over the past two years).
16 million passenger cars were sold in China over the first nine months of 2017, up 4.3% when
compared to the same period last year and accounting for 28.2% of global passenger car sales.
Around the world, 58 million passenger cars were sold so far in 2017, 3.1% more than last year.
ACEA Economic and Market Report: Quarter 3 2017 – December 2017 5
Table 2: World new passenger car registrations
JAN-SEP 20172 JAN-SEP 2016 % change 17/16 % share 2017
EUROPE 13,715,255 13,192,743 +4.0 23.5
EU3 11,660,121 11,244,036 +3.7 20.0
EFTA 366,073 364,003 +0.6 0.6
RUSSIA 1,043,208 944,733 +10.4 1.8
TURKEY 476,333 489,365 -2.7 0.8
UKRAINE 54,672 42,744 +27.9 0.1
OTHERS-EUROPE4 114,848 107,862 +6.5 0.2
NORTH AMERICA5 12,632,843 12,914,416 -2.2 21.7
of which the US 10,470,527 10,787,528 -2.9 18.0
SOUTH AMERICA 2,574,151 2,293,284 +12.2 4.4
of which Brazil 1,346,607 1,237,063 +8.9 2.3
ASIA 26,358,589 25,089,028 +5.1 45.2
CHINA 16,448,977 15,767,794 +4.3 28.2
JAPAN 3,420,044 3,134,384 +9.1 5.9
INDIA 2,444,906 2,258,059 +8.3 4.2
SOUTH KOREA 1,103,839 1,103,105 +0.1 1.9
OTHERS-ASIA6 2,940,823 2,825,686 +4.1 5.0
MIDDLE EAST/AFRICA 2,989,820 3,011,531 -0.7 5.1
WORLD 58,270,658 56,501,002 +3.1 100.0
SOURCE: IHS MARKIT, ACEA
2 Provisional figures
3 Data for Malta not available
4 Includes Belarus, Bosnia-Herzegovina, Kazakhstan, Macedonia, Serbia and Uzbekistan
5 Based on production type
6 Includes Hong Kong, Taiwan and all the other South Asian countries, excluding India
ACEA Economic and Market Report: Quarter 3 2017 – December 2017 6
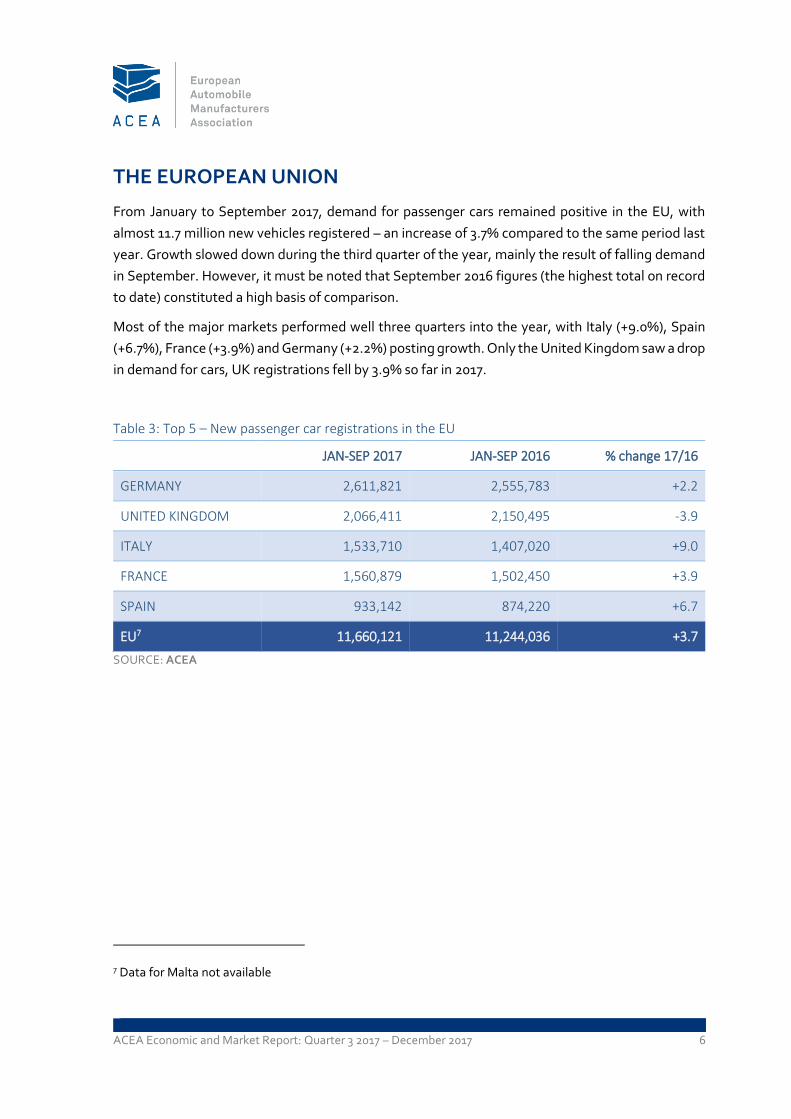
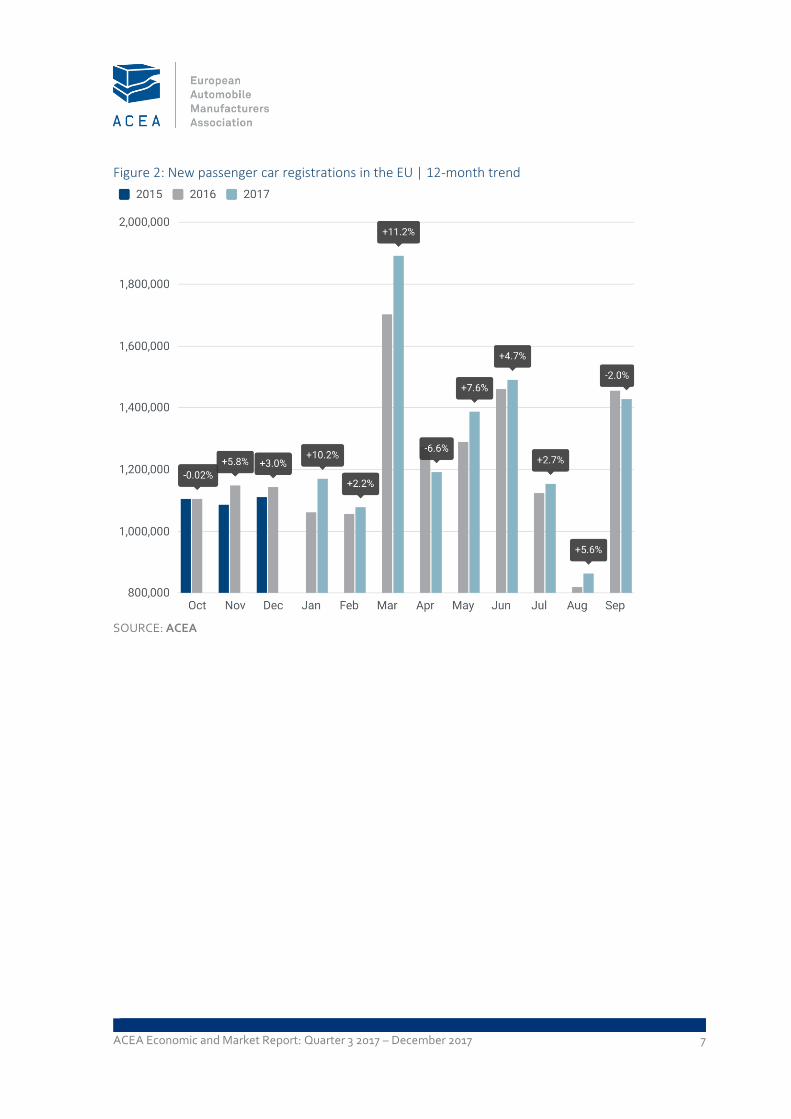
THE EUROPEAN UNION
From January to September 2017, demand for passenger cars remained positive in the EU, with
almost 11.7 million new vehicles registered – an increase of 3.7% compared to the same period last
year. Growth slowed down during the third quarter of the year, mainly the result of falling demand
in September. However, it must be noted that September 2016 figures (the highest total on record
to date) constituted a high basis of comparison.
Most of the major markets performed well three quarters into the year, with Italy (+9.0%), Spain
(+6.7%), France (+3.9%) and Germany (+2.2%) posting growth. Only the United Kingdom saw a drop
in demand for cars, UK registrations fell by 3.9% so far in 2017.
Table 3: Top 5 – New passenger car registrations in the EU
JAN-SEP 2017 JAN-SEP 2016 % change 17/16
GERMANY 2,611,821 2,555,783 +2.2
UNITED KINGDOM 2,066,411 2,150,495 -3.9
ITALY 1,533,710 1,407,020 +9.0
FRANCE 1,560,879 1,502,450 +3.9
SPAIN 933,142 874,220 +6.7
EU7 11,660,121 11,244,036 +3.7
SOURCE: ACEA
7 Data for Malta not available
ACEA Economic and Market Report: Quarter 3 2017 – December 2017 7
Figure 2: New passenger car registrations in the EU | 12-month trend
SOURCE: ACEA

ACEA Economic and Market Report: Quarter 3 2017 – December 2017 8
Passenger car registrations by fuel type
Over the first nine months of 2017, registrations of alternative fuel vehicles (AFVs) in the European
Union continued to show robust growth, with demand increasing by 42.1% compared to last year.
629,228 alternatively-powered cars were registered over this period, accounting for 5.6% of total
passenger car sales. Electrically-chargeable vehicles (ECVs) made up for 1.4% of all cars sold across
the EU during the first three quarters of the year.
Growth was largely sustained across all segments: registrations of hybrid, battery and plug-in
electric cars accounted for the highest percentage gains, going up by 60.6%, 53.1% and 36.4%
respectively. Demand for new cars powered by natural gas and LPG was 13.0% higher than last year.
These percentage increases are impressive, but mainly because they are coming from a low base.
When looking at the relative numbers, the market share of alternative fuel vehicles remains small.
Table 4: New passenger car registrations in the EU by alternative fuel type
JAN-SEP 2017 JAN-SEP 2016 % change 17/16
ECV8 152,694 106,305 +43.6
Of which BEV 70,541 46,065 +53.1
Of which PHEV 79,409 58,198 +36.4
HEV9 324,678 202,198 +60.6
Other AFV10 151,856 134,422 +13.0
Total AFV 629,228 442,925 +42.1
SOURCE: ACEA
8 Electrically-chargeable vehicles (ECV): battery electric (BEV), extended-range electric (EREV), fuel cell
electric (FCEV) and plug-in hybrid electric vehicles (PHEV)
9 Hybrid electric vehicles (HEV): full and mild hybrids
10 Alternative fuel vehicles other than electric: natural gas (NGV), LPG-fuelled and ethanol (E85) vehicles

ACEA Economic and Market Report: Quarter 3 2017 – December 2017 9
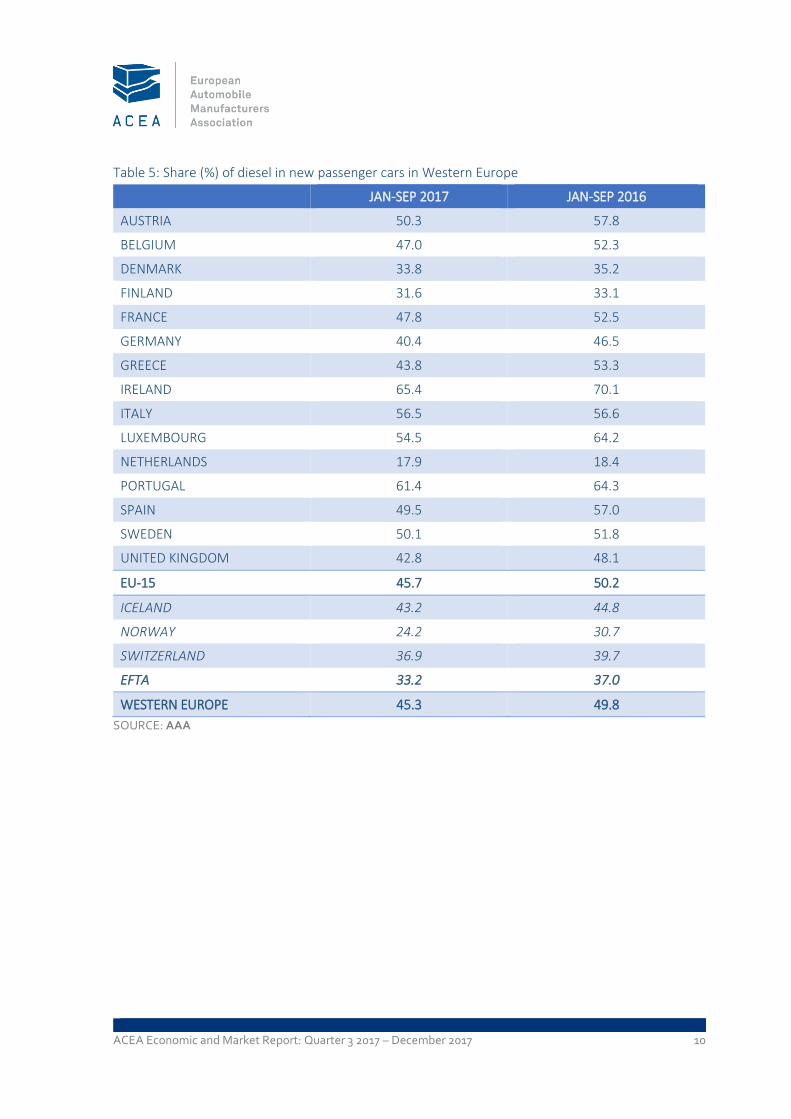
So far in 2017, about 45% of all new passenger cars registered in Western Europe ran on diesel;
around four percentage points lower than in the same period last year.
In the EU-15, diesel’s market share fell from 50.2% to 45.7% of total car registrations. However, this
drop was almost completely offset by an increase in the sale of petrol cars. Petrol vehicles are now
the most sold car type in the EU-15, accounting for 48.7% of new passenger car sales – alternatively-
powered cars make up for 5.6% of the market.
The market share of diesel contracted in all Western European countries, and in Austria, Greece,
Luxembourg and Spain in particular. Ireland remains the country with the highest diesel market
share (65%), followed by Portugal and Italy.
Figure 3: New passenger car in the EU-15 by fuel type, % share | JAN-SEP 2017
SOURCE: ACEA, AAA
ACEA Economic and Market Report: Quarter 3 2017 – December 2017 10
Table 5: Share (%) of diesel in new passenger cars in Western Europe
JAN-SEP 2017 JAN-SEP 2016
AUSTRIA 50.3 57.8
BELGIUM 47.0 52.3
DENMARK 33.8 35.2
FINLAND 31.6 33.1
FRANCE 47.8 52.5
GERMANY 40.4 46.5
GREECE 43.8 53.3
IRELAND 65.4 70.1
ITALY 56.5 56.6
LUXEMBOURG 54.5 64.2
NETHERLANDS 17.9 18.4
PORTUGAL 61.4 64.3
SPAIN 49.5 57.0
SWEDEN 50.1 51.8
UNITED KINGDOM 42.8 48.1
EU-15 45.7 50.2
ICELAND 43.2 44.8
NORWAY 24.2 30.7
SWITZERLAND 36.9 39.7
EFTA 33.2 37.0
WESTERN EUROPE 45.3 49.8
SOURCE: AAA

ACEA Economic and Market Report: Quarter 3 2017 – December 2017 11
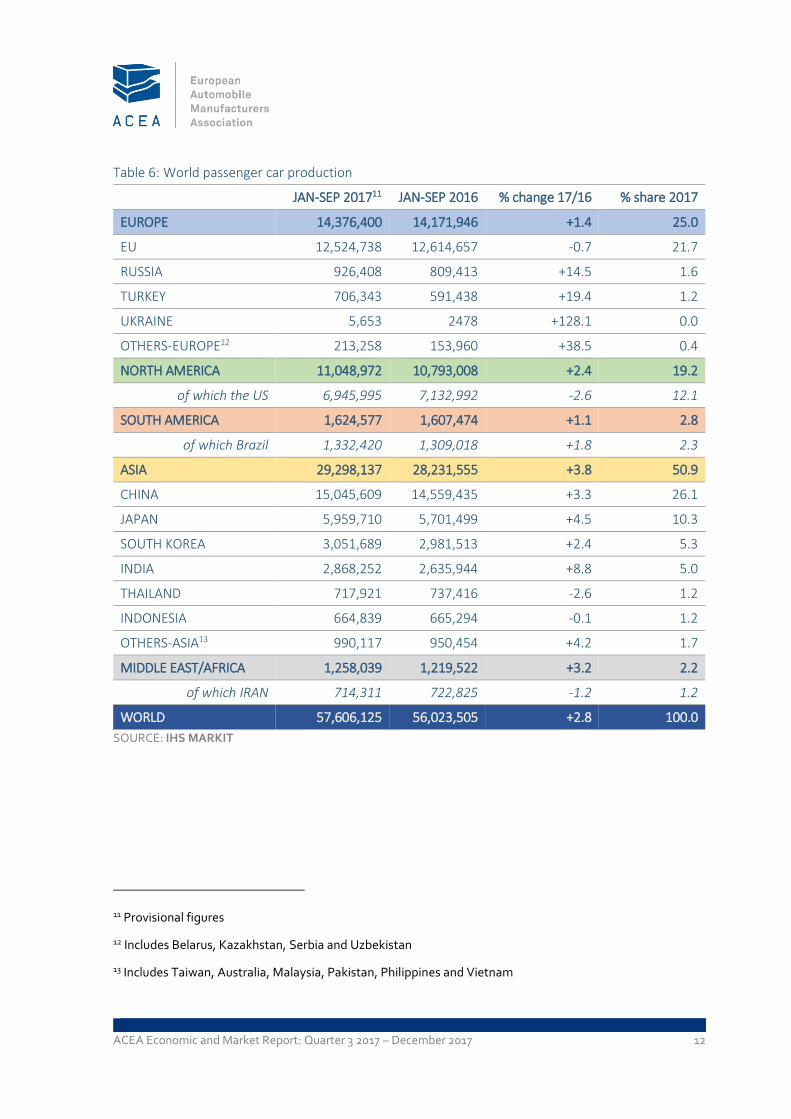
PRODUCTION
WORLD
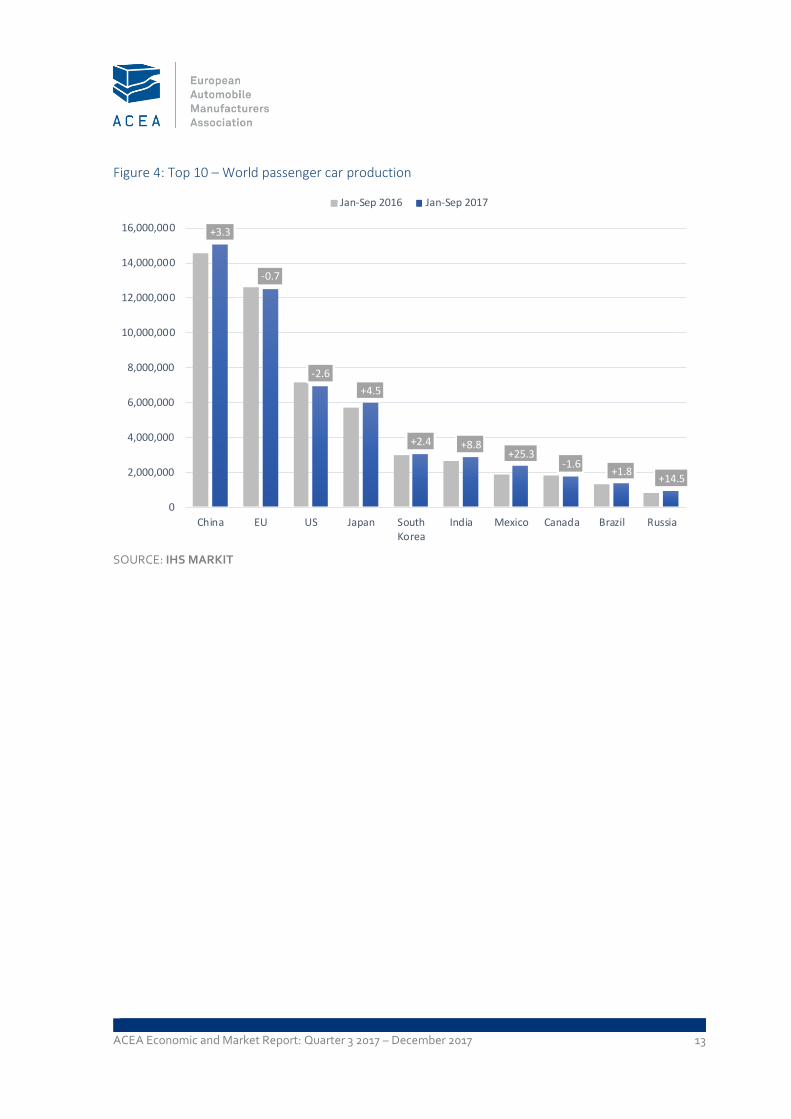
European car production grew only modestly over the first three quarters of 2017, output was 1.4%
higher than one year ago. Growth was largely driven by the recovery of production in Eastern
Europe and especially Ukraine (+128.1%). Passenger car production also increased in Turkey and
Russia, going up 19.4% and 14.5% respectively.
So far in 2017, production in the United States declined slightly (-2.6%) as domestic car demand
slowed down. Total US output amounted to about 7 million units, representing 12% of global car
production.
Passenger car production in South America recovered somewhat during the first nine months of
2017 (+1.1%), with more than 1.6 million units built in total. Brazil’s increasing domestic demand was
the main driver of this trend, with Brazilian production accounting for more than 82% of the region’s
output.
Chinese production grew moderately (+3.3%) so far this year, reaching a total of 15 million cars.
Compared to the first quarter, production growth slowed down considerably – mainly the effect of
taxation measures that will enter into force at the end of the year, which are affecting domestic
demand already now. Nevertheless, China maintained its leading position among global passenger
car producers, accounting for more than 26% of worldwide production.
Japanese output increased by 4.5% over the first nine months of 2017, reaching roughly 6 million
cars produced in total. Production also grew in South Korea, although at a more modest pace
(+2.4%), mainly because of 2016’s low base effect.
Indian output growth remained strong (+8.8%), 2.9 million passenger cars were built over the first
three quarters of the year. Car production in Thailand and Indonesia, on the other hand, contracted
slightly, although less strong than during the first semester of the year.
Globally, 57.6 million passenger cars have been produced nine months int0 2017, 2.8% more than in
the same period last year.
ACEA Economic and Market Report: Quarter 3 2017 – December 2017 12
Table 6: World passenger car production
JAN-SEP 201711 JAN-SEP 2016 % change 17/16 % share 2017
EUROPE 14,376,400 14,171,946 +1.4 25.0
EU 12,524,738 12,614,657 -0.7 21.7
RUSSIA 926,408 809,413 +14.5 1.6
TURKEY 706,343 591,438 +19.4 1.2
UKRAINE 5,653 2478 +128.1 0.0
OTHERS-EUROPE12 213,258 153,960 +38.5 0.4
NORTH AMERICA 11,048,972 10,793,008 +2.4 19.2
of which the US 6,945,995 7,132,992 -2.6 12.1
SOUTH AMERICA 1,624,577 1,607,474 +1.1 2.8
of which Brazil 1,332,420 1,309,018 +1.8 2.3
ASIA 29,298,137 28,231,555 +3.8 50.9
CHINA 15,045,609 14,559,435 +3.3 26.1
JAPAN 5,959,710 5,701,499 +4.5 10.3
SOUTH KOREA 3,051,689 2,981,513 +2.4 5.3
INDIA 2,868,252 2,635,944 +8.8 5.0
THAILAND 717,921 737,416 -2.6 1.2
INDONESIA 664,839 665,294 -0.1 1.2
OTHERS-ASIA13 990,117 950,454 +4.2 1.7
MIDDLE EAST/AFRICA 1,258,039 1,219,522 +3.2 2.2
of which IRAN 714,311 722,825 -1.2 1.2
WORLD 57,606,125 56,023,505 +2.8 100.0
SOURCE: IHS MARKIT
11 Provisional figures
12 Includes Belarus, Kazakhstan, Serbia and Uzbekistan
13 Includes Taiwan, Australia, Malaysia, Pakistan, Philippines and Vietnam
ACEA Economic and Market Report: Quarter 3 2017 – December 2017 13
Figure 4: Top 10 – World passenger car production
SOURCE: IHS MARKIT
+3.3
-0.7
-2.6
+4.5
+2.4 +8.8+25.3
-1.6+1.8
+14.5
0
2,000,000
4,000,000
6,000,000
8,000,000
10,000,000
12,000,000
14,000,000
16,000,000
China EU US Japan SouthKorea
India Mexico Canada Brazil Russia
Jan-Sep 2016 Jan-Sep 2017
ACEA Economic and Market Report: Quarter 3 2017 – December 2017 14
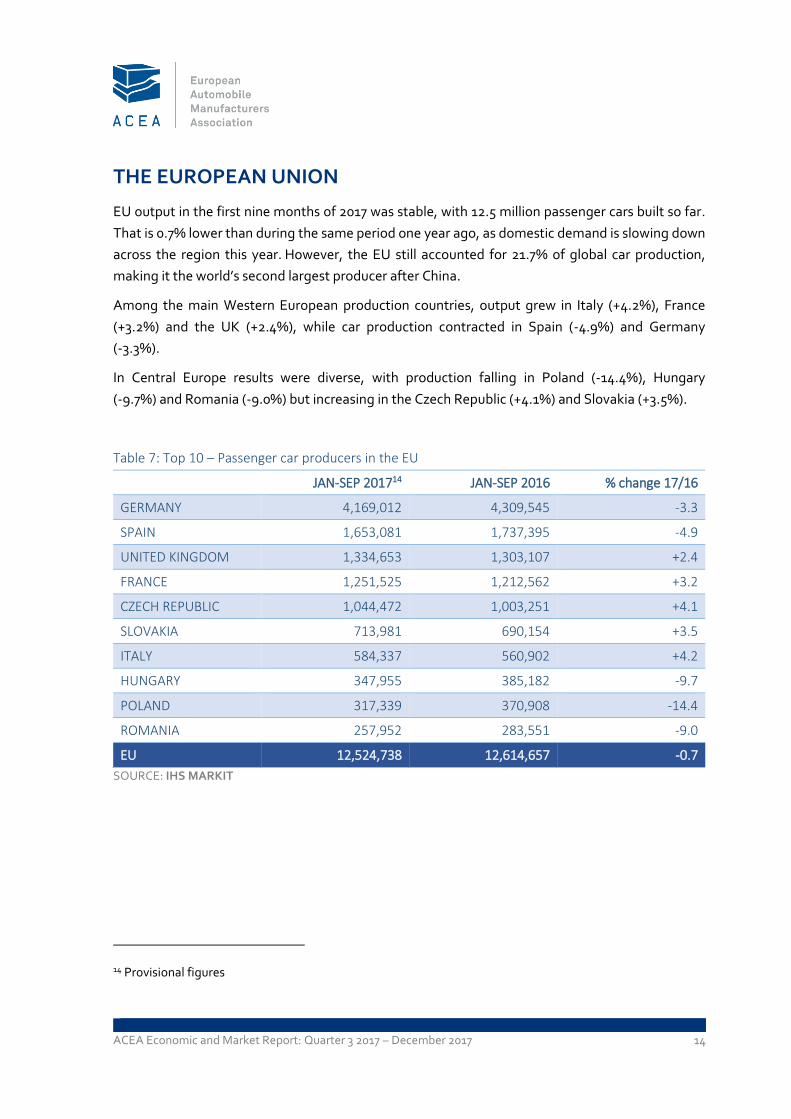
THE EUROPEAN UNION
EU output in the first nine months of 2017 was stable, with 12.5 million passenger cars built so far.
That is 0.7% lower than during the same period one year ago, as domestic demand is slowing down
across the region this year. However, the EU still accounted for 21.7% of global car production,
making it the world’s second largest producer after China.
Among the main Western European production countries, output grew in Italy (+4.2%), France
(+3.2%) and the UK (+2.4%), while car production contracted in Spain (-4.9%) and Germany
(-3.3%).
In Central Europe results were diverse, with production falling in Poland (-14.4%), Hungary
(-9.7%) and Romania (-9.0%) but increasing in the Czech Republic (+4.1%) and Slovakia (+3.5%).
Table 7: Top 10 – Passenger car producers in the EU
JAN-SEP 201714 JAN-SEP 2016 % change 17/16
GERMANY 4,169,012 4,309,545 -3.3
SPAIN 1,653,081 1,737,395 -4.9
UNITED KINGDOM 1,334,653 1,303,107 +2.4
FRANCE 1,251,525 1,212,562 +3.2
CZECH REPUBLIC 1,044,472 1,003,251 +4.1
SLOVAKIA 713,981 690,154 +3.5
ITALY 584,337 560,902 +4.2
HUNGARY 347,955 385,182 -9.7
POLAND 317,339 370,908 -14.4
ROMANIA 257,952 283,551 -9.0
EU 12,524,738 12,614,657 -0.7
SOURCE: IHS MARKIT
14 Provisional figures

ACEA Economic and Market Report: Quarter 3 2017 – December 2017 15
TRADE
From January to September 2017, EU car exports increased compared to a year ago, both in value
(+2.3%) and in volume terms (+4.7%). The European Union exported some 4.2 million passenger
cars, worth around €94.5 billion in total.
Passenger car imports also increased over the same period, totalling 2.3 million units. They went up
by 9.5% compared to 2016, resulting in a trade surplus of about €64.6 billion – slightly more than
one year ago (+0.1%).
Table 8: EU passenger car trade
Trade in value (€m) JAN-SEP 2017 JAN-SEP 2016 % change 17/16
IMPORTS 29,874 27,779 +7.5
EXPORTS 94,519 92,362 +2.3
TRADE BALANCE 64,644 64,583 +0.1
Trade in volume (units) JAN-SEP 2017 JAN-SEP 2016 % change 17/16
IMPORTS 2,282,445 2,084,231 +9.5
EXPORTS 4,195,727 4,009,484 +4.7
SOURCE: EUROSTAT

ACEA Economic and Market Report: Quarter 3 2017 – December 2017 16
IMPORTS
During the first three quarters of the year, EU imports from Turkey and South Korea increased
considerably, both in value (respectively +29.4% and +16.1%) and volume terms (up 22.5% and
13.8%), although at a lower rate than in the first semester.
At the same time, imports from Japan and the United States declined – especially in value terms,
going down 16.1% and 14.9%. In total, the EU imported some 2.8 million passenger cars so far in
2017, worth almost €30 billion.
Table 9: Origin of most passenger car imports
Trade in value (€m) JAN-SEP 2017 JAN-SEP 2016 % change 17/16
WORLD 29,874 27,779 +7.5
JAPAN 5,719 6,816 -16.1
TURKEY 5,658 4,372 +29.4
UNITED STATES 4,642 5,454 -14.9
SOUTH KOREA 4,176 3,598 +16.1
MEXICO 3,027 1,482 + 104.3
SOURCE: EUROSTAT
Table 10: Origin of most passenger car imports
Trade in volume (units) JAN-SEP 2017 JAN-SEP 2016 % change 17/16
WORLD 2,282,445 2,084,231 +9.5
TURKEY 551,776 450,611 +22.5
JAPAN 406,596 423,244 -3.9
SOUTH KOREA 348,509 306,261 +13.8
UNITED STATES 174,497 190,936 -8.6
MOROCCO 169,765 137,454 +23.5
SOURCE: EUROSTAT

ACEA Economic and Market Report: Quarter 3 2017 – December 2017 17
EXPORTS
The United States remained the EU's most valuable export market for passenger cars so far in 2017,
with exports roughly amounting to €27 billion – 0.9% more than during the same period last year.
However, EU car exports to the US did decline slightly in volume terms, going down 2.2%.
The value of EU exports to Japan and China increased significantly, respectively by +11.2% and
+9.9%. Strong growth was also observed in EU export volumes to Nigeria, which were 164.0%
higher than last year. By contrast, car exports to Turkey dropped significantly, both in volume (-
22.1%) and in value (-25.9%) during the same period.
Table 11: Main destinations of EU passenger car exports
Trade in value (€m) JAN-SEP 2017 JAN-SEP 2016 % change 17/16
WORLD 94,519 92,362 +2.3
UNITED STATES 27,398 27,143 +0.9
CHINA 16,360 14,714 +11.2
JAPAN 5,940 5,405 +9.9
SWITZERLAND 5,508 5,374 +2.5
TURKEY 4,528 6,112 -25.9
SOURCE: EUROSTAT
Table 12: Main destinations of EU passenger car exports
Trade in volume (units) JAN-SEP 2017 JAN-SEP 2016 % change 17/16
WORLD 4,195,727 4,009,484 +4.7
UNITED STATES 828,846 847,104 -2.2
CHINA 425,075 359,477 +18.3
TURKEY 321,249 412,259 -22.1
NIGERIA 239,212 90,627 +164.0
SWITZERLAND 204,068 209,176 -2.4
SOURCE: EUROSTAT

ACEA Economic and Market Report: Quarter 3 2017 – December 2017 18
COMMERCIAL VEHICLES
REGISTRATIONS IN THE EU
Over nine months in 2017, demand for new commercial vehicles remained positive in the EU, with
almost 1.8 million new vehicles registered – up 3.3% compared to one year ago. Registrations
increased in July (+4.0%) but remained more or less stable in August (-0.03%) and September
(+0.6%).
Growth was sustained across all segments, but demand was especially strong for new light
commercial vehicles (+4.0%) – with vans accounting for more than 80% of total commercial vehicle
sales.
Most of the major markets performed better than in the same period last year. Spain continued to
drive growth (+14.4%), followed by France (+6.5%), Germany (+2.2%) and Italy (+1.6%). However,
registrations declined in the United Kingdom by 3.0% so far.
Table 13: New commercial vehicle registrations in the EU | by type
JAN-SEP 2017 JAN-SEP 2016 % change 17/16
LCV ≤ 3,5t15 1,479,060 1,422,623 +4.0%
MHCV > 3,5t16 271,475 270,977 +0.2%
MHBC > 3,5t17 30,297 29,579 +2.4%
TOTAL CV 1,780,832 1,723,179 +3.3%
SOURCE: ACEA
15 New light commercial vehicles (LCV) up to 3.5 tonnes
16 New medium and heavy commercial vehicles (MHCV) over 3.5 tonnes
17 New medium and heavy buses and coaches (MHBC) over 3.5 tonnes

ACEA Economic and Market Report: Quarter 3 2017 – December 2017 19
Figure 5: New commercial vehicle registrations in the five big EU markets
SOURCE: ACEA
FRANCEUNITED
KINGDOMGERMANY SPAIN ITALY
JAN-SEP 2016 339,471 337,003 264,790 145,838 147,975
JAN-SEP 2017 361,487 326,903 270,541 166,890 150,365
+6.5%
-3.0%
+2.2%
+14.4%+1.6%
0
50,000
100,000
150,000
200,000
250,000
300,000
350,000
400,000
JAN-SEP 2016 JAN-SEP 2017
ACEA Economic and Market Report: Quarter 3 2017 – December 2017 20
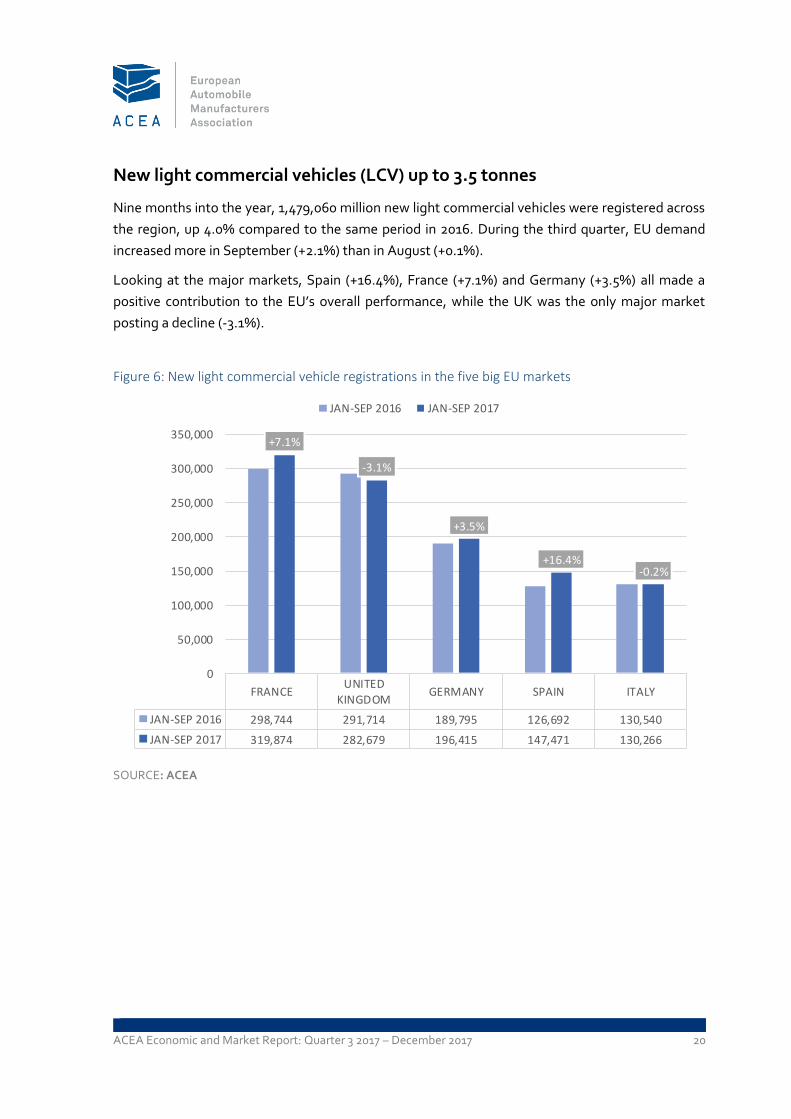
New light commercial vehicles (LCV) up to 3.5 tonnes
Nine months into the year, 1,479,060 million new light commercial vehicles were registered across
the region, up 4.0% compared to the same period in 2016. During the third quarter, EU demand
increased more in September (+2.1%) than in August (+0.1%).
Looking at the major markets, Spain (+16.4%), France (+7.1%) and Germany (+3.5%) all made a
positive contribution to the EU’s overall performance, while the UK was the only major market
posting a decline (‐3.1%).
Figure 6: New light commercial vehicle registrations in the five big EU markets
SOURCE: ACEA
FRANCEUNITED
KINGDOMGERMANY SPAIN ITALY
JAN-SEP 2016 298,744 291,714 189,795 126,692 130,540
JAN-SEP 2017 319,874 282,679 196,415 147,471 130,266
+7.1%
-3.1%
+3.5%
+16.4%-0.2%
0
50,000
100,000
150,000
200,000
250,000
300,000
350,000
JAN-SEP 2016 JAN-SEP 2017

ACEA Economic and Market Report: Quarter 3 2017 – December 2017 21
New medium and heavy commercial vehicles (MHCV) over 3.5 tonnes18
From January to September 2017, 271,475 new trucks were registered in the EU, a rather stable
result compared to last year (+0.2%) – mainly due to a slowdown in demand for new trucks in August
and September 2017 (-3.1% and -6.5% respectively).
Results were diverse among the five big markets, with Italy (+12.2%) and France (+4.2%) performing
very well but registrations declining in the United Kingdom and Germany (‐0.7% and ‐1.6%
respectively).
Figure 7: New medium and heavy commercial vehicle registrations in the five big EU markets
SOURCE: ACEA
18 Excluding buses & coaches
GERMANYUNITED
KINGDOMFRANCE ITALY SPAIN
JAN-SEP 2016 70,486 38,518 35,609 15,608 16,788
JAN-SEP 2017 69,337 38,246 37,092 17,509 16,775
-1.6%
-0.7% +4.2%
+12.2% -0.1%
0
10,000
20,000
30,000
40,000
50,000
60,000
70,000
80,000
JAN-SEP 2016 JAN-SEP 2017

ACEA Economic and Market Report: Quarter 3 2017 – December 2017 22
New medium and heavy buses and coaches (MHBC) over 3.5 tonnes
Over nine months in 2017, the EU bus and coach market grew modestly (+2.4%), counting 30,297
new vehicles registered.
Demand decreased in the United Kingdom and France (both -11.7%), while new bus and coach
registrations posted double‐digit gains in Italy (+41.8%) and Spain (+12.1%).
Figure 8: Top 5 – New medium and heavy bus and coach registrations in the EU | by country
SOURCE: ACEA
UNITED
KINGDOMGERMANY FRANCE SPAIN ITALY
JAN-SEP 2016 6,771 4,509 5,118 2,358 1,827
JAN-SEP 2017 5,978 4,789 4,521 2,644 2,590
-11.7%
+6.2%-11.7%
+12.1% +41.8%
0
1,000
2,000
3,000
4,000
5,000
6,000
7,000
8,000
JAN-SEP 2016 JAN-SEP 2017
ACEA Economic and Market Report: Quarter 3 2017 – December 2017 23
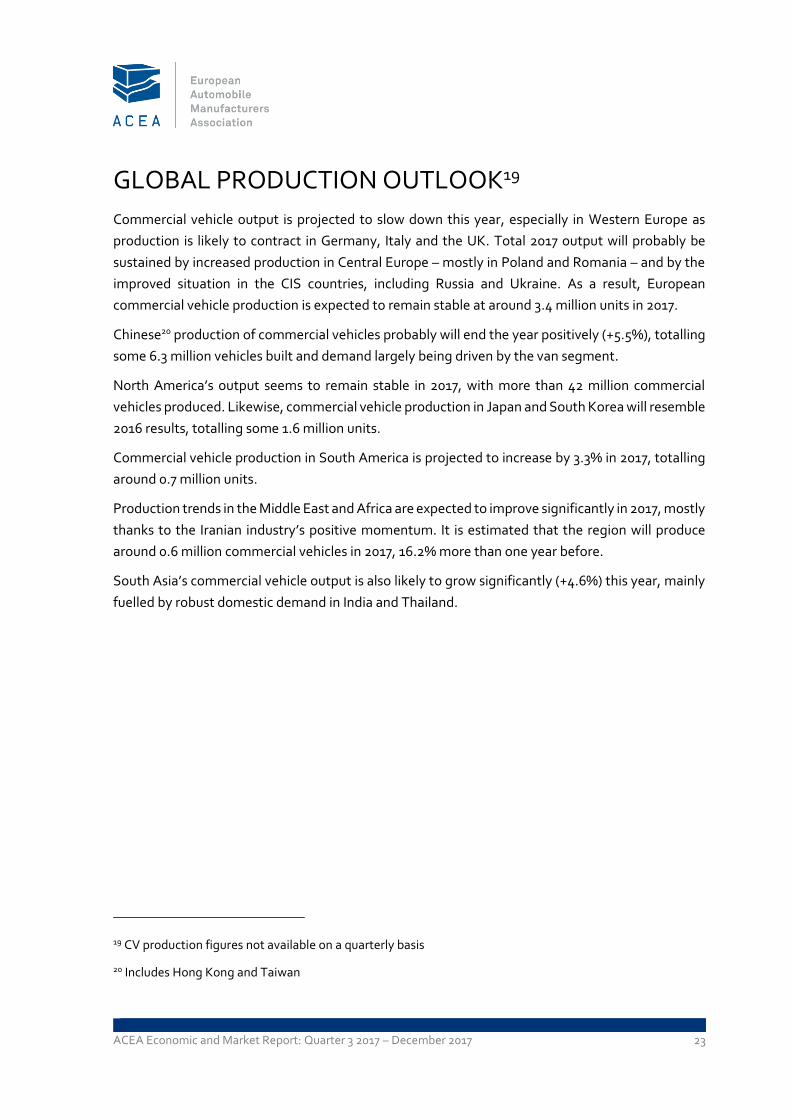
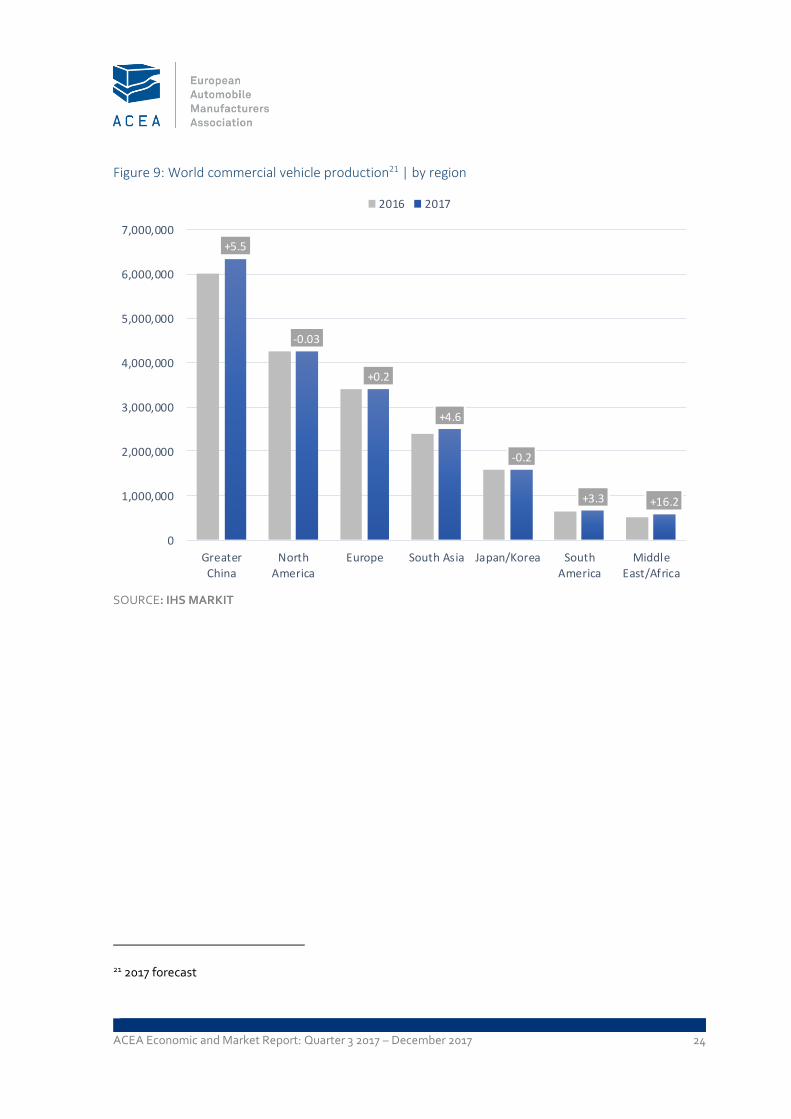
GLOBAL PRODUCTION OUTLOOK19
Commercial vehicle output is projected to slow down this year, especially in Western Europe as
production is likely to contract in Germany, Italy and the UK. Total 2017 output will probably be
sustained by increased production in Central Europe – mostly in Poland and Romania – and by the
improved situation in the CIS countries, including Russia and Ukraine. As a result, European
commercial vehicle production is expected to remain stable at around 3.4 million units in 2017.
Chinese20 production of commercial vehicles probably will end the year positively (+5.5%), totalling
some 6.3 million vehicles built and demand largely being driven by the van segment.
North America’s output seems to remain stable in 2017, with more than 42 million commercial
vehicles produced. Likewise, commercial vehicle production in Japan and South Korea will resemble
2016 results, totalling some 1.6 million units.
Commercial vehicle production in South America is projected to increase by 3.3% in 2017, totalling
around 0.7 million units.
Production trends in the Middle East and Africa are expected to improve significantly in 2017, mostly
thanks to the Iranian industry’s positive momentum. It is estimated that the region will produce
around 0.6 million commercial vehicles in 2017, 16.2% more than one year before.
South Asia’s commercial vehicle output is also likely to grow significantly (+4.6%) this year, mainly
fuelled by robust domestic demand in India and Thailand.
19 CV production figures not available on a quarterly basis
20 Includes Hong Kong and Taiwan
ACEA Economic and Market Report: Quarter 3 2017 – December 2017 24
Figure 9: World commercial vehicle production21 | by region
SOURCE: IHS MARKIT
21 2017 forecast
+5.5
-0.03
+0.2
+4.6
-0.2
+3.3 +16.2
0
1,000,000
2,000,000
3,000,000
4,000,000
5,000,000
6,000,000
7,000,000
Greater
China
North
America
Europe South Asia Japan/Korea South
America
Middle
East/Africa
2016 2017

ACEA Economic and Market Report: Quarter 3 2017 – December 2017 25
TRADE
Nine months into 2017, the value of EU commercial vehicle and bus exports had increased by 4.3%
to €5.9 billion. This growth was largely driven by the truck segment (+10.1%), although van exports
also showed a slight increase (+0.8%).
The value of commercial vehicle imports into the EU also grew (+2.5%) over the same period, but at
a slower pace than during the first half of the year – resulting in a trade surplus of almost €2 billion
so far in 2017.
Table 14: EU commercial vehicles (CV), buses and coaches (BC) trade | by type
Trade in value (€m) CV up to 5t CV over 5t + BC Total CV + BC
JAN-SEP 2017
IMPORTS 4,580 1,351 5,930
EXPORTS 3,003 4,897 7,900
TRADE BALANCE -1,577 3,546 1,969
JAN-SEP 2016
IMPORTS 4,410 1,376 5,786
EXPORTS 2,979 4,598 7,578
TRADE BALANCE -1,431 3,222 1,791
% change 17/16
IMPORTS +3.9 -1.9 +2.5
EXPORTS +0.8 +10.1 +4.3
SOURCE: EUROSTAT
ACEA Economic and Market Report: Quarter 3 2017 – December 2017 26
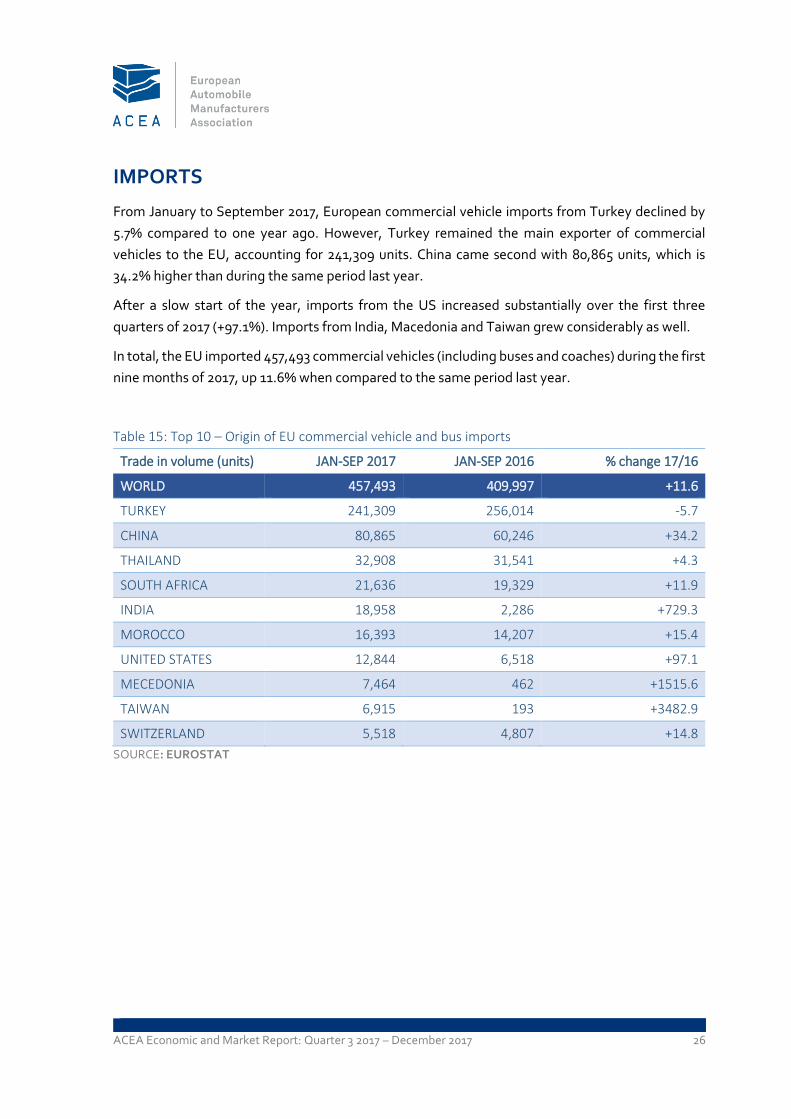
IMPORTS
From January to September 2017, European commercial vehicle imports from Turkey declined by
5.7% compared to one year ago. However, Turkey remained the main exporter of commercial
vehicles to the EU, accounting for 241,309 units. China came second with 80,865 units, which is
34.2% higher than during the same period last year.
After a slow start of the year, imports from the US increased substantially over the first three
quarters of 2017 (+97.1%). Imports from India, Macedonia and Taiwan grew considerably as well.
In total, the EU imported 457,493 commercial vehicles (including buses and coaches) during the first
nine months of 2017, up 11.6% when compared to the same period last year.
Table 15: Top 10 – Origin of EU commercial vehicle and bus imports
Trade in volume (units) JAN-SEP 2017 JAN-SEP 2016 % change 17/16
WORLD 457,493 409,997 +11.6
TURKEY 241,309 256,014 -5.7
CHINA 80,865 60,246 +34.2
THAILAND 32,908 31,541 +4.3
SOUTH AFRICA 21,636 19,329 +11.9
INDIA 18,958 2,286 +729.3
MOROCCO 16,393 14,207 +15.4
UNITED STATES 12,844 6,518 +97.1
MECEDONIA 7,464 462 +1515.6
TAIWAN 6,915 193 +3482.9
SWITZERLAND 5,518 4,807 +14.8
SOURCE: EUROSTAT
ACEA Economic and Market Report: Quarter 3 2017 – December 2017 27
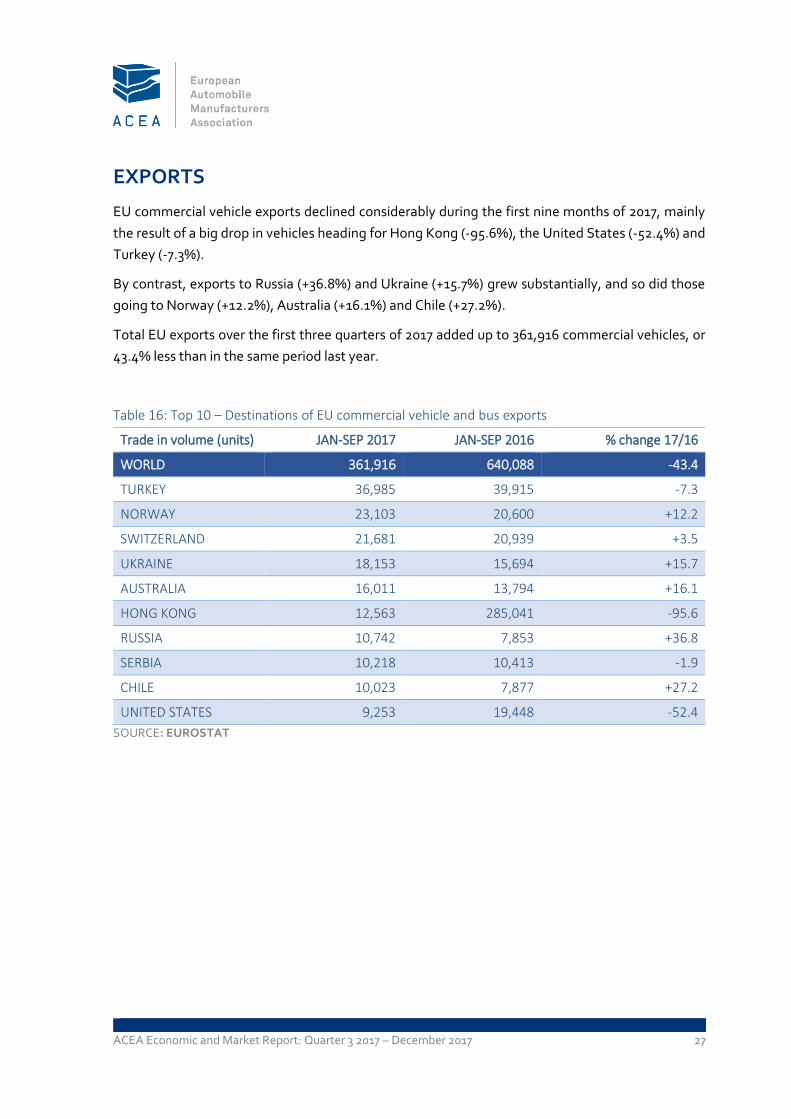
EXPORTS
EU commercial vehicle exports declined considerably during the first nine months of 2017, mainly
the result of a big drop in vehicles heading for Hong Kong (-95.6%), the United States (-52.4%) and
Turkey (-7.3%).
By contrast, exports to Russia (+36.8%) and Ukraine (+15.7%) grew substantially, and so did those
going to Norway (+12.2%), Australia (+16.1%) and Chile (+27.2%).
Total EU exports over the first three quarters of 2017 added up to 361,916 commercial vehicles, or
43.4% less than in the same period last year.
Table 16: Top 10 – Destinations of EU commercial vehicle and bus exports
Trade in volume (units) JAN-SEP 2017 JAN-SEP 2016 % change 17/16
WORLD 361,916 640,088 -43.4
TURKEY 36,985 39,915 -7.3
NORWAY 23,103 20,600 +12.2
SWITZERLAND 21,681 20,939 +3.5
UKRAINE 18,153 15,694 +15.7
AUSTRALIA 16,011 13,794 +16.1
HONG KONG 12,563 285,041 -95.6
RUSSIA 10,742 7,853 +36.8
SERBIA 10,218 10,413 -1.9
CHILE 10,023 7,877 +27.2
UNITED STATES 9,253 19,448 -52.4
SOURCE: EUROSTAT

ABOUT ACEA
• ACEA represents the 14 Europe-based car, van, truck and bus manufacturers:
BMW Group, DAF Trucks, Daimler, Fiat Chrysler Automobiles, Ford of Europe,
Hyundai Motor Europe, Iveco, Jaguar Land Rover, PSA Group, Renault Group,
Toyota Motor Europe, Volkswagen Group, Volvo Cars, and Volvo Group.
• More information can be found on www.acea.be or @ACEA_eu.
ABOUT THE EU AUTOMOBILE INDUSTRY
• 12.6 million people – or 5.7% of the EU employed population – work in the sector.
• The 3.3 million jobs in automotive manufacturing represent almost 11% of EU
manufacturing employment.
• Motor vehicles account for almost €396 billion in tax contributions in the EU15.
• The sector is also a key driver of knowledge and innovation, representing Europe's
largest private contributor to R&D, with more than €50 billion invested annually.
• The automobile industry generates a trade surplus of about €90 billion for the EU.
European Automobile Manufacturers' Association (ACEA) Avenue des Nerviens 85 | B-1040 Brussels | www.acea.be T +32 2 732 55 50 | F +32 738 73 10 | [email protected] | @ACEA_eu