Embed Size (px)
Citation preview

WWW.ACEA.BE
2 0 1 72 0 1 8

THE AUTOMOBILE INDUSTRY
3 POCKET GUIDE 2017 / 2018
ForewordEach year, ACEA compiles the Automobile Industry Pocket Guide in order to provide a clear and complete overview of one of Europe’s most important industries. By now, it has become the point of reference for all those interested in automotive issues and policies – something we are proud of! This 2017-2018 edition contains the latest figures on employment and trade, innovation, the environmental performance of our sector, as well as vehicle production, registration, use and taxation.
More than 12.5 million Europeans work directly or indirectly in the automotive sector now, representing 5.7% of total EU employment. In 2016, EU passenger car production increased by 2.7%, totalling 16.5 million units and thus almost reaching pre-crisis levels. Not only does our industry make a significant contribution to powering economic growth and creating jobs, it also spurs innovation and provides mobility for millions of Europeans.
However, uncertainty is expected to overshadow our sector in the years to come. Much will depend on political developments and the evolution of macro-economic conditions. We therefore urge the EU to continue its efforts to safeguard the competitiveness of our continent, and ensure fair access to the global market place. At the same time, our industry remains committed to addressing tomorrow’s challenges, which is reflected in manufacturers’ ongoing efforts to reduce their environmental footprint.
Even though car production has been on the rise again since 2013, manufacturers have been able to decouple CO2 emissions, energy consumption, water usage and waste generation from production growth. Total CO2 emissions from car production, for example, have remained stable despite a substantial increase in production volume – while CO2 emissions per car produced dropped by 25.8% between 2007 and 2016.
The same level of ambition applies to our objective of making mobility cleaner, smarter and safer in the future. To that end, the automotive sector invests €50.1 billion in innovation each year. This not only makes us the EU’s largest investor in R&D, but also marks our highest annual investment in innovation on record.
Erik Jonnaert ACEA Secretary General
WWW.ACEA.BE
5
ABOUT ACEA
WWW.ACEA.BE
ACEA represents Europe’scar, van, truck and bus makersMembers and partnersThe European Automobile Manufacturers’ Association (ACEA) is the advocate for the automobile industry in Europe, representing manufacturers of passenger cars, vans, trucks and buses with production sites in the EU.
ACEA’s members are: BMW Group, Daimler, DAF Trucks, Fiat Chrysler Automobiles, Ford of Europe, Hyundai Motor Europe, Iveco, Jaguar Land Rover, Opel Group, PSA Group, Renault Group, Toyota Motor Europe, Volkswagen Group, Volvo Cars, and Volvo Group.
ACEA has permanent cooperation with the European Council for Automotive R&D (EUCAR), which is the industry body for collaborative research and development.
ACEA works closely with the 29 national automobile manufacturers’ associations in Europe, and maintains a dialogue on international issues with automobile associations around the world.
THE AUTOMOBILE INDUSTRY POCKET GUIDE 2017 / 2018
6
WWW.ACEA.BE
ACEA’s mission and priority areasACEA’s mission
– Define and advocate the common interests, policies and positions of the European automobile industry.
– Engage in dialogue with the European institutions and other stakeholders in order to advance understanding of industry issues, and to contribute to effective policy and legislation at both European and global levels.
– Act as a portal for expert knowledge on vehicle-related regulation.– Communicate the role and importance of the industry, using reliable data and
information.– Monitor activities that affect the automobile industry, cooperating with the other
stakeholders involved.– Undertake strategic reflection on the increasingly global challenges of mobility,
sustainability and competitiveness.
Priority fields
Through its member companies, ACEA taps into a wealth of technical, regulatory and practical expertise in the following priority fields:
– Connected and Automated Driving– Competitiveness, Market and Economy– Environment and Sustainability– International Trade– Research and Innovation– Safety– Transport Policy
7
ABOUT ACEA
WWW.ACEA.BE
How ACEA worksThe ACEA Board of Directors is composed of the CEOs and Presidents of its member companies. Additionally, a Commercial Vehicle Board of Directors addresses the specific issues that face the commercial vehicle manufacturers that ACEA represents: DAF Trucks, Daimler Trucks, Iveco, MAN Truck & Bus, Scania, Volkswagen Commercial Vehicles and Volvo Group.
The day-to-day work of the ACEA secretariat is overseen by the Secretary General, who ensures that the Board of Directors’ priorities are addressed. Technical expertise and advisory input comes from working groups on topics as diverse as emissions, road and vehicle safety, general transport policy, and regulatory compliance. These specialist working groups are made up of experts from the member companies.
THE AUTOMOBILE INDUSTRY POCKET GUIDE 2017 / 2018
8
WWW.ACEA.BE
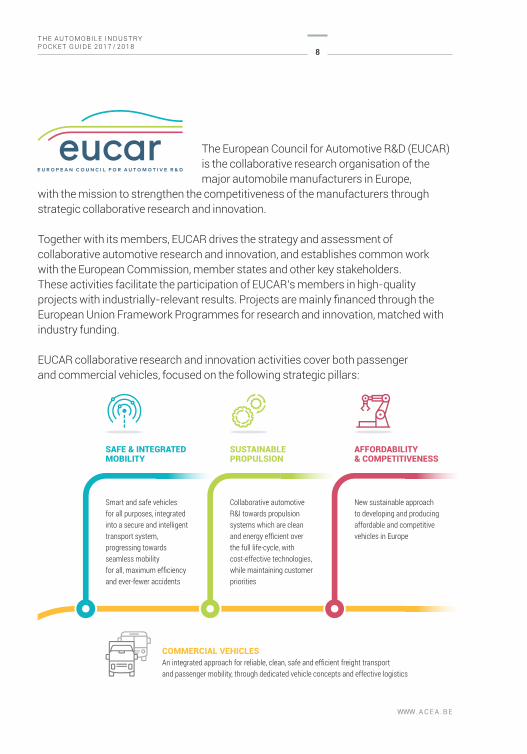
The European Council for Automotive R&D (EUCAR)is the collaborative research organisation of themajor automobile manufacturers in Europe,
with the mission to strengthen the competitiveness of the manufacturers through strategic collaborative research and innovation.
Together with its members, EUCAR drives the strategy and assessment ofcollaborative automotive research and innovation, and establishes common workwith the European Commission, member states and other key stakeholders. These activities facilitate the participation of EUCAR’s members in high-quality projects with industrially-relevant results. Projects are mainly financed through the European Union Framework Programmes for research and innovation, matched with industry funding.
EUCAR collaborative research and innovation activities cover both passenger and commercial vehicles, focused on the following strategic pillars:
Smart and safe vehicles for all purposes, integrated into a secure and intelligent transport system, progressing towards seamless mobilityfor all, maximum efficiency and ever-fewer accidents
Collaborative automotive R&I towards propulsion systems which are clean and energy efficient over the full life-cycle, with cost-effective technologies, while maintaining customer priorities
New sustainable approach to developing and producing affordable and competitive vehicles in Europe
COMMERCIAL VEHICLESAn integrated approach for reliable, clean, safe and efficient freight transport and passenger mobility, through dedicated vehicle concepts and effective logistics
SAFE & INTEGRATED MOBILITY
SUSTAINABLEPROPULSION
AFFORDABILITY & COMPETITIVENESS
9
ABOUT ACEA
WWW.ACEA.BE
EUCAR is governed by its Council, composed of the heads of the research and advanced development divisions of the member companies.
The EUCAR Chairman is nominated annually from the Council on a rotating basis.
EUCAR’s members are:
BMW Group, DAF Trucks, Daimler, Fiat Chrysler Automobiles, Ford of Europe, Hyundai Motor Europe, Iveco, Jaguar Land Rover, Opel Group, PSA Group, Renault Group, Toyota Motor Europe, Volkswagen Group, Volvo Cars, and Volvo Group.
THE AUTOMOBILE INDUSTRY POCKET GUIDE 2017 / 2018
10
WWW.ACEA.BE
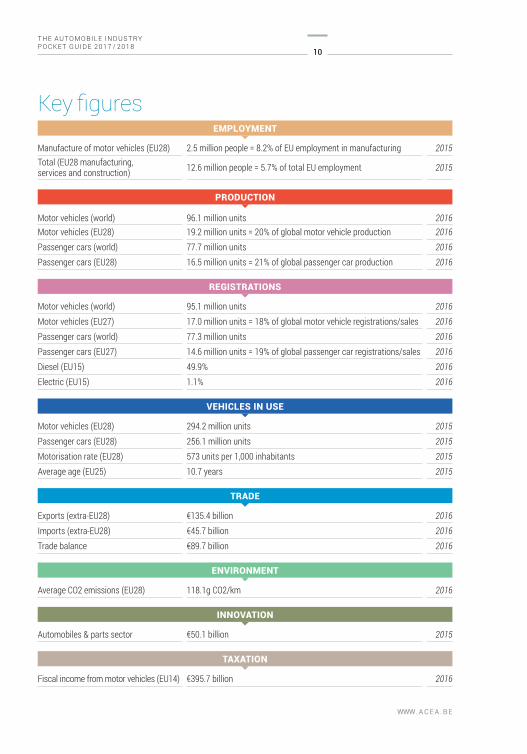
EMPLOYMENT
Manufacture of motor vehicles (EU28) 2.5 million people = 8.2% of EU employment in manufacturing 2015Total (EU28 manufacturing, services and construction) 12.6 million people = 5.7% of total EU employment 2015
PRODUCTION
Motor vehicles (world) 96.1 million units 2016Motor vehicles (EU28) 19.2 million units = 20% of global motor vehicle production 2016Passenger cars (world) 77.7 million units 2016Passenger cars (EU28) 16.5 million units = 21% of global passenger car production 2016
REGISTRATIONS
Motor vehicles (world) 95.1 million units 2016Motor vehicles (EU27) 17.0 million units = 18% of global motor vehicle registrations/sales 2016Passenger cars (world) 77.3 million units 2016Passenger cars (EU27) 14.6 million units = 19% of global passenger car registrations/sales 2016Diesel (EU15) 49.9% 2016Electric (EU15) 1.1% 2016
VEHICLES IN USE
Motor vehicles (EU28) 294.2 million units 2015Passenger cars (EU28) 256.1 million units 2015Motorisation rate (EU28) 573 units per 1,000 inhabitants 2015Average age (EU25) 10.7 years 2015
TRADE
Exports (extra-EU28) €135.4 billion 2016Imports (extra-EU28) €45.7 billion 2016Trade balance €89.7 billion 2016
ENVIRONMENT
Average CO2 emissions (EU28) 118.1g CO2/km 2016
INNOVATION
Automobiles & parts sector €50.1 billion 2015
TAXATION
Fiscal income from motor vehicles (EU14) €395.7 billion 2016
Key figures

Employment
THE AUTOMOBILE INDUSTRYPOCKET GUIDE 2017 / 2018
WWW.ACEA.BE
1

WWW.ACEA.BE
13 EMPLOYMENT
WWW.ACEA.BE
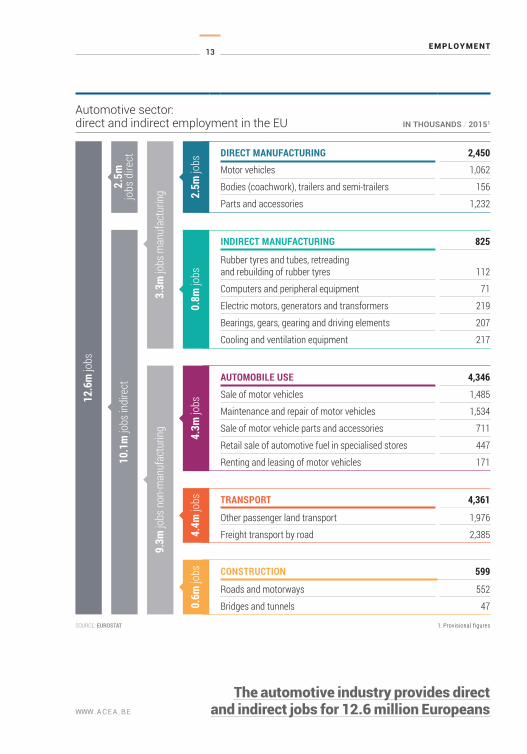
Automotive sector: direct and indirect employment in the EU IN THOUSANDS / 20151
DIRECT MANUFACTURING 2,450
Motor vehicles 1,062
Bodies (coachwork), trailers and semi-trailers 156
Parts and accessories 1,232
INDIRECT MANUFACTURING 825
Rubber tyres and tubes, retreading and rebuilding of rubber tyres 112
Computers and peripheral equipment 71
Electric motors, generators and transformers 219
Bearings, gears, gearing and driving elements 207
Cooling and ventilation equipment 217
AUTOMOBILE USE 4,346
Sale of motor vehicles 1,485
Maintenance and repair of motor vehicles 1,534
Sale of motor vehicle parts and accessories 711
Retail sale of automotive fuel in specialised stores 447
Renting and leasing of motor vehicles 171
TRANSPORT 4,361
Other passenger land transport 1,976
Freight transport by road 2,385
CONSTRUCTION 599
Roads and motorways 552
Bridges and tunnels 47
The automotive industry provides directand indirect jobs for 12.6 million Europeans
SOURCE: EUROSTAT 1. Provisional figures
THE AUTOMOBILE INDUSTRY POCKET GUIDE 2017 / 2018
14
WWW.ACEA.BE
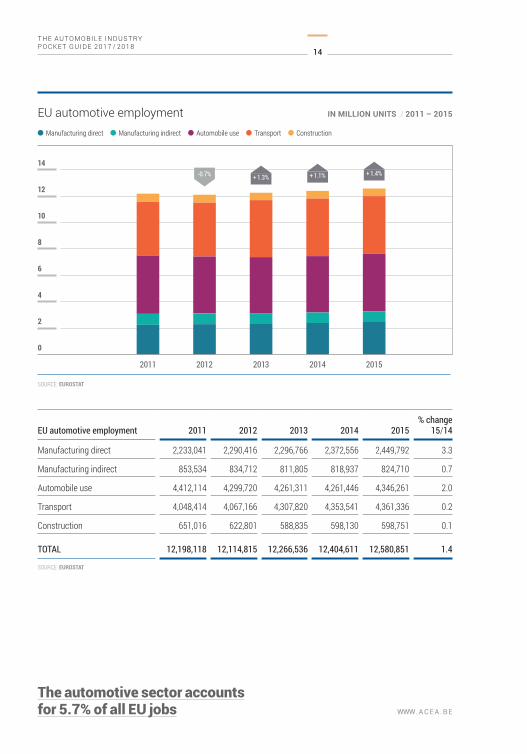
EU automotive employment 2011 2012 2013 2014 2015% change
15/14
Manufacturing direct 2,233,041 2,290,416 2,296,766 2,372,556 2,449,792 3.3
Manufacturing indirect 853,534 834,712 811,805 818,937 824,710 0.7
Automobile use 4,412,114 4,299,720 4,261,311 4,261,446 4,346,261 2.0
Transport 4,048,414 4,067,166 4,307,820 4,353,541 4,361,336 0.2
Construction 651,016 622,801 588,835 598,130 598,751 0.1
TOTAL 12,198,118 12,114,815 12,266,536 12,404,611 12,580,851 1.4
SOURCE: EUROSTAT
The automotive sector accountsfor 5.7% of all EU jobs
2
4
6
8
10
12
14
Manufacturing direct Manufacturing indirect Automobile use Transport Construction
2011 2012 2013 2014 2015
0
EU automotive employment IN MILLION UNITS / 2011 – 2015
+ 1.3%-0.7% + 1.1% + 1.4%
SOURCE: EUROSTAT
15 EMPLOYMENT
WWW.ACEA.BE
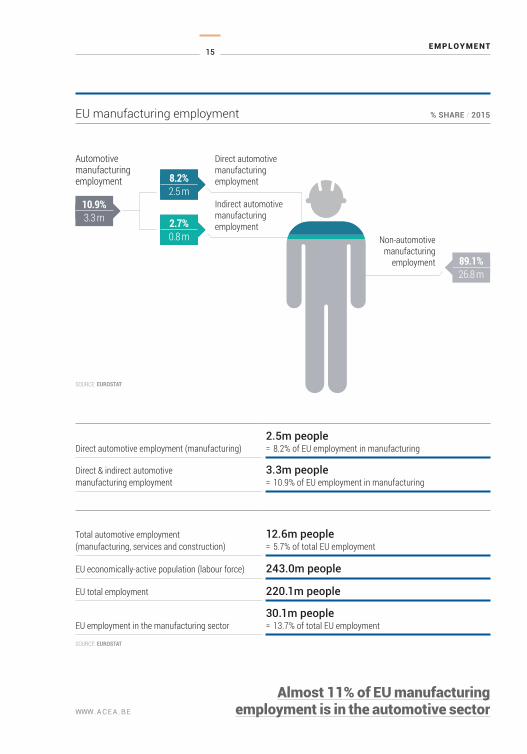
EU manufacturing employment % SHARE / 2015
Direct automotive employment (manufacturing)2.5m people= 8.2% of EU employment in manufacturing
Direct & indirect automotive manufacturing employment
3.3m people= 10.9% of EU employment in manufacturing
Total automotive employment (manufacturing, services and construction)
12.6m people= 5.7% of total EU employment
EU economically-active population (labour force) 243.0m people
EU total employment 220.1m people
EU employment in the manufacturing sector30.1m people= 13.7% of total EU employment
SOURCE: EUROSTAT
Direct automotive manufacturingemployment
Indirect automotive manufacturing employment
Non-automotivemanufacturing
employment
Almost 11% of EU manufacturingemployment is in the automotive sector
7.6 %2.3 m
7.6 %2.3 m
Automotivemanufacturing employment 8.2%
2.5 m10.9%3.3 m
89.1%26.8 m
2.7%0.8 m
SOURCE: EUROSTAT
THE AUTOMOBILE INDUSTRY POCKET GUIDE 2017 / 2018
16
WWW.ACEA.BE
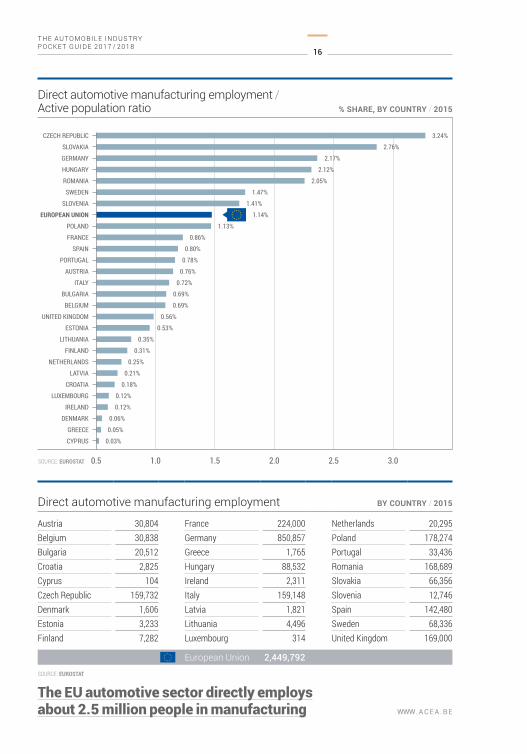
Direct automotive manufacturing employment BY COUNTRY / 2015
Austria 30,804 France 224,000 Netherlands 20,295Belgium 30,838 Germany 850,857 Poland 178,274Bulgaria 20,512 Greece 1,765 Portugal 33,436Croatia 2,825 Hungary 88,532 Romania 168,689Cyprus 104 Ireland 2,311 Slovakia 66,356Czech Republic 159,732 Italy 159,148 Slovenia 12,746Denmark 1,606 Latvia 1,821 Spain 142,480Estonia 3,233 Lithuania 4,496 Sweden 68,336Finland 7,282 Luxembourg 314 United Kingdom 169,000
European Union 2,449,792SOURCE: EUROSTAT
The EU automotive sector directly employsabout 2.5 million people in manufacturing
0.5 1.0 1.5 2.0 2.5 3.0
CZECH REPUBLIC
SLOVAKIA
GERMANY
HUNGARY
ROMANIA
SWEDEN
SLOVENIA
POLAND
FRANCE
SPAIN
PORTUGAL
AUSTRIA
ITALY
BULGARIA
EUROPEAN UNION
BELGIUM
UNITED KINGDOM
ESTONIA
LITHUANIA
FINLAND
NETHERLANDS
LATVIA
CROATIA
LUXEMBOURG
IRELAND
DENMARK
GREECE
CYPRUS
Direct automotive manufacturing employment / Active population ratio % SHARE, BY COUNTRY / 2015
3.24%
2.76%
2.17%
2.12%
2.05%
1.47%
1.41%
1.14%
1.13%
0.86%
0.80%
0.78%
0.76%
0.72%
0.69%
0.69%
0.56%
0.53%
0.35%
0.31%
0.25%
0.21%
0.18%
0.12%
0.12%
0.06%
0.05%
0.03%
SOURCE: EUROSTAT
Production
THE AUTOMOBILE INDUSTRYPOCKET GUIDE 2017 / 2018
WWW.ACEA.BE
2

WWW.ACEA.BE
19
PRODUCTION
WWW.ACEA.BE
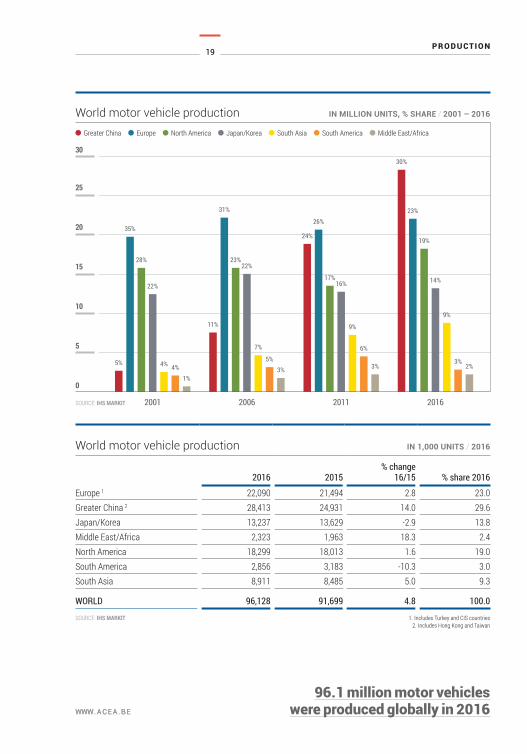
96.1 million motor vehicles were produced globally in 2016WWW.ACEA.BE
World motor vehicle production IN 1,000 UNITS / 2016
2016 2015% change
16/15 % share 2016
Europe 1 22,090 21,494 2.8 23.0Greater China 2 28,413 24,931 14.0 29.6Japan/Korea 13,237 13,629 -2.9 13.8Middle East/Africa 2,323 1,963 18.3 2.4North America 18,299 18,013 1.6 19.0South America 2,856 3,183 -10.3 3.0South Asia 8,911 8,485 5.0 9.3
WORLD 96,128 91,699 4.8 100.0
SOURCE: IHS MARKIT 1. Includes Turkey and CIS countries 2. Includes Hong Kong and Taiwan
2001 2006 2011 2016
World motor vehicle production IN MILLION UNITS, % SHARE / 2001 – 2016
0
5
10
15
20
25
30
5%
Greater China Europe North America Japan/Korea South Asia South America Middle East/Africa
SOURCE: IHS MARKIT
35%
28%
22%
4% 4%1%
11%
31%
23%22%
7%
5%3%
24%
26%
17%16%
9%
6%
3%
30%
23%
19%
14%
9%
3%2%
THE AUTOMOBILE INDUSTRY POCKET GUIDE 2017 / 2018
20
WWW.ACEA.BE
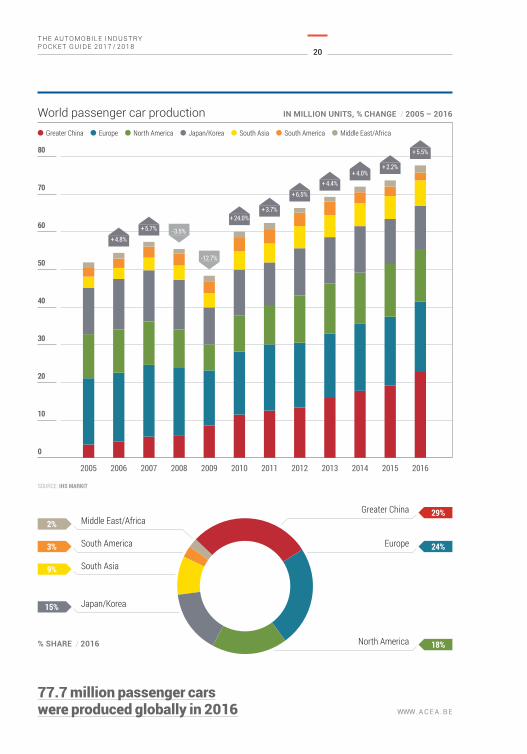
77.7 million passenger carswere produced globally in 2016
Middle East/Africa
South America
South Asia
Japan/Korea
2%
3%
9%
15%
Greater China
Europe
North America
29%
24%
18%
10
20
30
40
50
60
70
80
2005 2006 2007 2008 2009 2010 2011 2012 2013 2014 2015 2016
0
World passenger car production IN MILLION UNITS, % CHANGE / 2005 – 2016
SOURCE: IHS MARKIT
Greater China Europe North America Japan/Korea South Asia South America Middle East/Africa
+ 4.8%+ 5.7%
+ 24.0%+ 3.7%
+ 6.5%+ 4.4%
+ 2.2%
+ 5.5%
+ 4.0%
-3.5%
-12.7%
% SHARE / 2016
21
PRODUCTION
WWW.ACEA.BE
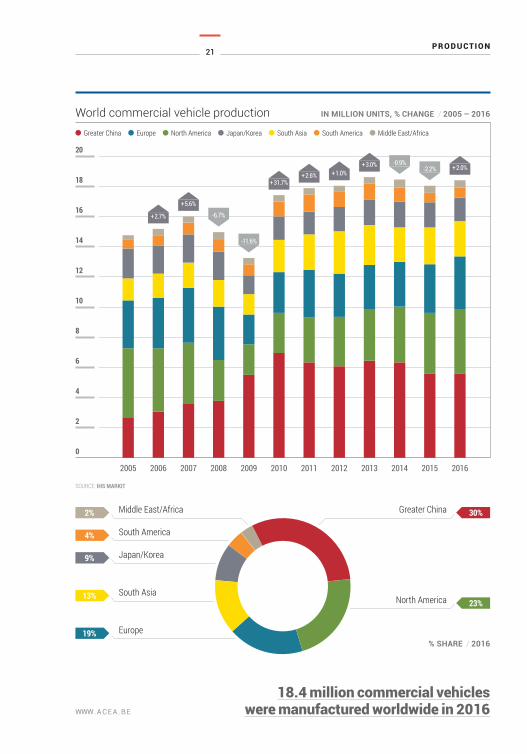
North America 23%
Greater China 30%Middle East/Africa
South America
Japan/Korea
South Asia
Europe
2%
4%
9%
13%
19%
18.4 million commercial vehicleswere manufactured worldwide in 2016
2
4
6
8
10
12
14
16
18
20
2005 2006 2007 2008 2009 2010 2011 2012 2013 2014 2015 2016
0
World commercial vehicle production IN MILLION UNITS, % CHANGE / 2005 – 2016
SOURCE: IHS MARKIT
% SHARE / 2016
+ 2.7%
+ 5.6%
+ 2.6%+ 31.7%
+ 1.0%+ 3.0% + 2.0%
-6.7%
-11.6%
-0.9%-2.2%
Greater China Europe North America Japan/Korea South Asia South America Middle East/Africa
THE AUTOMOBILE INDUSTRY POCKET GUIDE 2017 / 2018
22
WWW.ACEA.BE
Heavy commercial vehicles
Medium commercial vehicles
Light commercial vehicles
Passenger cars
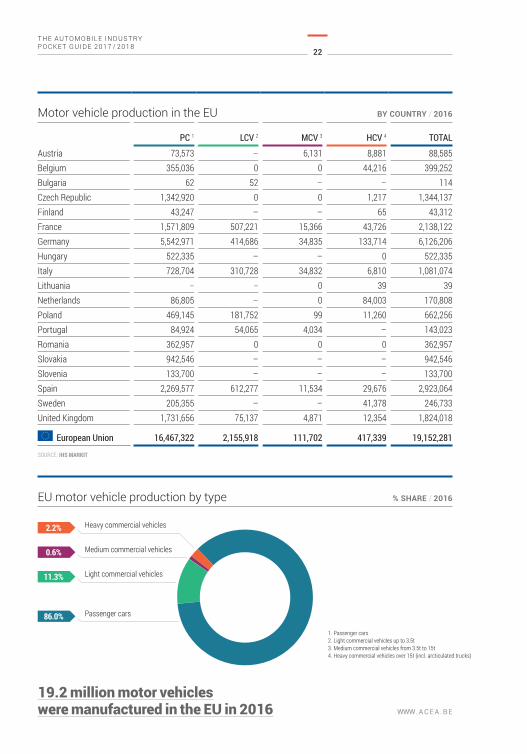
2.2%
0.6%
11.3%
86.0%
19.2 million motor vehicleswere manufactured in the EU in 2016
Motor vehicle production in the EU BY COUNTRY / 2016
PC 1 LCV 2 MCV 3 HCV 4 TOTAL
Austria 73,573 – 6,131 8,881 88,585Belgium 355,036 0 0 44,216 399,252Bulgaria 62 52 – – 114Czech Republic 1,342,920 0 0 1,217 1,344,137Finland 43,247 – – 65 43,312France 1,571,809 507,221 15,366 43,726 2,138,122Germany 5,542,971 414,686 34,835 133,714 6,126,206Hungary 522,335 – – 0 522,335Italy 728,704 310,728 34,832 6,810 1,081,074Lithuania – – 0 39 39Netherlands 86,805 – 0 84,003 170,808Poland 469,145 181,752 99 11,260 662,256Portugal 84,924 54,065 4,034 – 143,023Romania 362,957 0 0 0 362,957Slovakia 942,546 – – – 942,546Slovenia 133,700 – – – 133,700Spain 2,269,577 612,277 11,534 29,676 2,923,064Sweden 205,355 – – 41,378 246,733United Kingdom 1,731,656 75,137 4,871 12,354 1,824,018
European Union 16,467,322 2,155,918 111,702 417,339 19,152,281
SOURCE: IHS MARKIT
1. Passenger cars2. Light commercial vehicles up to 3.5t3. Medium commercial vehicles from 3.5t to 15t4. Heavy commercial vehicles over 15t (incl. arcticulated trucks)
EU motor vehicle production by type % SHARE / 2016
23
PRODUCTION
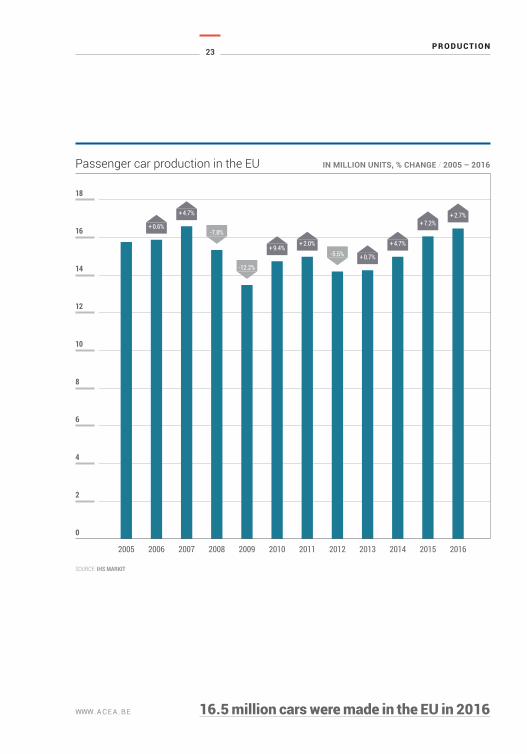
WWW.ACEA.BE 16.5 million cars were made in the EU in 2016
2
4
6
8
10
12
14
16
18
2005 2006 2007 2008 2009 2010 2011 2012 2013 2014 2015 2016
0
Passenger car production in the EU IN MILLION UNITS, % CHANGE / 2005 – 2016
SOURCE: IHS MARKIT
+ 0.6%
+ 4.7%
+ 9.4%+ 2.0%
+ 2.7%
+ 0.7%
-7.8%
-12.2%
-5.5%+ 4.7%
+ 7.2%
THE AUTOMOBILE INDUSTRY POCKET GUIDE 2017 / 2018
24
WWW.ACEA.BE
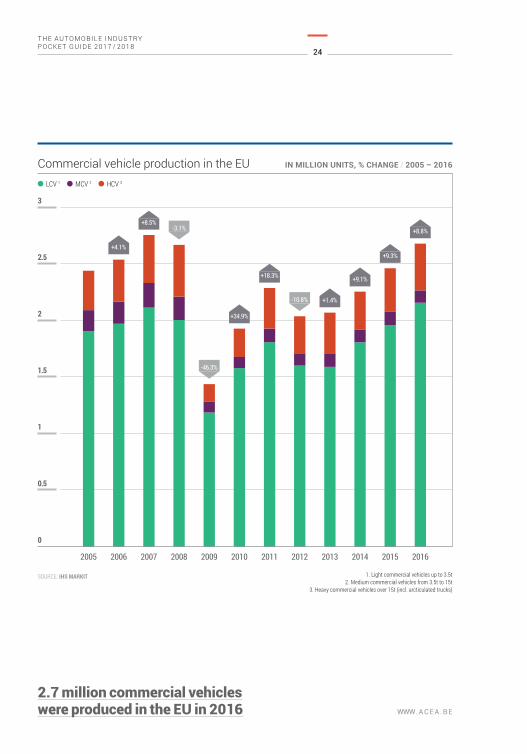
2.7 million commercial vehicleswere produced in the EU in 2016
0.5
1
1.5
2
2.5
3
2005 2006 2007 2008 2009 2010 2011 2012 2013 2014 2015 2016
0
Commercial vehicle production in the EU IN MILLION UNITS, % CHANGE / 2005 – 2016
SOURCE: IHS MARKIT
LCV 1 MCV 2 HCV 3
+4.1%
-46.3%
-3.1%
-10.8%
+8.5%
+9.3%
+8.8%
+9.1%
+1.4%
1. Light commercial vehicles up to 3.5t2. Medium commercial vehicles from 3.5t to 15t
3. Heavy commercial vehicles over 15t (incl. arcticulated trucks)
+18.3%
+34.9%
25
PRODUCTION
WWW.ACEA.BE
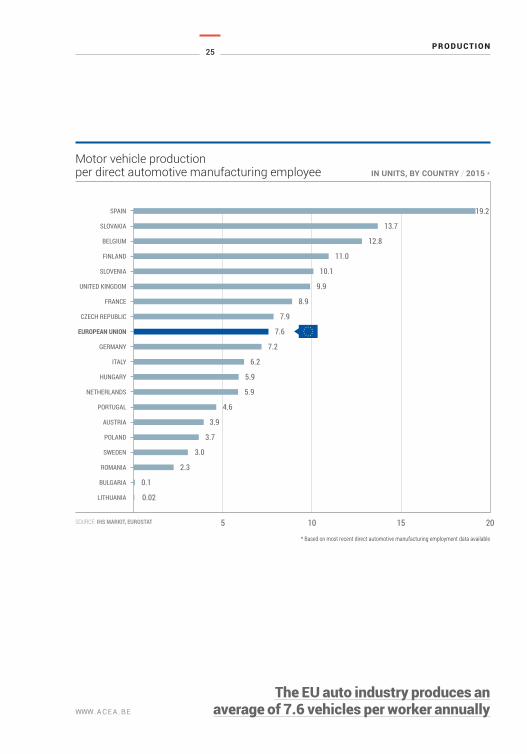
The EU auto industry produces an average of 7.6 vehicles per worker annually
5 10 15 20
Motor vehicle productionper direct automotive manufacturing employee IN UNITS, BY COUNTRY / 2015 *
BULGARIA
LITHUANIA
ROMANIA
SWEDEN
POLAND
AUSTRIA
PORTUGAL
NETHERLANDS
HUNGARY
ITALY
GERMANY
EUROPEAN UNION
CZECH REPUBLIC
FRANCE
UNITED KINGDOM
SLOVENIA
FINLAND
BELGIUM
SLOVAKIA
SPAIN
SOURCE: IHS MARKIT, EUROSTAT
0.1
0.02
* Based on most recent direct automotive manufacturing employment data available
2.3
3.0
3.7
3.9
4.6
5.9
5.9
6.2
7.2
7.6
8.9
9.9
10.1
11.0
12.8
13.7
19.2
7.9
THE AUTOMOBILE INDUSTRY POCKET GUIDE 2017 / 2018
26
WWW.ACEA.BE
33
8
10
9
3
26
FRANCE
BELGIUM
NETHERLANDS
SWEDEN
FINLAND
ITALY
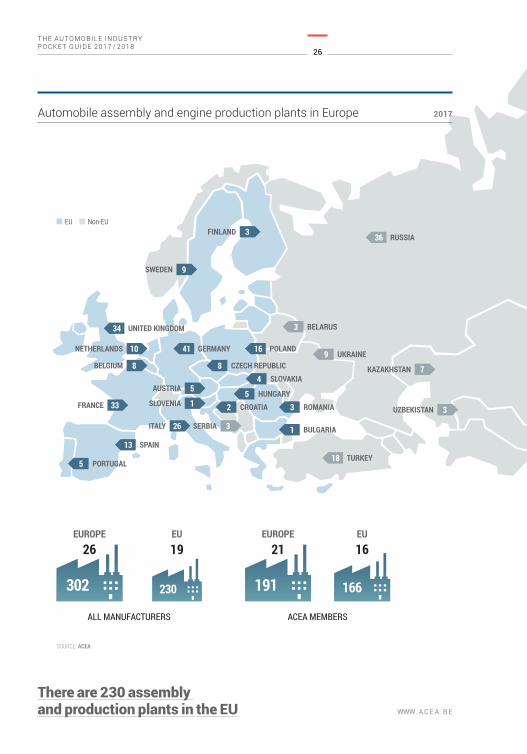
There are 230 assembly and production plants in the EU
302 191230
EUROPE
26EUROPE
21EU
19EU
16
ALL MANUFACTURERS ACEA MEMBERS
166
34 UNITED KINGDOM
13
5
SPAIN
PORTUGAL
41
8
GERMANY
CZECH REPUBLIC
3SERBIA
1
5
7
SLOVENIA
AUSTRIA
KAZAKHSTAN
36
3
9
RUSSIA
BELARUS
UKRAINE
18 TURKEY
3UZBEKISTAN
1 BULGARIA
32 ROMANIACROATIA
4
5
16
SLOVAKIA
HUNGARY
POLAND
EU Non-EU
SOURCE: ACEA
Automobile assembly and engine production plants in Europe 2017
Registrations
THE AUTOMOBILE INDUSTRYPOCKET GUIDE 2017 / 2018
WWW.ACEA.BE
3

WWW.ACEA.BE
29
REGISTRATIONS
WWW.ACEA.BE
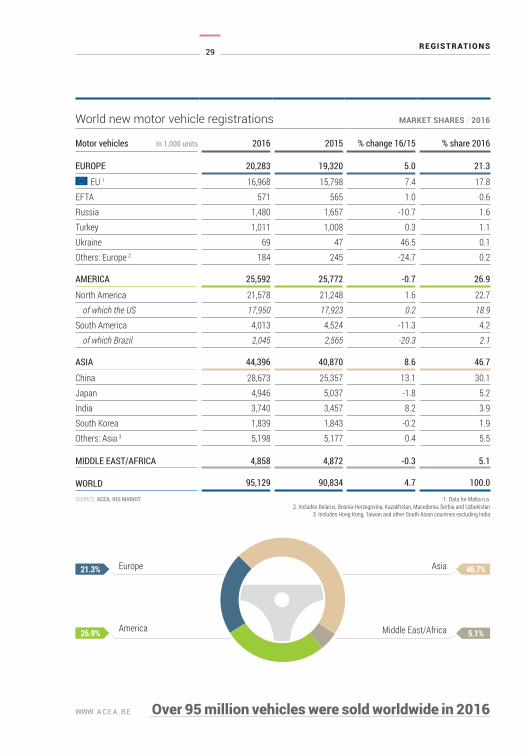
Europe
America
21.3%
26.9%
Asia
Middle East/Africa
46.7%
5.1%
Over 95 million vehicles were sold worldwide in 2016
World new motor vehicle registrations MARKET SHARES / 2016
Motor vehicles In 1,000 units 2016 2015 % change 16/15 % share 2016
EUROPE 20,283 19,320 5.0 21.3
EU 1 16,968 15,798 7.4 17.8EFTA 571 565 1.0 0.6Russia 1,480 1,657 -10.7 1.6Turkey 1,011 1,008 0.3 1.1Ukraine 69 47 46.5 0.1Others: Europe 2 184 245 -24.7 0.2
AMERICA 25,592 25,772 -0.7 26.9
North America 21,578 21,248 1.6 22.7of which the US 17,950 17,923 0.2 18.9
South America 4,013 4,524 -11.3 4.2of which Brazil 2,045 2,565 -20.3 2.1
ASIA 44,396 40,870 8.6 46.7
China 28,673 25,357 13.1 30.1Japan 4,946 5,037 -1.8 5.2India 3,740 3,457 8.2 3.9South Korea 1,839 1,843 -0.2 1.9Others: Asia 3 5,198 5,177 0.4 5.5
MIDDLE EAST/AFRICA 4,858 4,872 -0.3 5.1
WORLD 95,129 90,834 4.7 100.0
SOURCE: ACEA, IHS MARKIT 1. Data for Malta n.a. 2. Includes Belarus, Bosnia-Herzegovina, Kazakhstan, Macedonia, Serbia and Uzbekistan 3. Includes Hong Kong, Taiwan and other South Asian countries excluding India
THE AUTOMOBILE INDUSTRY POCKET GUIDE 2017 / 2018
30
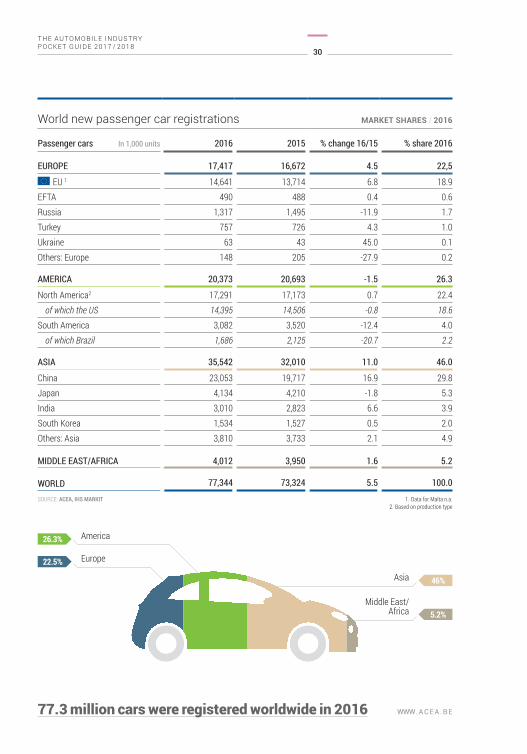
WWW.ACEA.BE77.3 million cars were registered worldwide in 2016
World new passenger car registrations MARKET SHARES / 2016
Passenger cars In 1,000 units 2016 2015 % change 16/15 % share 2016
EUROPE 17,417 16,672 4.5 22,5
EU 1 14,641 13,714 6.8 18.9EFTA 490 488 0.4 0.6Russia 1,317 1,495 -11.9 1.7Turkey 757 726 4.3 1.0Ukraine 63 43 45.0 0.1Others: Europe 148 205 -27.9 0.2
AMERICA 20,373 20,693 -1.5 26.3
North America2 17,291 17,173 0.7 22.4of which the US 14,395 14,506 -0.8 18.6
South America 3,082 3,520 -12.4 4.0of which Brazil 1,686 2,125 -20.7 2.2
ASIA 35,542 32,010 11.0 46.0
China 23,053 19,717 16.9 29.8Japan 4,134 4,210 -1.8 5.3India 3,010 2,823 6.6 3.9South Korea 1,534 1,527 0.5 2.0Others: Asia 3,810 3,733 2.1 4.9
MIDDLE EAST/AFRICA 4,012 3,950 1.6 5.2
WORLD 77,344 73,324 5.5 100.0
SOURCE: ACEA, IHS MARKIT 1. Data for Malta n.a. 2. Based on production type
Europe
America
22.5%
26.3%
Asia
Middle East/ Africa
46%
5.2%
31
REGISTRATIONS
WWW.ACEA.BE
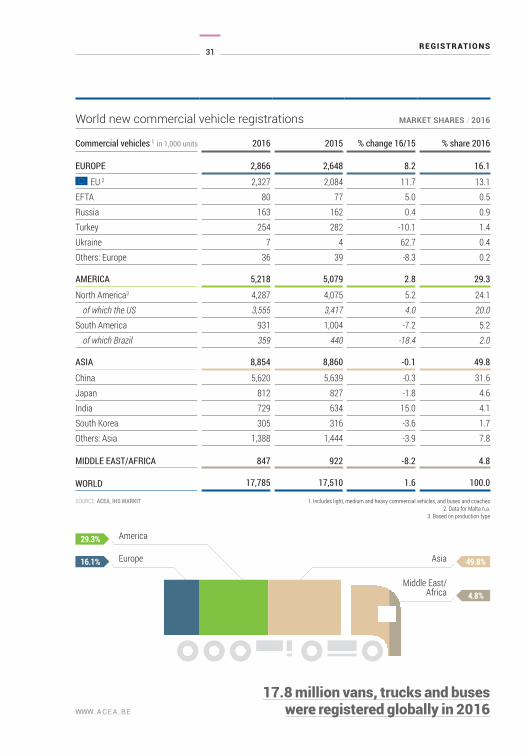
17.8 million vans, trucks and buseswere registered globally in 2016
World new commercial vehicle registrations MARKET SHARES / 2016
Commercial vehicles 1 in 1,000 units 2016 2015 % change 16/15 % share 2016
EUROPE 2,866 2,648 8.2 16.1
EU 2 2,327 2,084 11.7 13.1EFTA 80 77 5.0 0.5Russia 163 162 0.4 0.9Turkey 254 282 -10.1 1.4Ukraine 7 4 62.7 0.4Others: Europe 36 39 -8.3 0.2
AMERICA 5,218 5,079 2.8 29.3
North America3 4,287 4,075 5.2 24.1of which the US 3,555 3,417 4.0 20.0
South America 931 1,004 -7.2 5.2of which Brazil 359 440 -18.4 2.0
ASIA 8,854 8,860 -0.1 49.8
China 5,620 5,639 -0.3 31.6Japan 812 827 -1.8 4.6India 729 634 15.0 4.1South Korea 305 316 -3.6 1.7Others: Asia 1,388 1,444 -3.9 7.8
MIDDLE EAST/AFRICA 847 922 -8.2 4.8
WORLD 17,785 17,510 1.6 100.0
SOURCE: ACEA, IHS MARKIT 1. Includes light, medium and heavy commercial vehicles, and buses and coaches 2. Data for Malta n.a. 3. Based on production type
Europe
America
16.1%
29.3%
Asia
Middle East/Africa
49.8%
4.8%
THE AUTOMOBILE INDUSTRY POCKET GUIDE 2017 / 2018
32
WWW.ACEA.BE
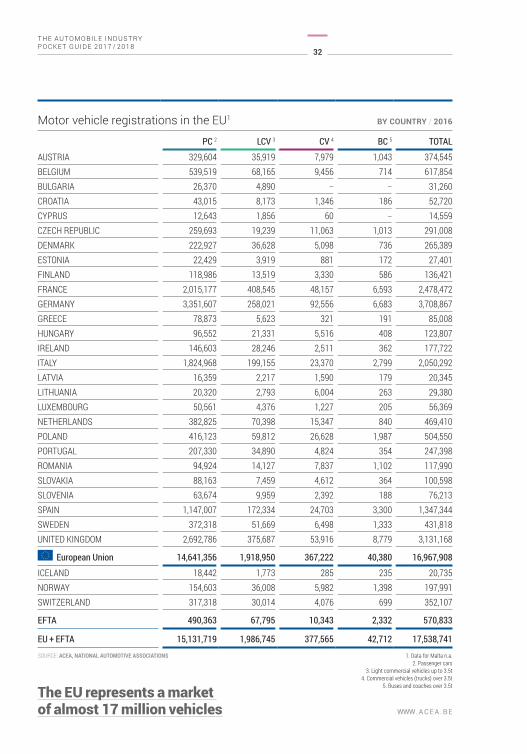
The EU represents a market of almost 17 million vehicles
Motor vehicle registrations in the EU1 BY COUNTRY / 2016
PC 2 LCV 3 CV 4 BC 5 TOTAL
AUSTRIA 329,604 35,919 7,979 1,043 374,545 BELGIUM 539,519 68,165 9,456 714 617,854 BULGARIA 26,370 4,890 – – 31,260 CROATIA 43,015 8,173 1,346 186 52,720 CYPRUS 12,643 1,856 60 – 14,559 CZECH REPUBLIC 259,693 19,239 11,063 1,013 291,008 DENMARK 222,927 36,628 5,098 736 265,389 ESTONIA 22,429 3,919 881 172 27,401 FINLAND 118,986 13,519 3,330 586 136,421 FRANCE 2,015,177 408,545 48,157 6,593 2,478,472 GERMANY 3,351,607 258,021 92,556 6,683 3,708,867 GREECE 78,873 5,623 321 191 85,008 HUNGARY 96,552 21,331 5,516 408 123,807 IRELAND 146,603 28,246 2,511 362 177,722 ITALY 1,824,968 199,155 23,370 2,799 2,050,292 LATVIA 16,359 2,217 1,590 179 20,345 LITHUANIA 20,320 2,793 6,004 263 29,380 LUXEMBOURG 50,561 4,376 1,227 205 56,369 NETHERLANDS 382,825 70,398 15,347 840 469,410 POLAND 416,123 59,812 26,628 1,987 504,550 PORTUGAL 207,330 34,890 4,824 354 247,398 ROMANIA 94,924 14,127 7,837 1,102 117,990 SLOVAKIA 88,163 7,459 4,612 364 100,598 SLOVENIA 63,674 9,959 2,392 188 76,213 SPAIN 1,147,007 172,334 24,703 3,300 1,347,344 SWEDEN 372,318 51,669 6,498 1,333 431,818 UNITED KINGDOM 2,692,786 375,687 53,916 8,779 3,131,168
European Union 14,641,356 1,918,950 367,222 40,380 16,967,908
ICELAND 18,442 1,773 285 235 20,735 NORWAY 154,603 36,008 5,982 1,398 197,991 SWITZERLAND 317,318 30,014 4,076 699 352,107
EFTA 490,363 67,795 10,343 2,332 570,833
EU + EFTA 15,131,719 1,986,745 377,565 42,712 17,538,741
SOURCE: ACEA, NATIONAL AUTOMOTIVE ASSOCIATIONS 1. Data for Malta n.a.2. Passenger cars
3. Light commercial vehicles up to 3.5t4. Commercial vehicles (trucks) over 3.5t
5. Buses and coaches over 3.5t
33
REGISTRATIONS
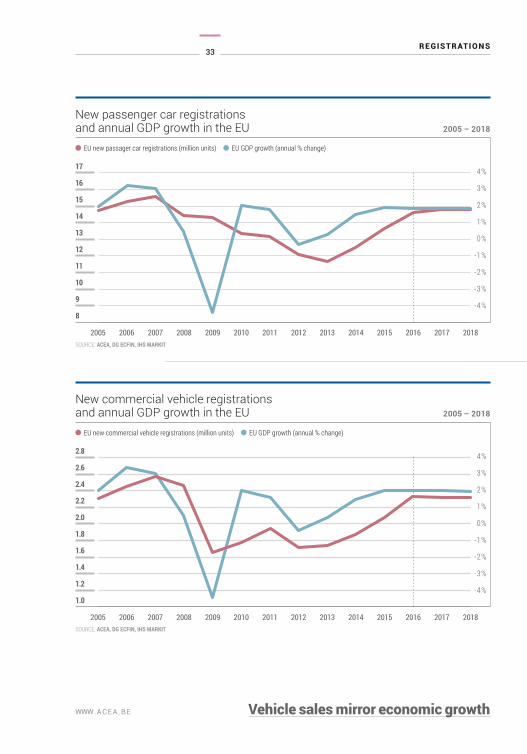
WWW.ACEA.BE Vehicle sales mirror economic growth
9
1.2
10
1.4
11
1.6
12
1.8
13
2.0
14
2.2
15
2.4
16
2.6
17
2.8
EU new commercial vehicle registrations (million units) EU GDP growth (annual % change)
EU new passager car registrations (million units) EU GDP growth (annual % change)
2005
2005
2006
2006
2007
2007
2008
2008
2009
2009
2010
2010
2011
2011
2012
2012
2013
2013
2014
2014
2015
2015
2016
2016
2017
2017
2018
2018
8
1.0
- 4 %
- 4 %
- 3 %
- 3 %
- 2 %
- 2 %
- 1 %
- 1 %
0 %
0 %
1 %
1 %
2 %
2 %
3 %
3 %
4 %
4 %
New passenger car registrationsand annual GDP growth in the EU 2005 – 2018
New commercial vehicle registrations and annual GDP growth in the EU 2005 – 2018
SOURCE: ACEA, DG ECFIN, IHS MARKIT
SOURCE: ACEA, DG ECFIN, IHS MARKIT
THE AUTOMOBILE INDUSTRY POCKET GUIDE 2017 / 2018
34
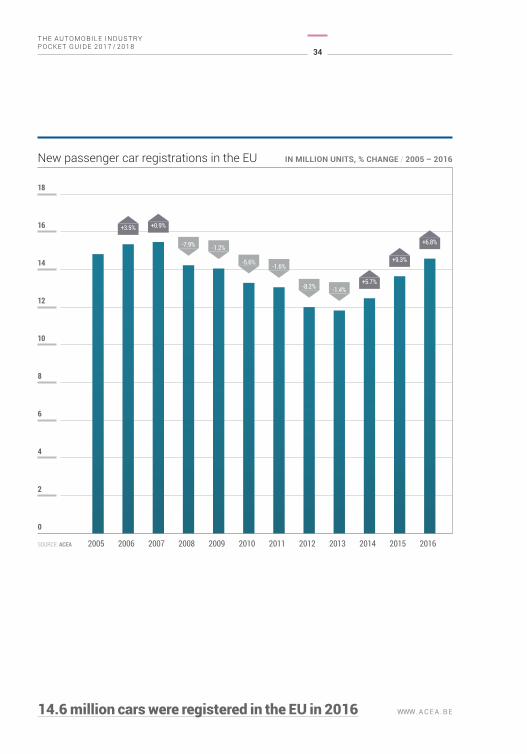
WWW.ACEA.BE14.6 million cars were registered in the EU in 2016
2
4
6
8
10
12
14
16
18
2005 2006 2007 2008 2009 2010 2011 2012 2013 2014 2015 2016
0
New passenger car registrations in the EU IN MILLION UNITS, % CHANGE / 2005 – 2016
-7.9% -1.2%
-5.6%-1.6%
-8.2% -1.4%
+3.5% +0.9%
+5.7%
+9.3%
+6.8%
SOURCE: ACEA
35
REGISTRATIONS
WWW.ACEA.BE
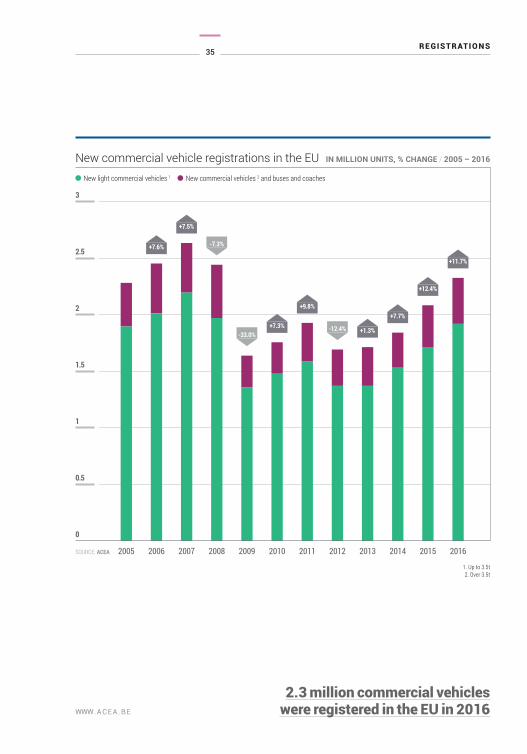
2.3 million commercial vehicles were registered in the EU in 2016
0.5
1
1.5
2
2.5
3
2005 2006 2007 2008 2009 2010 2011 2012 2013 2014 2015 2016
0
New commercial vehicle registrations in the EU IN MILLION UNITS, % CHANGE / 2005 – 2016
-7.3%
-33.0%-12.4%
+7.6%
+7.5%
+7.7%
+12.4%
+11.7%
+1.3%
+9.8%
+7.3%
SOURCE: ACEA
New light commercial vehicles 1 New commercial vehicles 2 and buses and coaches
1. Up to 3.5t2. Over 3.5t
THE AUTOMOBILE INDUSTRY POCKET GUIDE 2017 / 2018
36
WWW.ACEA.BE
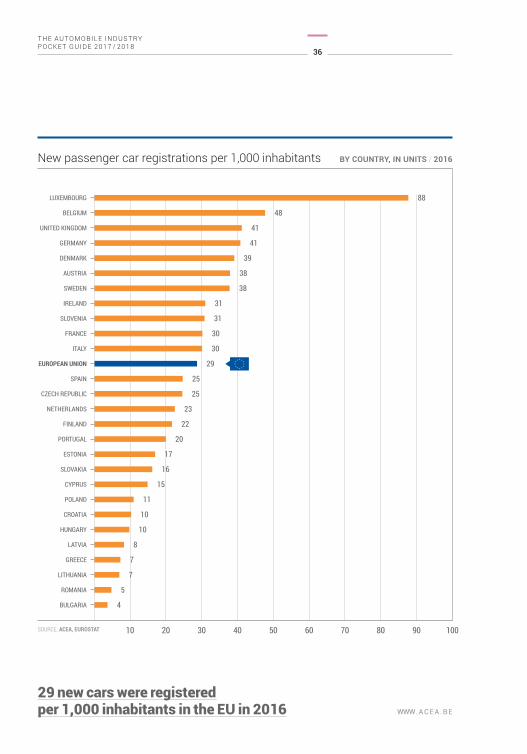
29 new cars were registeredper 1,000 inhabitants in the EU in 2016
10 20 30 40 50 60 70 80 90 100
New passenger car registrations per 1,000 inhabitants BY COUNTRY, IN UNITS / 2016
BULGARIA
ROMANIA
LITHUANIA
GREECE
LATVIA
HUNGARY
CROATIA
POLAND
CYPRUS
SLOVAKIA
ESTONIA
PORTUGAL
FINLAND
NETHERLANDS
CZECH REPUBLIC
SPAIN
EUROPEAN UNION
ITALY
FRANCE
SLOVENIA
IRELAND
SWEDEN
AUSTRIA
DENMARK
GERMANY
UNITED KINGDOM
BELGIUM
LUXEMBOURG
SOURCE: ACEA, EUROSTAT
88
48
41
41
39
38
38
31
31
30
30
29
25
25
23
22
20
17
16
15
11
10
10
8
7
7
5
4
37
REGISTRATIONS
WWW.ACEA.BE
2
14
12
10
8
6
4
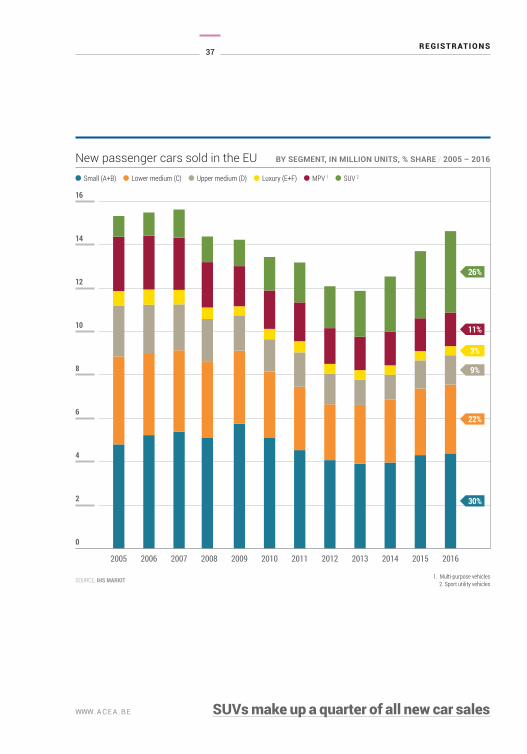
SUVs make up a quarter of all new car sales
16
2005 2006 2007 2008 2009 2010 2011 2012 2013 2014 2015 2016
0
New passenger cars sold in the EU BY SEGMENT, IN MILLION UNITS, % SHARE / 2005 – 2016
SOURCE: IHS MARKIT
Small (A+B) Lower medium (C) Upper medium (D) Luxury (E+F) MPV 1 SUV 2
11%
3%
9%
22%
30%
1. Multi-purpose vehicles2. Sport utility vehicles
26%
THE AUTOMOBILE INDUSTRY POCKET GUIDE 2017 / 2018
38
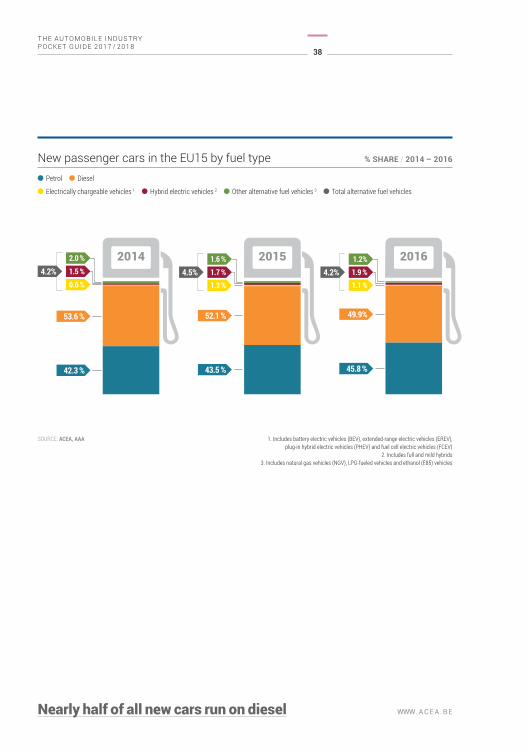
WWW.ACEA.BENearly half of all new cars run on diesel
New passenger cars in the EU15 by fuel type % SHARE / 2014 – 2016
2015 2016
SOURCE: ACEA, AAA
Petrol Diesel
Electrically chargeable vehicles 1 Hybrid electric vehicles 2 Other alternative fuel vehicles 3 Total alternative fuel vehicles
1.6 %
52.1 % 49.9%
43.5 % 45.8 %
2014
0.6 %
1.5 %
53.6 %
42.3 %
1.2 %1.7 %
1. Includes battery electric vehicles (BEV), extended-range electric vehicles (EREV), plug-in hybrid electric vehicles (PHEV) and fuel cell electric vehicles (FCEV)
2. Includes full and mild hybrids3. Includes natural gas vehicles (NGV), LPG-fueled vehicles and ethanol (E85) vehicles
1.2%
1.1 %1.9 %
2.0 %
4.2% 4.5% 4.2%
Vehicles in use
THE AUTOMOBILE INDUSTRYPOCKET GUIDE 2017 / 2018
WWW.ACEA.BE
4

WWW.ACEA.BE
41
VEHICLES IN USE
WWW.ACEA.BE
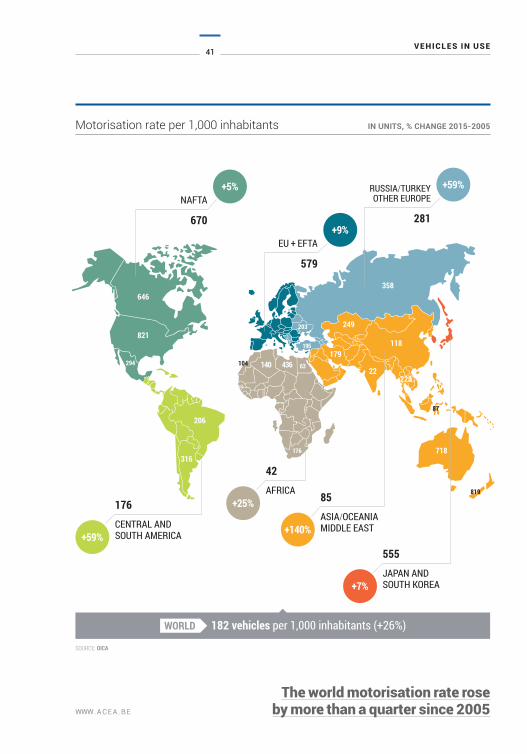
The world motorisation rate roseby more than a quarter since 2005
Motorisation rate per 1,000 inhabitants IN UNITS, % CHANGE 2015-2005
SOURCE: OICA
670
579
281
CENTRAL AND SOUTH AMERICA
ASIA/OCEANIAMIDDLE EAST
JAPAN AND SOUTH KOREA
AFRICA
646
821
+5%
+9%
+59%NAFTA
EU + EFTA
RUSSIA/TURKEYOTHER EUROPE
17685
555
42
+59%+140%
+7%
+25%
206
316
294
358
195
203
140 63
176
22
118
249
718
228
87
819
436104179
THE AUTOMOBILE INDUSTRY POCKET GUIDE 2017 / 2018
42
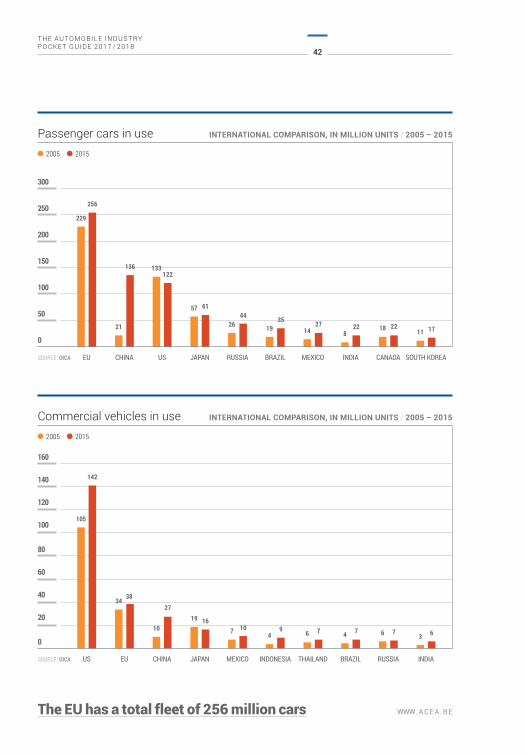
WWW.ACEA.BEThe EU has a total fleet of 256 million cars
Passenger cars in use INTERNATIONAL COMPARISON, IN MILLION UNITS / 2005 – 2015
0
50
100
150
200
250
300
2005 2015
SOURCE: OICA EU CHINA US JAPAN RUSSIA BRAZIL MEXICO INDIA CANADA SOUTH KOREA
229
256
122
6144 35 27 22 22 17
133
57
26 19 14 818 11
Commercial vehicles in use INTERNATIONAL COMPARISON, IN MILLION UNITS / 2005 – 2015
0
20
40
60
80
100
120
140
160
2005 2015
SOURCE: OICA US EU CHINA JAPAN MEXICO INDONESIA THAILAND BRAZIL RUSSIA INDIA
105
34
1019
74 6 4 6 3
142
38
27
1610 9 7 7 7 6
136
21
43
VEHICLES IN USE
WWW.ACEA.BE
100 200 300 400 500 600 700
MALTA
LUXEMBOURG
ITALY
POLAND
AUSTRIA
ESTONIA
SPAIN
GERMANY
UNITED KINGDOM
FRANCE
SLOVENIA
EUROPEAN UNION
BELGIUM
PORTUGAL
GREECE
CZECH REPUBLIC
NETHERLAND
SWEDEN
CYPRUS
BULGARIA
DENMARK
IRELAND
FINLAND
LITHUANIA
SLOVAKIA
CROATIA
LATVIA
HUNGARY
ROMANIA
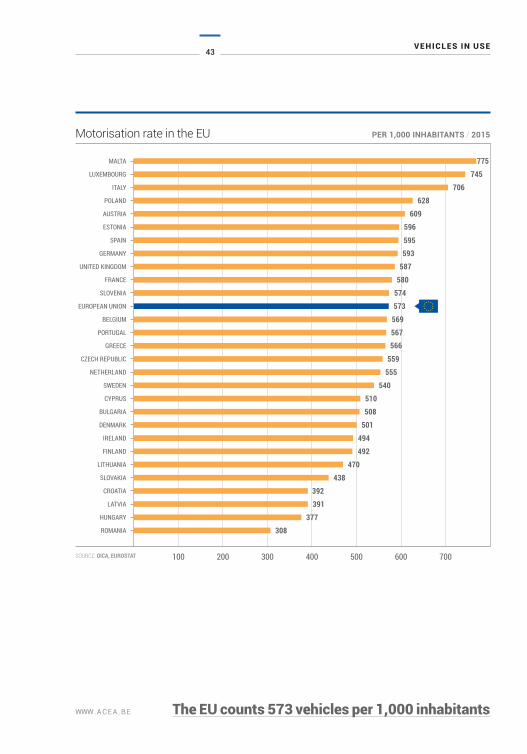
Motorisation rate in the EU PER 1,000 INHABITANTS / 2015
The EU counts 573 vehicles per 1,000 inhabitants
SOURCE: OICA, EUROSTAT
775745
706628
609596
595593
587580
574573
569567566
559555
540510508
501494492
470438
392391
377308
THE AUTOMOBILE INDUSTRY POCKET GUIDE 2017 / 2018
44
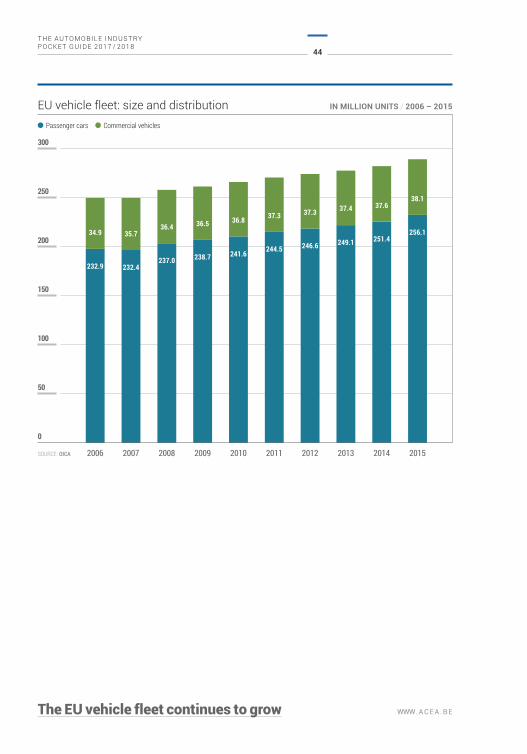
WWW.ACEA.BEThe EU vehicle fleet continues to grow
50
100
150
200
250
300
0
EU vehicle fleet: size and distribution IN MILLION UNITS / 2006 – 2015
SOURCE: OICA 2006 2007 2008 2009 2010 2011 2012 2013 2014 2015
Passenger cars Commercial vehicles
34.9 35.736.4 36.5 36.8 37.3 37.3 37.4 37.6
38.1
232.9 232.4237.0 238.7 241.6 244.5 246.6 249.1 251.4
256.1
45
VEHICLES IN USE
WWW.ACEA.BE
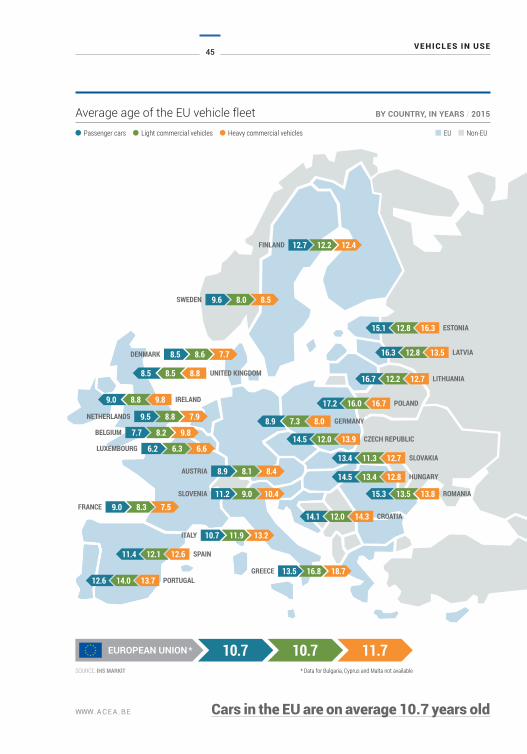
Average age of the EU vehicle fleet BY COUNTRY, IN YEARS / 2015
8.4AUSTRIA 8.18.9
10.4SLOVENIA 9.011.2
SOURCE: IHS MARKIT
12.4FINLAND 12.212.7
8.5SWEDEN 8.09.6
12.6 PORTUGAL14.0 13.7
11.4 SPAIN12.1 12.6
18.7GREECE 16.813.5
13.2ITALY 11.910.7
7.5FRANCE 8.39.0
9.8BELGIUM 8.27.7
7.9NETHERLANDS 8.89.5
14.1 CROATIA12.0 14.3
9.0 IRELAND8.8 9.8
8.5 UNITED KINGDOM8.5 8.8
7.7DENMARK 8.68.5
15.3 ROMANIA13.5 13.8
16.7 LITHUANIA12.2 12.7
16.3 LATVIA12.8 13.5
15.1 ESTONIA12.8 16.3
6.6LUXEMBOURG 6.36.2
14.5 HUNGARY13.4 12.8
17.2 POLAND16.0 16.7
14.5 CZECH REPUBLIC12.0 13.9
13.4 SLOVAKIA11.3 12.7
8.9 GERMANY7.3 8.0
Cars in the EU are on average 10.7 years old
Passenger cars Light commercial vehicles Heavy commercial vehicles EU Non-EU
* Data for Bulgaria, Cyprus and Malta not available
THE AUTOMOBILE INDUSTRY POCKET GUIDE 2017 / 2018
46
WWW.ACEA.BE
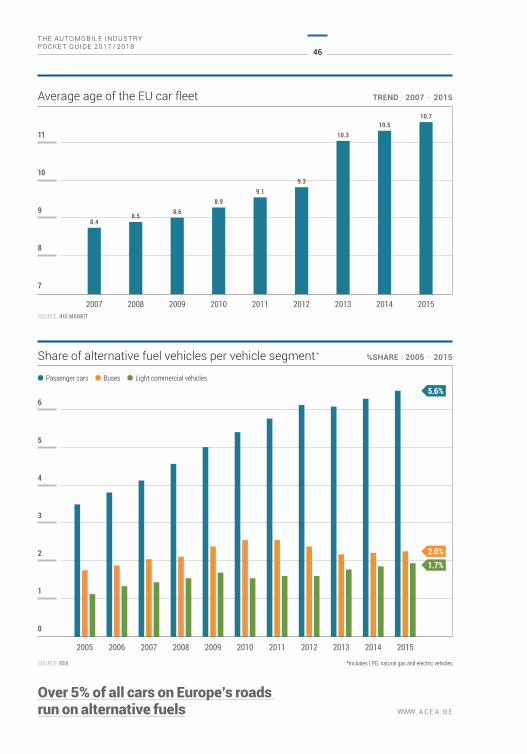
Over 5% of all cars on Europe’s roads run on alternative fuels
7
8
0
1
2
3
4
5
6
9
10
11
2007
2005 2006 2007 2008 2009 2010 2011 2012 2013 2014 2015
2008 2009 2010 2011 2012 2013 2014 2015SOURCE: IHS MARKIT
SOURCE: EEA
Average age of the EU car fleet TREND / 2007 – 2015
Share of alternative fuel vehicles per vehicle segment * %SHARE / 2005 – 2015
8.48.5 8.6
8.99.1
9.3
10.310.5
10.7
*Includes LPG, natural gas and electric vehicles
5.6%
2.0%1.7%
Passenger cars Buses Light commercial vehicles
Trade
THE AUTOMOBILE INDUSTRYPOCKET GUIDE 2017 / 2018
WWW.ACEA.BE
5

WWW.ACEA.BE
49
TRADE
WWW.ACEA.BE
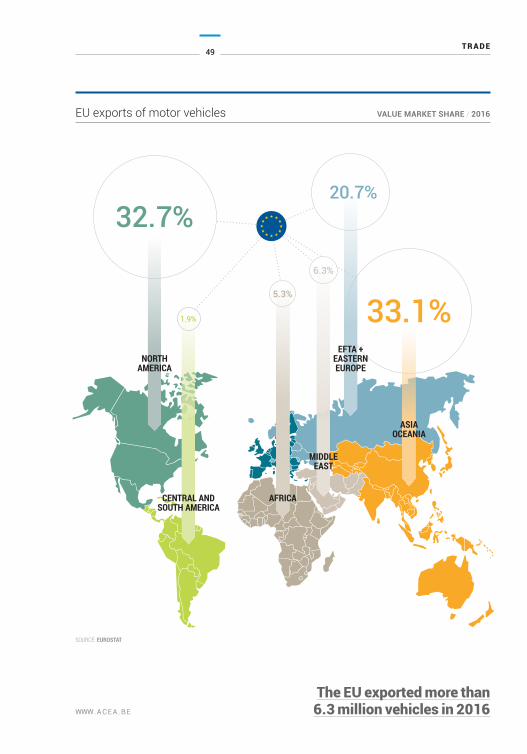
EU exports of motor vehicles VALUE MARKET SHARE / 2016
The EU exported more than6.3 million vehicles in 2016
SOURCE: EUROSTAT
NORTHAMERICA
CENTRAL AND SOUTH AMERICA
AFRICA
MIDDLEEAST
EFTA +EASTERNEUROPE
ASIAOCEANIA
THE AUTOMOBILE INDUSTRY POCKET GUIDE 2017 / 2018
50
WWW.ACEA.BE
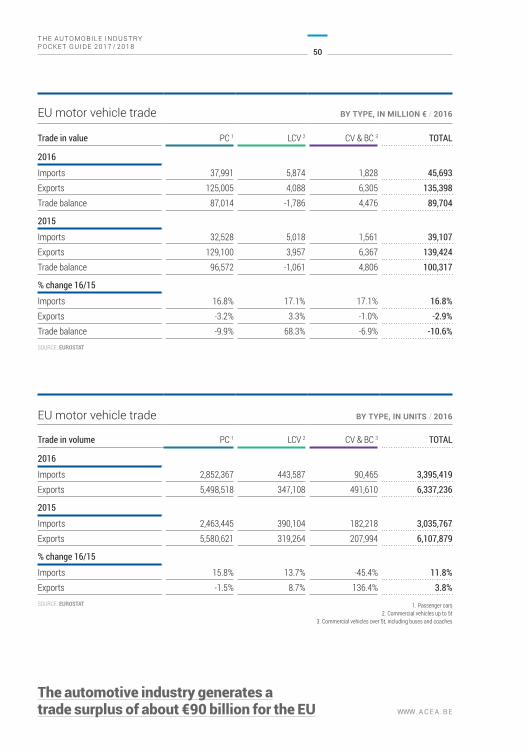
EU motor vehicle trade BY TYPE, IN MILLION € / 2016
Trade in value PC 1 LCV 2 CV & BC 3 TOTAL
2016
Imports 37,991 5,874 1,828 45,693Exports 125,005 4,088 6,305 135,398Trade balance 87,014 -1,786 4,476 89,704
2015
Imports 32,528 5,018 1,561 39,107Exports 129,100 3,957 6,367 139,424Trade balance 96,572 -1,061 4,806 100,317
% change 16/15
Imports 16.8% 17.1% 17.1% 16.8%Exports -3.2% 3.3% -1.0% -2.9%Trade balance -9.9% 68.3% -6.9% -10.6%SOURCE: EUROSTAT
EU motor vehicle trade BY TYPE, IN UNITS / 2016
Trade in volume PC 1 LCV 2 CV & BC 3 TOTAL
2016
Imports 2,852,367 443,587 90,465 3,395,419Exports 5,498,518 347,108 491,610 6,337,236
2015
Imports 2,463,445 390,104 182,218 3,035,767Exports 5,580,621 319,264 207,994 6,107,879
% change 16/15
Imports 15.8% 13.7% -45.4% 11.8%Exports -1.5% 8.7% 136.4% 3.8%SOURCE: EUROSTAT
The automotive industry generates atrade surplus of about €90 billion for the EU
1. Passenger cars2. Commercial vehicles up to 5t
3. Commercial vehicles over 5t, including buses and coaches
51
TRADE
WWW.ACEA.BE
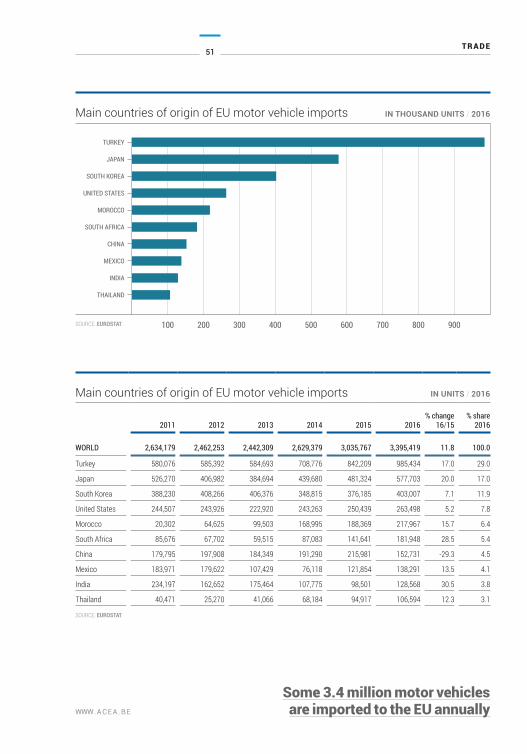
Main countries of origin of EU motor vehicle imports IN UNITS / 2016
2011 2012 2013 2014 2015 2016% change
16/15% share
2016
WORLD 2,634,179 2,462,253 2,442,309 2,629,379 3,035,767 3,395,419 11.8 100.0
Turkey 580,076 585,392 584,693 708,776 842,209 985,434 17.0 29.0
Japan 526,270 406,982 384,694 439,680 481,324 577,703 20.0 17.0
South Korea 388,230 408,266 406,376 348,815 376,185 403,007 7.1 11.9
United States 244,507 243,926 222,920 243,263 250,439 263,498 5.2 7.8
Morocco 20,302 64,625 99,503 168,995 188,369 217,967 15.7 6.4
South Africa 85,676 67,702 59,515 87,083 141,641 181,948 28.5 5.4
China 179,795 197,908 184,349 191,290 215,981 152,731 -29.3 4.5
Mexico 183,971 179,622 107,429 76,118 121,854 138,291 13.5 4.1
India 234,197 162,652 175,464 107,775 98,501 128,568 30.5 3.8
Thailand 40,471 25,270 41,066 68,184 94,917 106,594 12.3 3.1
SOURCE: EUROSTAT
100 200 300 400 500 600 700 800 900
TURKEY
JAPAN
SOUTH KOREA
UNITED STATES
MOROCCO
SOUTH AFRICA
CHINA
MEXICO
INDIA
THAILAND
Main countries of origin of EU motor vehicle imports IN THOUSAND UNITS / 2016
SOURCE: EUROSTAT
Some 3.4 million motor vehicles are imported to the EU annually
THE AUTOMOBILE INDUSTRY POCKET GUIDE 2017 / 2018
52
WWW.ACEA.BE
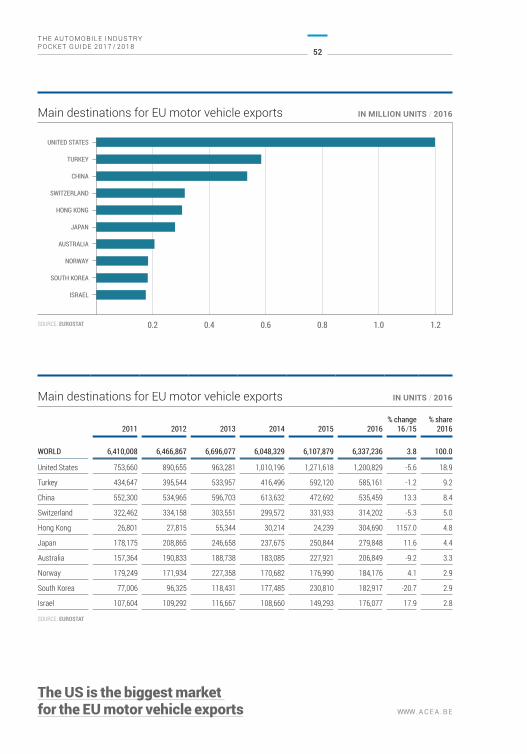
Main destinations for EU motor vehicle exports IN UNITS / 2016
2011 2012 2013 2014 2015 2016% change
16 /15% share
2016
WORLD 6,410,008 6,466,867 6,696,077 6,048,329 6,107,879 6,337,236 3.8 100.0
United States 753,660 890,655 963,281 1,010,196 1,271,618 1,200,829 -5.6 18.9
Turkey 434,647 395,544 533,957 416,496 592,120 585,161 -1.2 9.2
China 552,300 534,965 596,703 613,632 472,692 535,459 13.3 8.4
Switzerland 322,462 334,158 303,551 299,572 331,933 314,202 -5.3 5.0
Hong Kong 26,801 27,815 55,344 30,214 24,239 304,690 1157.0 4.8
Japan 178,175 208,865 246,658 237,675 250,844 279,848 11.6 4.4
Australia 157,364 190,833 188,738 183,085 227,921 206,849 -9.2 3.3
Norway 179,249 171,934 227,358 170,682 176,990 184,176 4.1 2.9
South Korea 77,006 96,325 118,431 177,485 230,810 182,917 -20.7 2.9
Israel 107,604 109,292 116,667 108,660 149,293 176,077 17.9 2.8
SOURCE: EUROSTAT
0.2 0.4 0.6 0.8 1.0 1.2
UNITED STATES
TURKEY
CHINA
SWITZERLAND
HONG KONG
JAPAN
AUSTRALIA
NORWAY
SOUTH KOREA
ISRAEL
Main destinations for EU motor vehicle exports IN MILLION UNITS / 2016
SOURCE: EUROSTAT
The US is the biggest market for the EU motor vehicle exports
53
TRADE
WWW.ACEA.BE
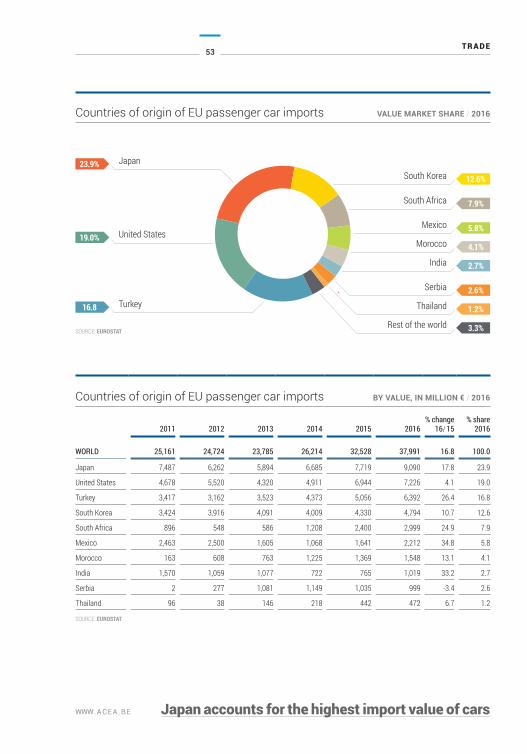
Countries of origin of EU passenger car imports BY VALUE, IN MILLION € / 2016
2011 2012 2013 2014 2015 2016% change
16/ 15% share
2016
WORLD 25,161 24,724 23,785 26,214 32,528 37,991 16.8 100.0
Japan 7,487 6,262 5,894 6,685 7,719 9,090 17.8 23.9
United States 4,678 5,520 4,320 4,911 6,944 7,226 4.1 19.0
Turkey 3,417 3,162 3,523 4,373 5,056 6,392 26.4 16.8
South Korea 3,424 3,916 4,091 4,009 4,330 4,794 10.7 12.6
South Africa 896 548 586 1,208 2,400 2,999 24.9 7.9
Mexico 2,463 2,500 1,605 1,068 1,641 2,212 34.8 5.8
Morocco 163 608 763 1,225 1,369 1,548 13.1 4.1
India 1,570 1,059 1,077 722 765 1,019 33.2 2.7
Serbia 2 277 1,081 1,149 1,035 999 -3.4 2.6
Thailand 96 38 146 218 442 472 6.7 1.2
SOURCE: EUROSTAT
Japan accounts for the highest import value of cars
Countries of origin of EU passenger car imports VALUE MARKET SHARE / 2016
South Korea
South Africa
Mexico
Morocco
India
Serbia
Thailand
Rest of the world
12.6%
7.9%
5.8%
4.1%
2.7%
2.6%
3.3%
1.2%
Japan
United States
Turkey
19.0%
23.9%
SOURCE: EUROSTAT
16.8
THE AUTOMOBILE INDUSTRY POCKET GUIDE 2017 / 2018
54
WWW.ACEA.BE
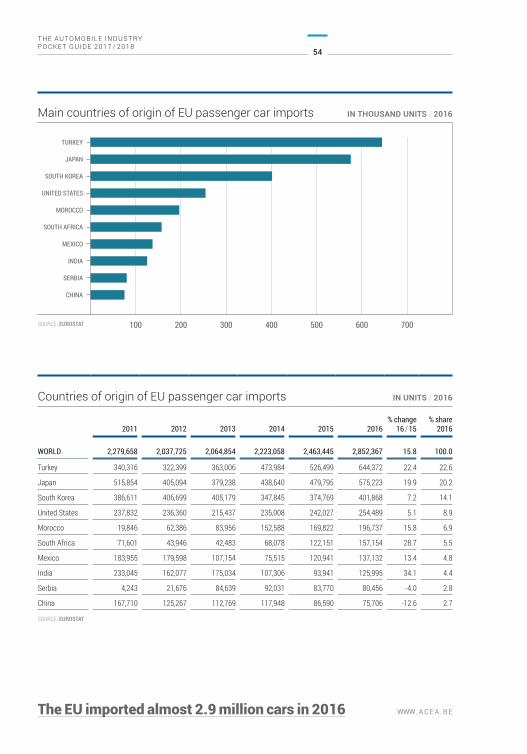
Countries of origin of EU passenger car imports IN UNITS / 2016
2011 2012 2013 2014 2015 2016% change
16 / 15% share
2016
WORLD 2,279,658 2,037,725 2,064,854 2,223,058 2,463,445 2,852,367 15.8 100.0
Turkey 340,316 322,399 363,006 473,984 526,499 644,372 22.4 22.6
Japan 515,854 405,094 379,238 438,640 479,795 575,223 19.9 20.2
South Korea 386,611 406,699 405,179 347,845 374,769 401,868 7.2 14.1
United States 237,832 236,360 215,437 235,008 242,027 254,489 5.1 8.9
Morocco 19,846 62,386 83,956 152,588 169,822 196,737 15.8 6.9
South Africa 71,601 43,946 42,483 68,078 122,151 157,154 28.7 5.5
Mexico 183,955 179,598 107,154 75,515 120,941 137,132 13.4 4.8
India 233,045 162,077 175,034 107,306 93,941 125,995 34.1 4.4
Serbia 4,243 21,676 84,639 92,031 83,770 80,456 -4.0 2.8
China 167,710 125,267 112,769 117,948 86,590 75,706 -12.6 2.7
SOURCE: EUROSTAT
100 200 300 400 500 600 700
TURKEY
JAPAN
SOUTH KOREA
UNITED STATES
MOROCCO
SOUTH AFRICA
MEXICO
INDIA
SERBIA
CHINA
Main countries of origin of EU passenger car imports IN THOUSAND UNITS / 2016
SOURCE: EUROSTAT
The EU imported almost 2.9 million cars in 2016
55
TRADE
WWW.ACEA.BE
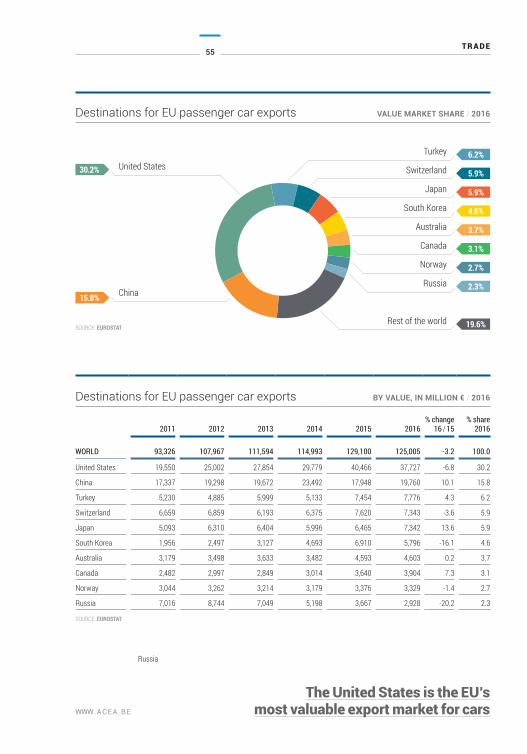
Destinations for EU passenger car exports BY VALUE, IN MILLION € / 2016
2011 2012 2013 2014 2015 2016% change
16 / 15% share
2016
WORLD 93,326 107,967 111,594 114,993 129,100 125,005 -3.2 100.0
United States 19,550 25,002 27,854 29,779 40,466 37,727 -6.8 30.2
China 17,337 19,298 19,672 23,492 17,948 19,760 10.1 15.8
Turkey 5,230 4,885 5,999 5,133 7,454 7,776 4.3 6.2
Switzerland 6,659 6,859 6,193 6,375 7,620 7,343 -3.6 5.9
Japan 5,093 6,310 6,404 5,996 6,465 7,342 13.6 5.9
South Korea 1,956 2,497 3,127 4,693 6,910 5,796 -16.1 4.6
Australia 3,179 3,498 3,633 3,482 4,593 4,603 0.2 3.7
Canada 2,482 2,997 2,849 3,014 3,640 3,904 7.3 3.1
Norway 3,044 3,262 3,214 3,179 3,376 3,329 -1.4 2.7
Russia 7,016 8,744 7,049 5,198 3,667 2,928 -20.2 2.3
SOURCE: EUROSTAT
SOURCE: EUROSTAT
The United States is the EU’s most valuable export market for cars
Destinations for EU passenger car exports VALUE MARKET SHARE / 2016
United States
China
30.2%
15.8%
Switzerland
Japan
South Korea
Australia
Canada
Norway
Russia
Rest of the world
Turkey
5.9%
5.9%
4.6%
3.7%
3.1%
2.7%
2.3%
19.6%
6.2%
Russia
THE AUTOMOBILE INDUSTRY POCKET GUIDE 2017 / 2018
56
WWW.ACEA.BE
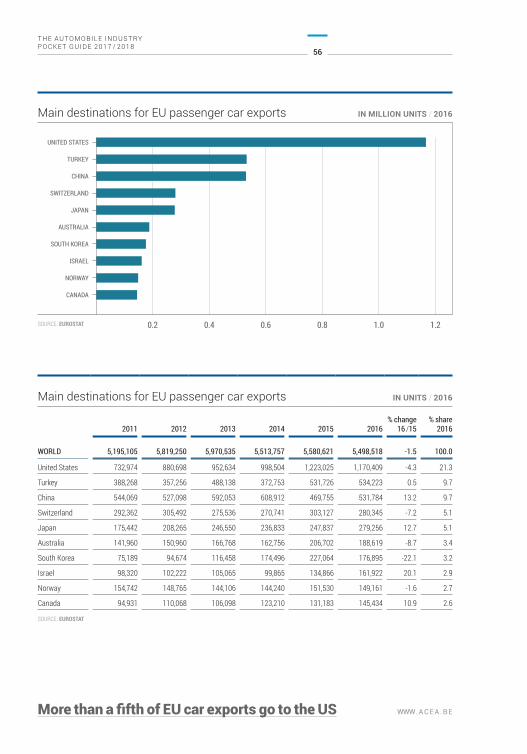
Main destinations for EU passenger car exports IN UNITS / 2016
2011 2012 2013 2014 2015 2016% change
16 /15% share
2016
WORLD 5,195,105 5,819,250 5,970,535 5,513,757 5,580,621 5,498,518 -1.5 100.0
United States 732,974 880,698 952,634 998,504 1,223,025 1,170,409 -4.3 21.3
Turkey 388,268 357,256 488,138 372,753 531,726 534,223 0.5 9.7
China 544,069 527,098 592,053 608,912 469,755 531,784 13.2 9.7
Switzerland 292,362 305,492 275,536 270,741 303,127 280,345 -7.2 5.1
Japan 175,442 208,265 246,550 236,833 247,837 279,256 12.7 5.1
Australia 141,960 150,960 166,768 162,756 206,702 188,619 -8.7 3.4
South Korea 75,189 94,674 116,458 174,496 227,064 176,895 -22.1 3.2
Israel 98,320 102,222 105,065 99,865 134,866 161,922 20.1 2.9
Norway 154,742 148,765 144,106 144,240 151,530 149,161 -1.6 2.7
Canada 94,931 110,068 106,098 123,210 131,183 145,434 10.9 2.6
SOURCE: EUROSTAT
More than a fifth of EU car exports go to the US
UNITED STATES
TURKEY
CHINA
SWITZERLAND
JAPAN
AUSTRALIA
SOUTH KOREA
ISRAEL
NORWAY
CANADA
Main destinations for EU passenger car exports IN MILLION UNITS / 2016
SOURCE: EUROSTAT 0.2 0.4 0.6 0.8 1.0 1.2
THE AUTOMOBILE INDUSTRYPOCKET GUIDE 2017 / 2018
WWW.ACEA.BE
6
Environment

WWW.ACEA.BE
59
ENVIRONMENT
WWW.ACEA.BE
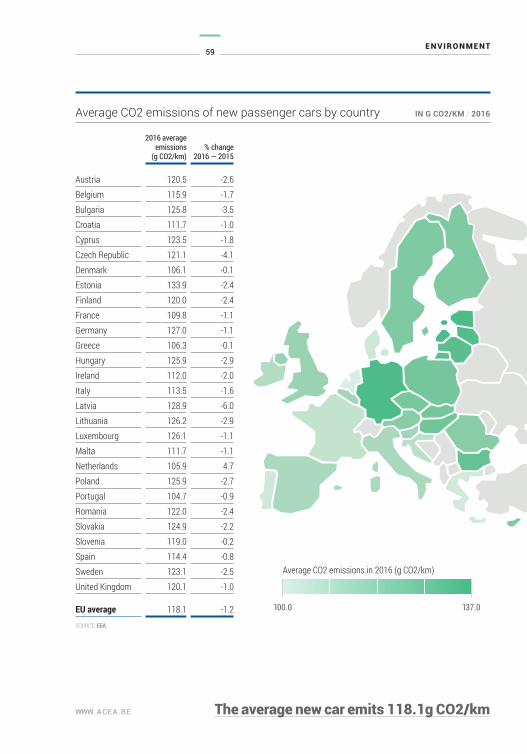
2016 average emissions
(g CO2/km)% change
2016 — 2015
Austria 120.5 -2.6Belgium 115.9 -1.7Bulgaria 125.8 -3.5Croatia 111.7 -1.0Cyprus 123.5 -1.8Czech Republic 121.1 -4.1Denmark 106.1 -0.1Estonia 133.9 -2.4Finland 120.0 -2.4France 109.8 -1.1Germany 127.0 -1.1Greece 106.3 -0.1Hungary 125.9 -2.9Ireland 112.0 -2.0Italy 113.5 -1.6Latvia 128.9 -6.0Lithuania 126.2 -2.9Luxembourg 126.1 -1.1Malta 111.7 -1.1Netherlands 105.9 4.7Poland 125.9 -2.7Portugal 104.7 -0.9Romania 122.0 -2.4Slovakia 124.9 -2.2Slovenia 119.0 -0.2Spain 114.4 -0.8Sweden 123.1 -2.5United Kingdom 120.1 -1.0
EU average 118.1 -1.2SOURCE: EEA
The average new car emits 118.1g CO2/km
Average CO2 emissions in 2016 (g CO2/km)
100.0 137.0
Average CO2 emissions of new passenger cars by country IN G CO2/KM / 2016
THE AUTOMOBILE INDUSTRY POCKET GUIDE 2017 / 2018
60
WWW.ACEA.BE
6
8
10
2
4
2009 2010 2011 2012 2013 2014 2015 2016 10
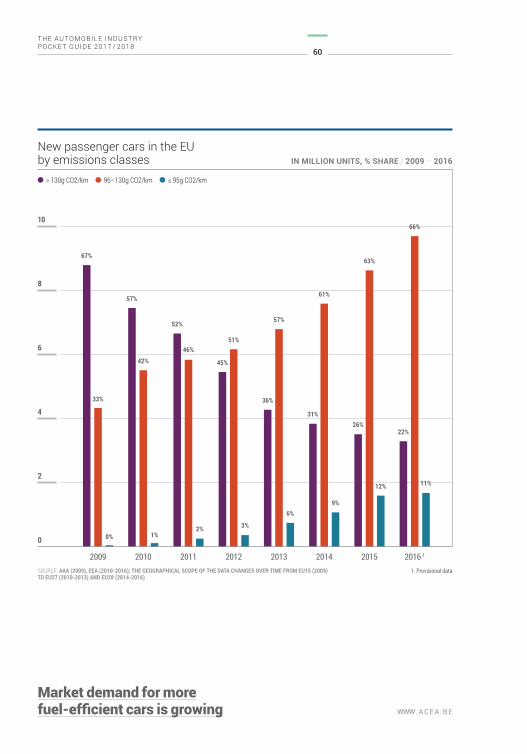
New passenger cars in the EU by emissions classes IN MILLION UNITS, % SHARE / 2009 – 2016
SOURCE: AAA (2009), EEA (2010-2016); THE GEOGRAPHICAL SCOPE OF THE DATA CHANGES OVER TIME FROM EU15 (2009)TO EU27 (2010-2013) AND EU28 (2014-2016)
> 130g CO2/km 96–130g CO2/km ≤ 95g CO2/km
1. Provisional data
0% 1%
67%
57%
52%
45%
36%
31%26%
22%
33%
42%
46%51%
57%
61%
63%
66%
2% 3%
6%9%
12% 11%
Market demand for morefuel-efficient cars is growing
61
ENVIRONMENT
WWW.ACEA.BE
44
43
42
41
40
39
38
37
36
Energy total (million MWh/year) Car production trend Energy per unit produced (MWh/car)
2007 2008 2009 2010 2011 2012 2013 2014 2015 2016
2.9
2.1
2.7
2.8
2.6
2.5
2.4
2.3
2.2
SOURCE: ACEA MEMBERS
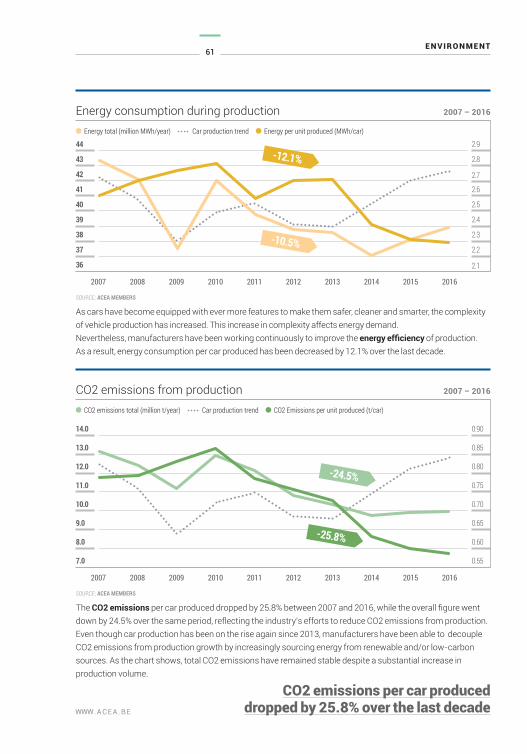
Energy consumption during production 2007 – 2016
-12.1%
-10.5%
As cars have become equipped with ever more features to make them safer, cleaner and smarter, the complexity of vehicle production has increased. This increase in complexity affects energy demand. Nevertheless, manufacturers have been working continuously to improve the energy efficiency of production. As a result, energy consumption per car produced has been decreased by 12.1% over the last decade.
14.0
13.0
12.0
11.0
10.0
9.0
8.0
CO2 emissions total (million t/year) Car production trend CO2 Emissions per unit produced (t/car)
2007 2008 2009 2010 2011 2012 2013 2014 2015 2016
7.0
0.90
0.85
0.80
0.75
0.70
0.65
0.60
0.55
SOURCE: ACEA MEMBERS
CO2 emissions from production 2007 – 2016
-24.5%
-25.8%
The CO2 emissions per car produced dropped by 25.8% between 2007 and 2016, while the overall figure went down by 24.5% over the same period, reflecting the industry’s efforts to reduce CO2 emissions from production. Even though car production has been on the rise again since 2013, manufacturers have been able to decouple CO2 emissions from production growth by increasingly sourcing energy from renewable and/or low-carbon sources. As the chart shows, total CO2 emissions have remained stable despite a substantial increase in production volume.
CO2 emissions per car produced dropped by 25.8% over the last decade
THE AUTOMOBILE INDUSTRY POCKET GUIDE 2017 / 2018
62
WWW.ACEA.BE
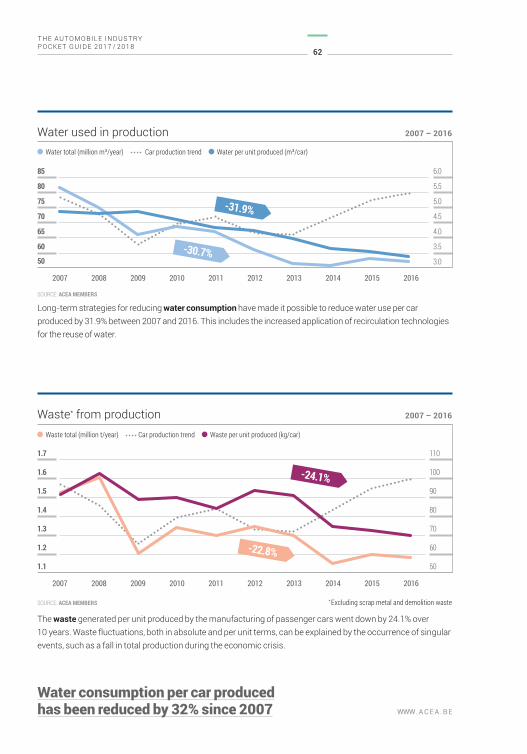
The waste generated per unit produced by the manufacturing of passenger cars went down by 24.1% over 10 years. Waste fluctuations, both in absolute and per unit terms, can be explained by the occurrence of singular events, such as a fall in total production during the economic crisis.
1.1
1.2
1.3
1.4
1.5
1.6
1.7
Waste total (million t/year) Car production trend Waste per unit produced (kg/car)
2007 2008 2009 2010 2011 2012 2013 2014 2015 2016
50
60
70
80
90
100
110
SOURCE: ACEA MEMBERS
Waste* from production 2007 – 2016
* Excluding scrap metal and demolition waste
-24.1%
-22.8%
85
80
75
70
65
60
Water total (million m³/year) Car production trend Water per unit produced (m³/car)
2007 2008 2009 2010 2011 2012 2013 2014 2015 2016
50
6.0
5.5
5.0
4.5
4.0
3.5
3.0
SOURCE: ACEA MEMBERS
Water used in production 2007 – 2016
-31.9%
-30.7%
Long-term strategies for reducing water consumption have made it possible to reduce water use per car produced by 31.9% between 2007 and 2016. This includes the increased application of recirculation technologies for the reuse of water.
Water consumption per car producedhas been reduced by 32% since 2007
63
ENVIRONMENT
WWW.ACEA.BE
25
30
35
40
45
50
55
60
VOC emissions total (thousand tonnes) Car production trend VOC emissions per unit produced (kg/car)
2007 2008 2009 2010 2011 2012 2013 2014 2015 2016
20
3.8
3.6
3.4
3.2
3.0
2.8
2.6
2.4
2.2
SOURCE: ACEA MEMBERS
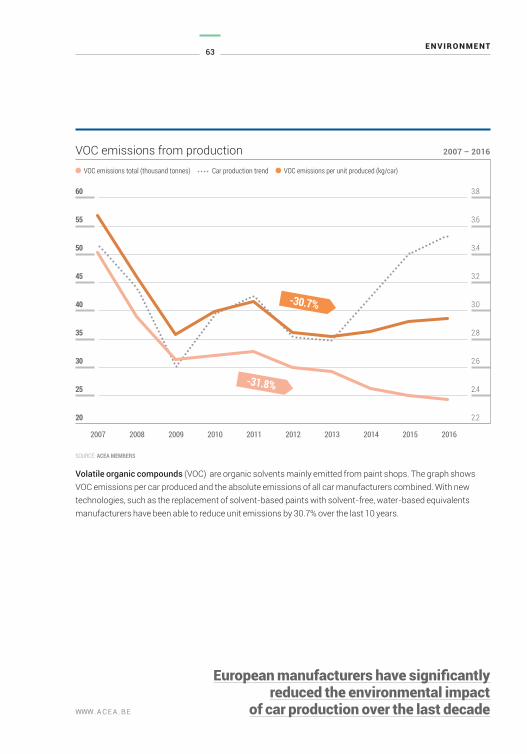
VOC emissions from production 2007 – 2016
-30.7%
-31.8%
Volatile organic compounds (VOC) are organic solvents mainly emitted from paint shops. The graph shows VOC emissions per car produced and the absolute emissions of all car manufacturers combined. With new technologies, such as the replacement of solvent-based paints with solvent-free, water-based equivalents manufacturers have been able to reduce unit emissions by 30.7% over the last 10 years.
European manufacturers have significantlyreduced the environmental impact
of car production over the last decade


THE AUTOMOBILE INDUSTRYPOCKET GUIDE 2017 / 2018
WWW.ACEA.BE
7
Innovation

WWW.ACEA.BE
67
INNOVATION
WWW.ACEA.BE
10 20 30 40 50 60 700
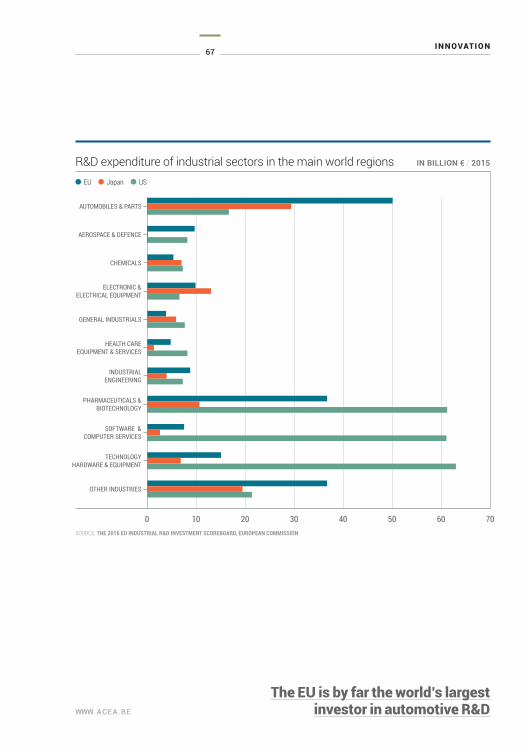
R&D expenditure of industrial sectors in the main world regions IN BILLION € / 2015
EU Japan US
SOURCE: THE 2016 EU INDUSTRIAL R&D INVESTMENT SCOREBOARD, EUROPEAN COMMISSION
AUTOMOBILES & PARTS
AEROSPACE & DEFENCE
CHEMICALS
ELECTRONIC & ELECTRICAL EQUIPMENT
GENERAL INDUSTRIALS
HEALTH CARE EQUIPMENT & SERVICES
INDUSTRIALENGINEERING
PHARMACEUTICALS & BIOTECHNOLOGY
SOFTWARE & COMPUTER SERVICES
TECHNOLOGY HARDWARE & EQUIPMENT
OTHER INDUSTRIES
The EU is by far the world’s largestinvestor in automotive R&D
THE AUTOMOBILE INDUSTRY POCKET GUIDE 2017 / 2018
68
WWW.ACEA.BE
0%
-2,0%
2.0%
4.0%
6.0%
8.0%
10.0%
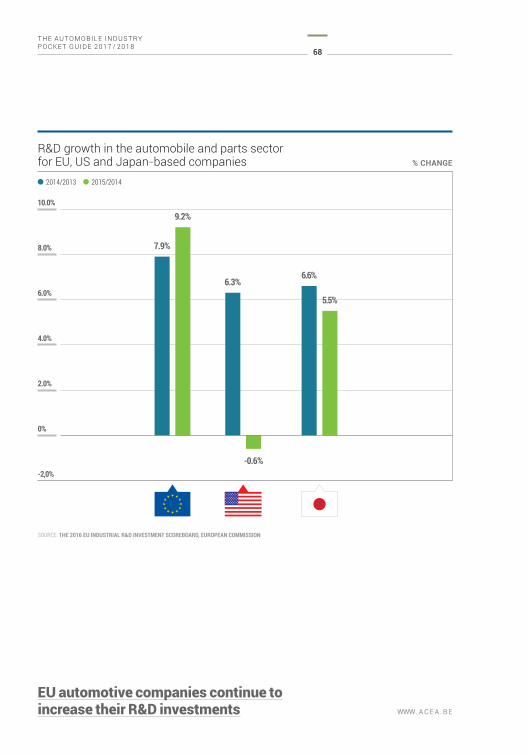
R&D growth in the automobile and parts sectorfor EU, US and Japan-based companies % CHANGE
SOURCE: THE 2016 EU INDUSTRIAL R&D INVESTMENT SCOREBOARD, EUROPEAN COMMISSION
2014/2013 2015/2014
EU automotive companies continue toincrease their R&D investments
9.2%
7.9%
-0.6%
6.3%
5.5%
6.6%
69
INNOVATION
WWW.ACEA.BE
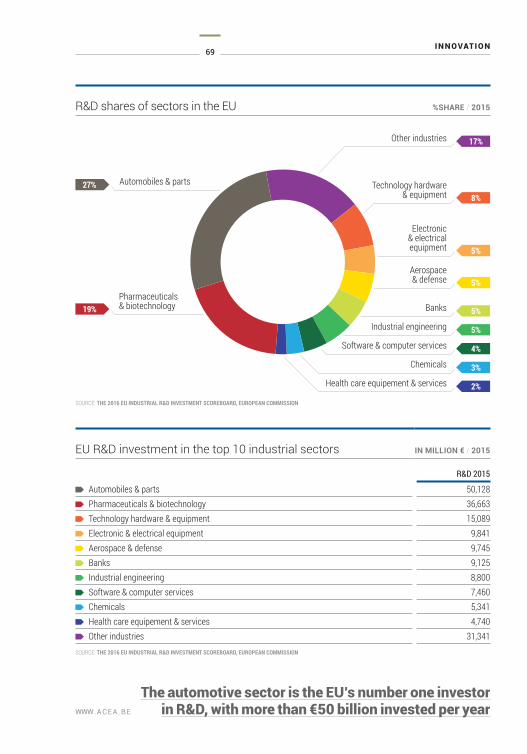
Automobiles & parts
Pharmaceuticals & biotechnology
Other industries
Technology hardware& equipment
Electronic & electrical equipment
Chemicals
Software & computer services
Industrial engineering
Banks
Health care equipement & services
17%
8%
5%
5%
3%
4%
5%
5%
2%
Aerospace & defense
27%
19%
R&D shares of sectors in the EU %SHARE / 2015
SOURCE: THE 2016 EU INDUSTRIAL R&D INVESTMENT SCOREBOARD, EUROPEAN COMMISSION
The automotive sector is the EU’s number one investor in R&D, with more than €50 billion invested per year
EU R&D investment in the top 10 industrial sectors IN MILLION € / 2015
R&D 2015
Automobiles & parts 50,128 Pharmaceuticals & biotechnology 36,663 Technology hardware & equipment 15,089 Electronic & electrical equipment 9,841 Aerospace & defense 9,745 Banks 9,125 Industrial engineering 8,800 Software & computer services 7,460 Chemicals 5,341 Health care equipement & services 4,740 Other industries 31,341
SOURCE: THE 2016 EU INDUSTRIAL R&D INVESTMENT SCOREBOARD, EUROPEAN COMMISSION

THE AUTOMOBILE INDUSTRY POCKET GUIDE 2017 / 2018
70
WWW.ACEA.BE
United Kingdom
China3
Rest of the world
Austria
Italy
Sweden
Germany
3%
2%
3%
1%
4%
3%
32%
France
Japan
United States
Other EPO member states2
11%
23%
11%
5%
Patents granted in the automotive sector 1 % SHARE / 2016
SOURCE: EUROPEAN PATENT OFFICE (EPO)
About 8,000 patents are granted to the automotive sector per year
1. Includes categories B60, B62, F02 and F16 B60: Vehicles in general B62: Land vehicles for travelling otherwise than on rail F02: Combustion engines; hot-gas or combustion-product engine plants F16: Engineering elements or units; general measures for producing and maintaining effective functioning of machines or installations; thermal insulation in general 2. Includes Liechtenstein, Monaco, Turkey and the other EU+EFTA countries3. Includes Taipei
Automotive patents BY COUNTRY / 2016
Germany 2,587 France 858 Italy 333 Sweden 264 United Kingdom 214 Switzerland 135 Austria 103 other EPO member states 2 376 Japan 1,854 United States 888 China3 127 Rest of the world 215
Total 7,954
SOURCE: EUROPEAN PATENT OFFICE (EPO)
Switzerland2%
THE AUTOMOBILE INDUSTRYPOCKET GUIDE 2017 / 2018
WWW.ACEA.BE
8
Taxation

WWW.ACEA.BE
73
TAXATION
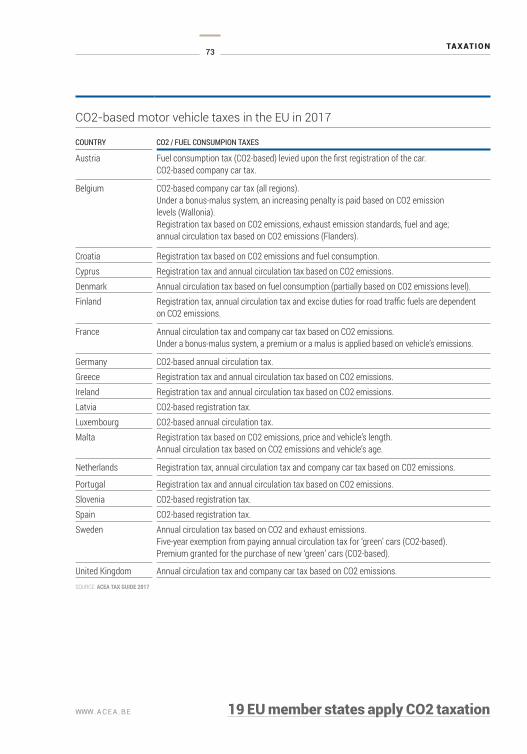
WWW.ACEA.BE 19 EU member states apply CO2 taxation
CO2-based motor vehicle taxes in the EU in 2017 COUNTRY CO2 / FUEL CONSUMPION TAXES
Austria Fuel consumption tax (CO2-based) levied upon the first registration of the car. CO2-based company car tax.
Belgium CO2-based company car tax (all regions).Under a bonus-malus system, an increasing penalty is paid based on CO2 emissionlevels (Wallonia). Registration tax based on CO2 emissions, exhaust emission standards, fuel and age; annual circulation tax based on CO2 emissions (Flanders).
Croatia Registration tax based on CO2 emissions and fuel consumption.Cyprus Registration tax and annual circulation tax based on CO2 emissions.Denmark Annual circulation tax based on fuel consumption (partially based on CO2 emissions level).Finland Registration tax, annual circulation tax and excise duties for road traffic fuels are dependent
on CO2 emissions.
France Annual circulation tax and company car tax based on CO2 emissions. Under a bonus-malus system, a premium or a malus is applied based on vehicle’s emissions.
Germany CO2-based annual circulation tax.Greece Registration tax and annual circulation tax based on CO2 emissions.Ireland Registration tax and annual circulation tax based on CO2 emissions.Latvia CO2-based registration tax.Luxembourg CO2-based annual circulation tax.Malta Registration tax based on CO2 emissions, price and vehicle’s length.
Annual circulation tax based on CO2 emissions and vehicle’s age.
Netherlands Registration tax, annual circulation tax and company car tax based on CO2 emissions.
Portugal Registration tax and annual circulation tax based on CO2 emissions.Slovenia CO2-based registration tax.Spain CO2-based registration tax.Sweden Annual circulation tax based on CO2 and exhaust emissions.
Five-year exemption from paying annual circulation tax for ‘green’ cars (CO2-based). Premium granted for the purchase of new ‘green’ cars (CO2-based).
United Kingdom Annual circulation tax and company car tax based on CO2 emissions.SOURCE: ACEA TAX GUIDE 2017
THE AUTOMOBILE INDUSTRY POCKET GUIDE 2017 / 2018
74
WWW.ACEA.BE
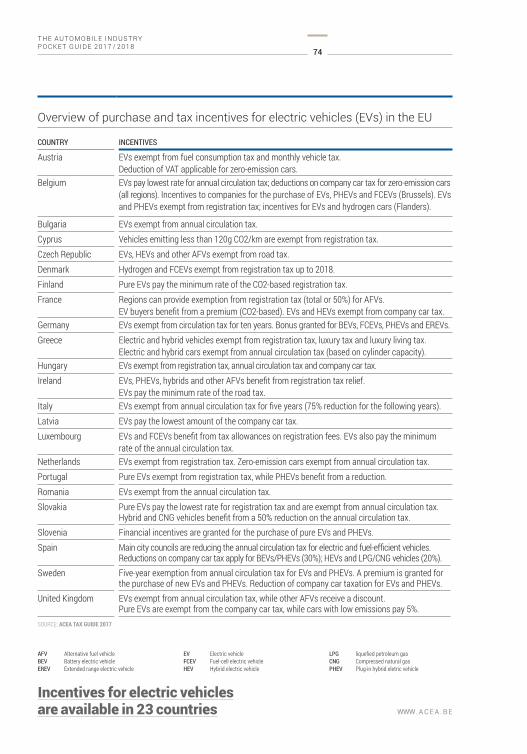
Overview of purchase and tax incentives for electric vehicles (EVs) in the EU COUNTRY INCENTIVES
Austria EVs exempt from fuel consumption tax and monthly vehicle tax.Deduction of VAT applicable for zero-emission cars.
Belgium EVs pay lowest rate for annual circulation tax; deductions on company car tax for zero-emission cars (all regions). Incentives to companies for the purchase of EVs, PHEVs and FCEVs (Brussels). EVs and PHEVs exempt from registration tax; incentives for EVs and hydrogen cars (Flanders).
Bulgaria EVs exempt from annual circulation tax.Cyprus Vehicles emitting less than 120g CO2/km are exempt from registration tax.Czech Republic EVs, HEVs and other AFVs exempt from road tax.Denmark Hydrogen and FCEVs exempt from registration tax up to 2018.Finland Pure EVs pay the minimum rate of the CO2-based registration tax.France Regions can provide exemption from registration tax (total or 50%) for AFVs.
EV buyers benefit from a premium (CO2-based). EVs and HEVs exempt from company car tax. Germany EVs exempt from circulation tax for ten years. Bonus granted for BEVs, FCEVs, PHEVs and EREVs.Greece Electric and hybrid vehicles exempt from registration tax, luxury tax and luxury living tax.
Electric and hybrid cars exempt from annual circulation tax (based on cylinder capacity). Hungary EVs exempt from registration tax, annual circulation tax and company car tax.Ireland EVs, PHEVs, hybrids and other AFVs benefit from registration tax relief.
EVs pay the minimum rate of the road tax.Italy EVs exempt from annual circulation tax for five years (75% reduction for the following years).Latvia EVs pay the lowest amount of the company car tax.Luxembourg EVs and FCEVs benefit from tax allowances on registration fees. EVs also pay the minimum
rate of the annual circulation tax.Netherlands EVs exempt from registration tax. Zero-emission cars exempt from annual circulation tax.Portugal Pure EVs exempt from registration tax, while PHEVs benefit from a reduction.Romania EVs exempt from the annual circulation tax.Slovakia Pure EVs pay the lowest rate for registration tax and are exempt from annual circulation tax.
Hybrid and CNG vehicles benefit from a 50% reduction on the annual circulation tax.Slovenia Financial incentives are granted for the purchase of pure EVs and PHEVs.Spain Main city councils are reducing the annual circulation tax for electric and fuel-efficient vehicles.
Reductions on company car tax apply for BEVs/PHEVs (30%); HEVs and LPG/CNG vehicles (20%).Sweden Five-year exemption from annual circulation tax for EVs and PHEVs. A premium is granted for
the purchase of new EVs and PHEVs. Reduction of company car taxation for EVs and PHEVs.United Kingdom EVs exempt from annual circulation tax, while other AFVs receive a discount.
Pure EVs are exempt from the company car tax, while cars with low emissions pay 5%.SOURCE: ACEA TAX GUIDE 2017
AFV Alternative fuel vehicle BEV Battery electric vehicleEREV Extended range electric vehicle
EV Electric vehicleFCEV Fuel-cell electric vehicleHEV Hybrid electric vehicle
LPG liquefied petroleum gasCNG Compressed natural gasPHEV Plug-in hybrid eletric vehicle
Incentives for electric vehiclesare available in 23 countries
75
TAXATION
WWW.ACEA.BE
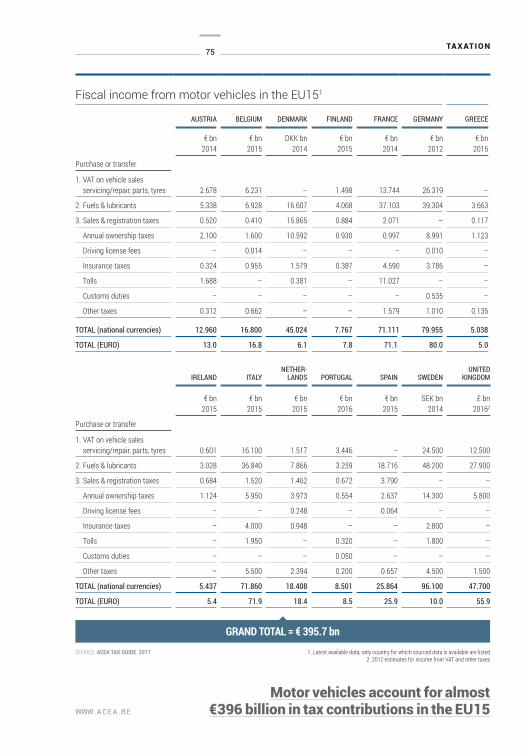
Fiscal income from motor vehicles in the EU151
AUSTRIA BELGIUM DENMARK FINLAND FRANCE GERMANY GREECE
€ bn2014
€ bn2015
DKK bn2014
€ bn2015
€ bn2014
€ bn2012
€ bn2015
Purchase or transfer
1. VAT on vehicle sales servicing/repair, parts, tyres 2.678 6.231 – 1.498 13.744 26.319 –
2. Fuels & lubricants 5.338 6.928 16.607 4.068 37.103 39.304 3.663
3. Sales & registration taxes 0.520 0.410 15.865 0.884 2.071 – 0.117
Annual ownership taxes 2.100 1.600 10.592 0.930 0.997 8.991 1.123
Driving license fees – 0.014 – – – 0.010 –
Insurance taxes 0.324 0.955 1.579 0.387 4.590 3.786 –
Tolls 1.688 – 0.381 – 11.027 – –
Customs duties – – – – – 0.535 –
Other taxes 0.312 0.662 – – 1.579 1.010 0.135
TOTAL (national currencies) 12.960 16.800 45.024 7.767 71.111 79.955 5.038
TOTAL (EURO) 13.0 16.8 6.1 7.8 71.1 80.0 5.0
IRELAND ITALYNETHER-
LANDS PORTUGAL SPAIN SWEDENUNITED
KINGDOM
€ bn2015
€ bn2015
€ bn2015
€ bn2016
€ bn2015
SEK bn2014
£ bn20162
Purchase or transfer
1. VAT on vehicle sales servicing/repair, parts, tyres 0.601 16.100 1.517 3.446 – 24.500 12.500
2. Fuels & lubricants 3.028 36.840 7.866 3.259 18.716 48.200 27.900
3. Sales & registration taxes 0.684 1.520 1.462 0.672 3.790 – –
Annual ownership taxes 1.124 5.950 3.973 0.554 2.637 14.300 5.800
Driving license fees – – 0.248 – 0.064 – –
Insurance taxes – 4.000 0.948 – – 2.800 –
Tolls – 1.950 – 0.320 – 1.800 –
Customs duties – – – 0.050 – – –
Other taxes – 5.500 2.394 0.200 0.657 4.500 1.500
TOTAL (national currencies) 5.437 71.860 18.408 8.501 25.864 96.100 47.700
TOTAL (EURO) 5.4 71.9 18.4 8.5 25.9 10.0 55.9
Motor vehicles account for almost€396 billion in tax contributions in the EU15
SOURCE: ACEA TAX GUIDE 2017 1. Latest available data; only country for which sourced data is available are listed 2. 2012 estimates for income from VAT and other taxes
GRAND TOTAL = € 395.7 bn
THE AUTOMOBILE INDUSTRY POCKET GUIDE 2017 / 2018
76
WWW.ACEA.BE
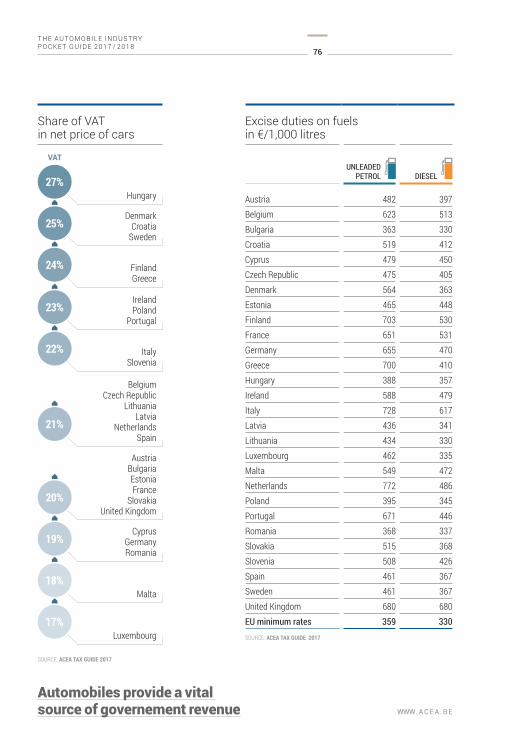
Excise duties on fuelsin €/1,000 litres
UNLEADED PETROL DIESEL
Austria 482 397Belgium 623 513Bulgaria 363 330Croatia 519 412Cyprus 479 450Czech Republic 475 405Denmark 564 363Estonia 465 448Finland 703 530France 651 531Germany 655 470Greece 700 410Hungary 388 357Ireland 588 479Italy 728 617Latvia 436 341Lithuania 434 330Luxembourg 462 335Malta 549 472Netherlands 772 486Poland 395 345Portugal 671 446Romania 368 337Slovakia 515 368Slovenia 508 426Spain 461 367Sweden 461 367United Kingdom 680 680EU minimum rates 359 330SOURCE: ACEA TAX GUIDE 2017
Share of VAT in net price of cars
27%
25%
24%
23%
22%
21%
20%
19%
18%
17%
Hungary
DenmarkCroatia
Sweden
FinlandGreece
IrelandPoland
Portugal
ItalySlovenia
BelgiumCzech Republic
LithuaniaLatvia
NetherlandsSpain
AustriaBulgariaEstoniaFrance
SlovakiaUnited Kingdom
CyprusGermanyRomania
Malta
Luxembourg
SOURCE: ACEA TAX GUIDE 2017
Automobiles provide a vital source of governement revenue

Please order your personal copy via [email protected]
This paper is made in an environmentally-friendly way and according to FSC certification© ACEA M AY 2017