Embed Size (px)
Citation preview

R E P R I N T F R O M
Common Plate-Handling Methods May Result in Unexpected Volume ChangesBill Gigante, Tanya Knaide, and John Thomas Bradshaw, Ph.D.
Thanks to equipment advances made to meet the demands of high-through-put screening, the use of automation in modern drug discovery and research labs has become commonplace. How-ever, as sample density increases in screening novel drug candidates, hu-mans become more removed from the screening process and proper sample care can occasionally be overlooked.
One of the primary sources of ran-dom error can be attributed to envi-ronmental factors such as humidity and temperature within the laboratory. Sample plates are commonly unsealed or de-lidded and stacked within a car-ousel on a robotic platform or loaded onto the deck of a high-speed liquid-handling robot. In many cases, these plates are left exposed to the laboratory environment for hours at a time, and when this occurs, the last plate pro-cessed on a robotic platform is exposed to the environment much longer than the first plate.
Depending on the liquid matrix of the sample and the environmental con-ditions, liquid samples can decrease in volume through evaporation or increase in volume through absorption of atmo-spheric water. Such volume changes can affect the results of an experiment by changing the concentration of the drug candidate in an unexpected fash-
ion. If absorption and/or evaporation is studied and understood, a scientist can take necessary precautions to reduce volume and concentration errors due to the laboratory environment.
Volume Measurement Technology
A quick and easy way to understand the severity of absorption and evapo-ration in plates is to monitor small volume changes over the course of a normal day using the VMS™ (Volume Measurement System) from Artel. The VMS quickly reports individual vol-umes of sample in each well of 96- or 384-well plates. Based on the ideal gas law, this technology measures the pres-sure of a known volume of air injected into the sealed wells of a plate, and calculates the well volume occupied by liquid or solid samples.
Application of Technology
To demonstrate the VMS technol-ogy, an experiment was conducted to measure volume changes due to envi-ronmental effects, using two 384 well
plates (Greiner 781201). Plate 1 and Plate 2 were each filled with 50 µL of Dimethyl Sulfoxide (DMSO, Sigma Al-drich 276855) in columns 1–12 and 50 µL of tissue culture grade water (Sigma W3500) in columns 13–24 using a calibrated hand pipettor. The initial starting volumes of every well in each plate were measured by the VMS and recorded as Time Point 0. Both plates were then left on the lab bench and measured at the specified time intervals.
Plate 1 was left open to the environ-ment while Plate 2 was protected us-ing a plastic cover (VWR 28317-488). Every hour the volume in each well of each plate was measured using the VMS (Time Point 1 through Time Point 8). The cover on Plate 2 was only re-moved briefly each hour to take mea-surements. While the temperature and humidity of the laboratory were not controlled for this experiment, they were recorded for each time point.
Table 1 summarizes the results of the experiment. The volumes reported at each time point represent the aver-
Measuring Volume Changes in Screening PlatesDRUG DISCOVERY Tutorial
NOVEMBER 1, 2015Volume 35, Number 19
www.GENengnews.com
TOOLS TECHNOLOGIES TECHNIQUES
Table 1. Measured volume change
age volume change, which corresponds to the average amount of water either absorbed or evaporated from each well at a given time point compared to the starting volume. Positive values repre-sent a gain of volume while negative values represent a loss of volume. The starting volume of each well was ap-proximately 50 µL.
Measurable Effects
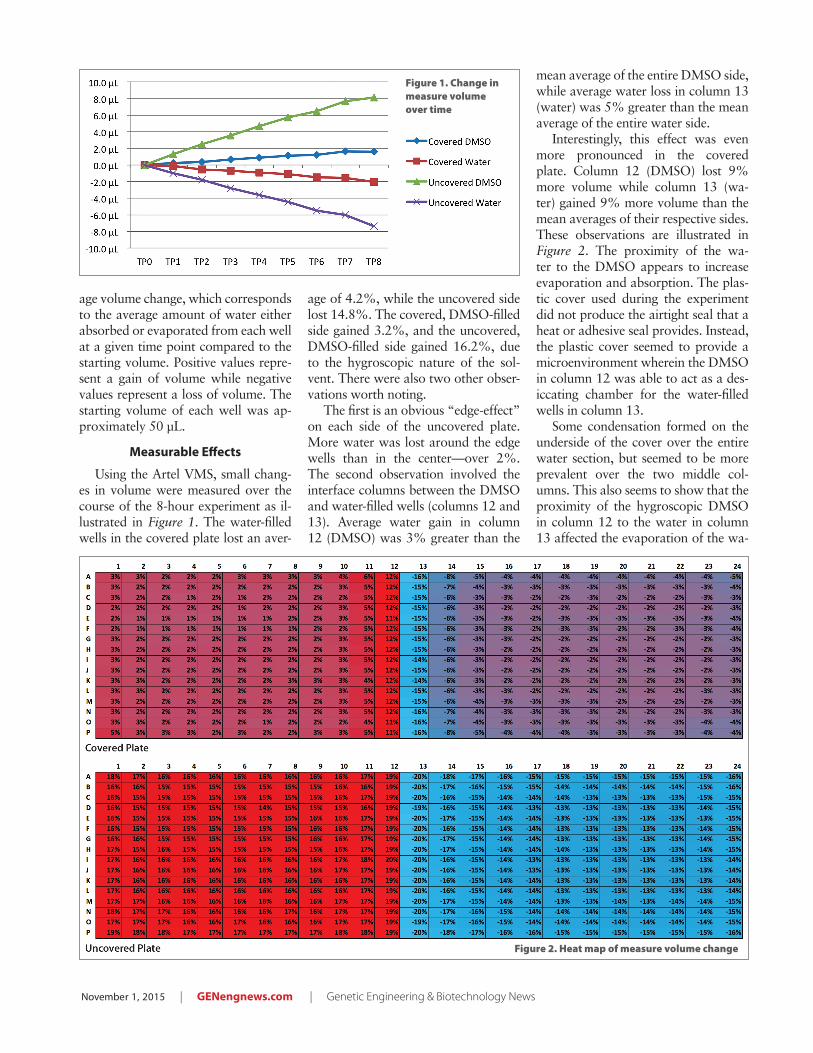
Using the Artel VMS, small chang-es in volume were measured over the course of the 8-hour experiment as il-lustrated in Figure 1. The water-filled wells in the covered plate lost an aver-
age of 4.2%, while the uncovered side lost 14.8%. The covered, DMSO-filled side gained 3.2%, and the uncovered, DMSO-filled side gained 16.2%, due to the hygroscopic nature of the sol-vent. There were also two other obser-vations worth noting.
The first is an obvious “edge-effect” on each side of the uncovered plate. More water was lost around the edge wells than in the center—over 2%. The second observation involved the interface columns between the DMSO and water-filled wells (columns 12 and 13). Average water gain in column 12 (DMSO) was 3% greater than the
mean average of the entire DMSO side, while average water loss in column 13 (water) was 5% greater than the mean average of the entire water side.
Interestingly, this effect was even more pronounced in the covered plate. Column 12 (DMSO) lost 9% more volume while column 13 (wa-ter) gained 9% more volume than the mean averages of their respective sides. These observations are illustrated in Figure 2. The proximity of the wa-ter to the DMSO appears to increase evaporation and absorption. The plas-tic cover used during the experiment did not produce the airtight seal that a heat or adhesive seal provides. Instead, the plastic cover seemed to provide a microenvironment wherein the DMSO in column 12 was able to act as a des-iccating chamber for the water-filled wells in column 13.
Some condensation formed on the underside of the cover over the entire water section, but seemed to be more prevalent over the two middle col-umns. This also seems to show that the proximity of the hygroscopic DMSO in column 12 to the water in column 13 affected the evaporation of the wa-
November 1, 2015 | GENengnews.com | Genetic Engineering & Biotechnology News
Figure 1. Change in measure volume over time
Figure 2. Heat map of measure volume change

ter. The evaporated water did not all end up being absorbed by the DMSO; some also condensed on the cover.
The Effect of Environment on Assay Results
The laboratory environment can be a significant source of error when dealing with volume sensitive samples. Unfortunately, it is likely that this fact is commonly overlooked. Evaporation in aqueous solutions due to dry condi-tions, or absorption in DMSO solutions due to humid conditions can both cause significant changes in sample concen-tration. Almost all assays performed within microplates are concentration-dependent, and microplate wells that have higher/lower volumes due to water uptake/loss will result in unknown com-pound concentrations. If you do not know the concentration of your com-
pound, you cannot draw an accurate conclusion about its activity or potency.
Assuming the laboratory conditions of the experiment reported herein, a starting aqueous solution of 10 mM would experience enough evaporation to result in a final concentration of over 12 mM by the end of the day if left open to the environment. Samples stored in solvents that are hygroscopic (such as DMSO) can also absorb mois-ture from the air, causing a decrease in the final concentration which can lead to poor results.
Controlling and monitoring the lab-oratory environment is one way to mit-igate these risks. For instance, a sample storage laboratory that maintains col-lections stored in DMSO should have a dry, stable environment. Plate covers, adhesive seals, and heat seals can also reduce environmental effects. Howev-
er, since these are not always feasible when using robotic systems, proper protocol design is essential. Even en-vironmental modifications such as an inert gas (Argon) blanket can be ex-tremely useful when plates need to be exposed for long periods of time. As shown by the experimental results, a lot can happen in 8 hours—especially if precautions are not taken to protect your samples. Understanding the rate of evaporation/absorption is key to developing a strategy for protecting sample integrity.
Genetic Engineering & Biotechnology News | GENengnews.com | November 1, 2015
Bill Gigante is product manager/ mechanical engineer at Stratec, and Tanya Knaide ([email protected]) is product manager and John Thomas Bradshaw, Ph.D., is senior development scientist at Artel. Website: www.artel.com.